-
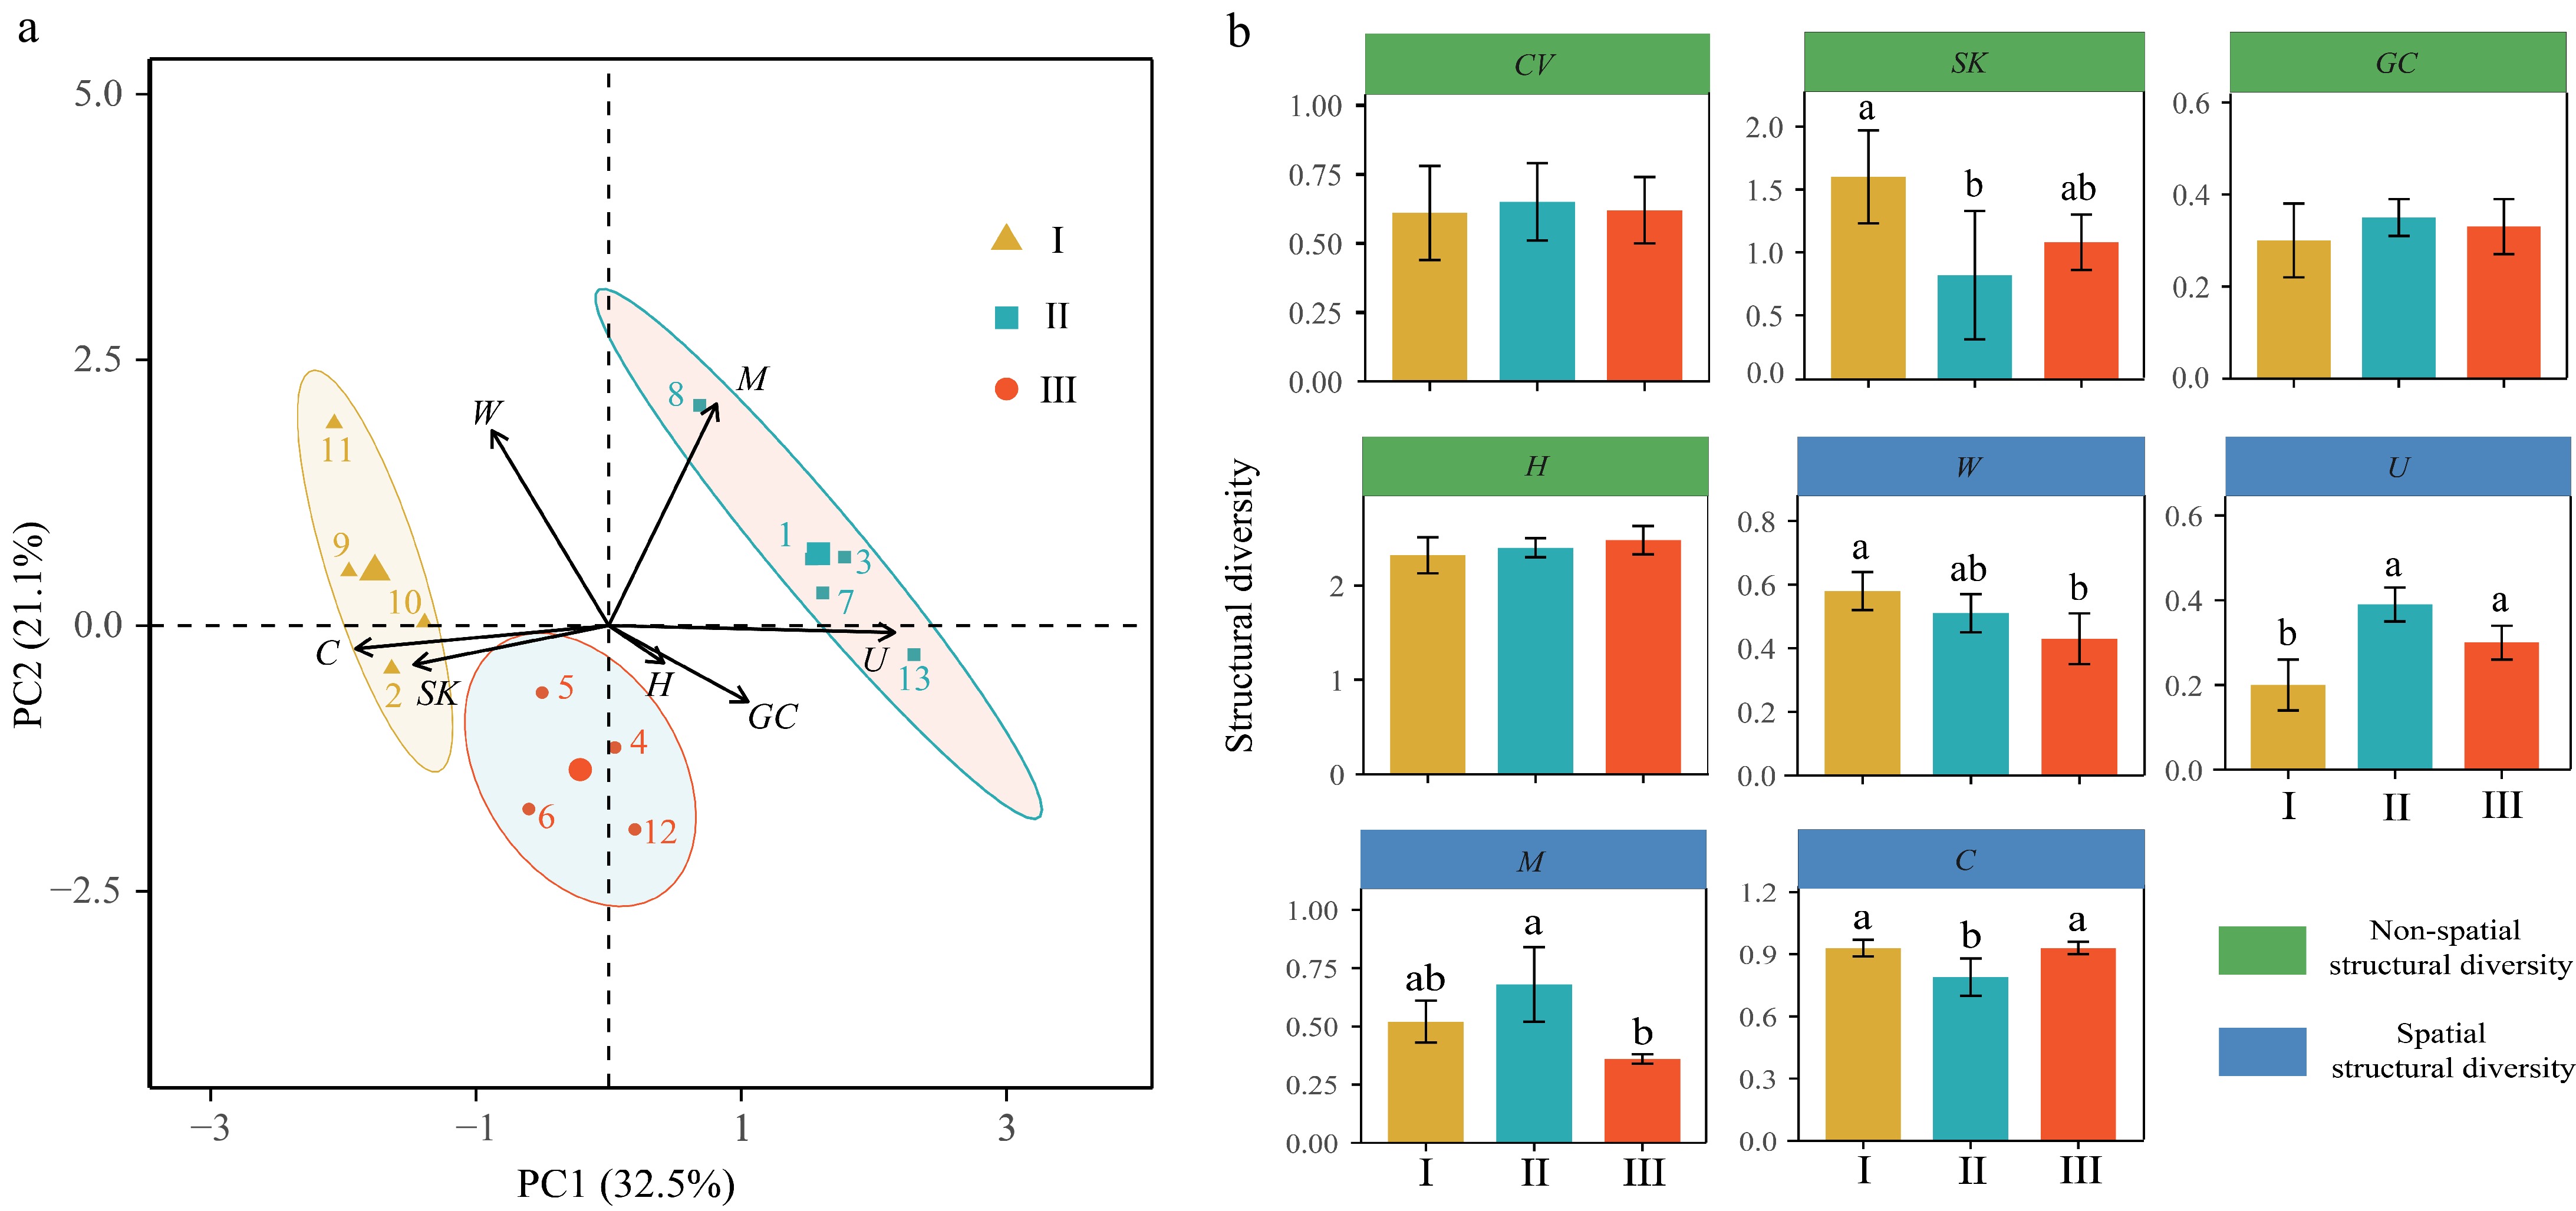
Figure 1.
PCA analysis results for (a) forest type classification, and (b) differences in spatial and non-spatial structural diversity among forest types.
-
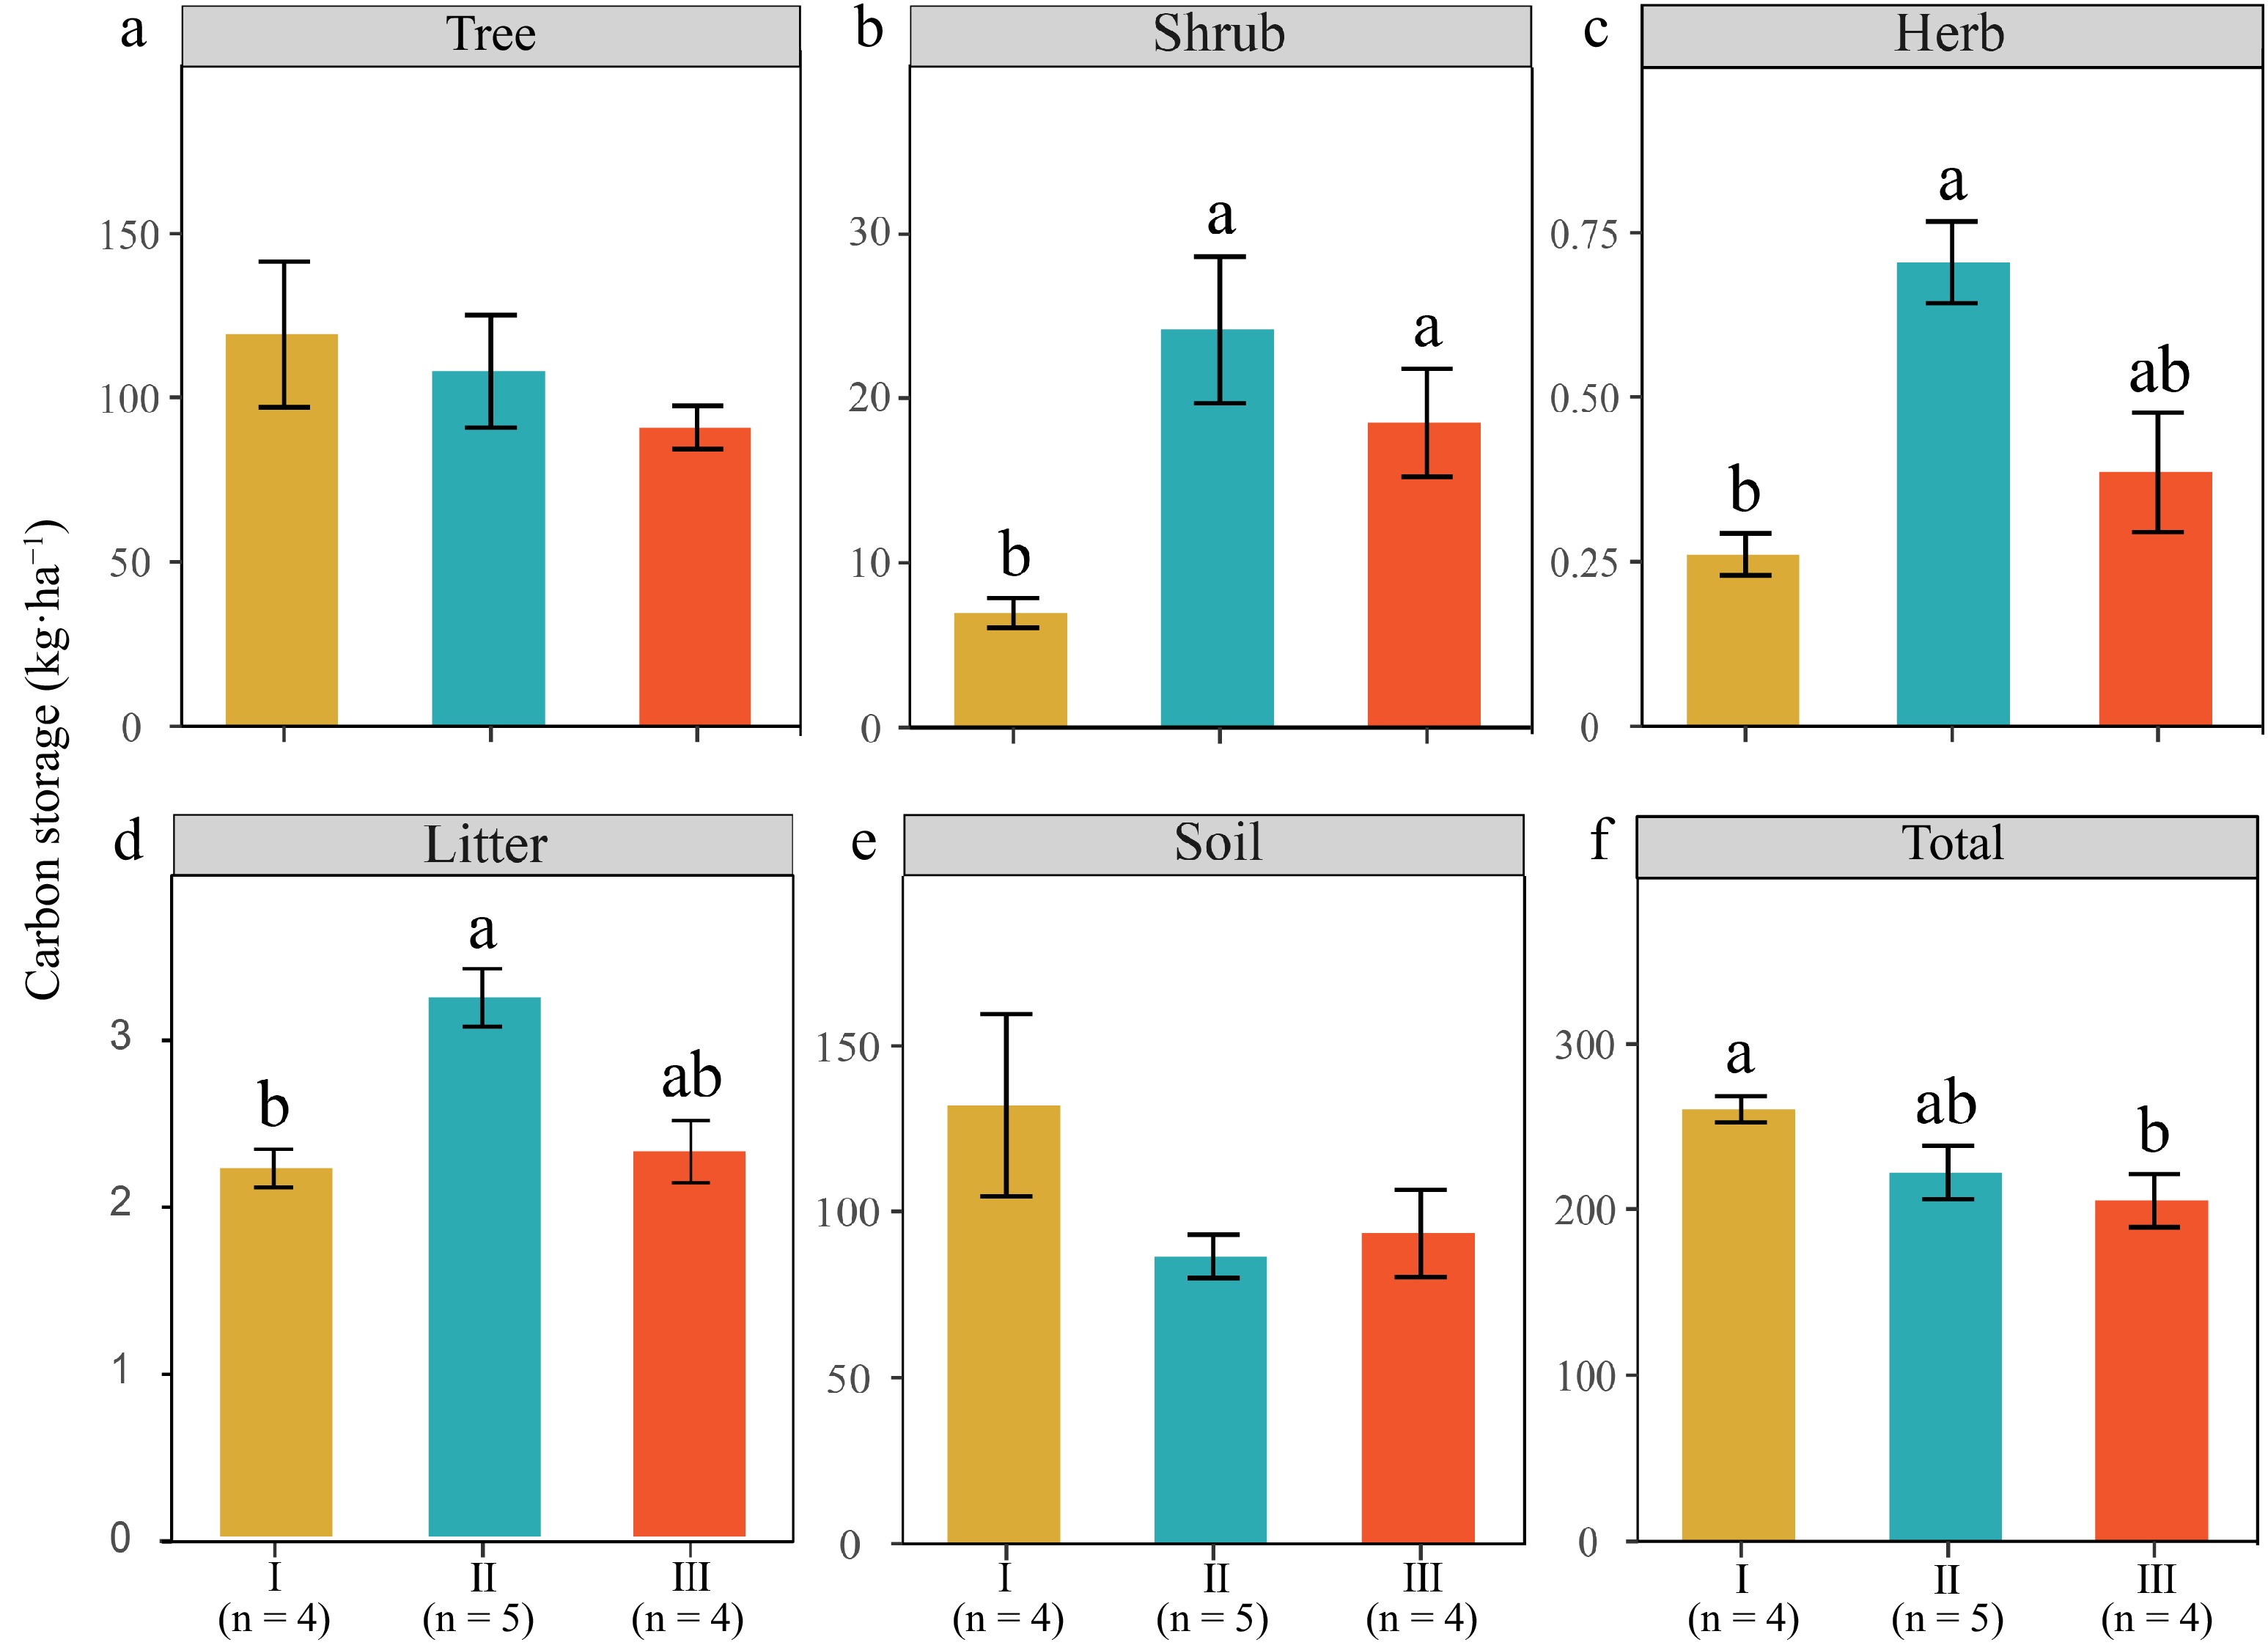
Figure 2.
Carbon storages of total and individual carbon pool components across various forest types. Values are presented as mean ± SE (standard error). Lower-case letters denote significant differences at p < 0.05. The number of plots for each type is indicated on the figure.
-
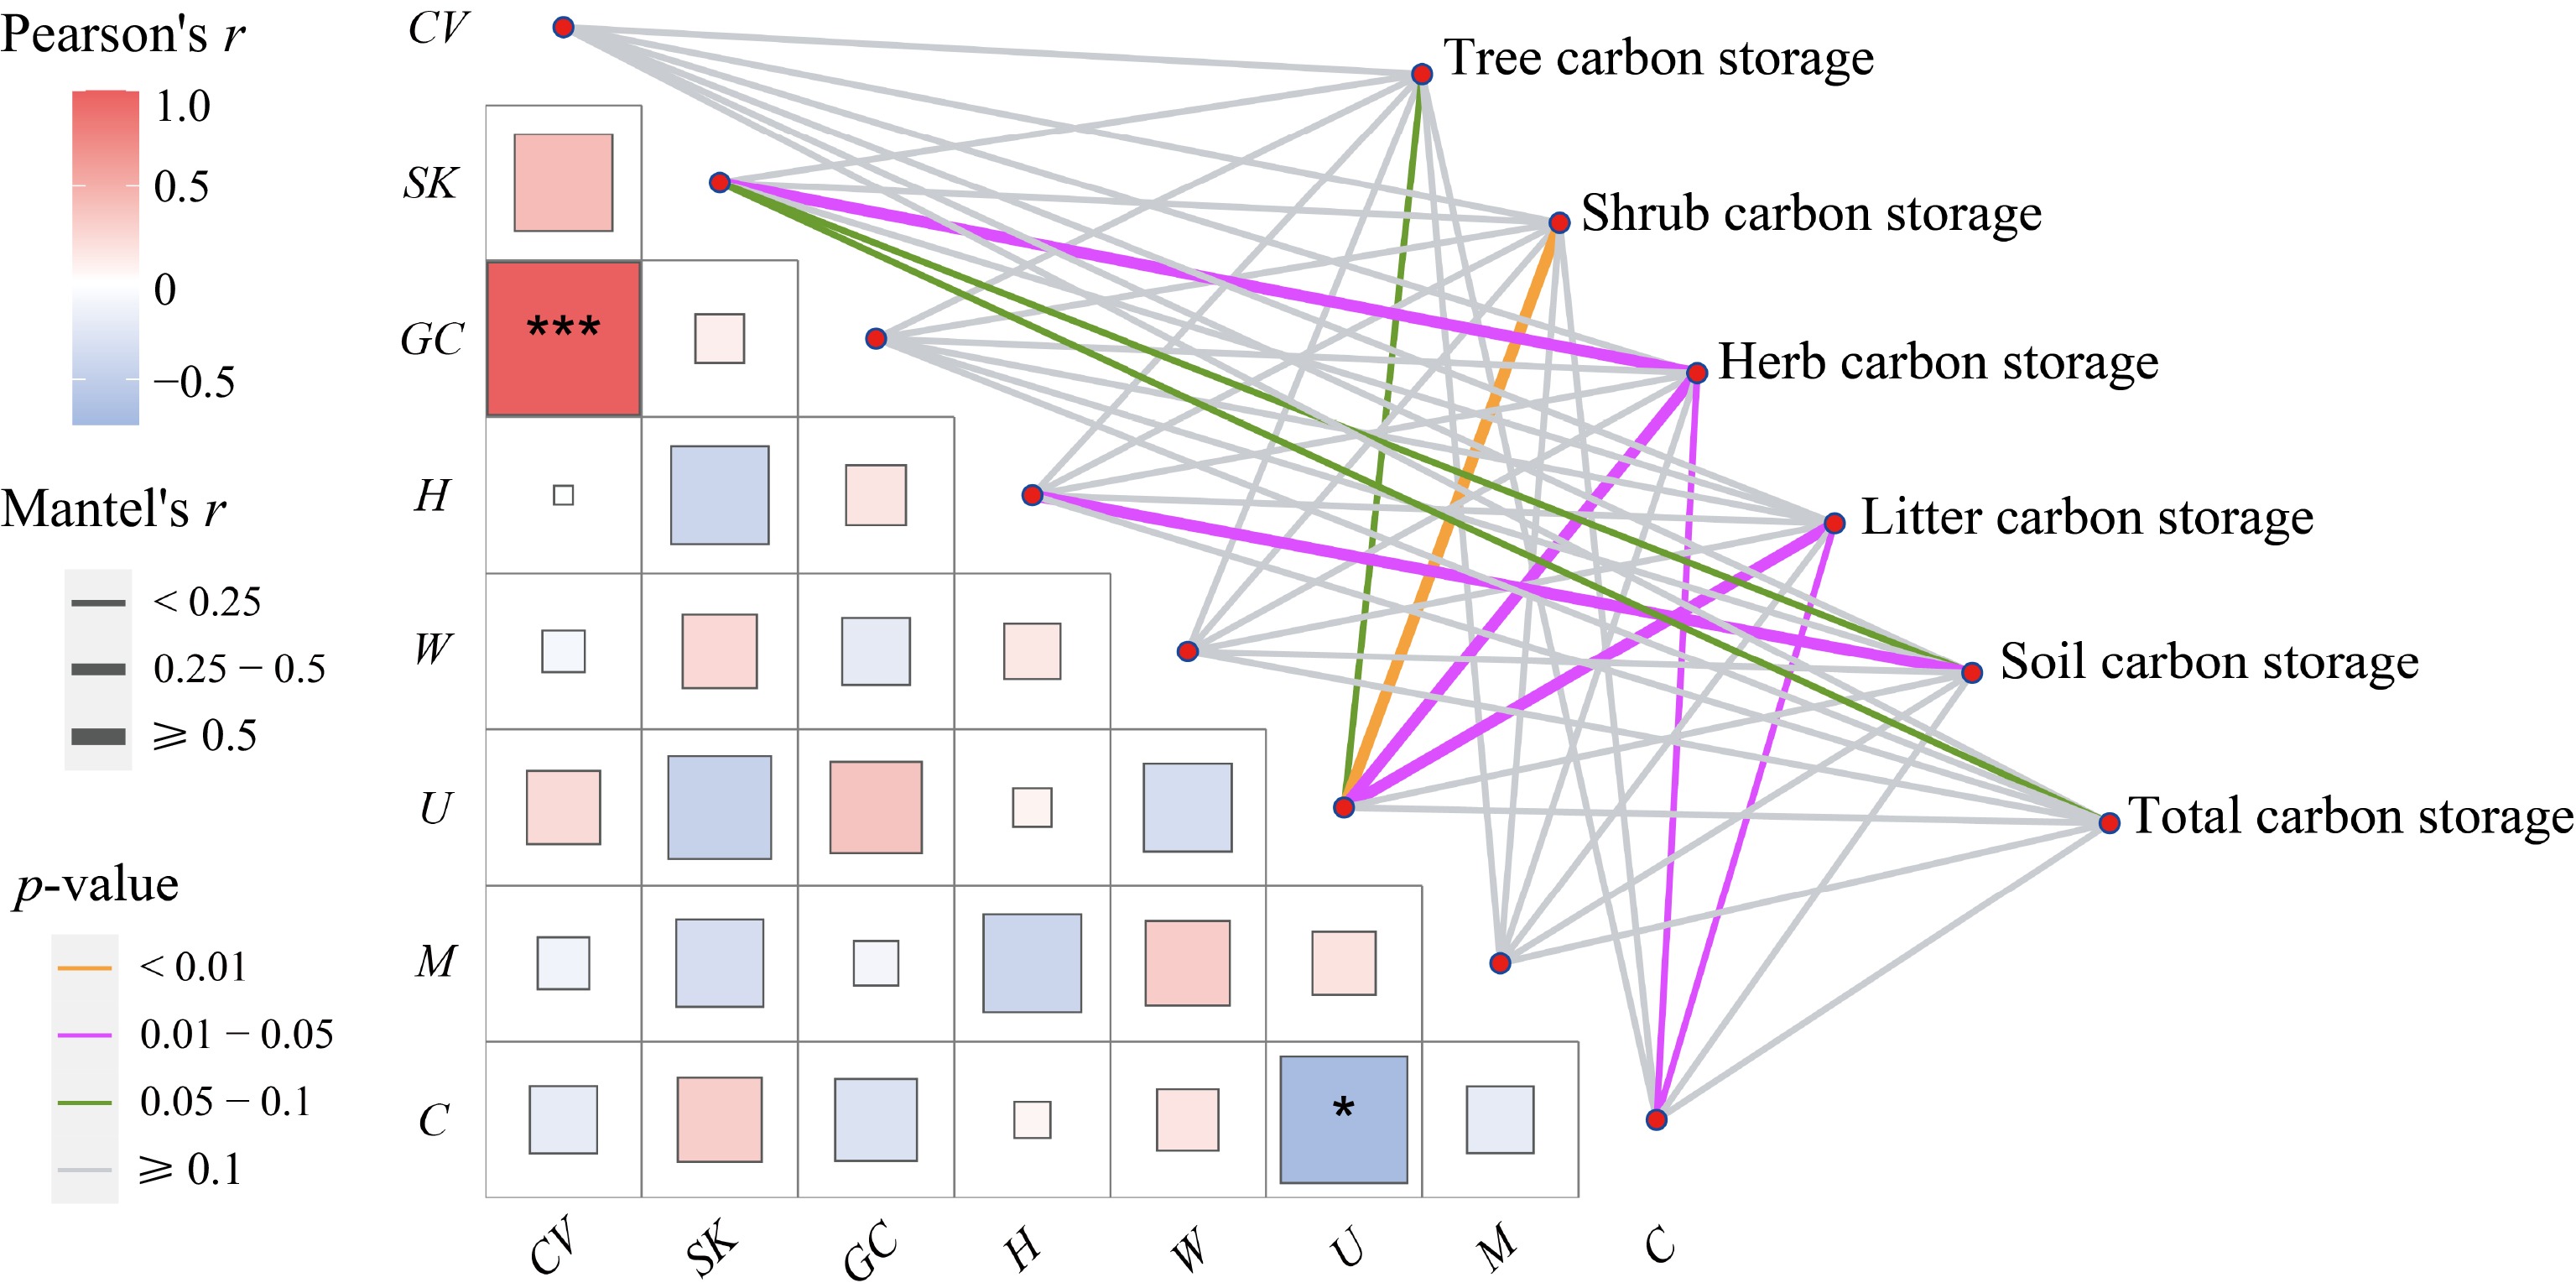
Figure 3.
Mantel test between structural diversity and ecosystem carbon pool components and the correlation between structural diversity pairwise. The lines denote significant relationships, while the line width represents Mantel's r statistic. Pair-wise correlations between influencing factors are shown in a color gradient matrix. The color represents Pearson's correlation coefficient, which is shown with an asterisk when the result is significant (p < 0.05), and *, *** indicate the significance level at p < 0.05, p < 0.001, respectively. The abbreviations of the influencing factors are explained in the Methods section.
-
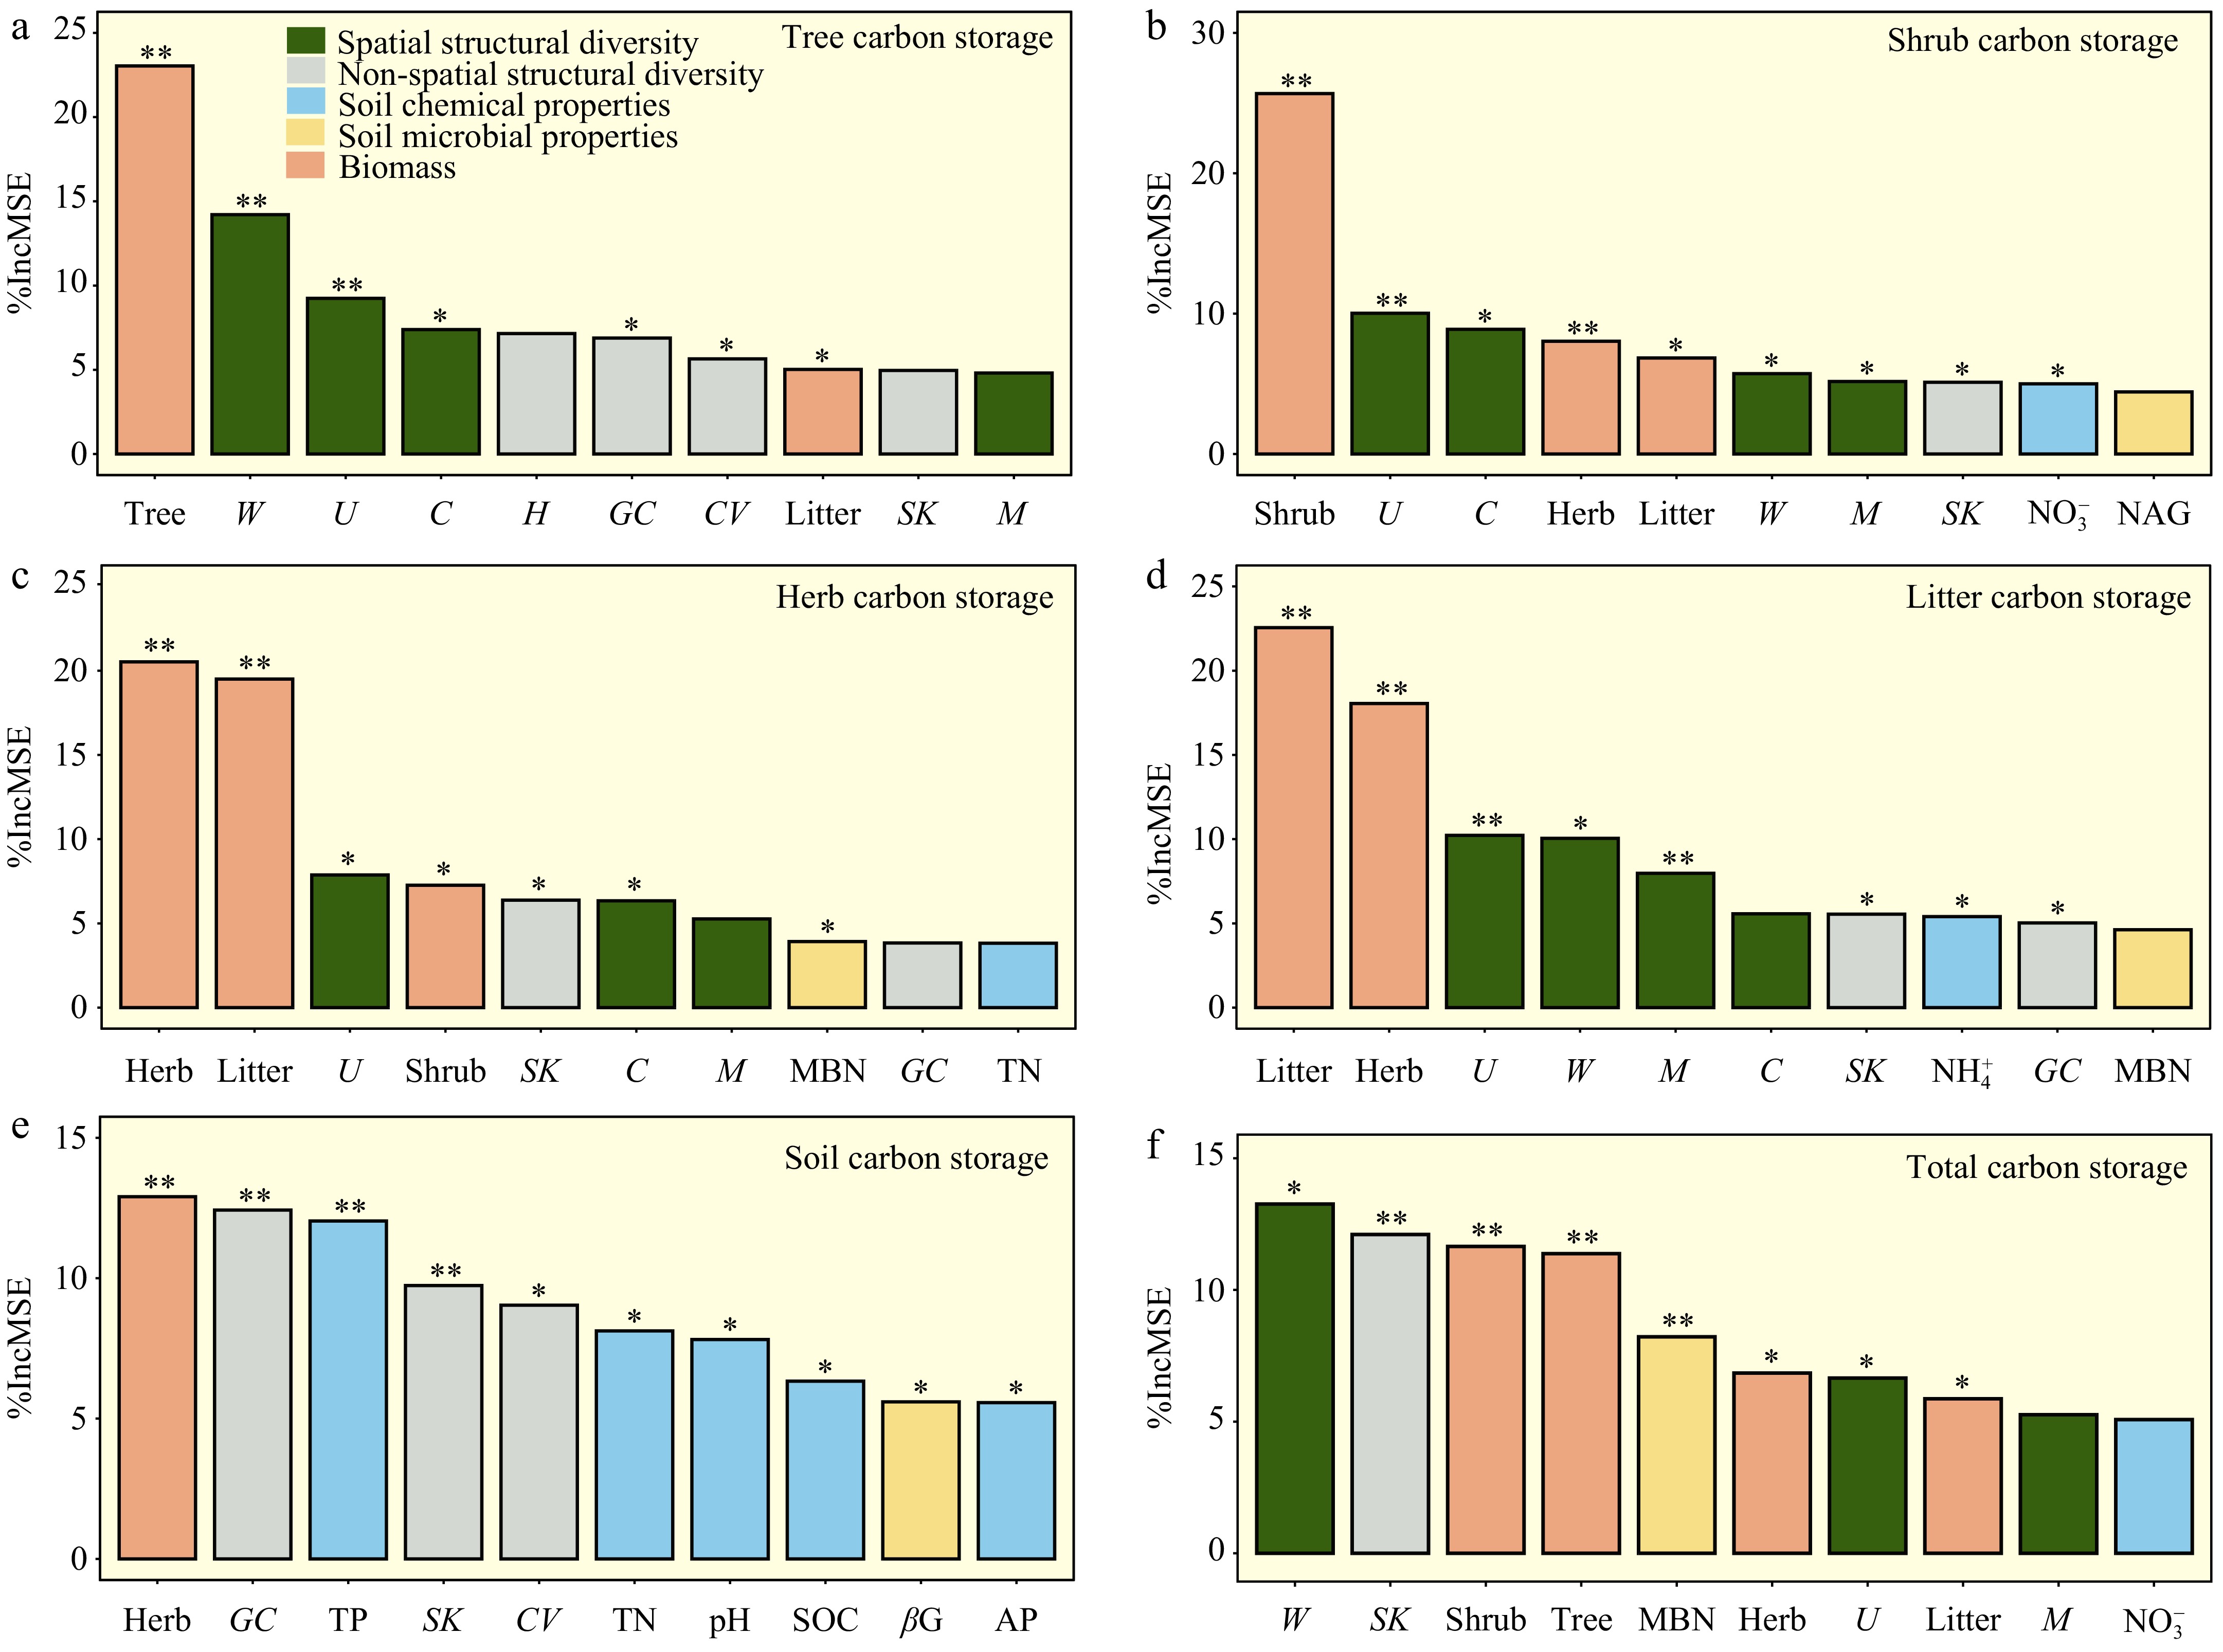
Figure 4.
Random Forest analysis identifying key predictors of carbon storage. The results focus on the top ten predictors that critically influence carbon storage in various components: (a) tree, (b) shrub, (c) herb, (d) litter, (e) soil, and (f) total carbon storage. Each panel quantifies the increase in mean squared error (% Increase in MSE) upon the exclusion of these key predictors, where higher values indicate a greater impact on model accuracy. Statistical significance is marked by asterisks, with * for p < 0.05, and ** for p < 0.01, underscoring the most influential predictors. The abbreviations of the influencing factors are explained in the Methods section.
-
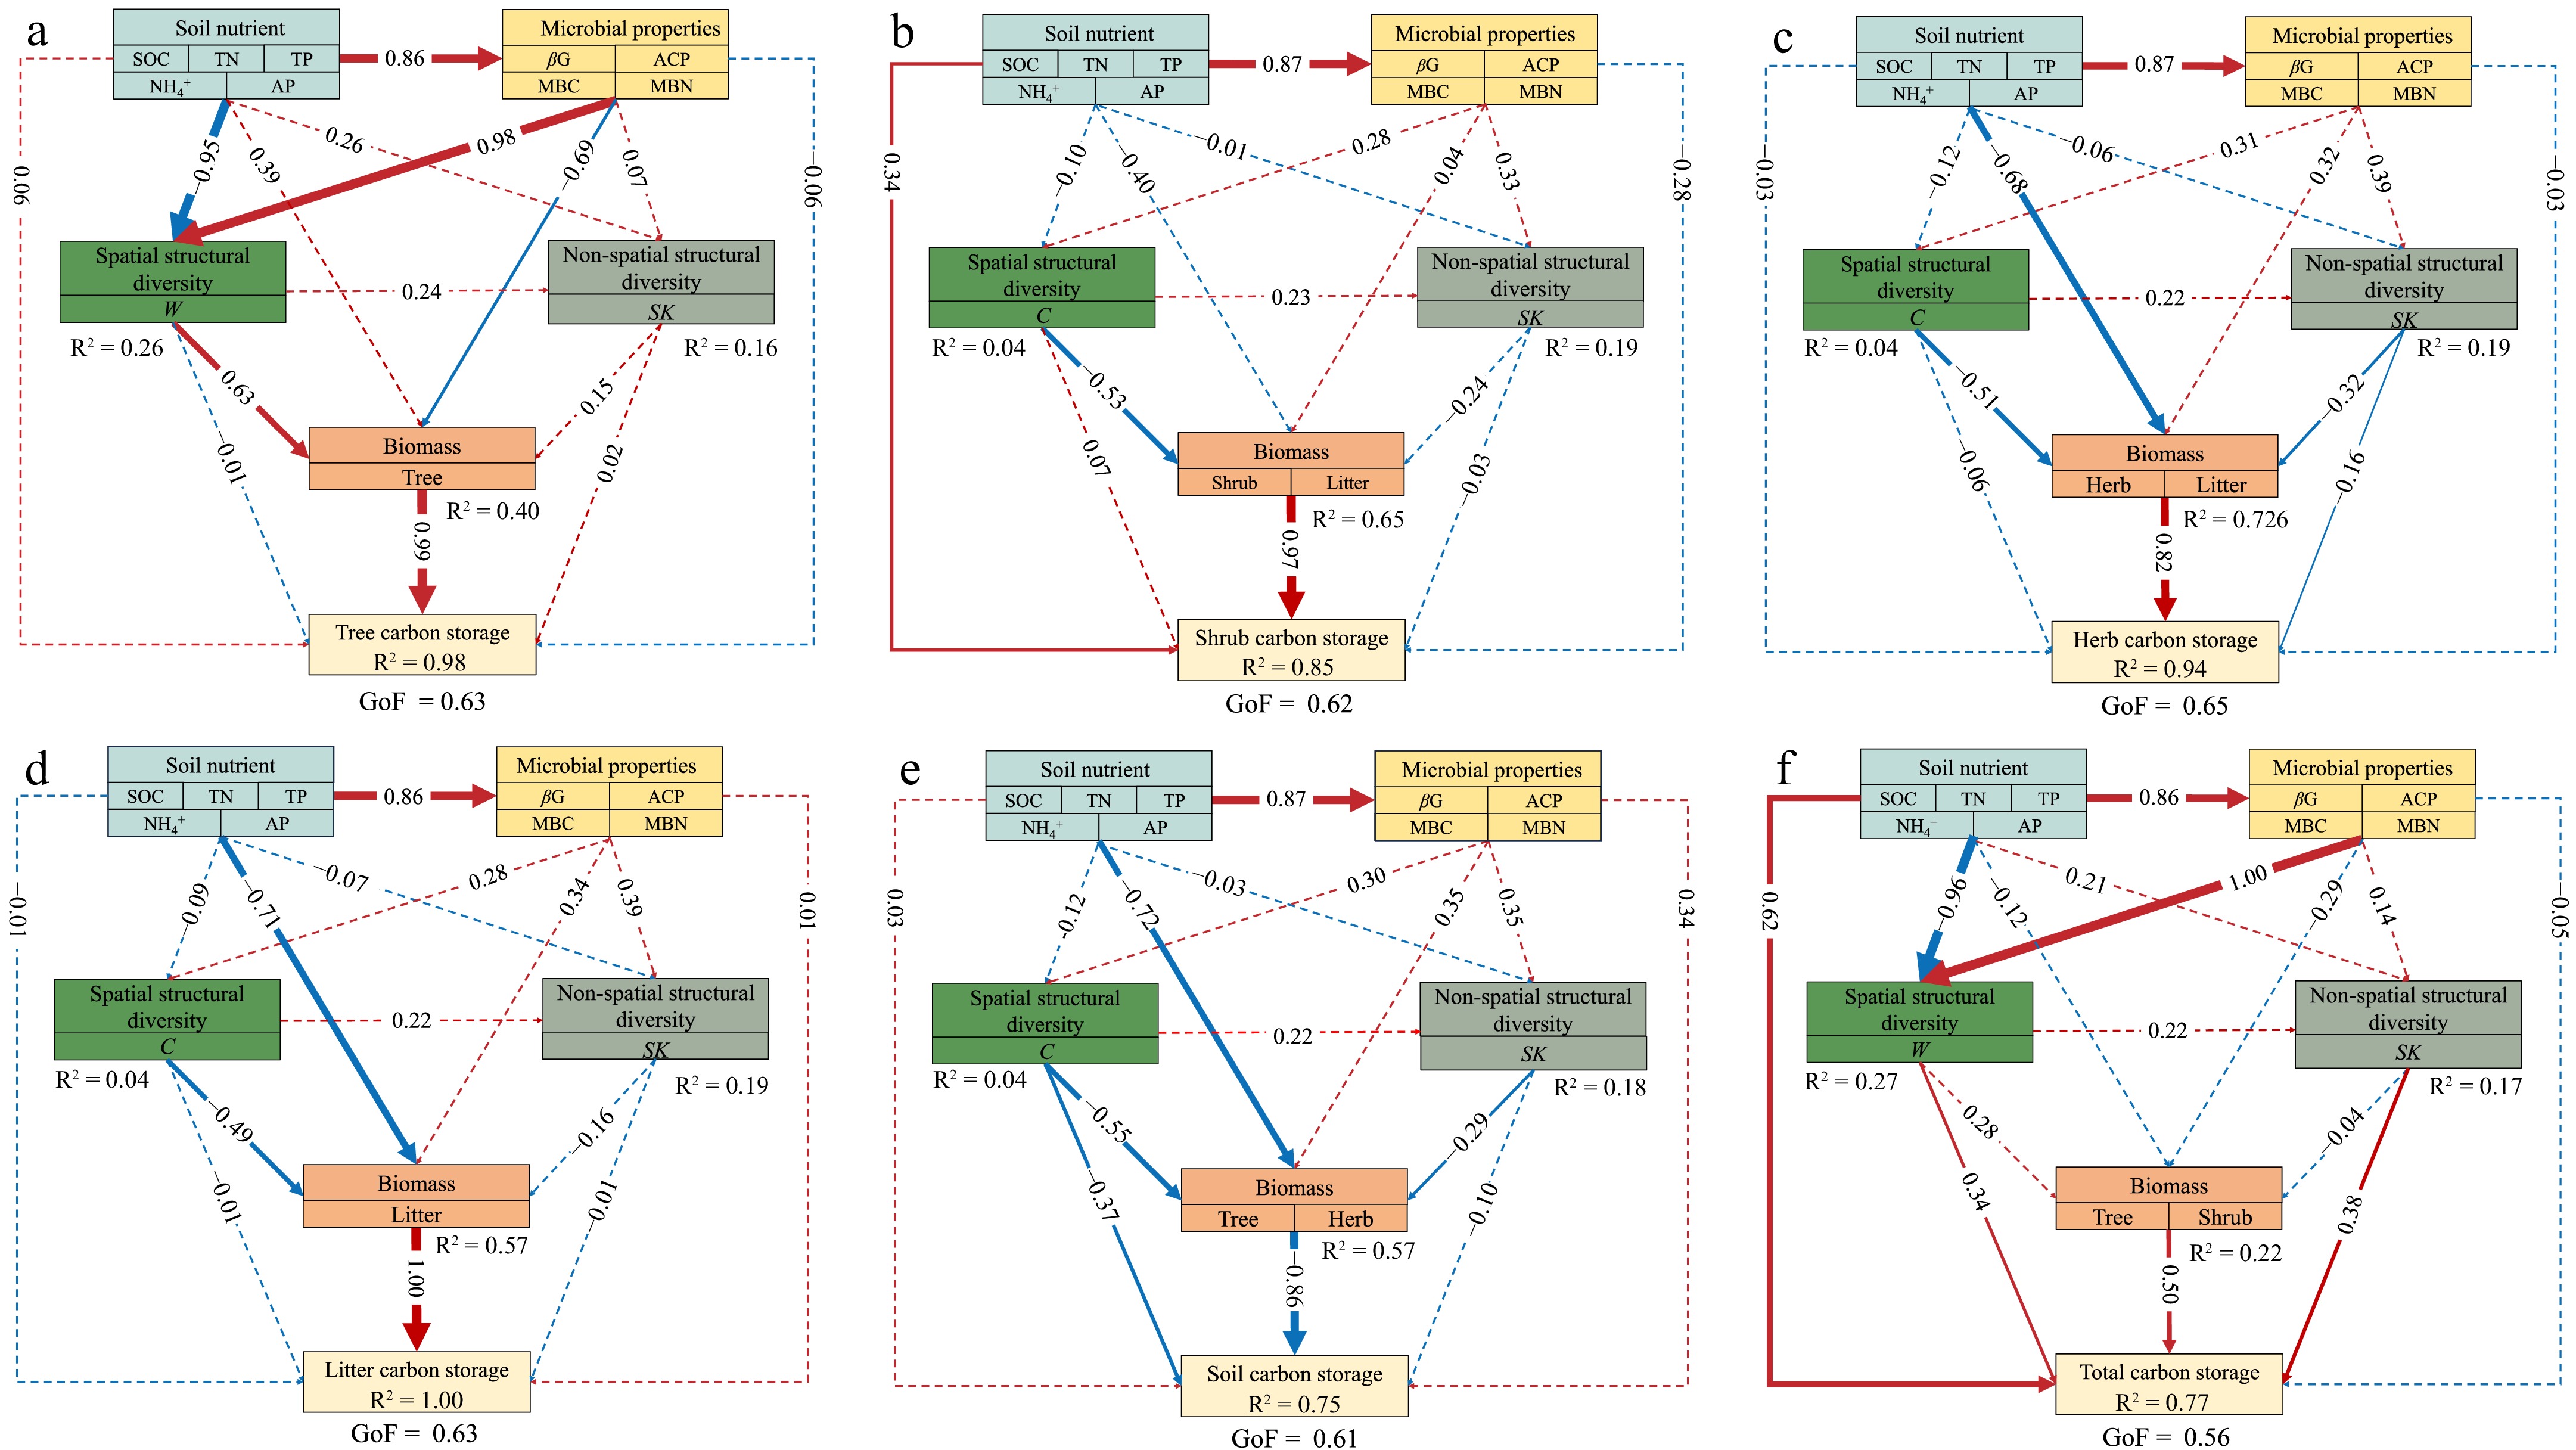
Figure 5.
Predicted partial least squares path modeling (PLS-PM) for the direct and indirect impacts of the influencing factors on carbon storage. The results are shown for carbon storage in various components: (a) tree, (b) shrub, (c) herb, (d) litter, (e) soil, and (f) total carbon storage. In the structural model, the lines indicate paths, and the values adjacent to the lines denote the magnitude of the path coefficients calculated by PLS regression. R2 values are shown for all endogenous latent variables in the ellipses. The figure shows the final models after model diagnostic processes. The pseudo goodness-of-fit (GoF) of the models were shown, ranging from 0.56 to 0.65, implying that the predicted models fit well. The abbreviations of the influencing factors are explained in the Methods section.
-
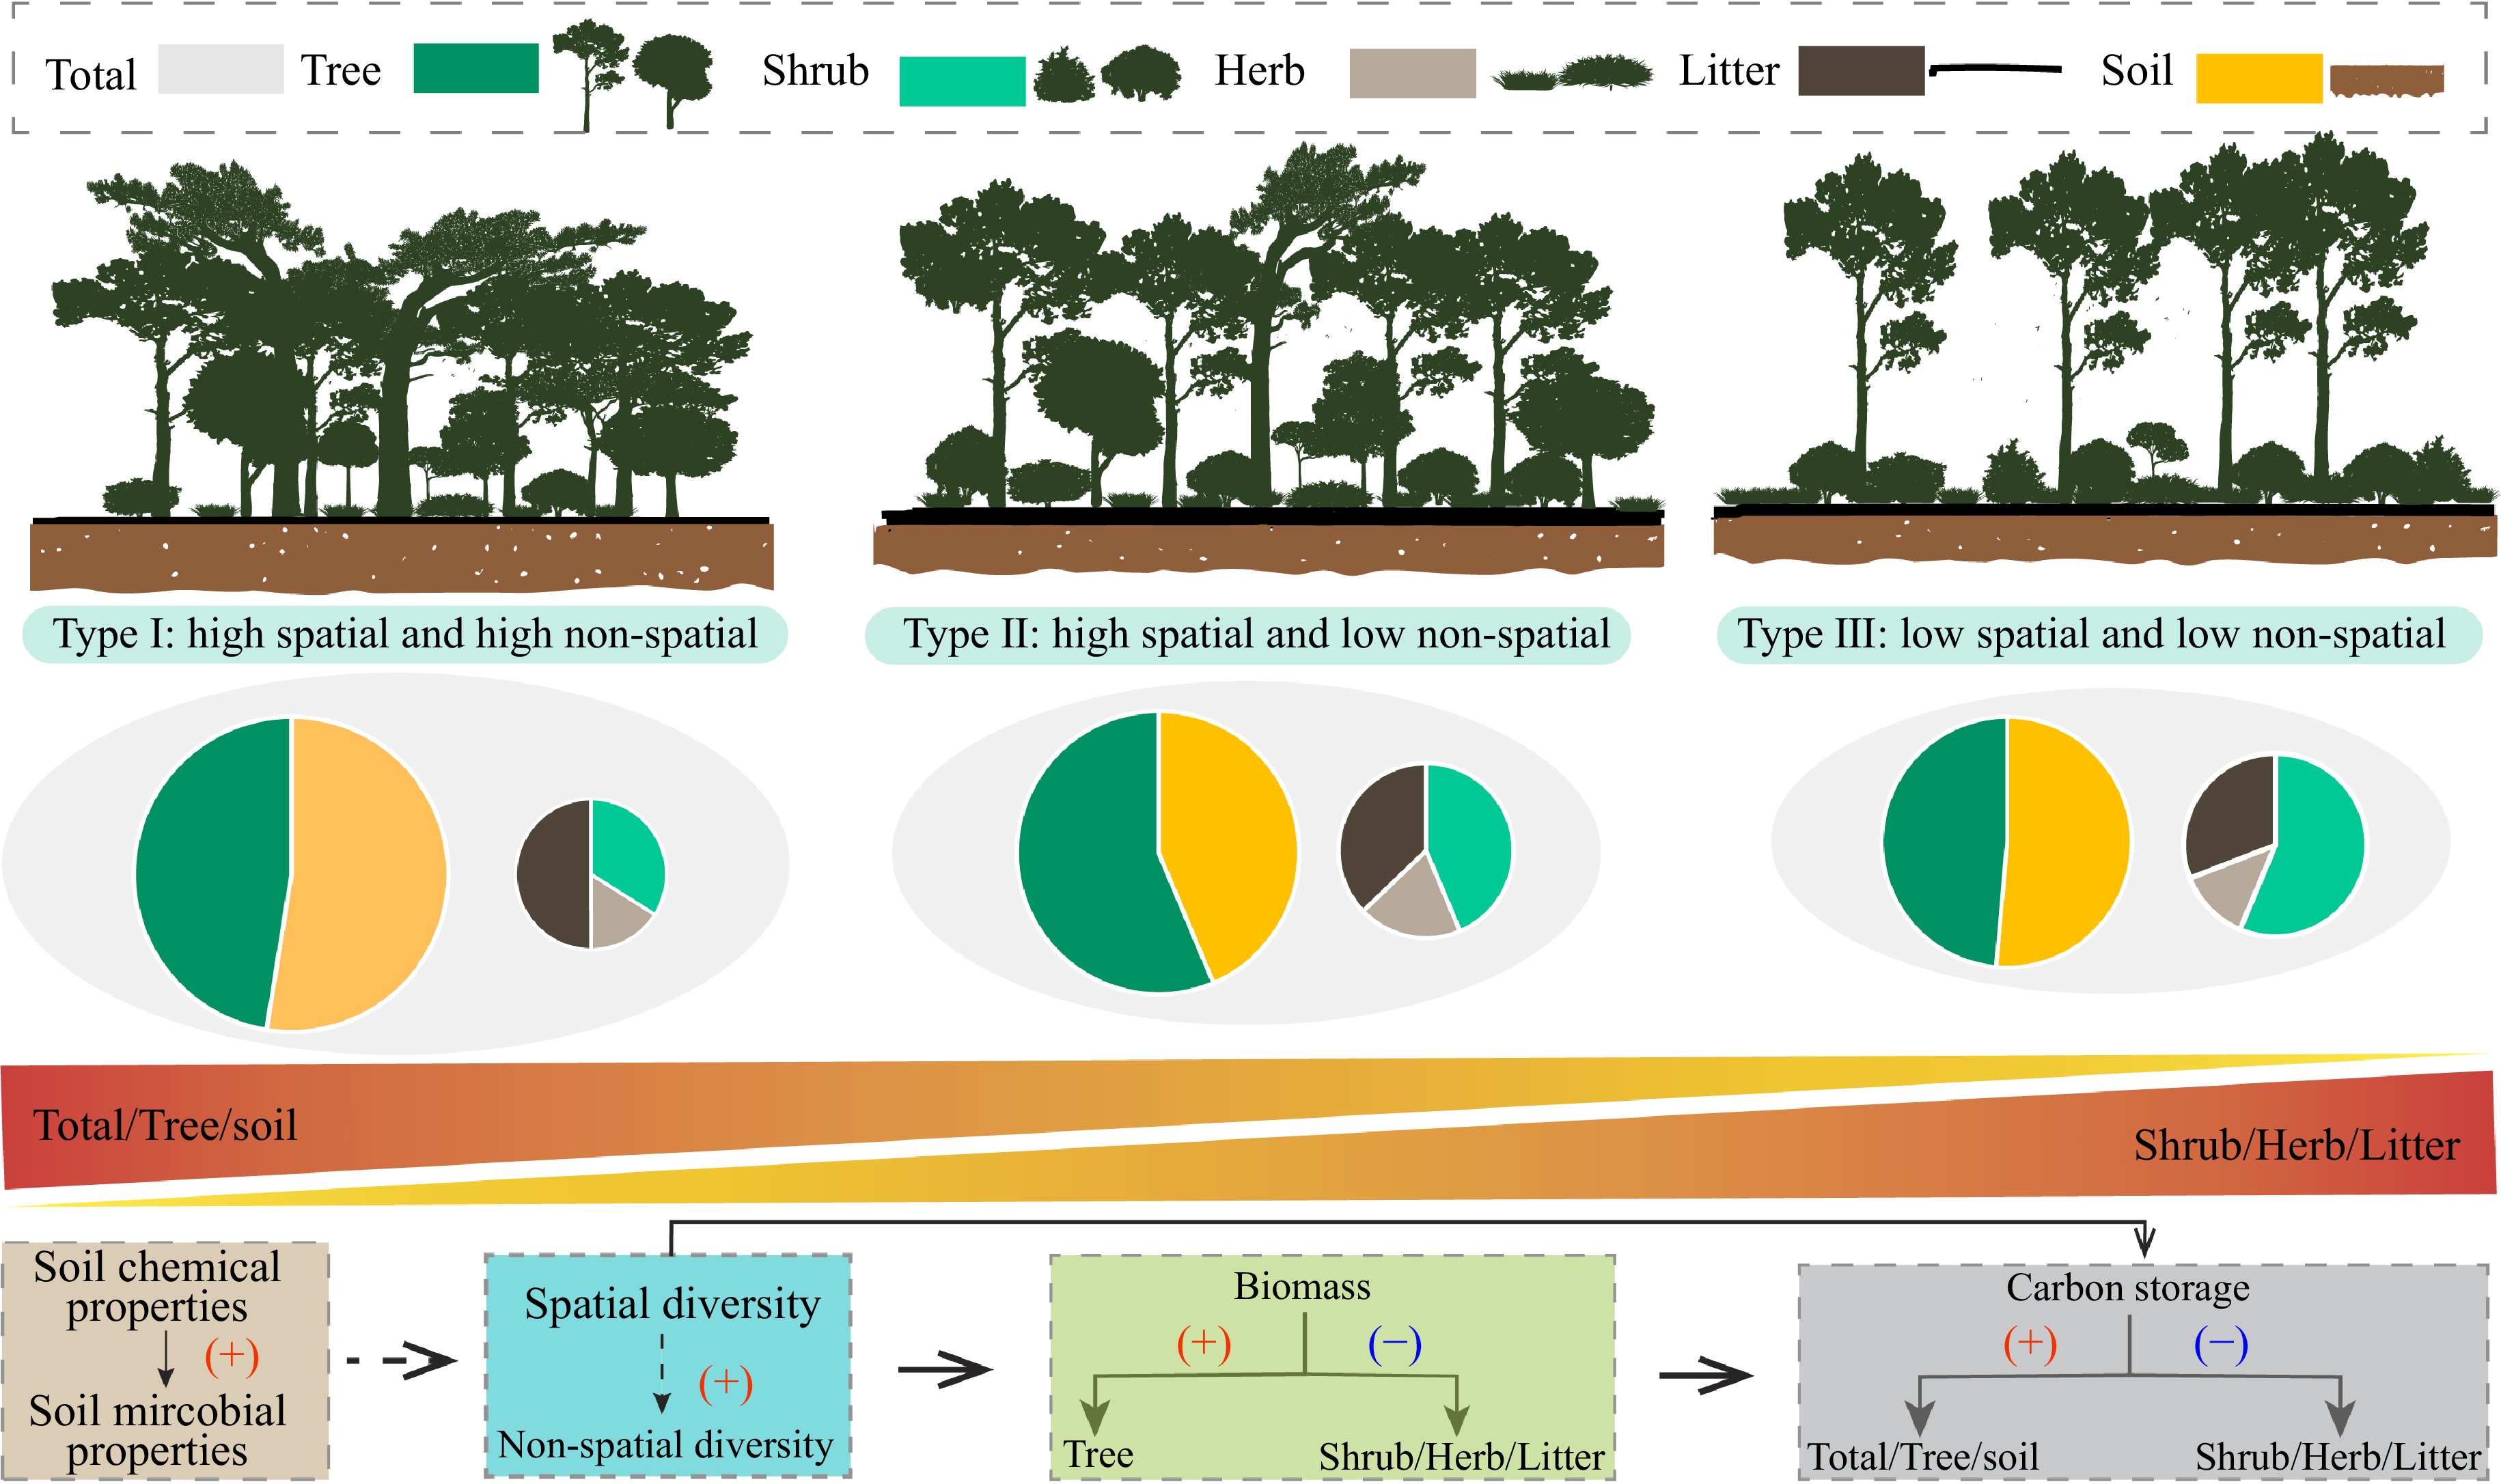
Figure 6.
Concept diagram for the influences of structural diversity on carbon storage.
Figures
(6)
Tables
(0)