-
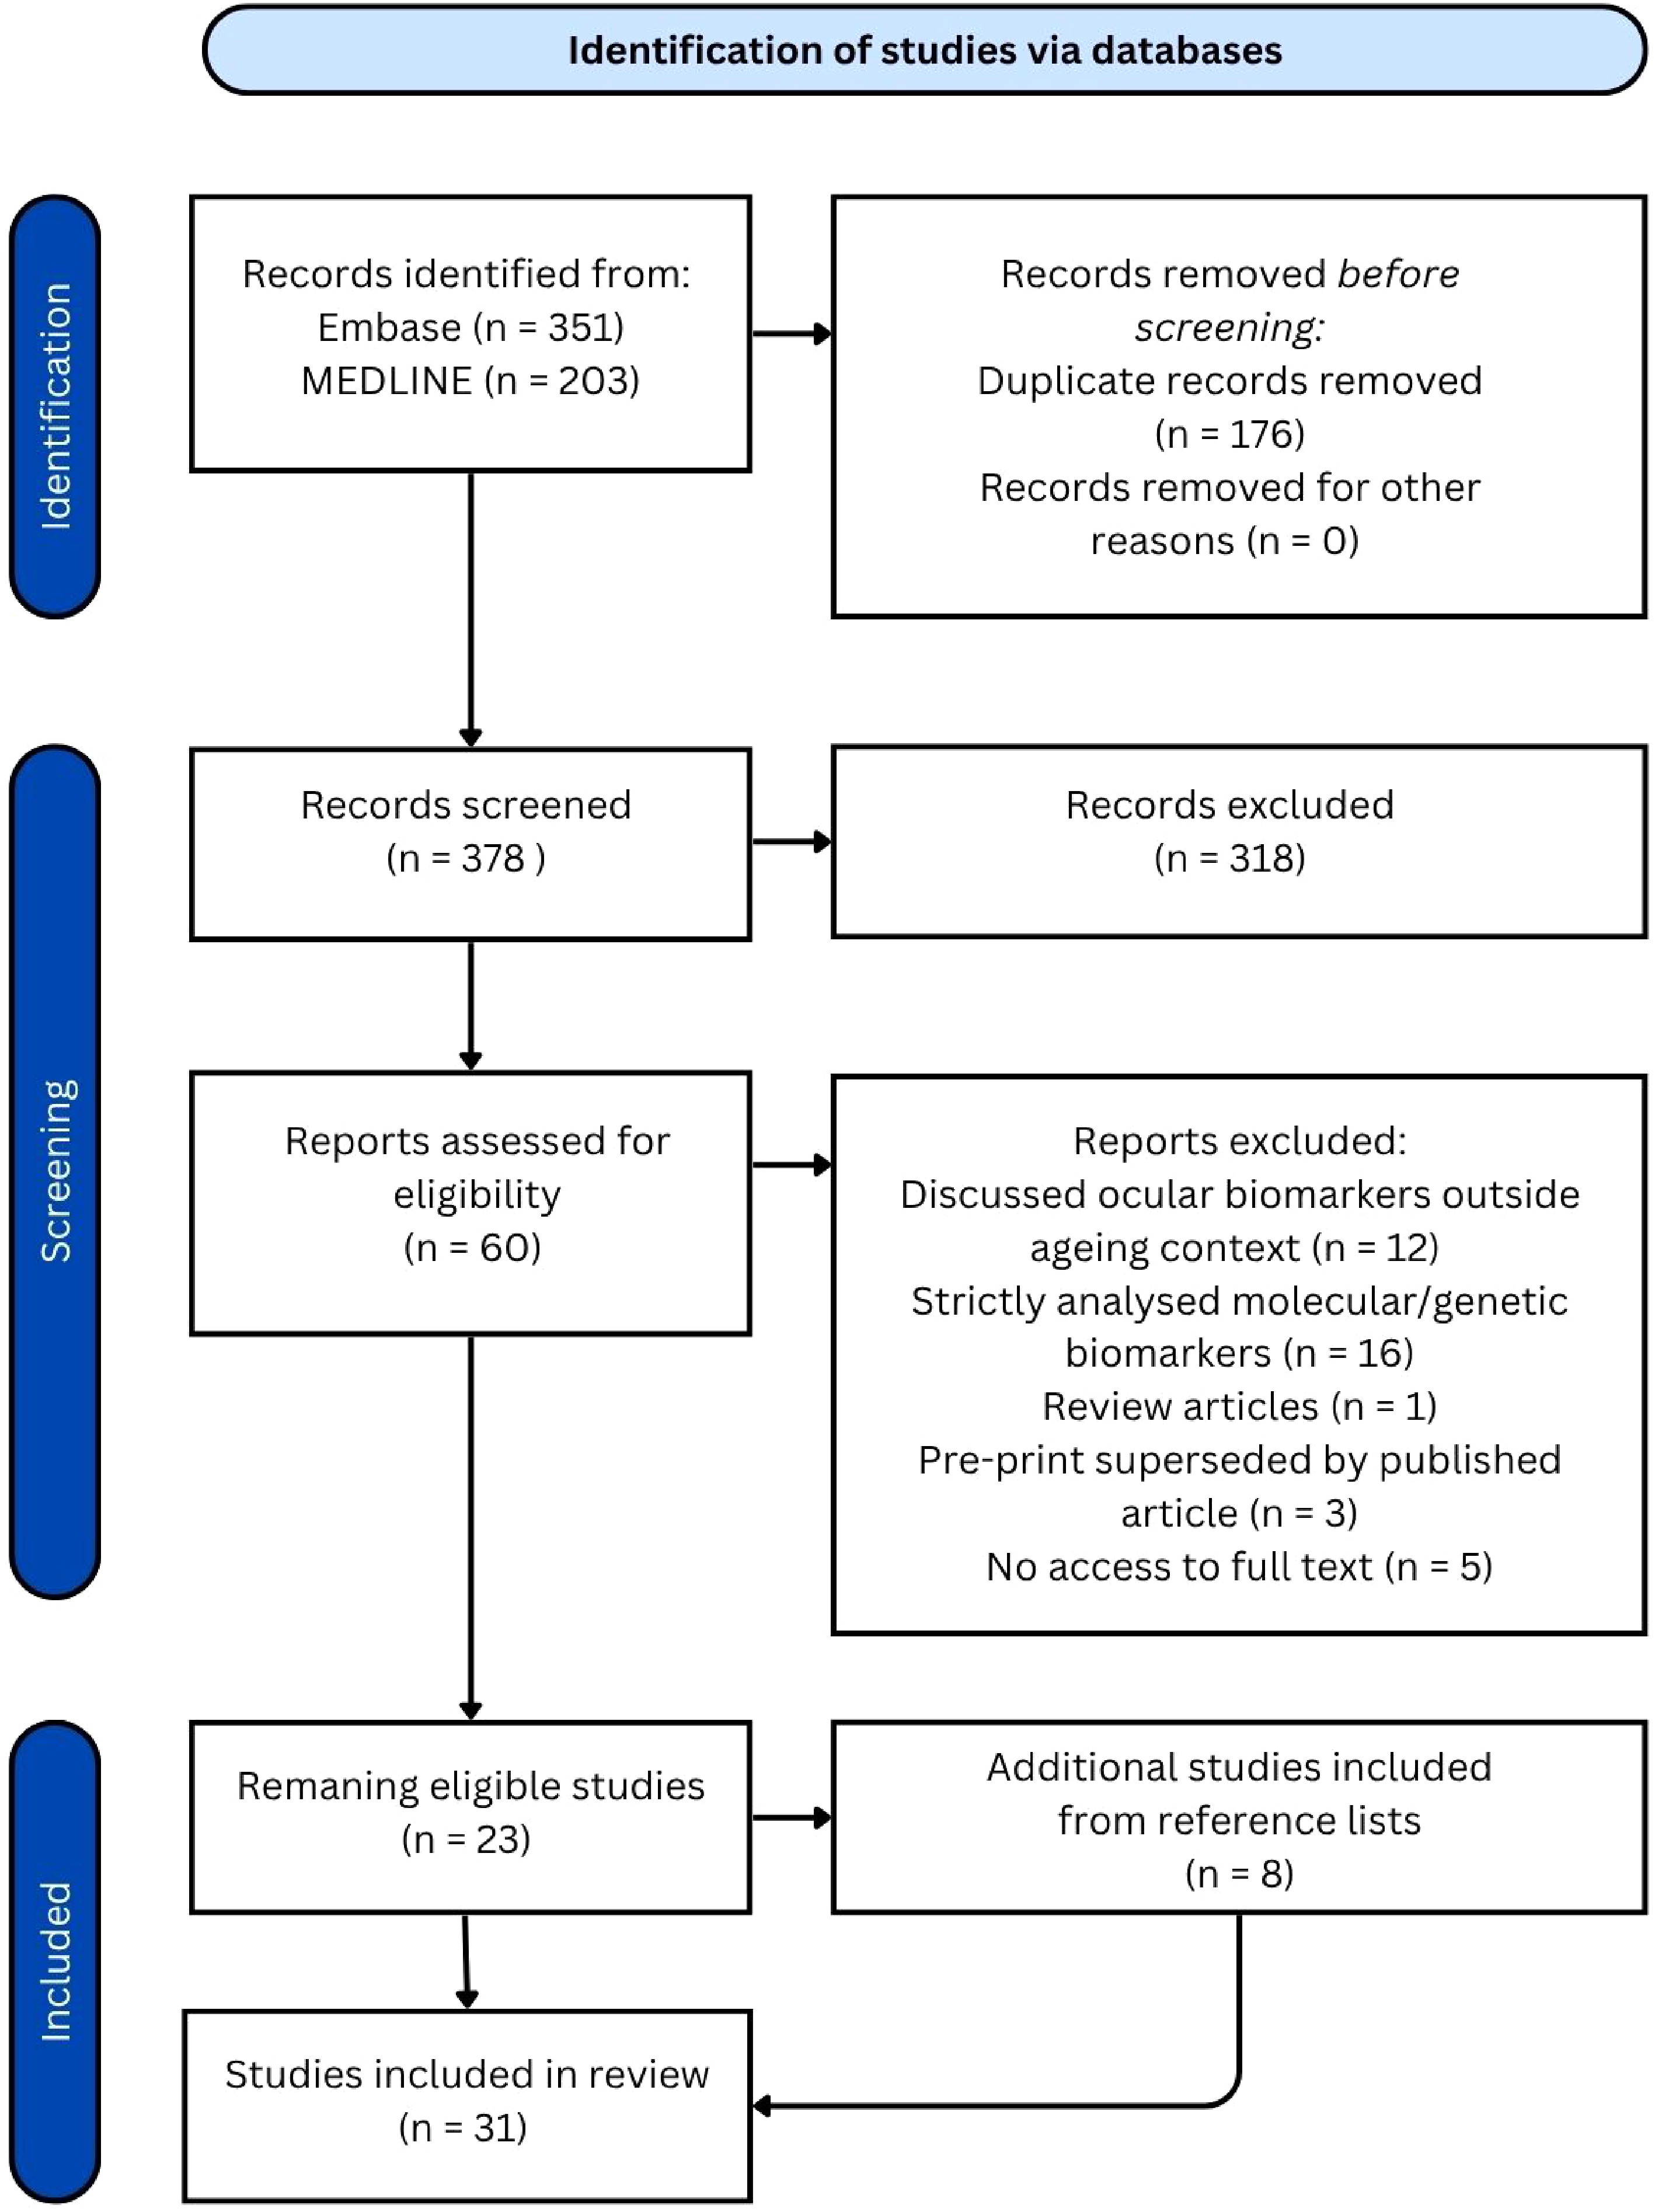
Figure 1.
PRISMA diagram.
-
Biomarker AI/
non-AIPopulation Predictive accuracy for age/
correlation with ageRisk stratification Retinal age[8] AI 19,200 fundus images from 11,052 participants in the UK Biobank study (UK) r = 0.81 between predicted retinal age and chronological age, MAE = 3.55 years One year increase in RAG associated with increased risk of Parkinson's disease (10%), incident CVD (3%), stroke (4%), kidney failure (10%), metabolic syndrome or inflammation (1%), DR in diabetic patients (7%), mortality (2%) Convolutional network-based model[9] AI 98,400 retinal images of diabetic patients enrolled in the Retislaud program of the Canary Islands health service (Spain) MAE = 3.97 years in predicting chronological age using retinal age RAG of patients without DR was 0.609 years, significantly lower than that of patients with DR which was 1.905 years (p < 0.001) eyeAge[10] AI 217,289 fundus images from 100,692 patients from the EyePacs dataset (US screening program) + UKB cohort for external validation (UK) r = 0.95 and 0.87, MAE = 2.86 and 3.30 years for predicting chronological age in EyePacs and UKB datasets respectively Positive association with COPD (p = 0.0048), myocardial infarction (p = 0.049) and mortality risk RetiAGE[11] AI 129,236 retinal photographs from 40,480 participants in the Korean Health Screening Study (South Korea) + 56,301 UKB patients for external validation (UK) AUROC = 0.968 in predicting ≥ 65 years, decreased to 0.756 when testing UKB cohort 4th RetiAge quartile = greater risk of CVD, cancer and mortality (HR = 1.39, 1.18, 4.74 respectively) compared to those in 1st quartile AgeDiff[12] AI 11,223 subjects from the China Bioage investigation Consortium cohort (China) r = 0.91, MAE = 1.94 years in predicting chronological age 4th AgeDiff quartile = greater risk of chronic heart disease, chronic kidney disease, CVD, diabetes, hypertension and stroke (HR = 5.04, 5.25, 5.16, 5.61, 5.78, 4.67 respectively) compared to those in 1st quartile OCT age[13] AI 7,271 OCT B-scans from 278 healthy participants in the Duke Glaucoma Registry (USA) r = 0.860, MAE = 5.82 years in predicting chronological age Not applicable OCT age[14] AI 6,147 pre-operative OCT scans from 3,134 patients in Ray Guard Eye Clinic (China) MAE = 5.78 years in predicting chronological age Not applicable OCT age[15] AI 84,753 OCT scans from 53,159 individuals from the UK Biobank (UK) MAE = 3.27 years in predicting chronological age 5-year increase in OCT age gap associated with an 8% increase in mortality (p = 0.004) LensAge[16] AI 8,255 lens photographs from 1,990 relatively healthy individuals enrolled in the Chinese Cataract Screening Program between 2018 and 2021 (China) R2 = 0.89, MAE = 4.88 years in predicting chronological age Positive LensAge index = greater risk of systemic age-related diseases (OR = 1.26) which include diabetes, hypertension, CVD, cancer, cerebral infarction IOP, visual acuity, lens opacity[17] Non-AI 1,428 research participants in North Hertfordshire (England) Visual acuity and lens opacity had weak positive correlations with chronological age
(r = 0.1, p = 0.04 and r = 0.13, p = 0.01 respectively), whilst IOP demonstrated no correlationNot applicable Microvascular complexity[18] Non-AI 68 patients from the Faculty of Medicine at the University of Montenegro (Montenegro) Advanced chronological age associated with decreased microvascular complexity Not applicable RNFL birefringence and NFI[19] Non-AI 140 retinal photos from 73 healthy subjects from a tertiary eye care facility in South India (India) 1.3 unit increase in NFI and 1µm decrease in RNFL birefringence associated with a one decade increase in age Not applicable RNFL thickness[20] Non-AI 113 individuals recruited from the University of Houston University Eye Institute clinics (US) Both vessel-included and vessel-removed RNFL measurements negatively associated with ageing (−0.234 and −0.206 μm/year, respectively) Not applicable RNFL thickness[21] Non-AI 35 randomly selected healthy subjects in the University Eye Center, Hong Kong Eye Hospital (China), followed over a 4-month period Negative correlation between age and average RNFL thickness (−0.33 μm/year; p = 0.011), longitudinal analysis showed an average rate of change of −0.52 μm/year (95% confidence interval [CI], −0.86 to −0.17) Not applicable RNFL thickness[22] Non-AI 100 healthy volunteers (location not specified) Both total retinal thickness and RNFL thickness significantly reduced with increasing age (R² = 0.133 and 0.094, respectively; p < 0.001) Not applicable Retinal microvascular function[23] Non-AI 123 healthy adult participants from the Vascular Research Laboratory at Aston University in Birmingham (UK) tMC and tMD significantly higher in oldest group compared to youngest and middle age groups Not applicable Retinal vessel wall thickness[24] Non-AI 238 subjects recruited by the Kyoto University Hospital Department of Ophthalmology (Japan) Both arterial and venous wall thicknesses were significantly correlated with age (r = 0.612, p < 0.001 and r = 0.455, p < .001 respectively) Not-applicable Retinal vessel diameter[25] Non-AI 4,926 individuals from the Beaver Dam Eye Study in Wisconsin (US) Retinal arteriolar diameter decreased by 2.1 μm per decade of age (95% confidence interval [CI], 1.5 to 2.7), and retinal venular diameter decreased by 2.3 μm (p < 0.001) for each decade increase in age Not-applicable Retinal vessel density, inner retinal layer thickness, venular blood flow velocity[26] Non-AI 74 healthy subjects from the University of Miami Miller School of Medicine (US) Age negatively associated with retinal vessel density, inner retinal layer thickness, and venular blood flow velocity (p < 0.05), and positively associated with the thickness of the outer plexiform and photoreceptor layers (p < 0.05) Not-applicable CRAE and AVR[27] Non-AI 168 Flemish participants (Belgium) 20% shorter leukocyte telomere length (ageing biomarker) associated with a decrease of 4.57 µm (p = 0.0011) in CRAE and a decrease of −0.020 (p = 0.0018) in AVR Not applicable Lens density, retinal vessel calibre, corneal endothelial cells and retinal nerve fibre layer thickness[28] Non-AI 256 participants from an HIV prevention trial site in a township community of Cape Town (South Africa) CDKN2A expression positively correlated with lens density (p-trend = 0.05), telomere length positively correlated with endothelial cell density (p-trend = 0.08), associations were observed between CDKN2A expression and retinal arteriolar calibre (p-trend = 0.06), and shorter telomere length associated with thinning of the retinal nerve fibre layer (p-trend = 0.05) Greater lens density associated with increasing frailty (p-trend = 0.03) Macular drusen[29] Non-AI 1,037 participants in the Dunedin Study (New Zealand) Statistically insignificant results between the presence of macular drusen and biological age determined by subjective facial age ratings Not applicable Table 1.
Overview of ocular ageing biomarkers.
Figures
(1)
Tables
(1)