-
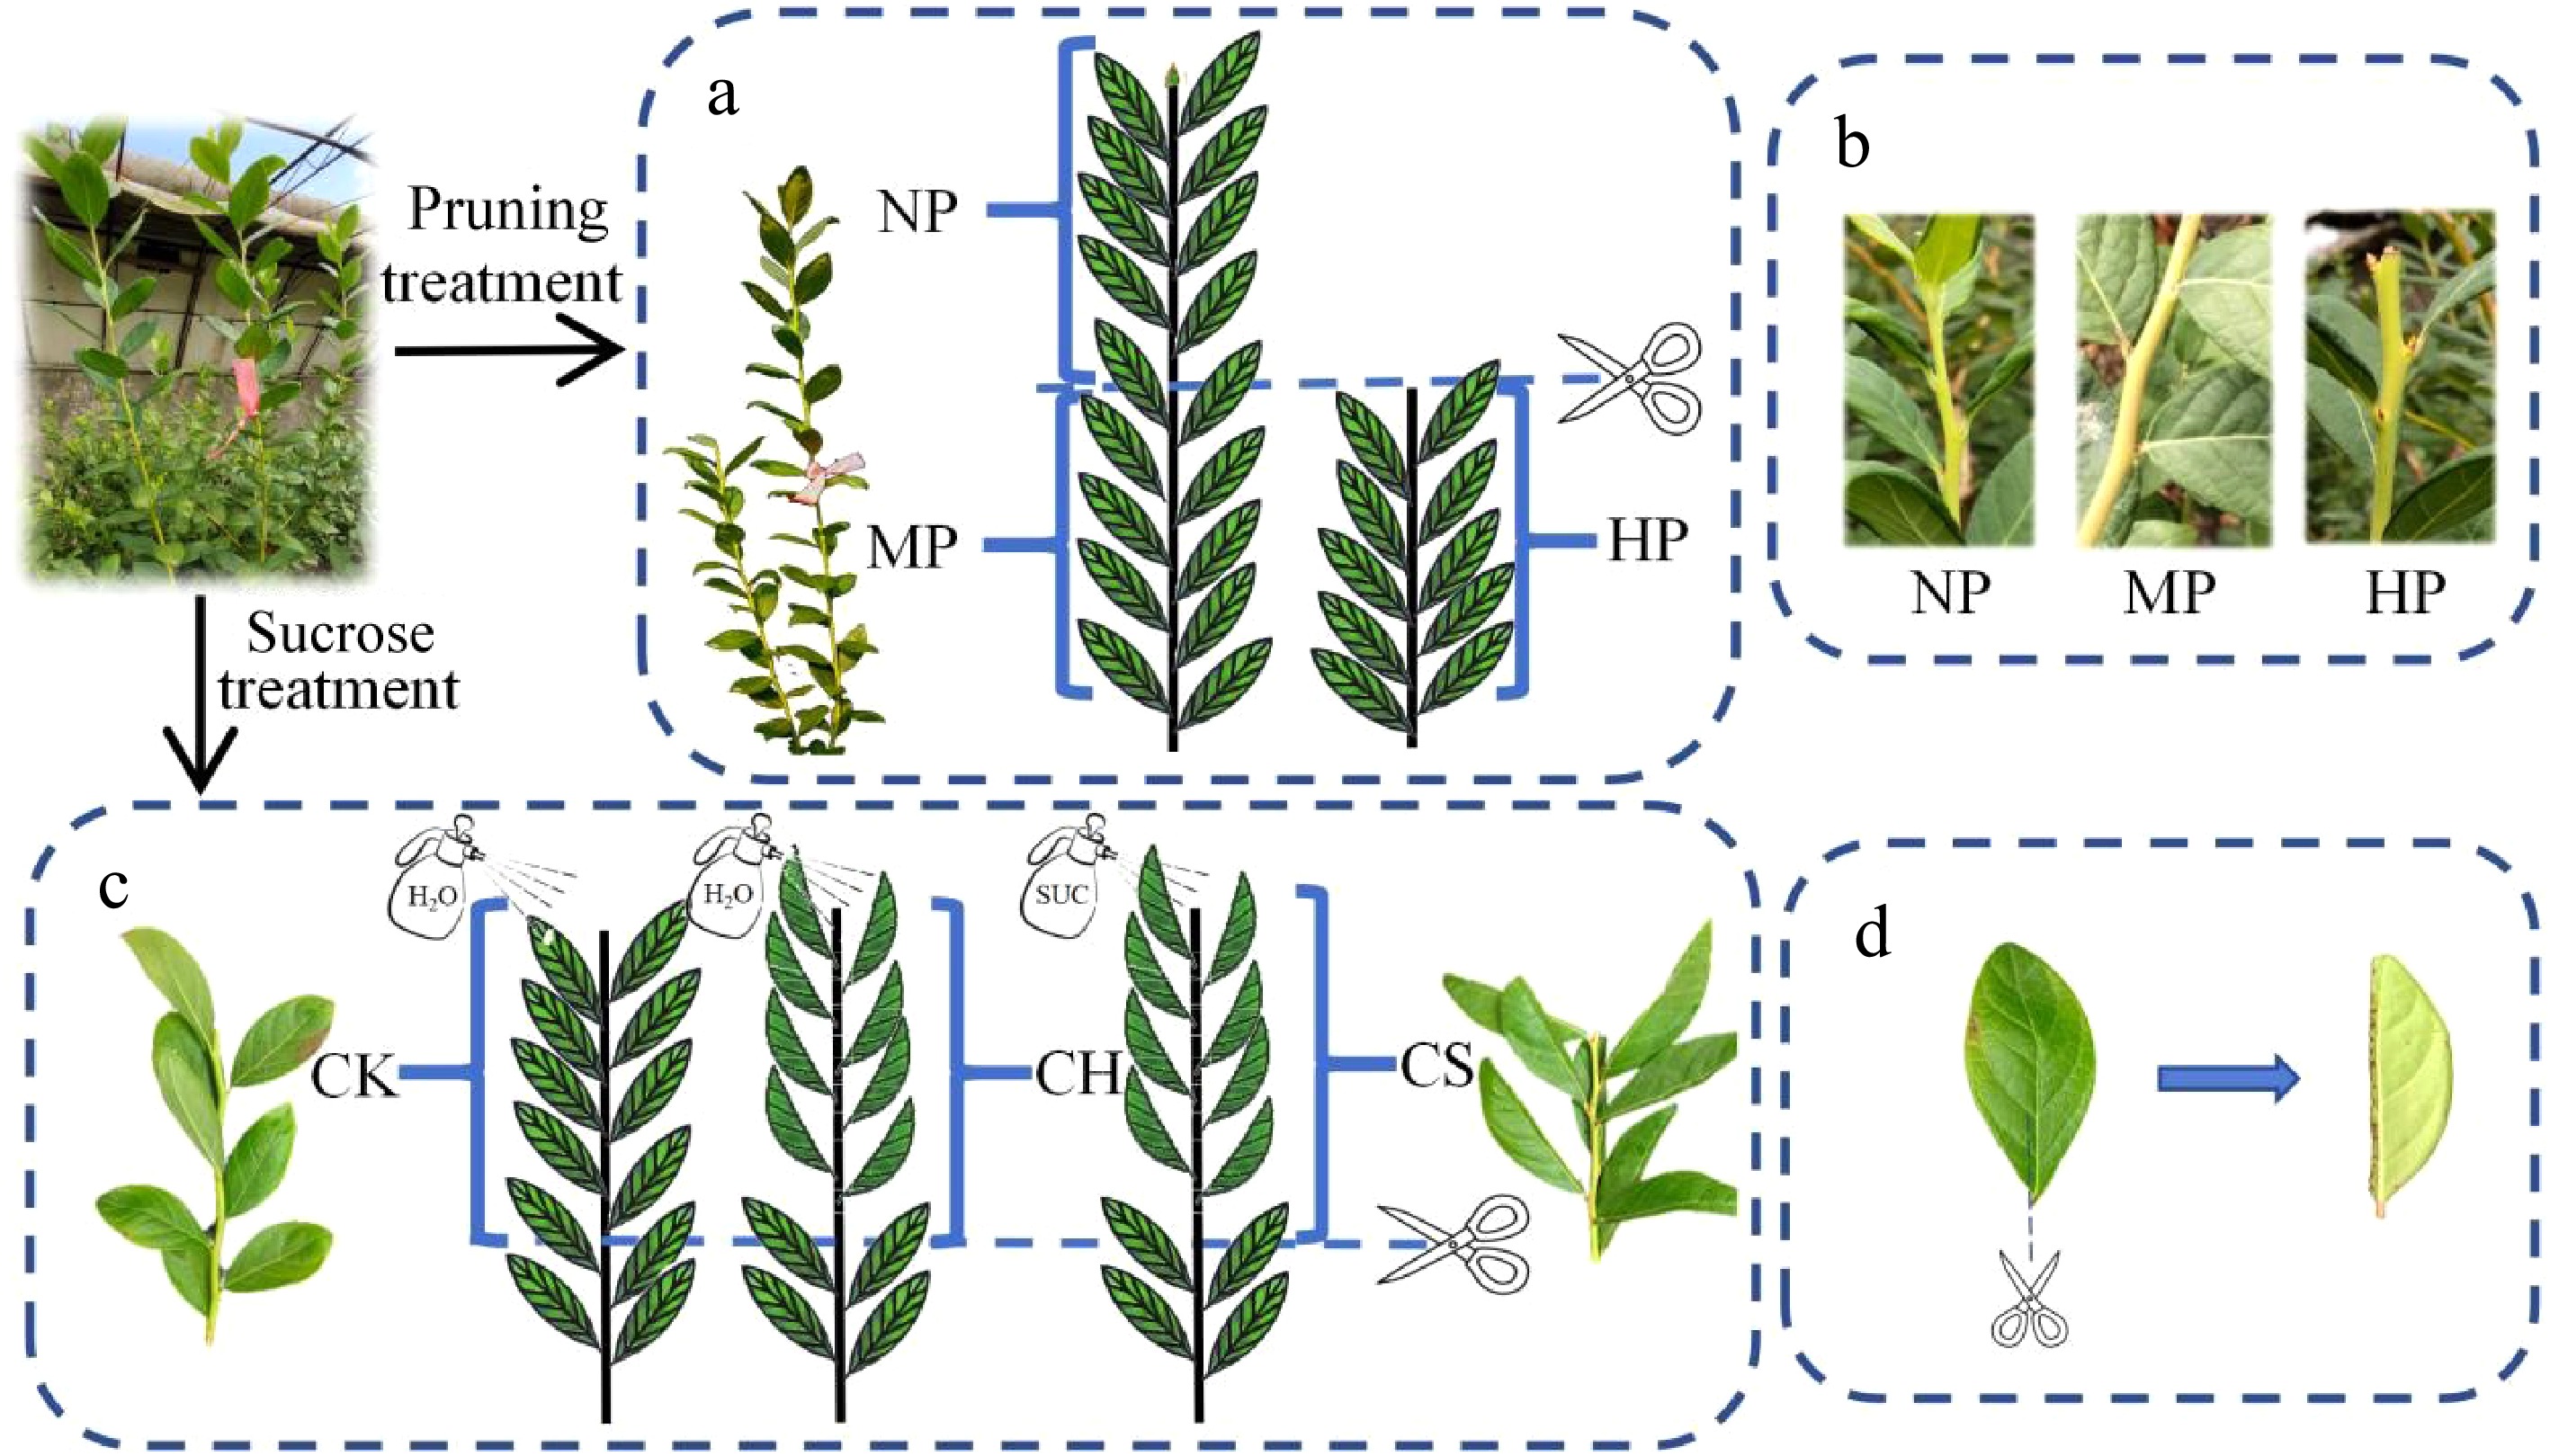
Figure 1.
Schematic diagram of processing method. (a) Schematic diagram of the sample collection sites for the pruning treatment group, where NP, MP, and HP represent the sample collection sites for the uncut and sheared upper parts, respectively. (b) Growth status of NP, MP, and HP shoot on October 6. (c) Schematic diagram of the collection sites for the sugar treatment group, where CK, CH, and CS represent the sample collection sites for the only pruning group, cut half a half and pruning group, and cut half a half and pruning and sucrose treatment group, respectively. (d) Schematic diagram of the half-leaf cutting processing method. The dashed line represents the cutting position.
-
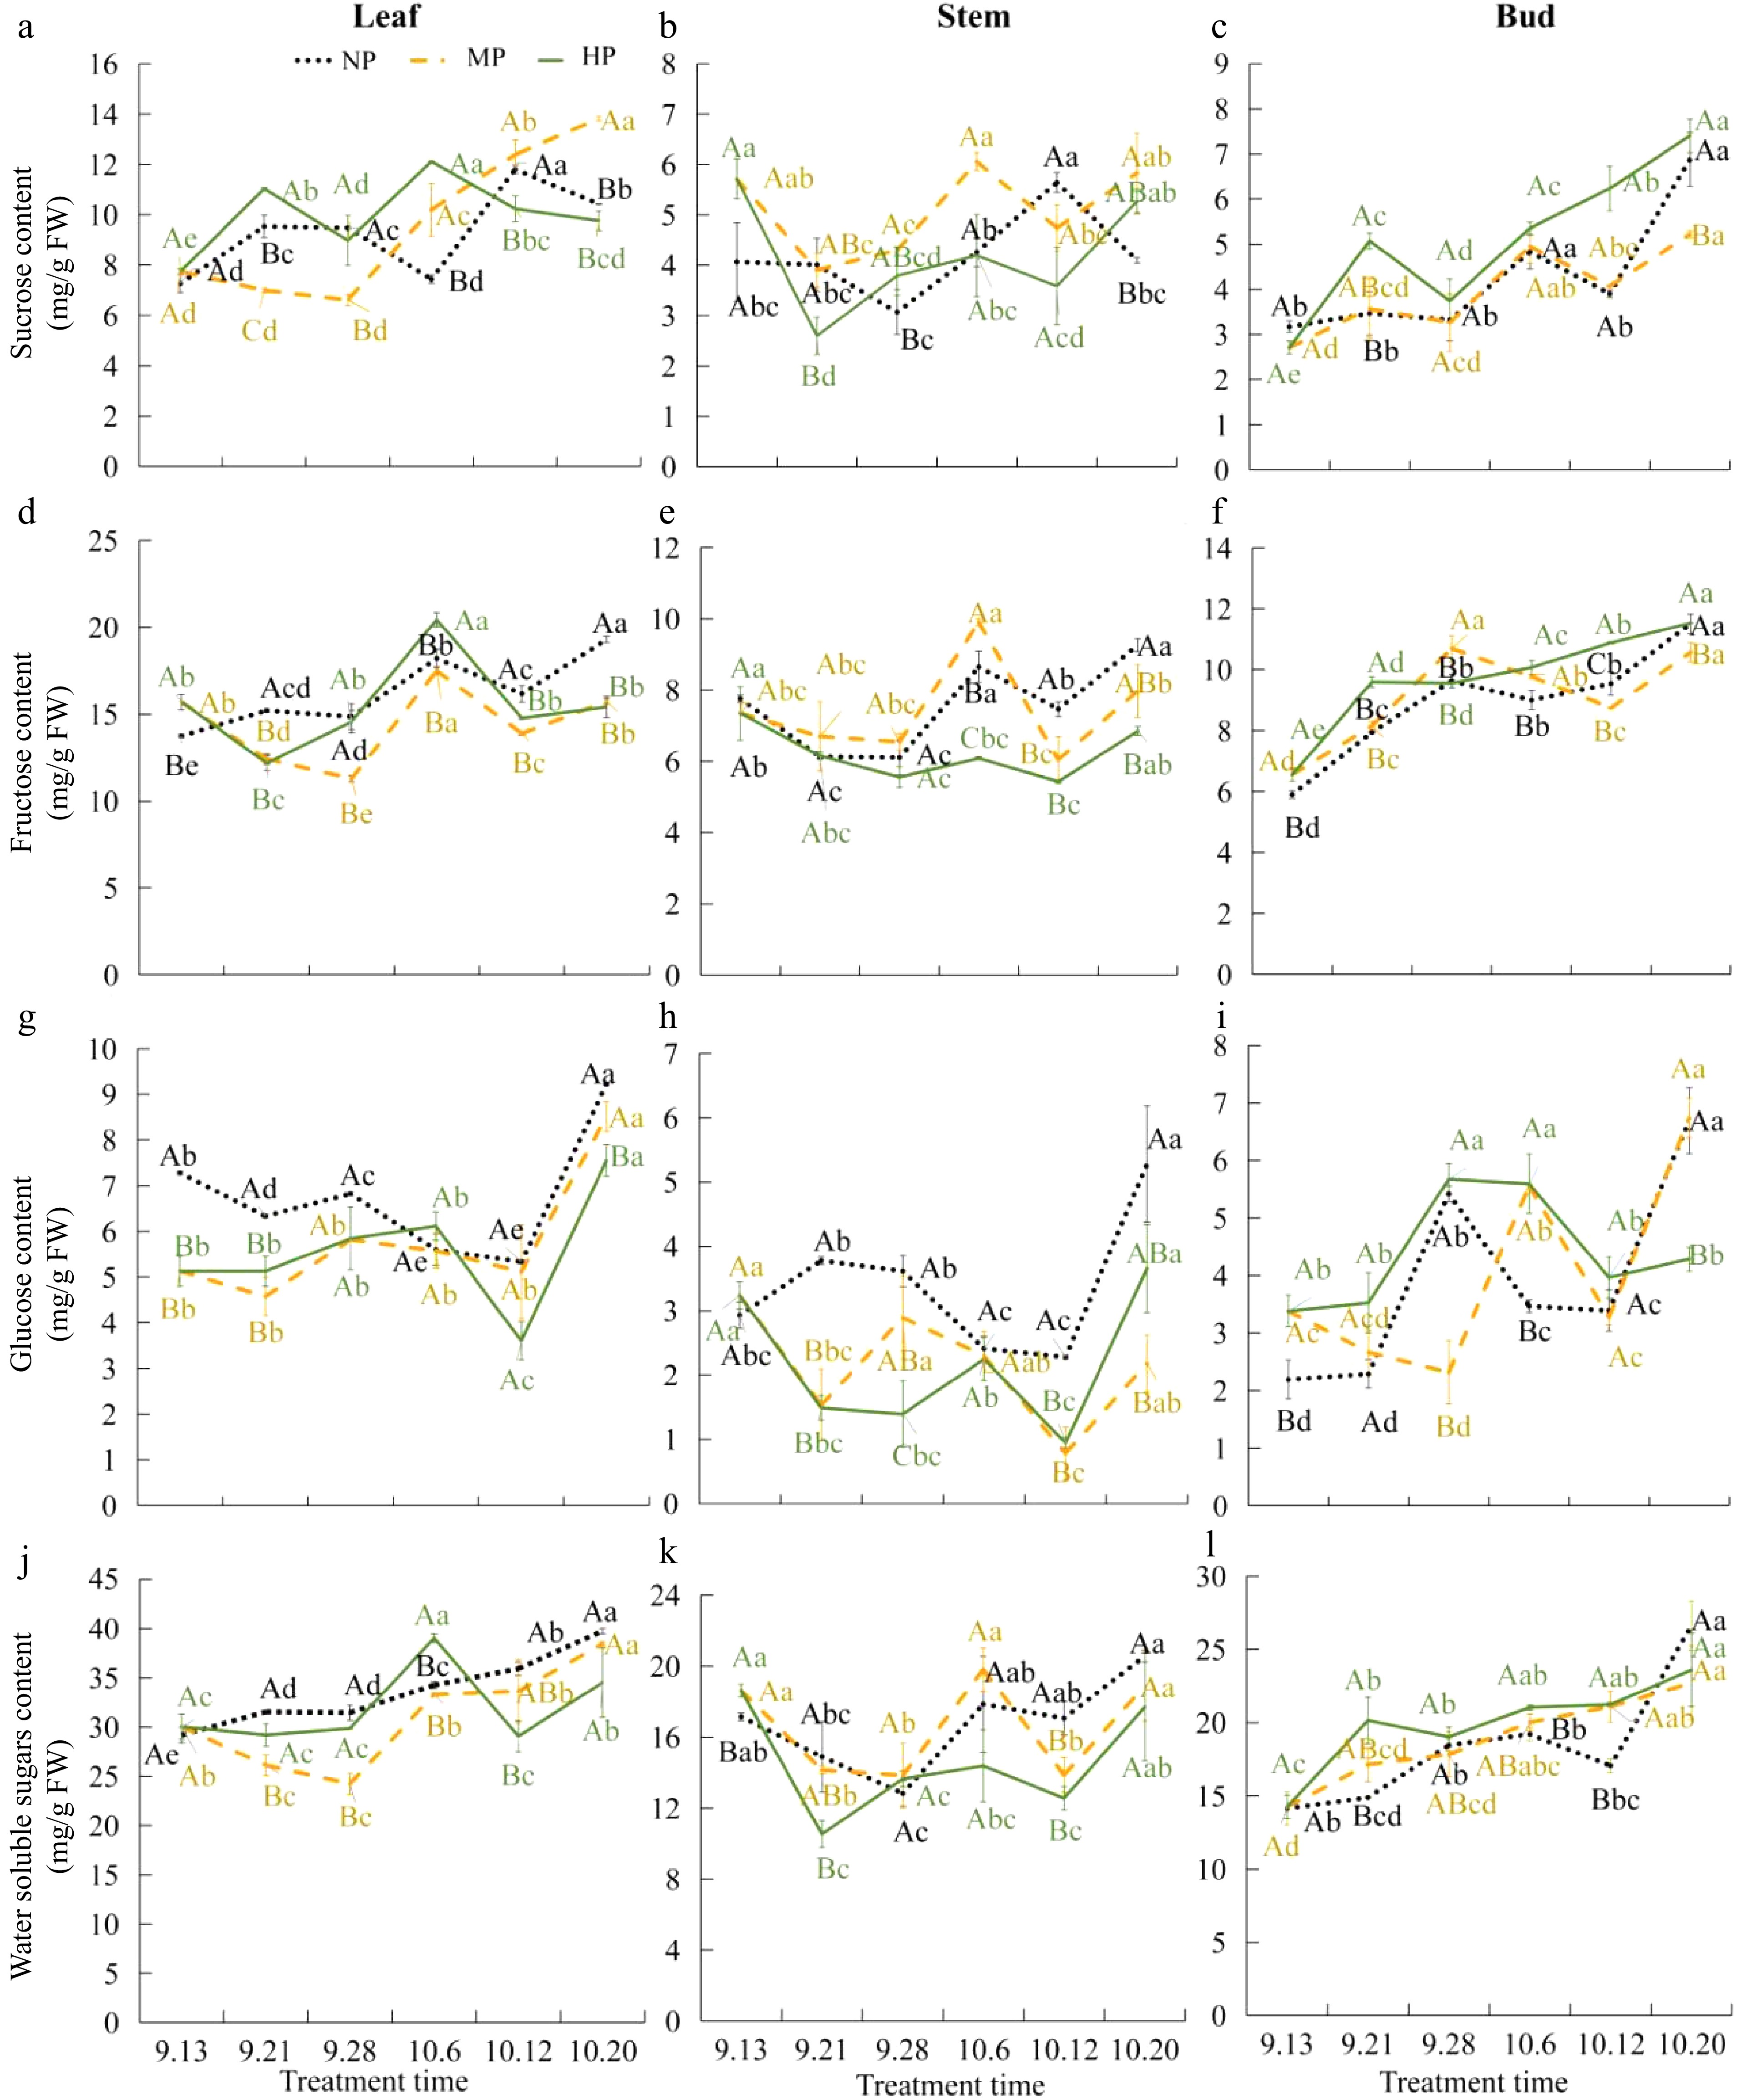
Figure 2.
Sugar content in different parts of autumn short 14 pruning. (a)−(c) Sucrose content in leaves, stems, and buds. (d)−(f) Fructose content in leaves, stems, and buds. (g)−(i) Glucose content in leaves, stems, and buds. (j)−(l) Water soluble sugar content in leaves, stems, and buds, respectively. NP indicates the head of the non-pruned shoot, MP indicates the middle of the non-pruned shoot, and HP ndicates the head of the pruned shoot. Duncan's multiple range test was used for significance analysis. Different lowercase letters indicate significant differences at the p < 0.05 level between the same treatment and different treatments, while different uppercase letters indicate significant differences at the p < 0.05 level between different treatments at the same time. The same applies below.
-
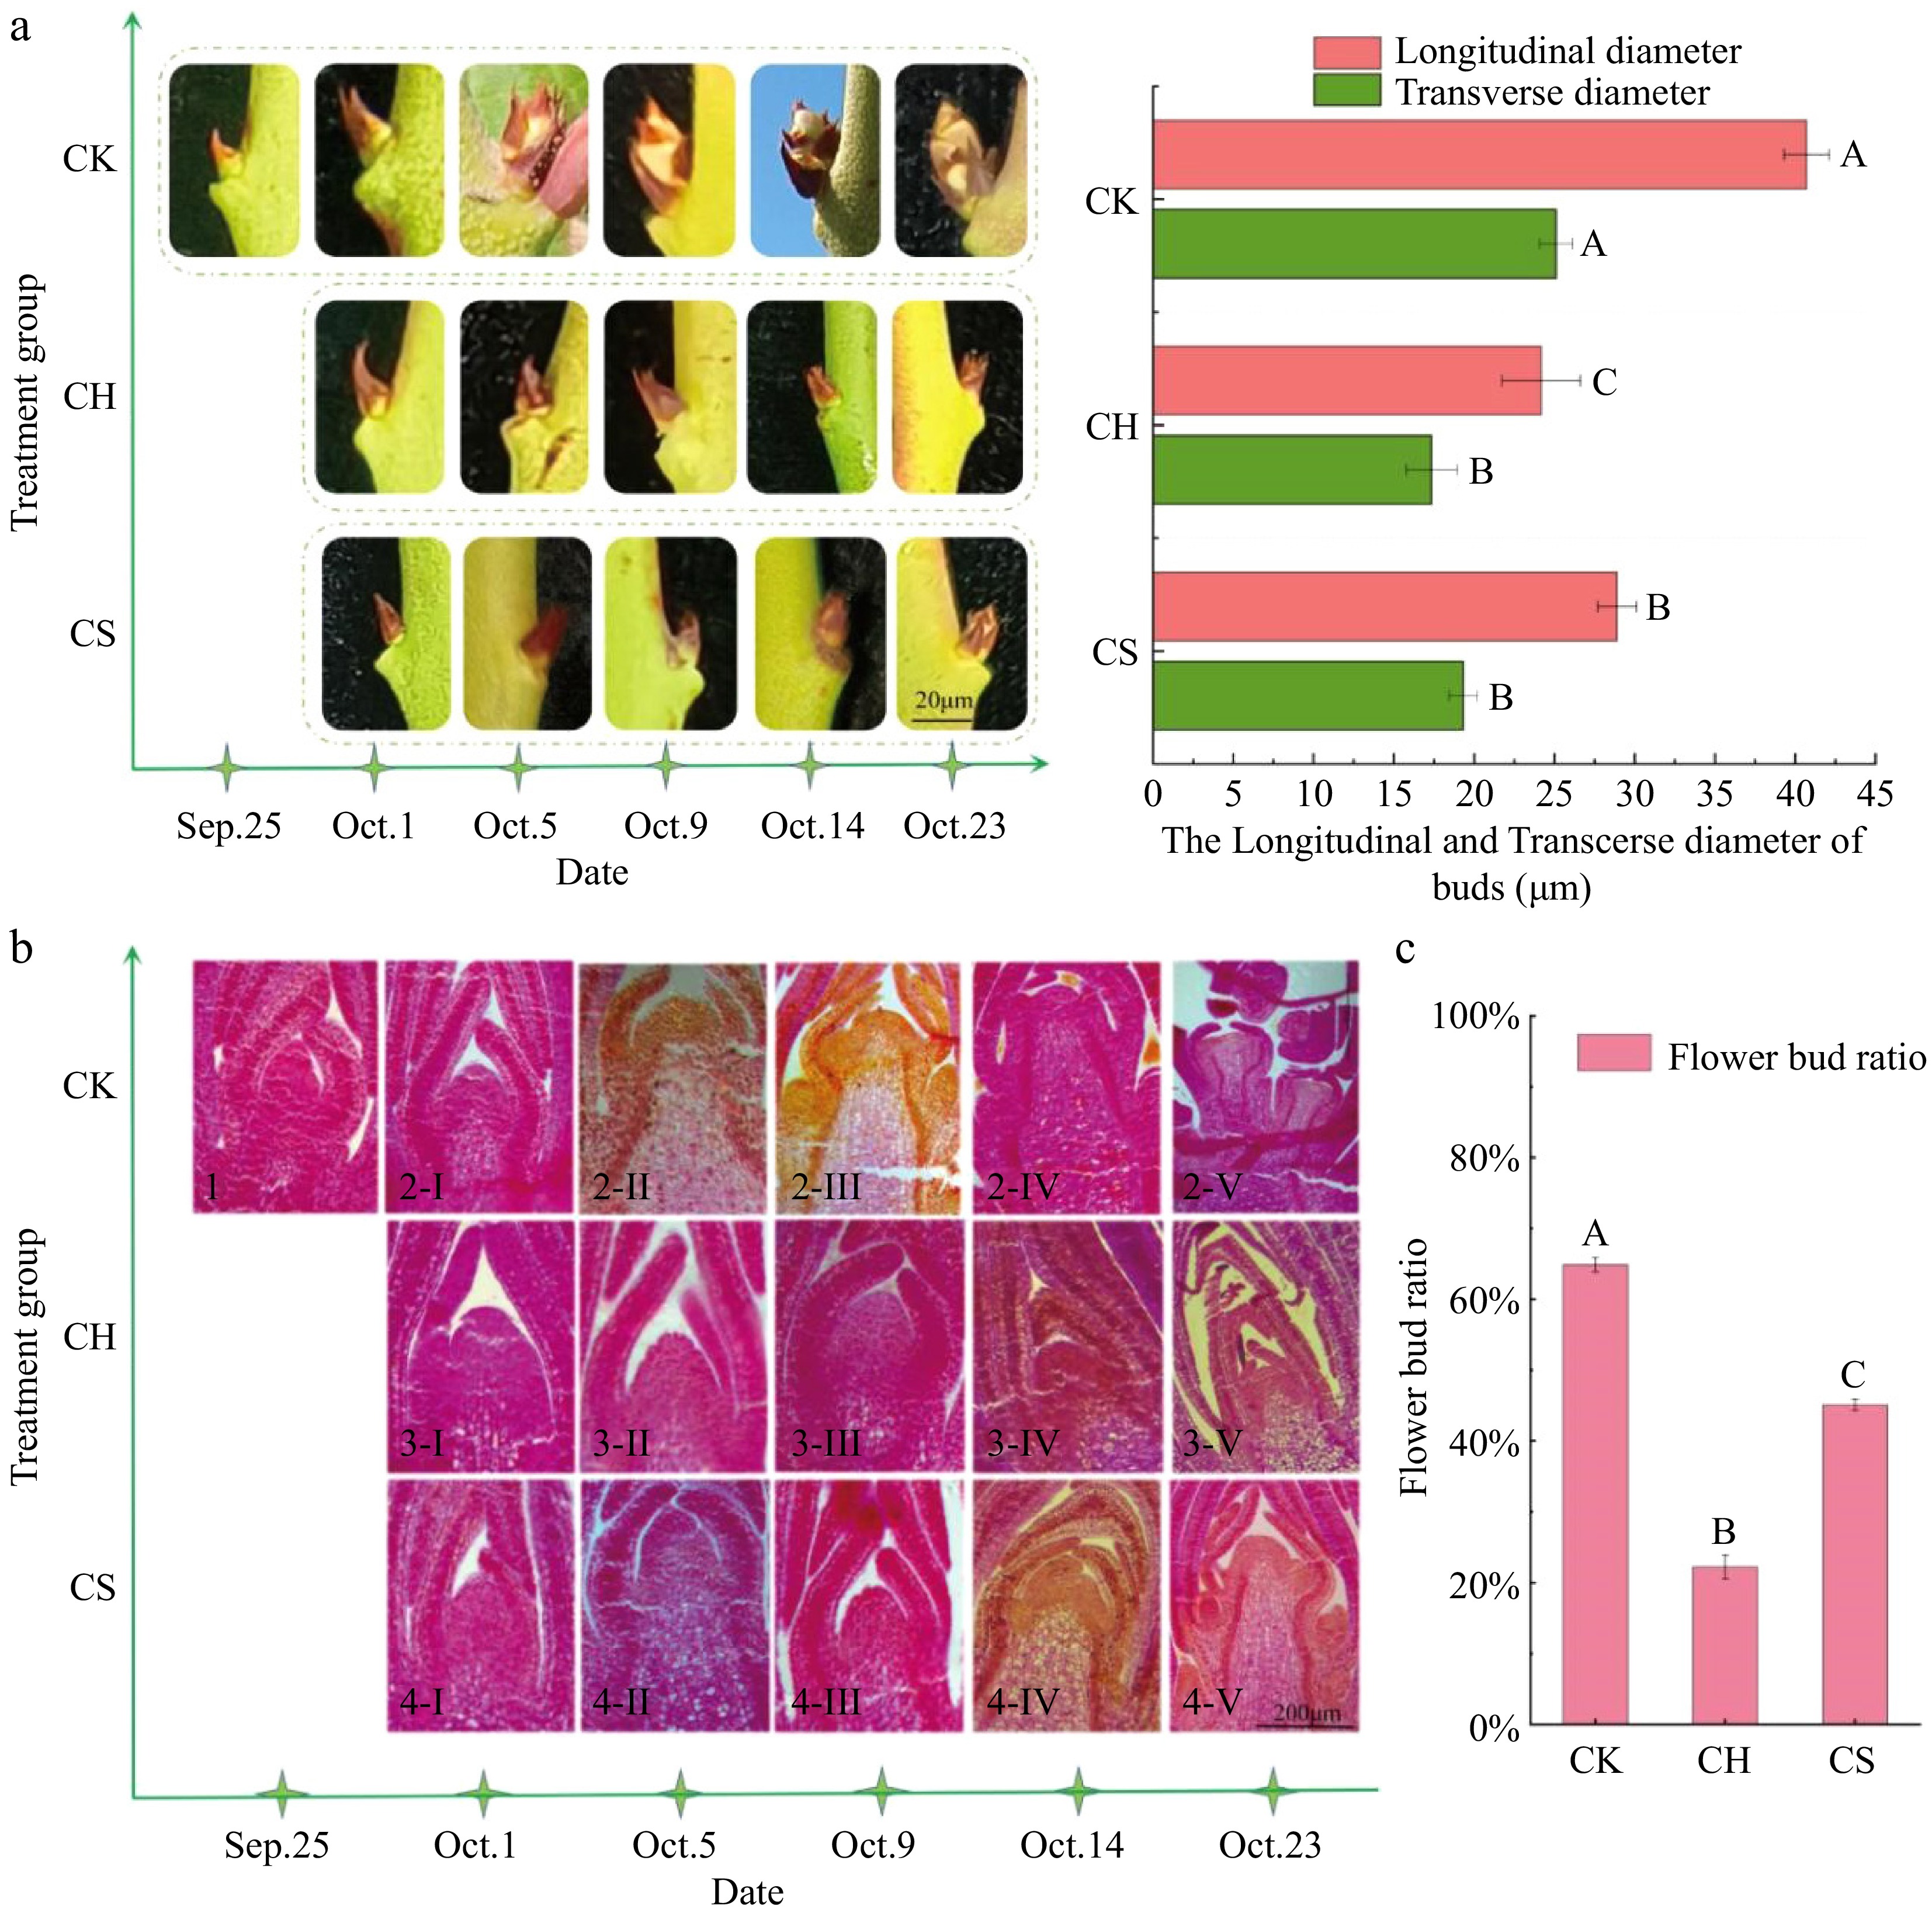
Figure 3.
Observation of bud morphology and flower bud ratio. (a) The directly observed morphology of axillary buds and the transverse and longitudinal diameters of buds on October 23. (b) The morphology of paraffin sections. (b-1) The buds on September 25. (b-2-I−V)−(2-I−V) The buds from October 1 to 23 of CK, CH, and CS, respectively. (c) The proportion of the total number of flower buds in each treatment to the total number of axillary buds. Different uppercase letters indicate significant differences at the p < 0.05 level between different treatments. CK represents the only pruning group, CH represents the pruning and cutting half a leaf group, and CS represents the pruning and cutting half a leaf and sucrose treatment group.
-
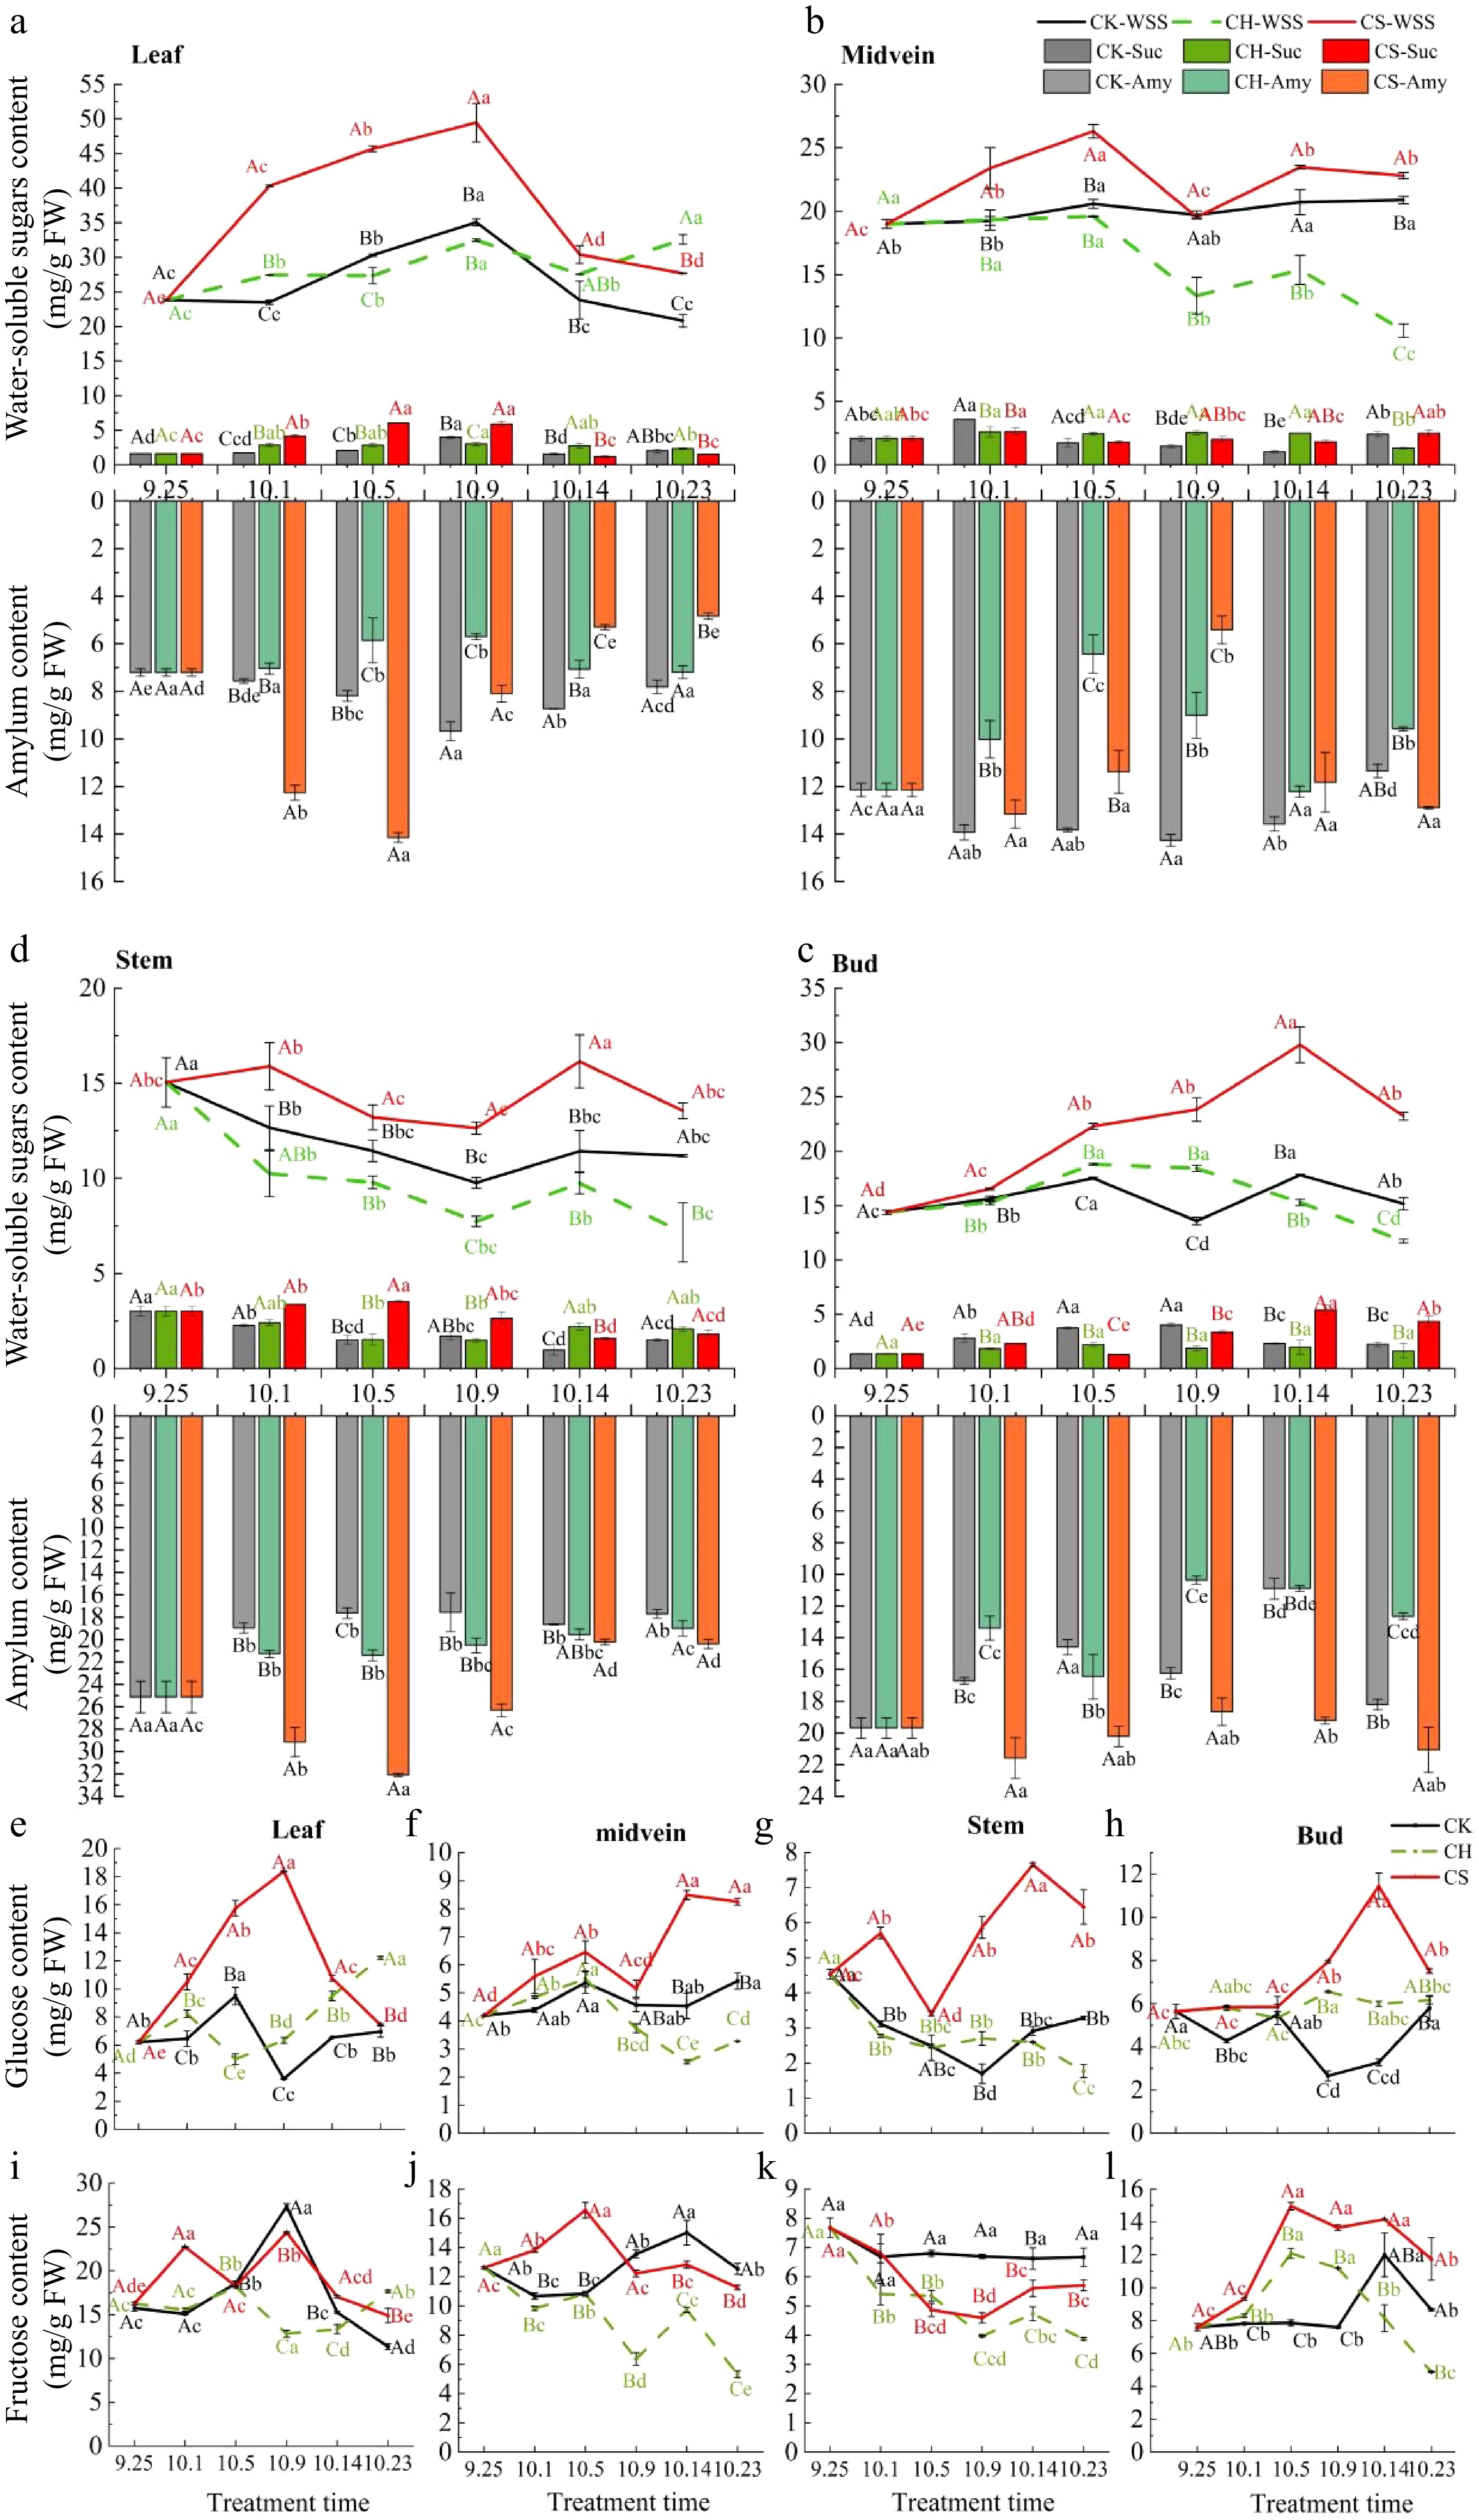
Figure 4.
NSCs content in various parts of the sucrose treatment 36 group. (a)−(d) Sucrose, water-soluble sugar (WSS), and amylum (Amy) content of leaves, midvein, stem, and buds. The X-axis represents the processing date. Above the X-axis of each graph are WSS (line graphs) and sucrose contents (bar graphs), and below are amylum contents (bar graphs). (e)−(h) Glucose content in leaves, midvein, stem, and buds, respectively. (i)−(l) Fructose content in leaves, midvein, stem, and buds, respectively. CK represents the only pruning group, CH represents the pruning and cutting half a leaf group, and CS represents the pruning and cutting half a leaf and sucrose treatment group.
-
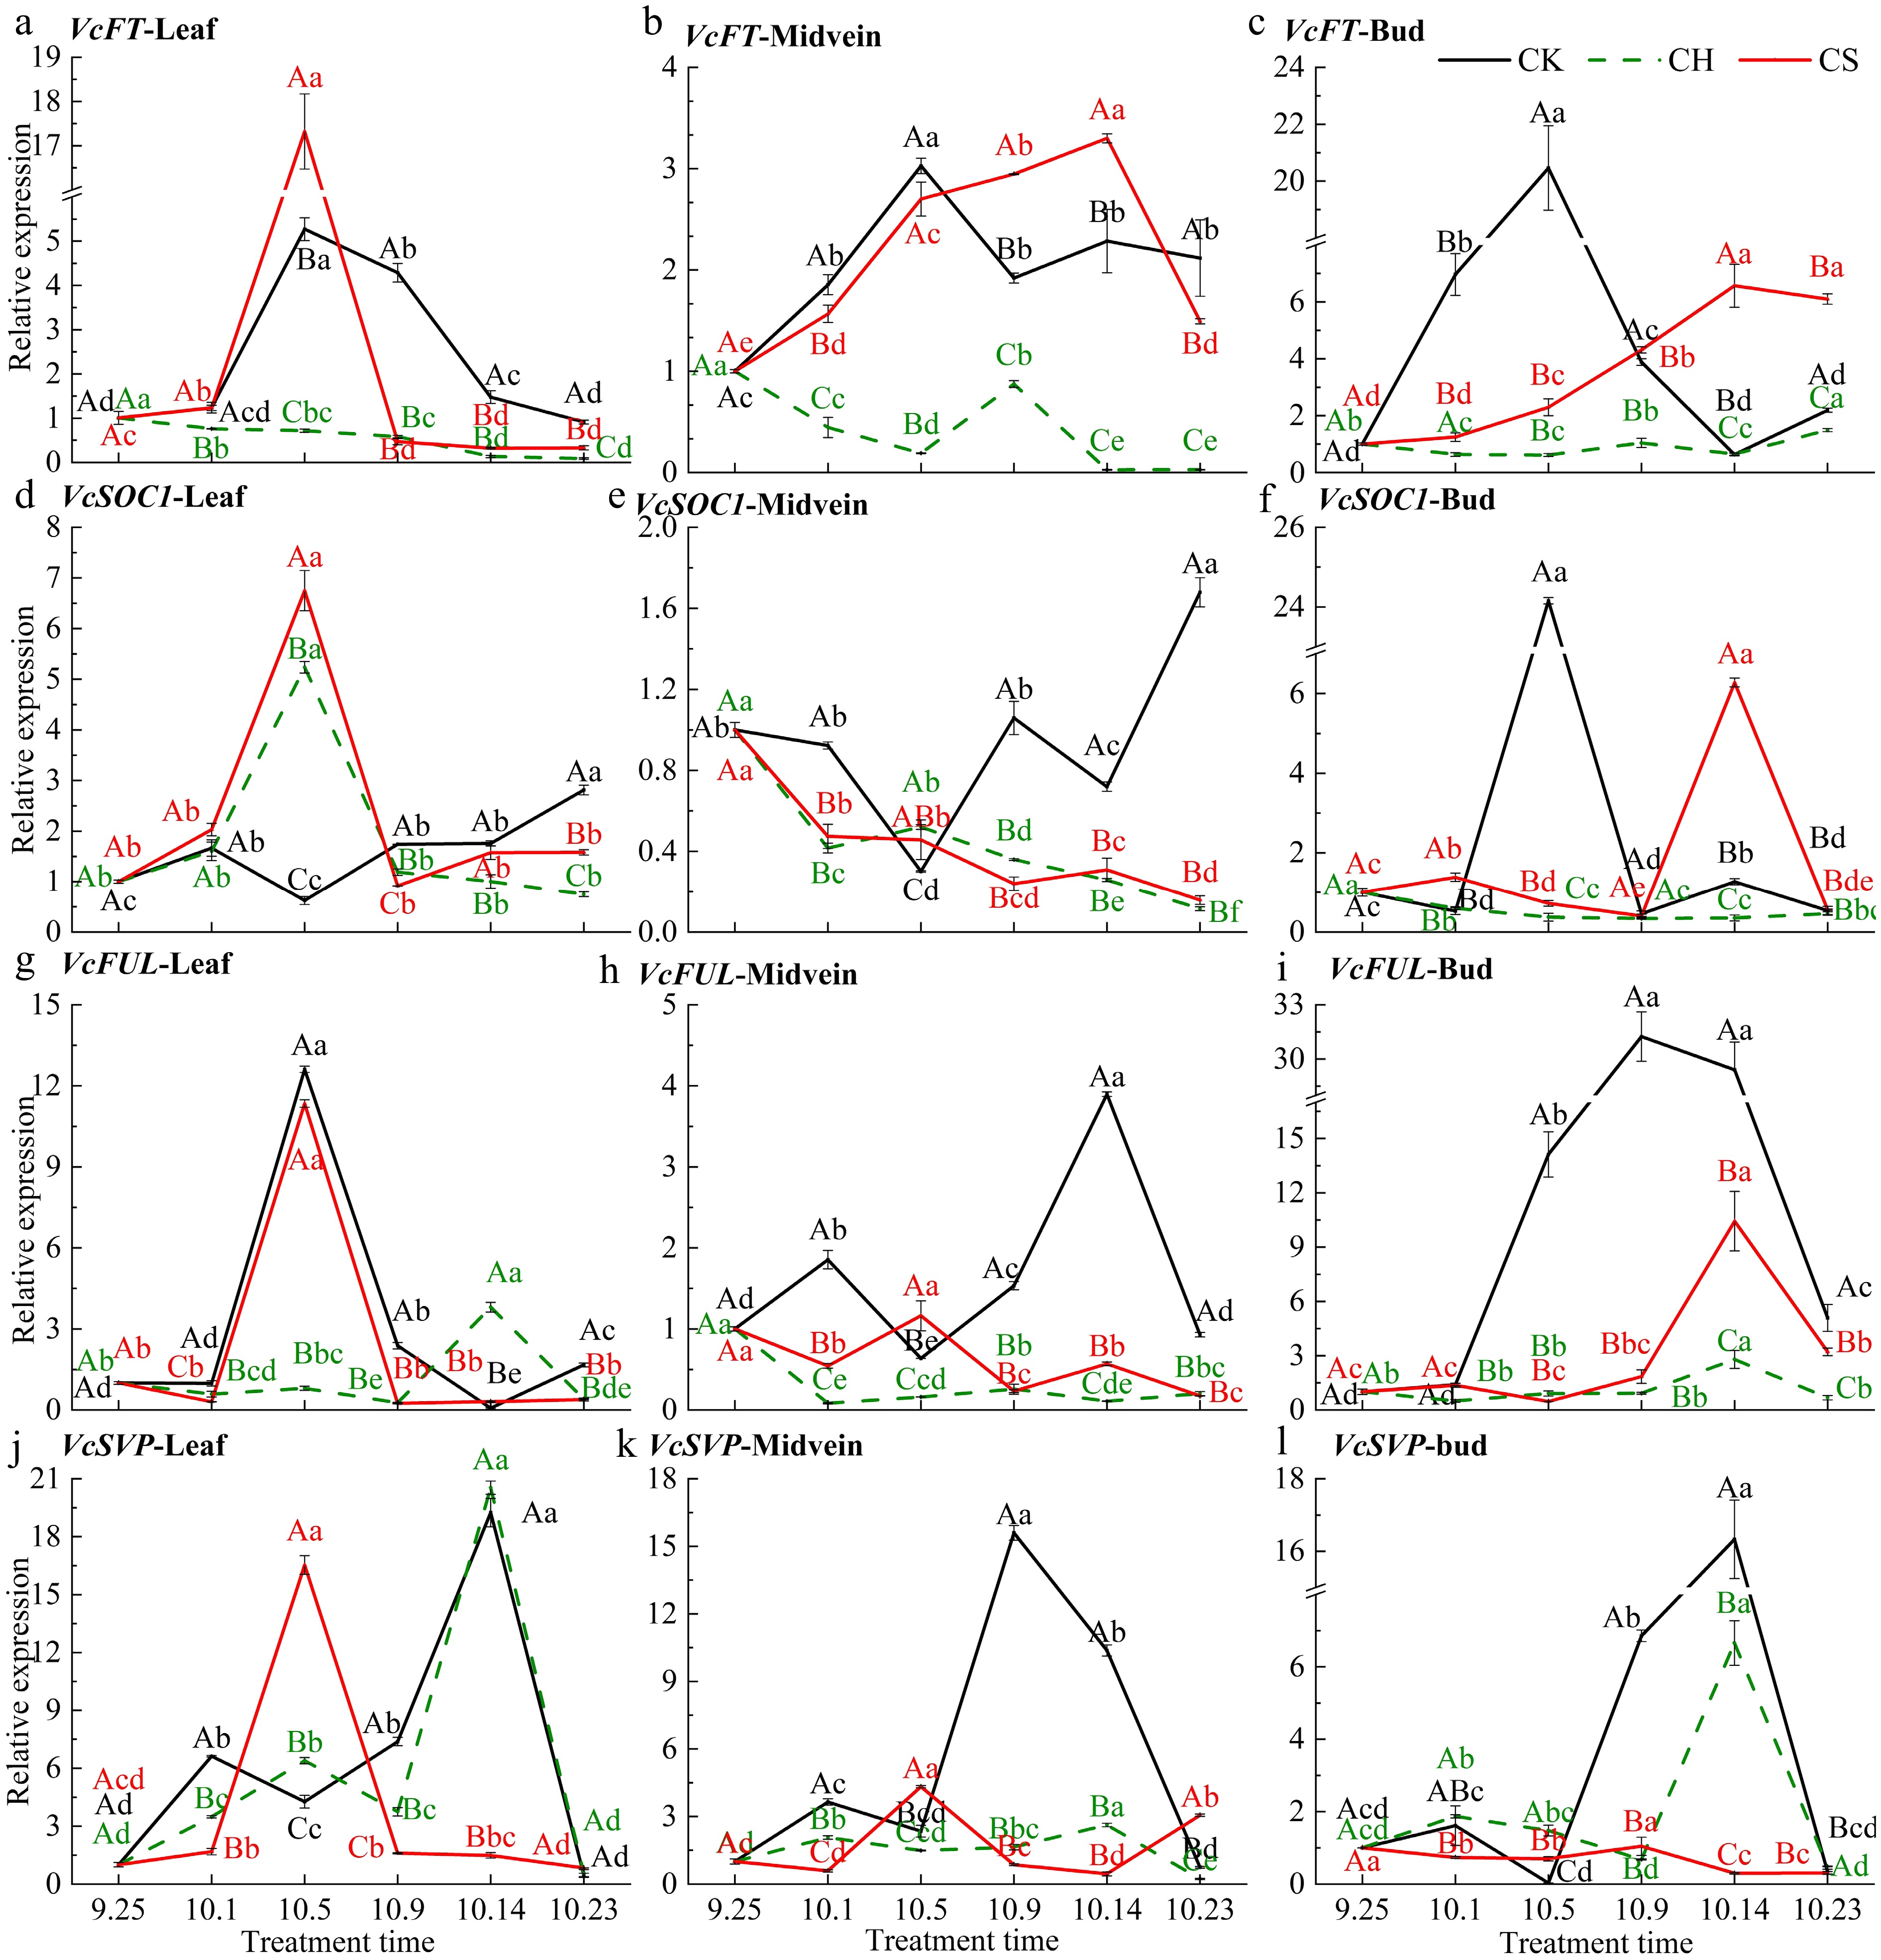
Figure 5.
Relative expression level of genes related to flowering pathways in various parts. (a)−(c) Level of VcFT in leaf, midvein and bud, respectively. (d)−(l) Relative expression level of VcSOC1, VcFUL, and VcSVP in the above-mentioned parts respectively. CK represents the only pruning group, CH represents the pruning and cutting half a leaf group, and CS represents the pruning and cutting half a leaf and sucrose treatment group. Duncan's multiple range test was used for significance analysis. Different lowercase letters indicate significant differences at the p < 0.05 level between the same treatment and different treatments, while different uppercase letters indicate significant differences at the p < 0.05 level between different treatments at the same time. The same applies below.
-
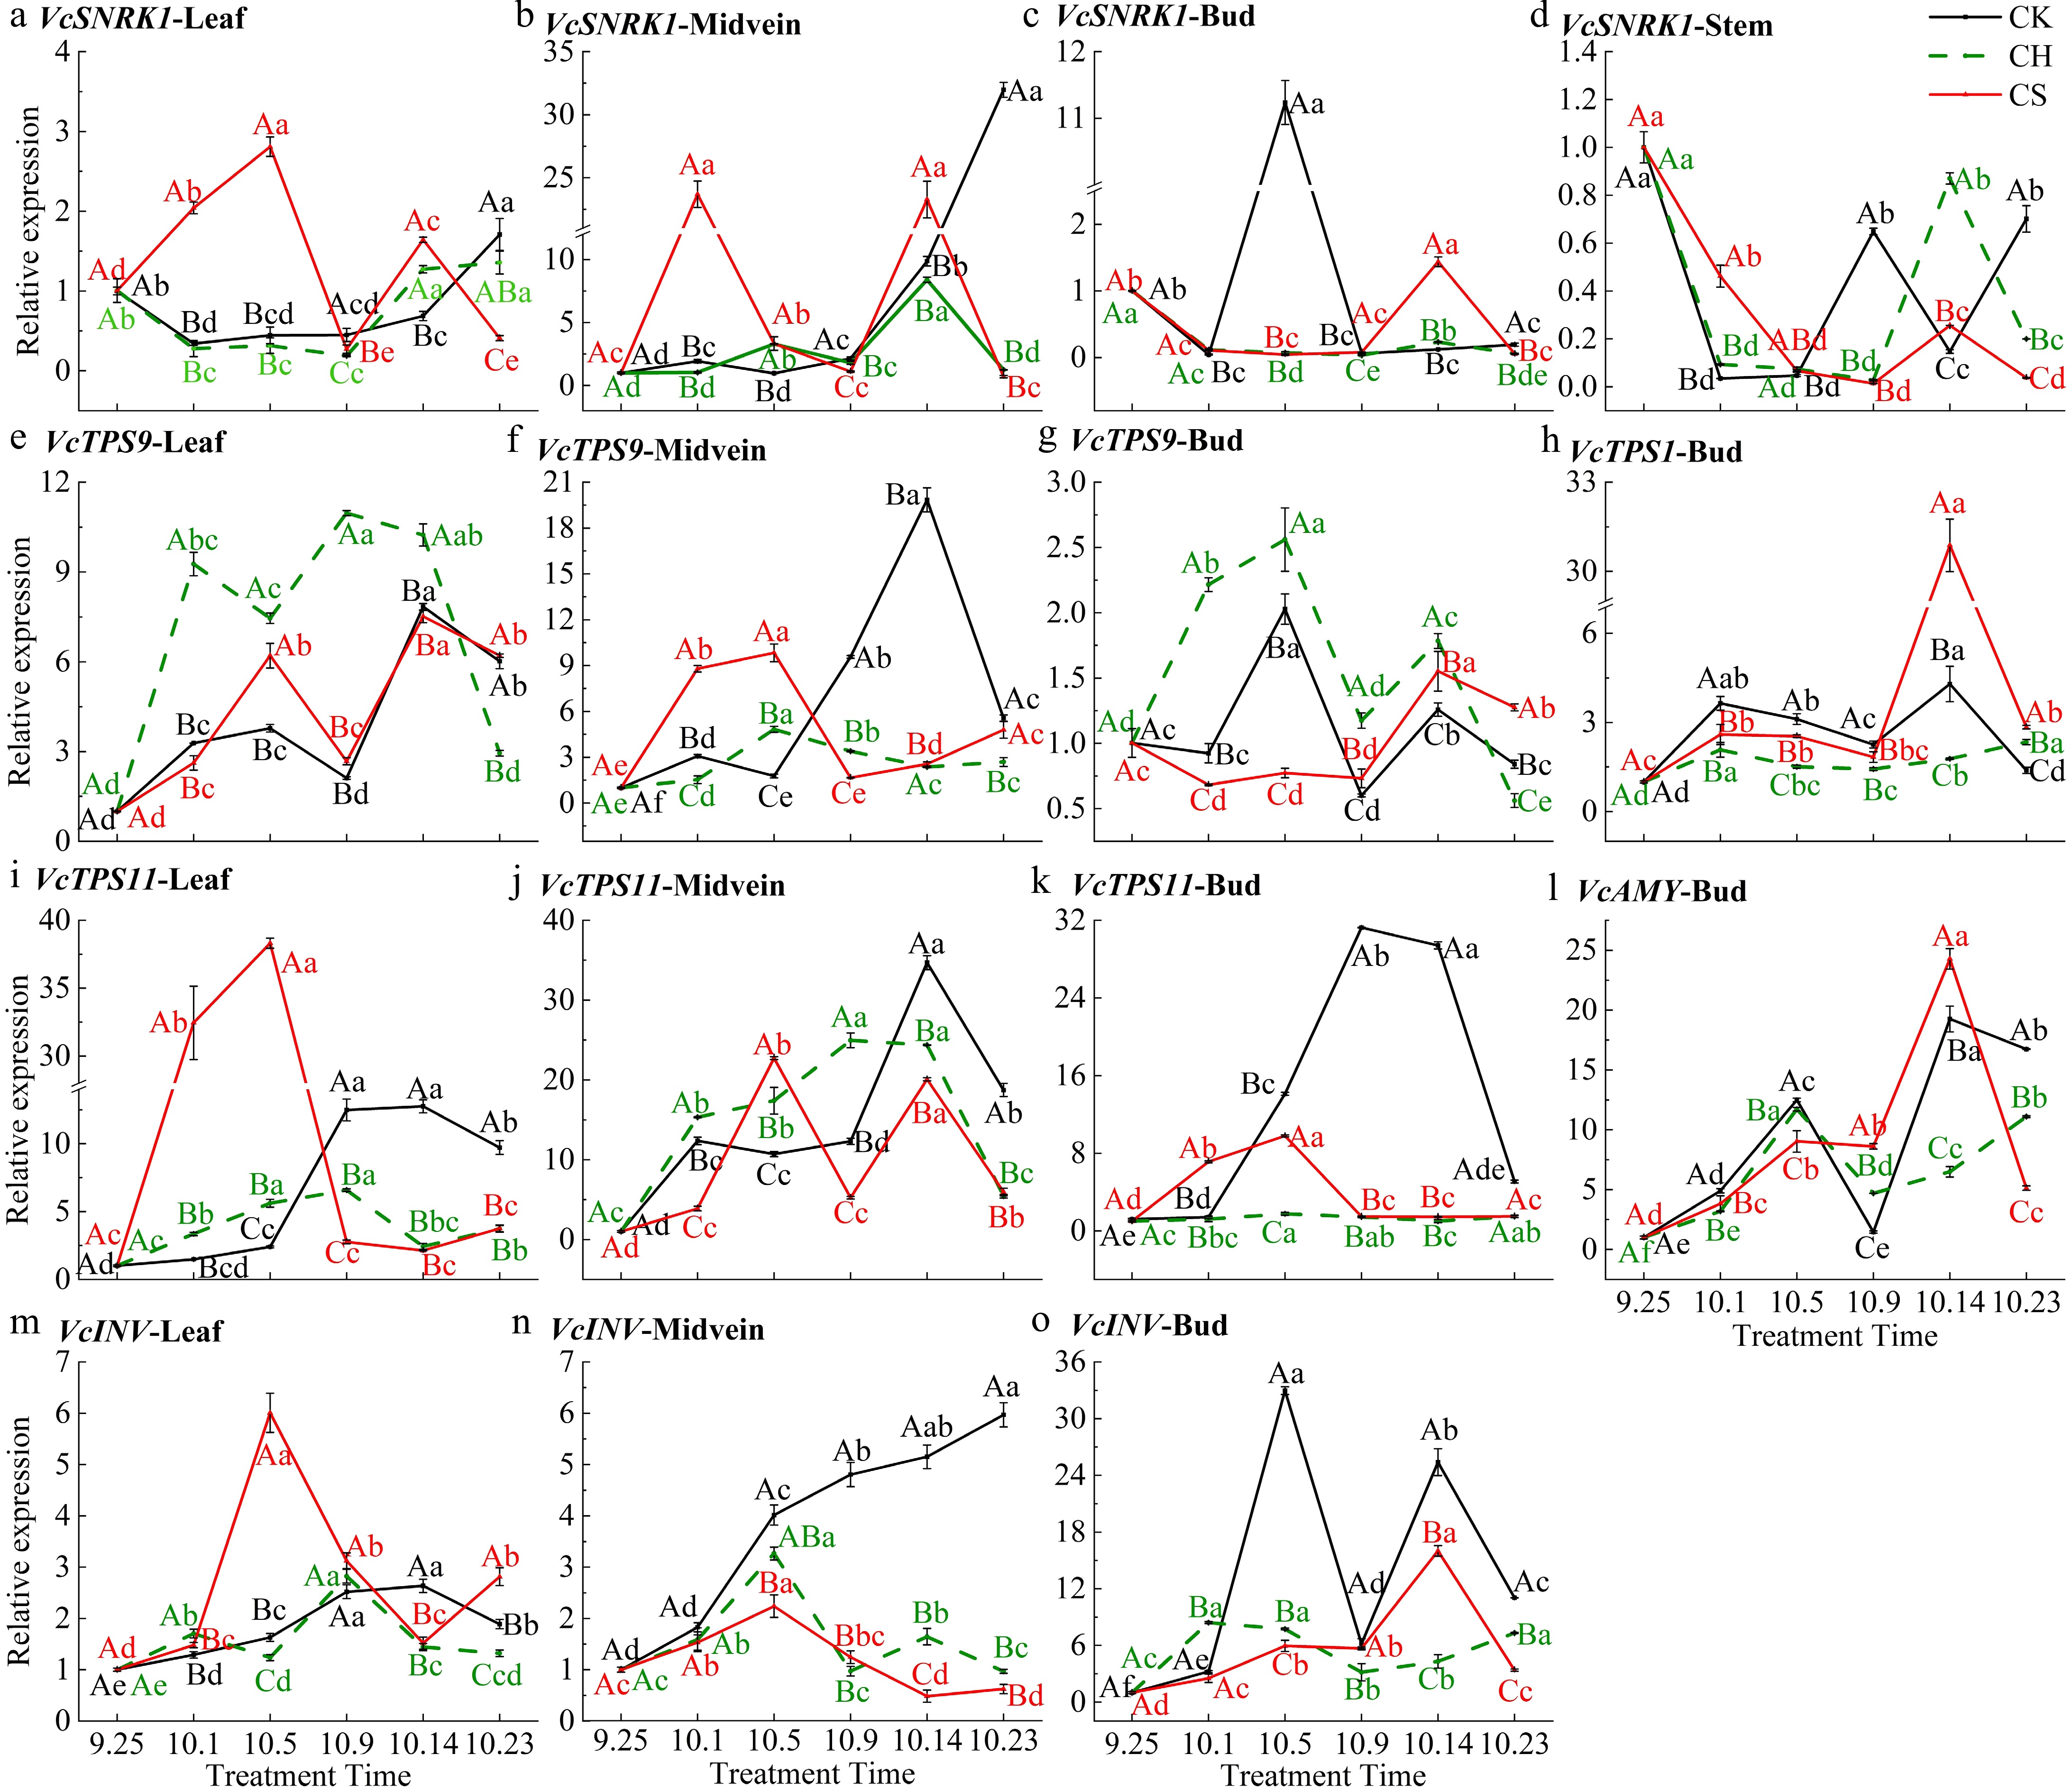
Figure 6.
Relative expression level of carbohydrate metabolism-related genes in various parts. (a)−(d) Relative expression level of VcSNRK1 in leaf, midvein, bud, and stem. (e)−(h) Relative expression level of VcTPS9 in lea, midvein, bud, stem, and VcTPS1 in bud. (i)−(l) Relative expression level of VcTPS11 in leaf, midvein, bud, and VcAMY in bud. (m)−(o) Relative expression level of VcINV in leaf, midvein, and bud. CK represents the only pruning group, CH represents the pruning and cutting half a leaf group, and CS represents the pruning and cutting half a leaf and sucrose treatment group.
-
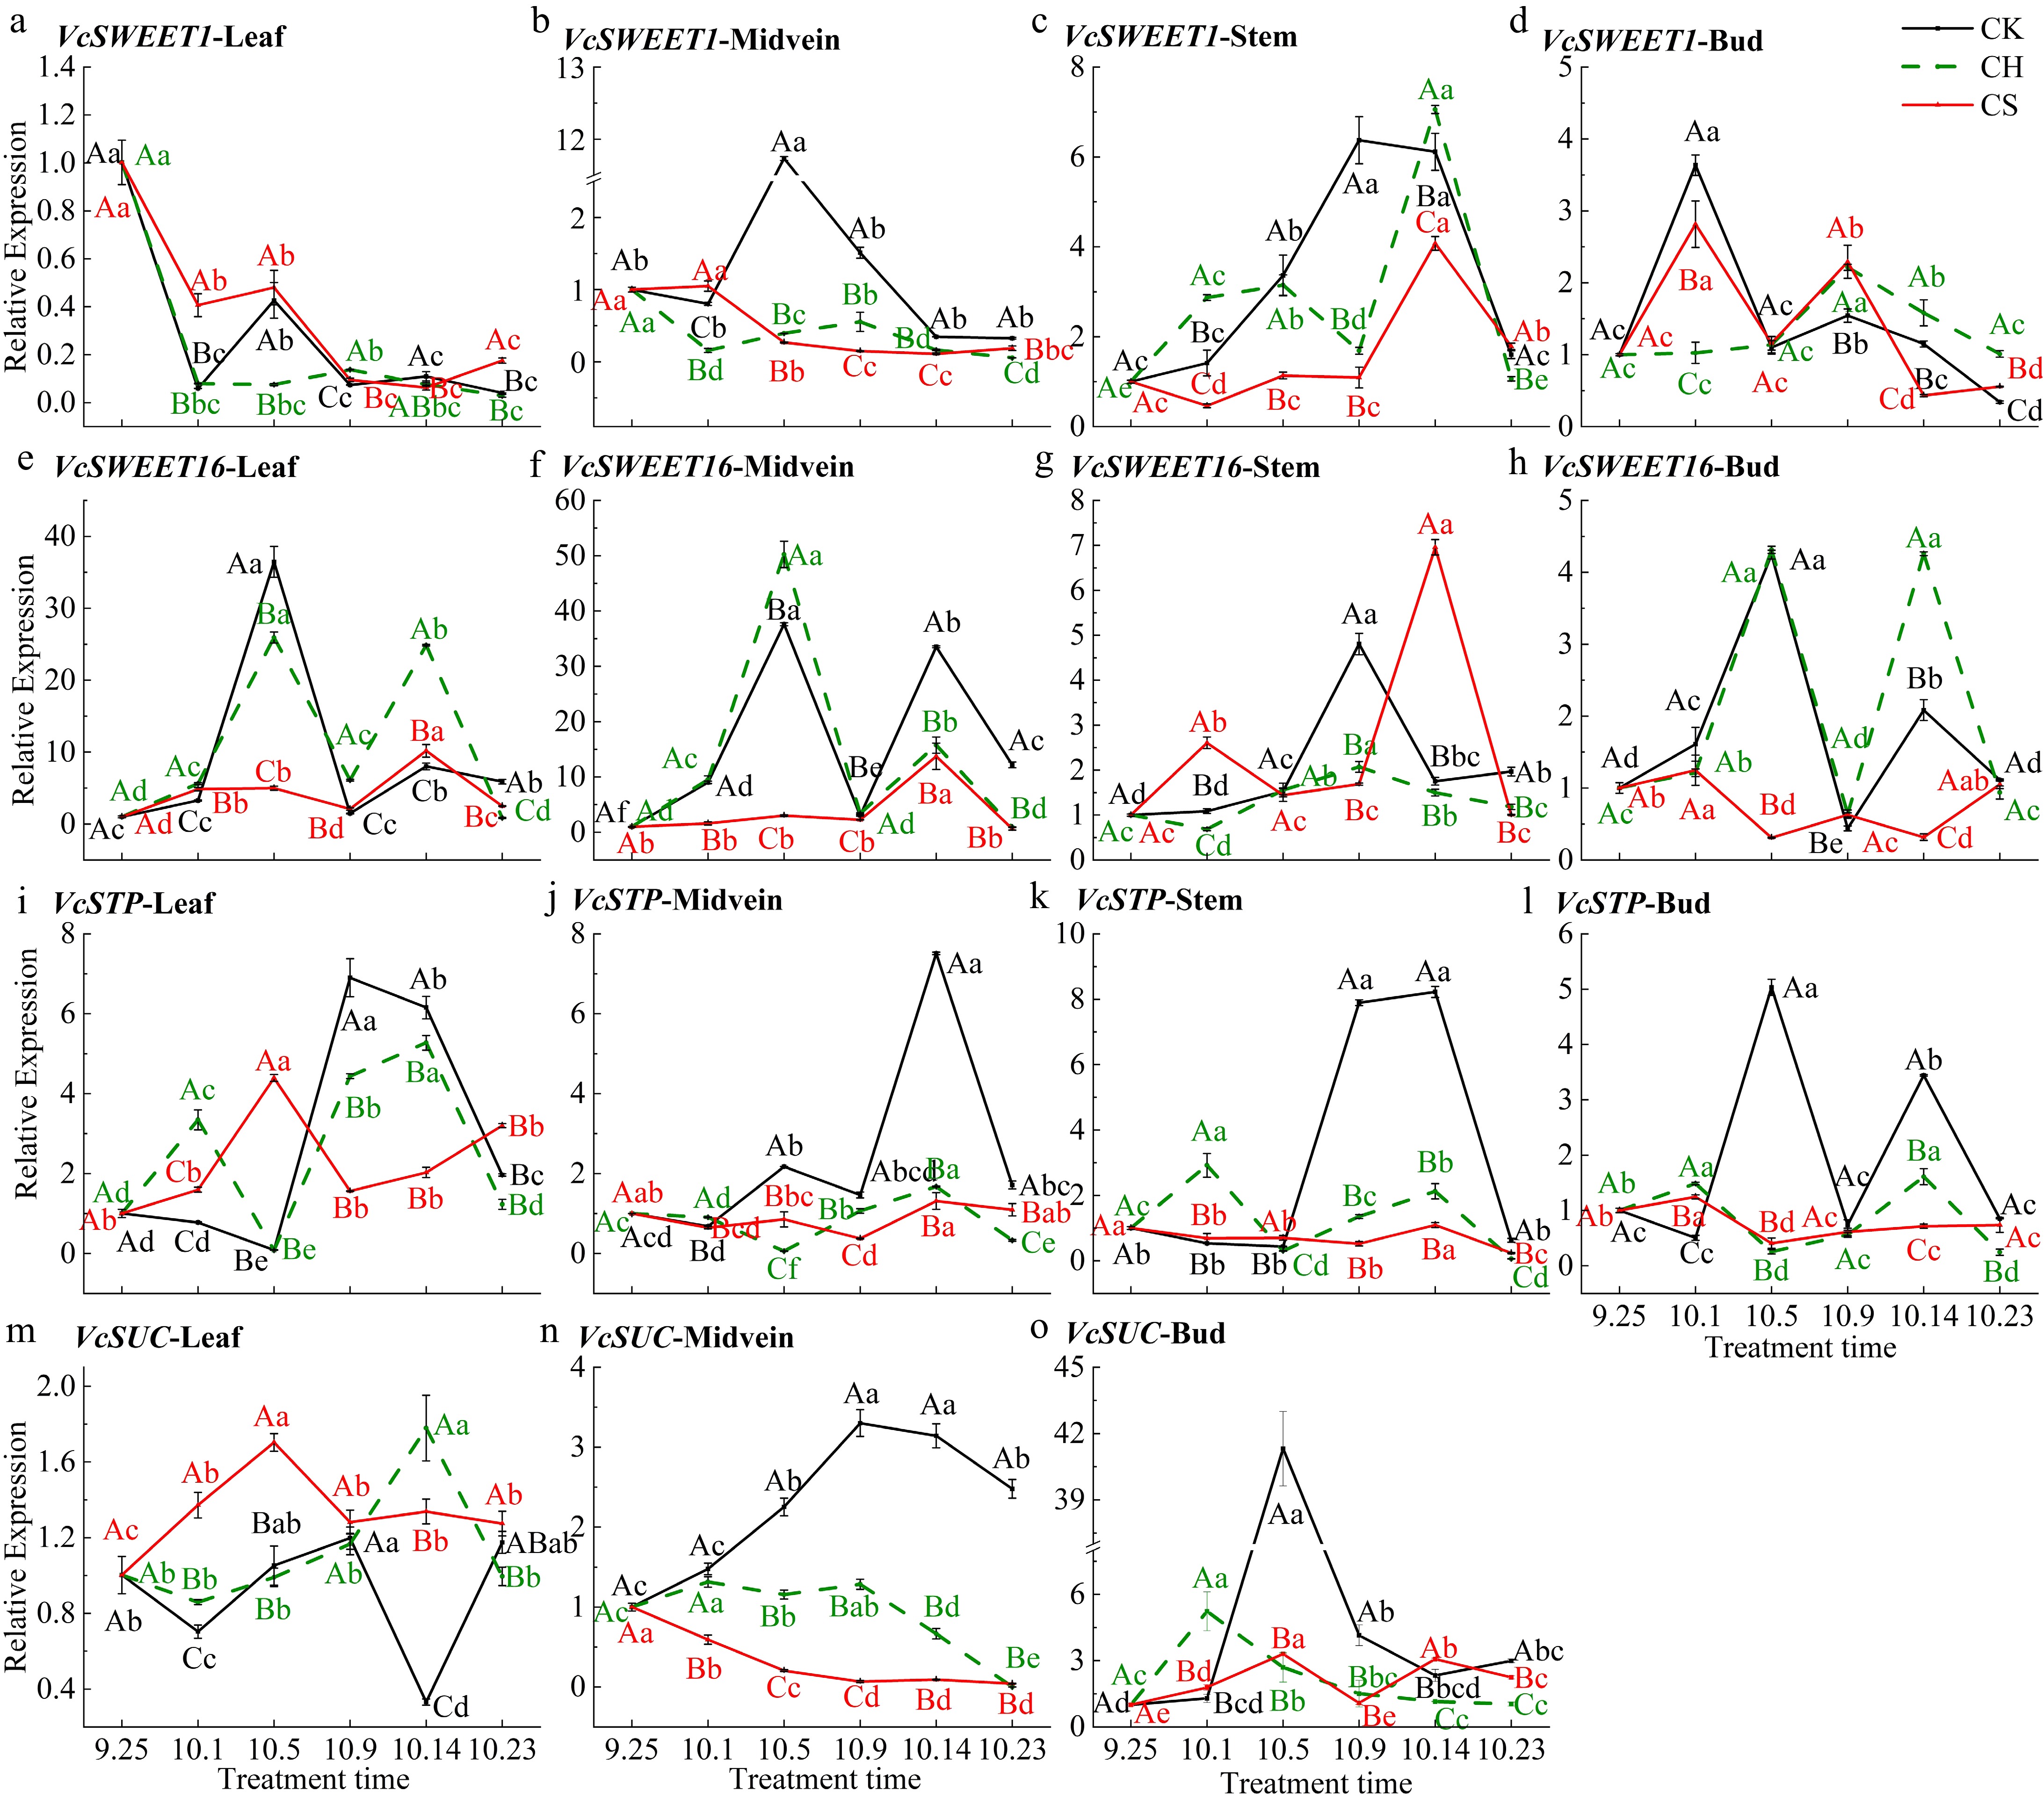
Figure 7.
Relative expression level of carbohydrate transport-related genes in various parts. (a), (e), (i) and (m) Relative expression level of VcSWEET1, VcSWEET16, VcSTP, and VcSUC in leaf. (b), (f), (j) and (n) Relative expression level of VcSWEET1, VcSWEET16, VcSTP, and VcSUC in midvein.(c), (g) and (k) Relative expression level of VcSWEET1, VcSWEET16, VcSTP in the stem. (d), (h), (l) and (o) Relative expression level of VcSWEET1, VcSWEET16, VcSTP, and VcSUC in bud, respectively. CK represents the only pruning group, CH represents the pruning and cutting half a leaf group, and CS represents the pruning and cutting half a leaf and sucrose treatment group.
-
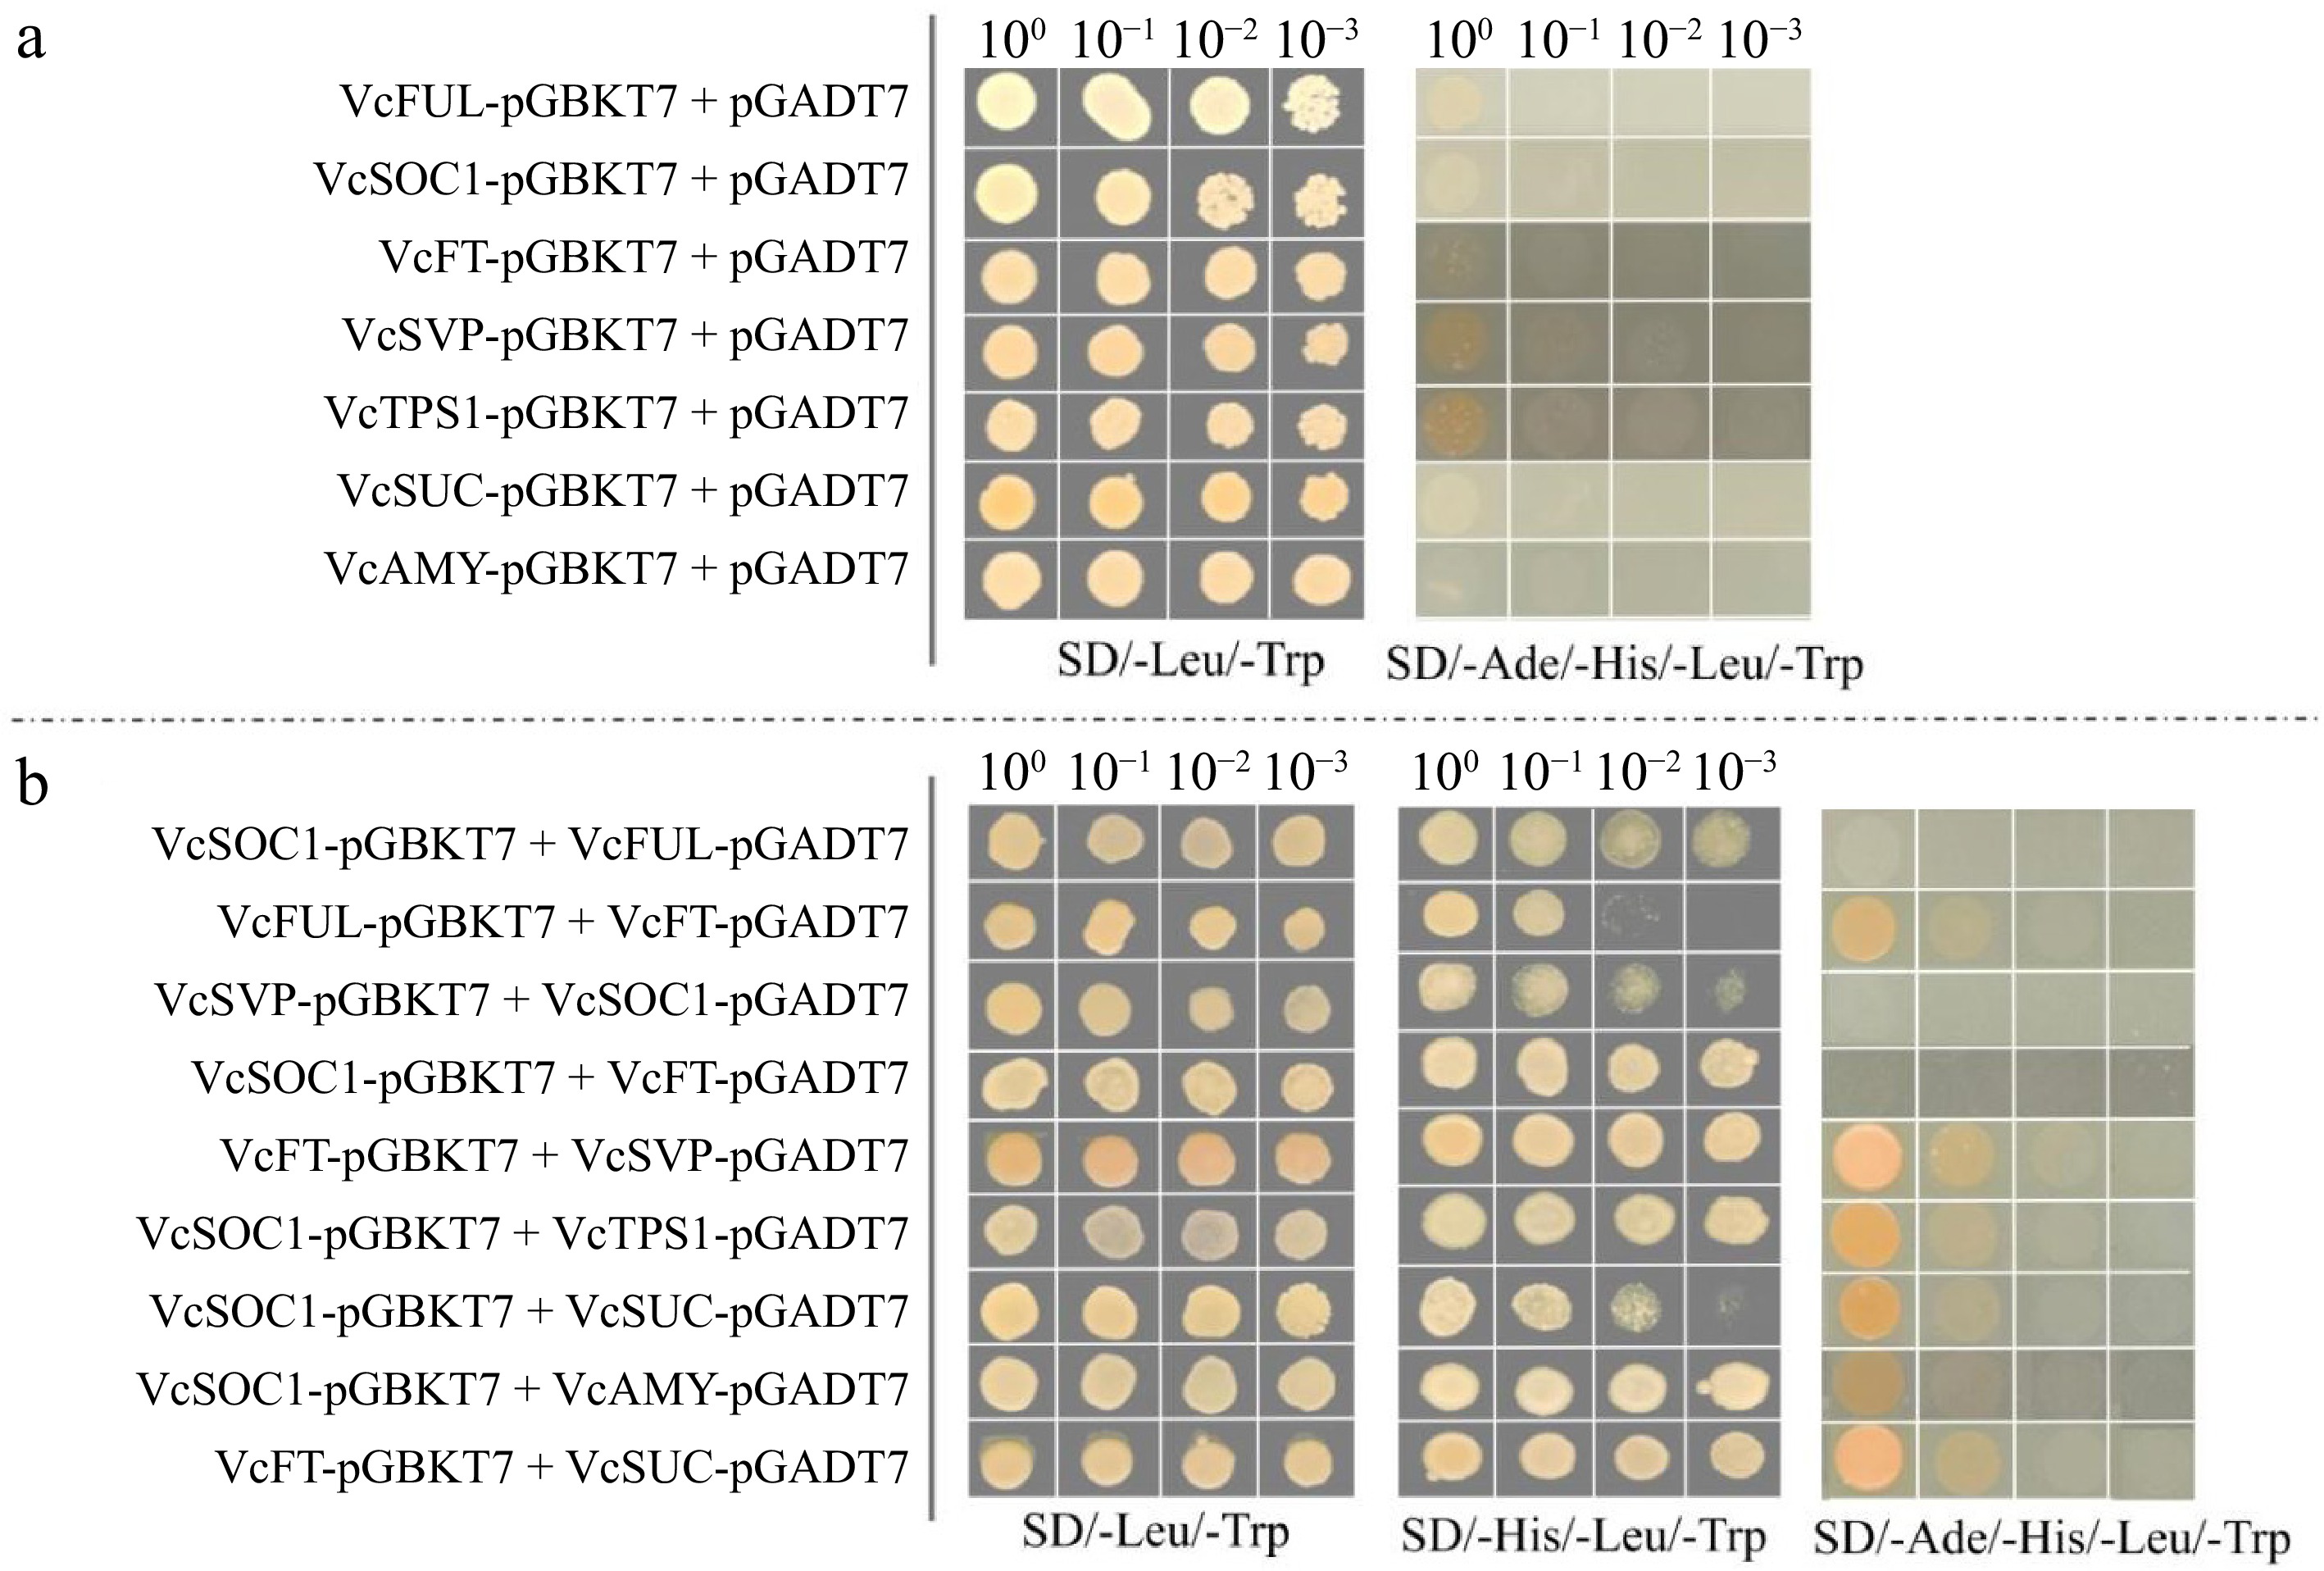
Figure 8.
Self-activation detection and interaction verification of the yeast two-hybrid. Yeast two-hybrid assay revealing the interaction of flowering proteins with VcTPS1, VcSUC and VcAMY proteins. (a) Self-activation detection. (b) The interaction verification. SD/-Trp-leu/, SD/-His-Trp-Leu/, and SD/-Ade-His-Trp-Leu/ are DDO, TDO and QDO media, respectively. This experiment was replicated three times.
-
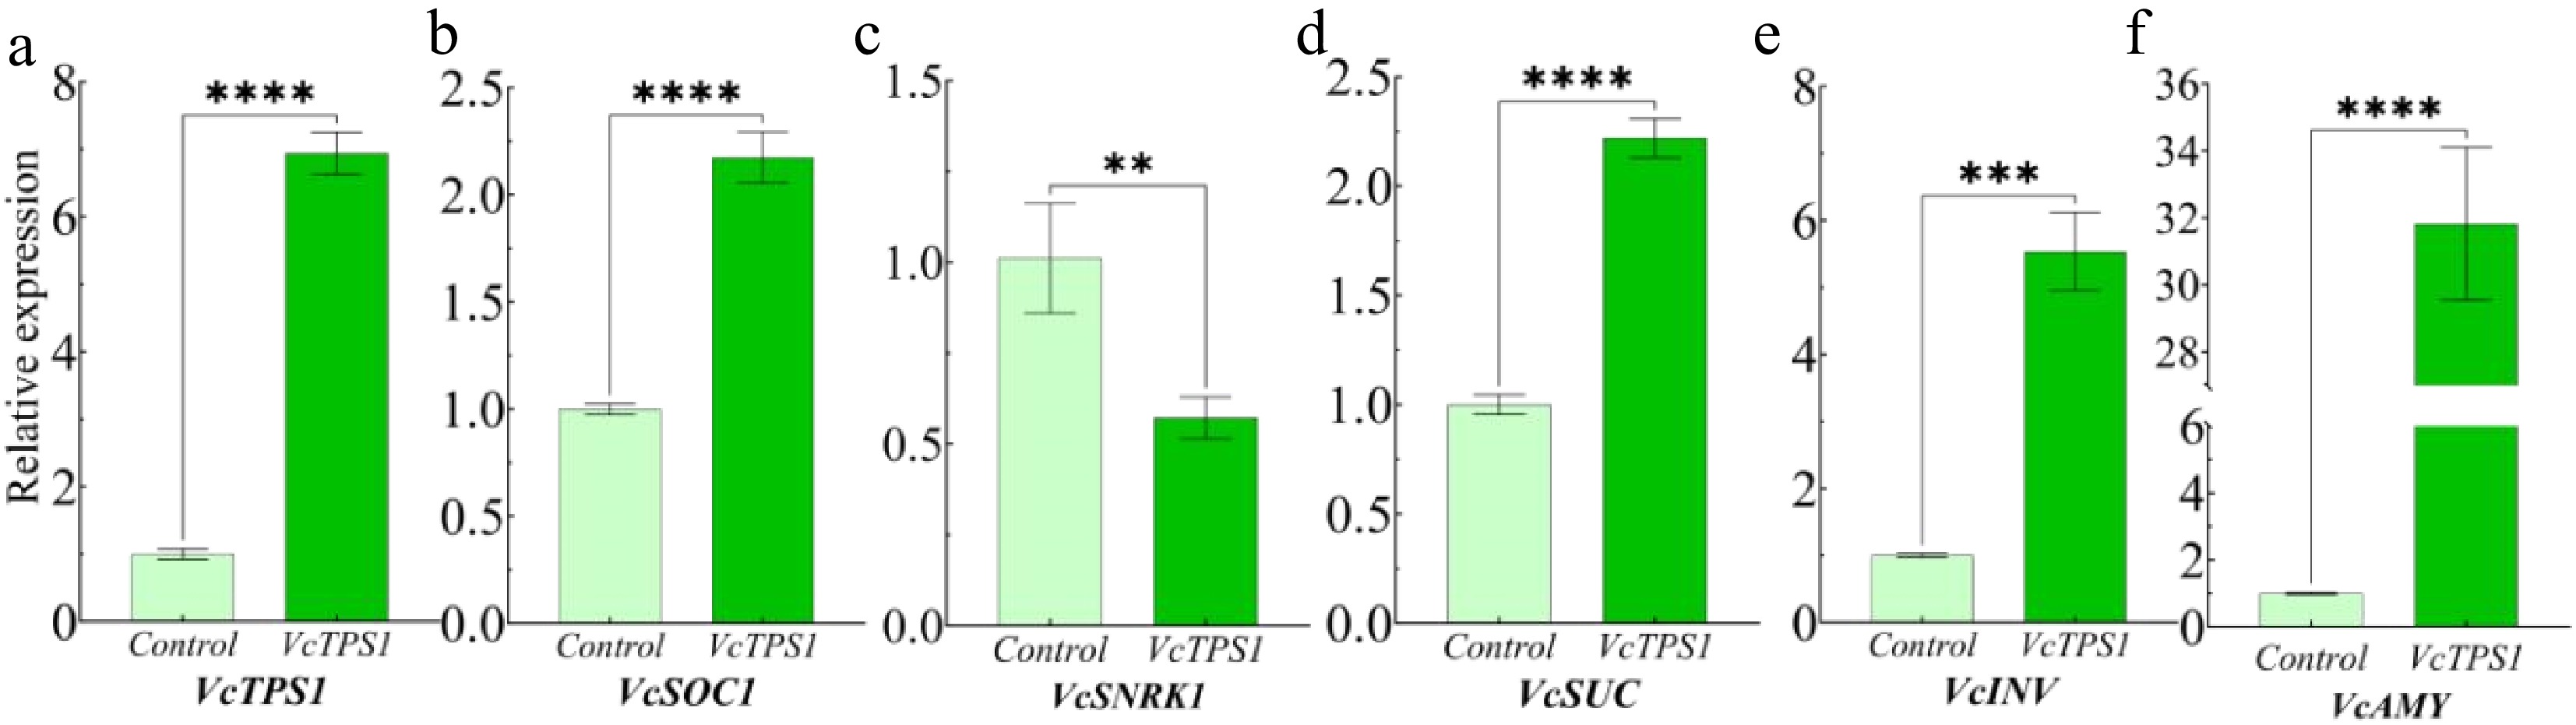
Figure 9.
Transient conversion expression analysis. (a)−(f) Relative expression level of VcTPS1, VcSOC1, VcSNRK1, VcSUC, VcINV, and VcAMY genes in blueberries transiently transformed with VcTPS1. ** represents very significant difference (p ≤ 0.01), *** represents extremely significant difference (p ≤ 0.001), **** represents extremely significant difference (p ≤ 0.0001).
-
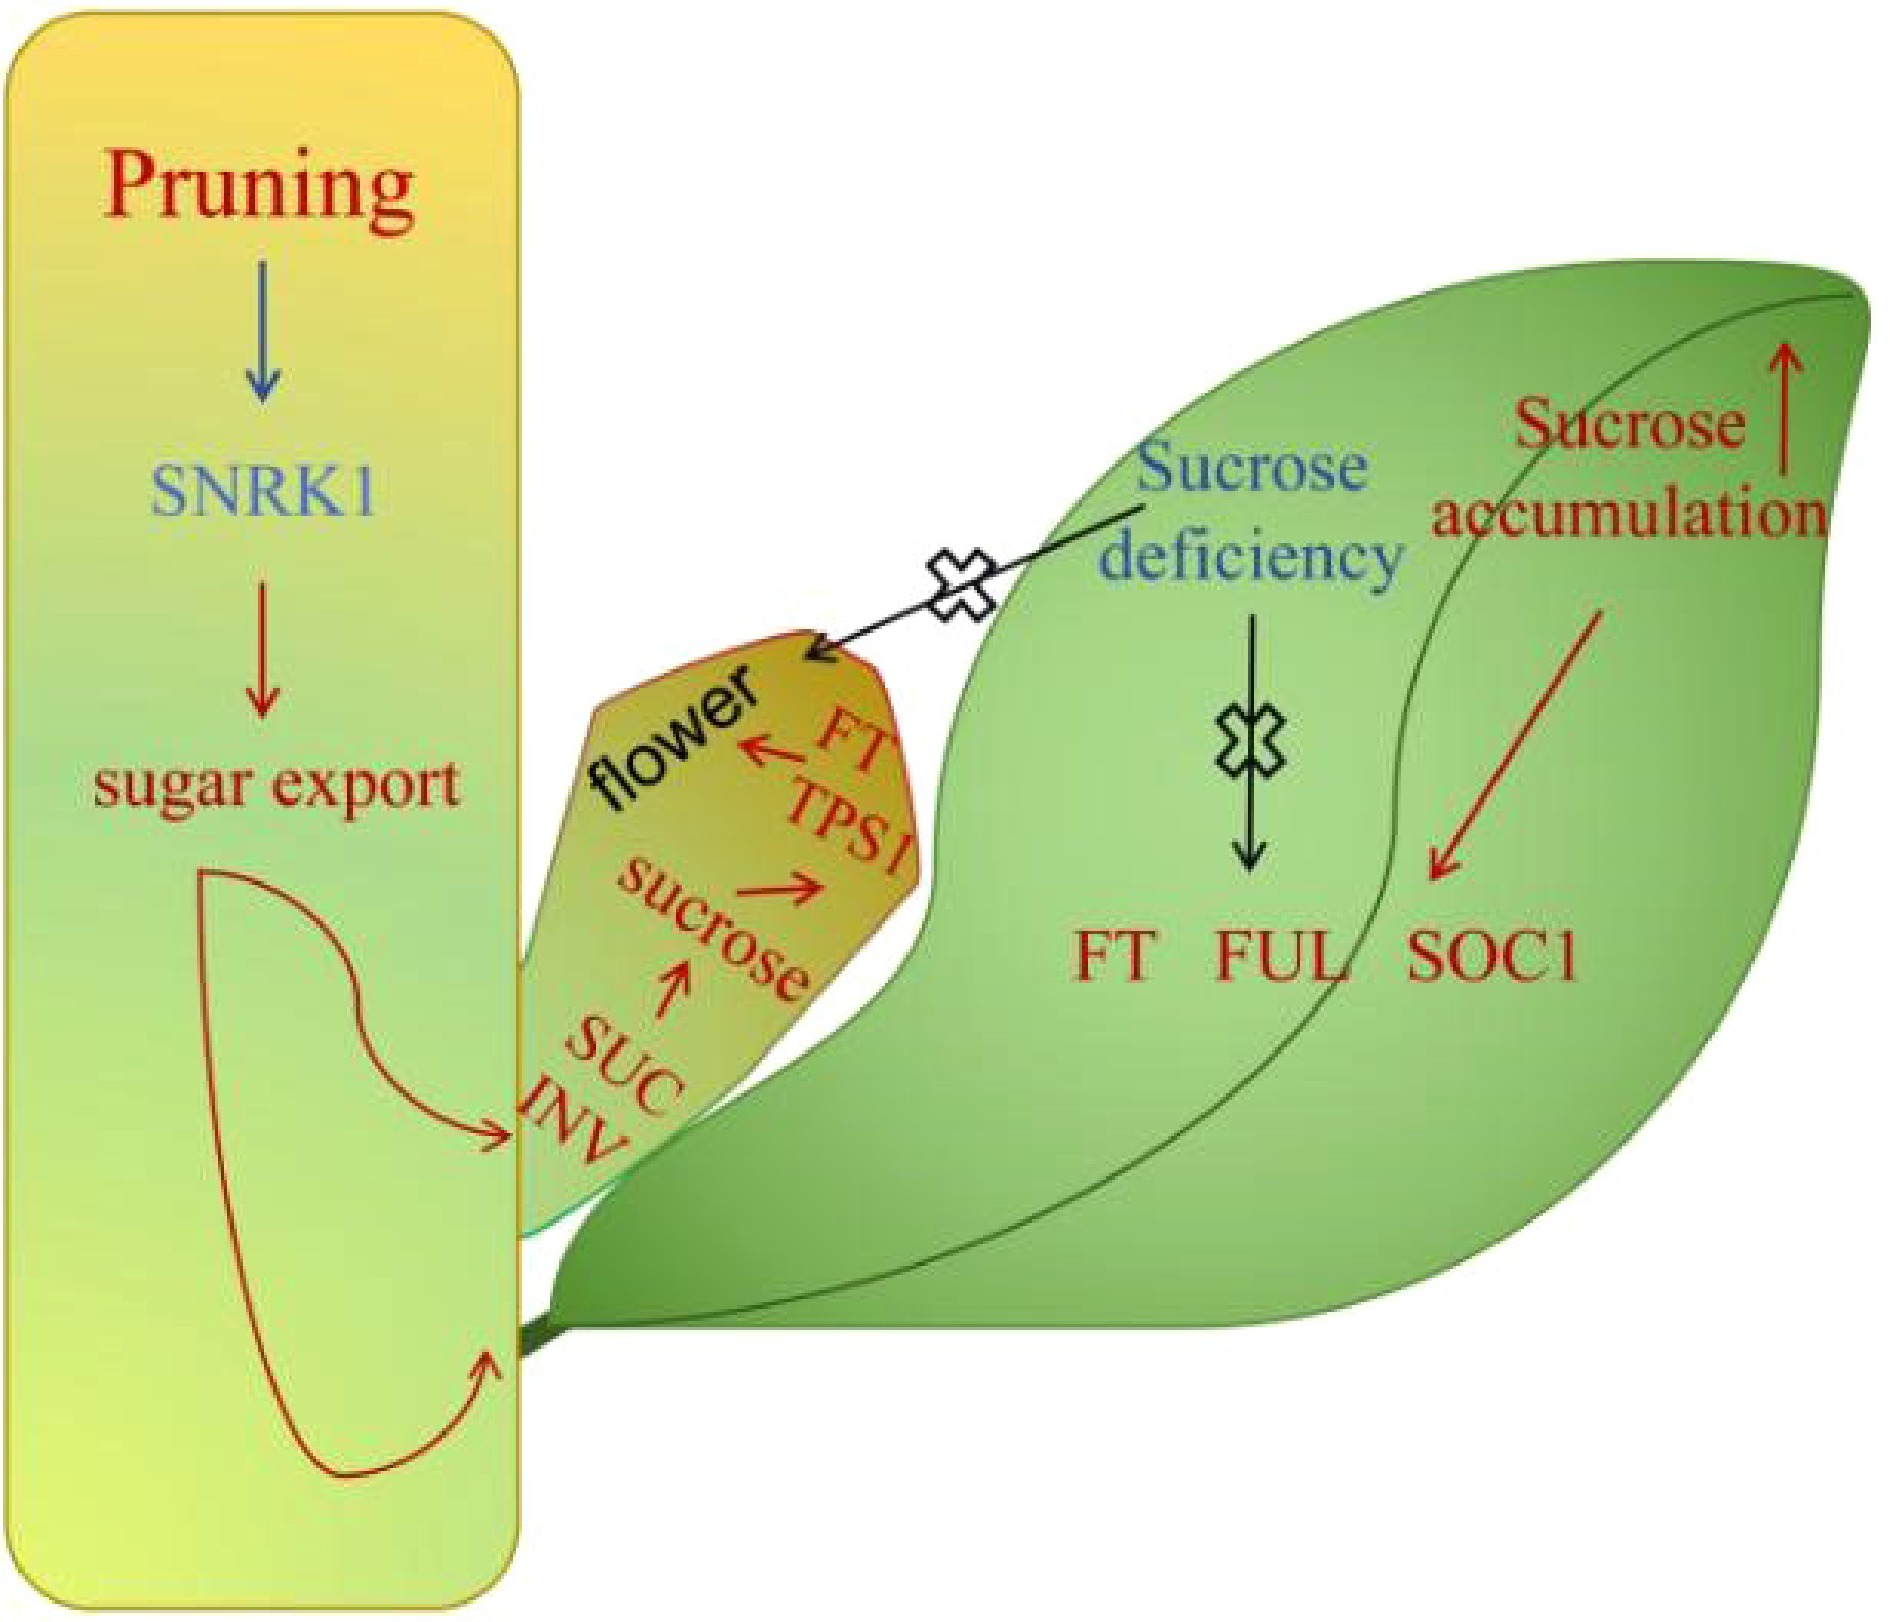
Figure 10.
Hypothetical model depicting the flowering regulation promoted by pruning in blueberries. After pruning, the sugar content in the stem decreases, and the expression levels of VcFT, VcFUL, and VcSOC1 increase as the leaf sucrose continues to accumulate to a certain level. The increased expression levels of VcSUC and VcINV promote sucrose accumulation in buds, and the participation of VcFT and VcTPS1 jointly induces flowering. However, if the sucrose content in the cutting leaves is deficient, the expression of the above genes cannot be induced, and the process of flower bud induction cannot begin.
Figures
(10)
Tables
(0)