-
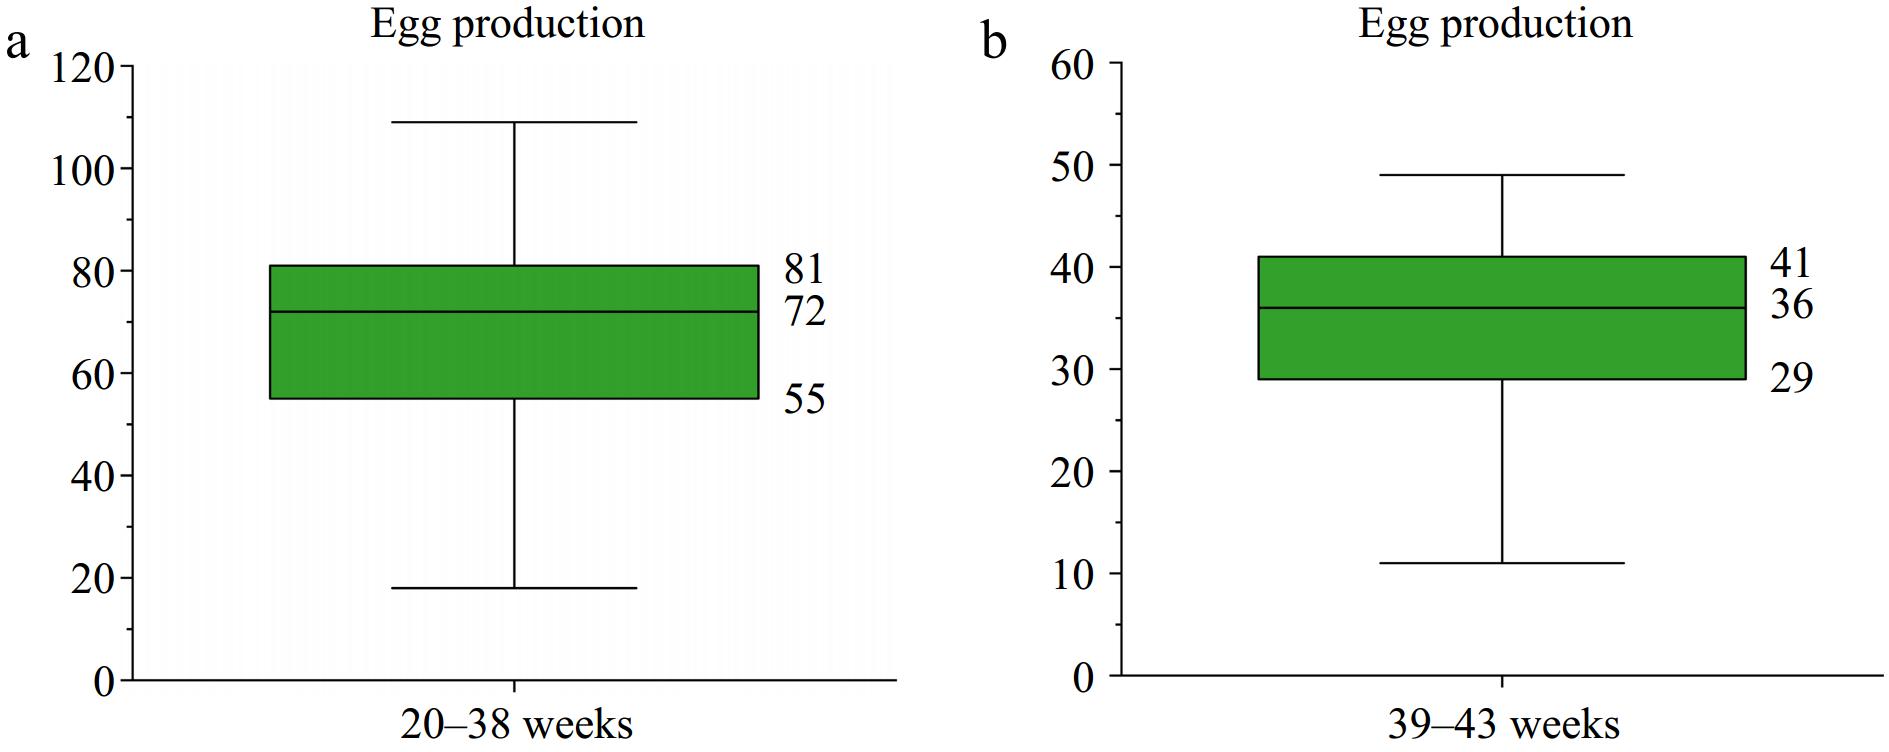
Figure 1.
Egg production of 704 Taihang chickens. (a) Egg production from 20 to 38 weeks. (b) Egg production from 39 to 43 weeks.
-
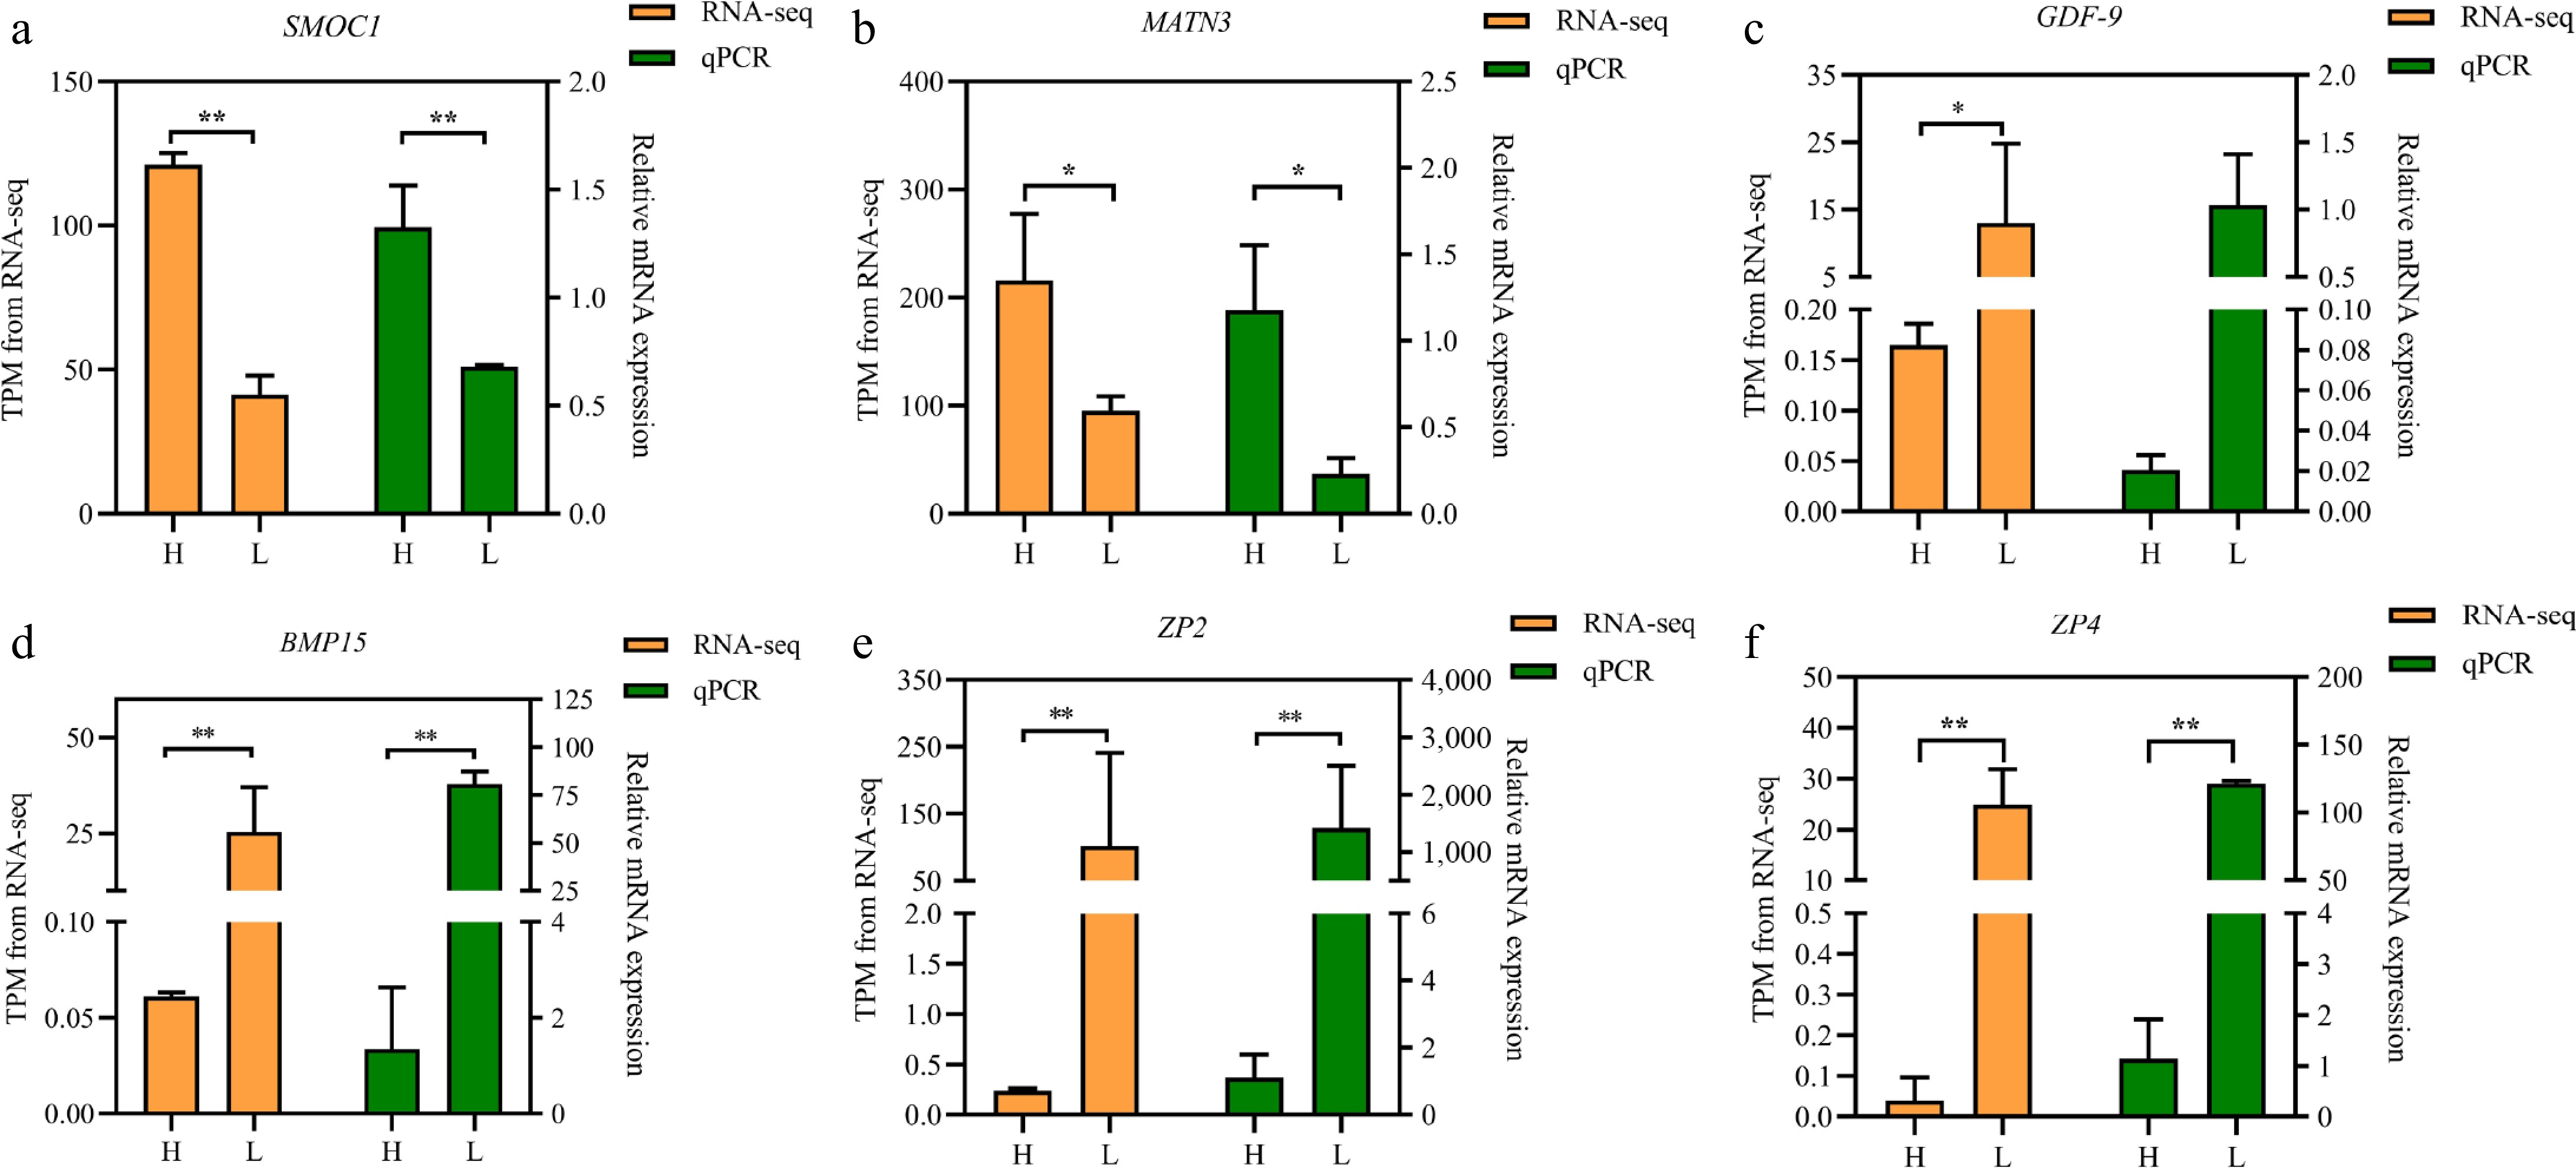
Figure 2.
Comparison of the gene expression of RNA-seq with qPCR of 6 randomly selected genes. (a) SMOC1, (b) MATN3, (c) GDF-9, (d) BMP15, (e) ZP2, and (f) ZP4. Note: The left and right axes represent the gene expression using TPM units by RNA-seq and the expression levels verified by qPCR, respectively. The yellow column indicates TPM value; the green column indicates qPCR. All experiments are performed in triplicate, and the data are expressed as the mean ± SEM (* p < 0.05; ** p < 0.01).
-
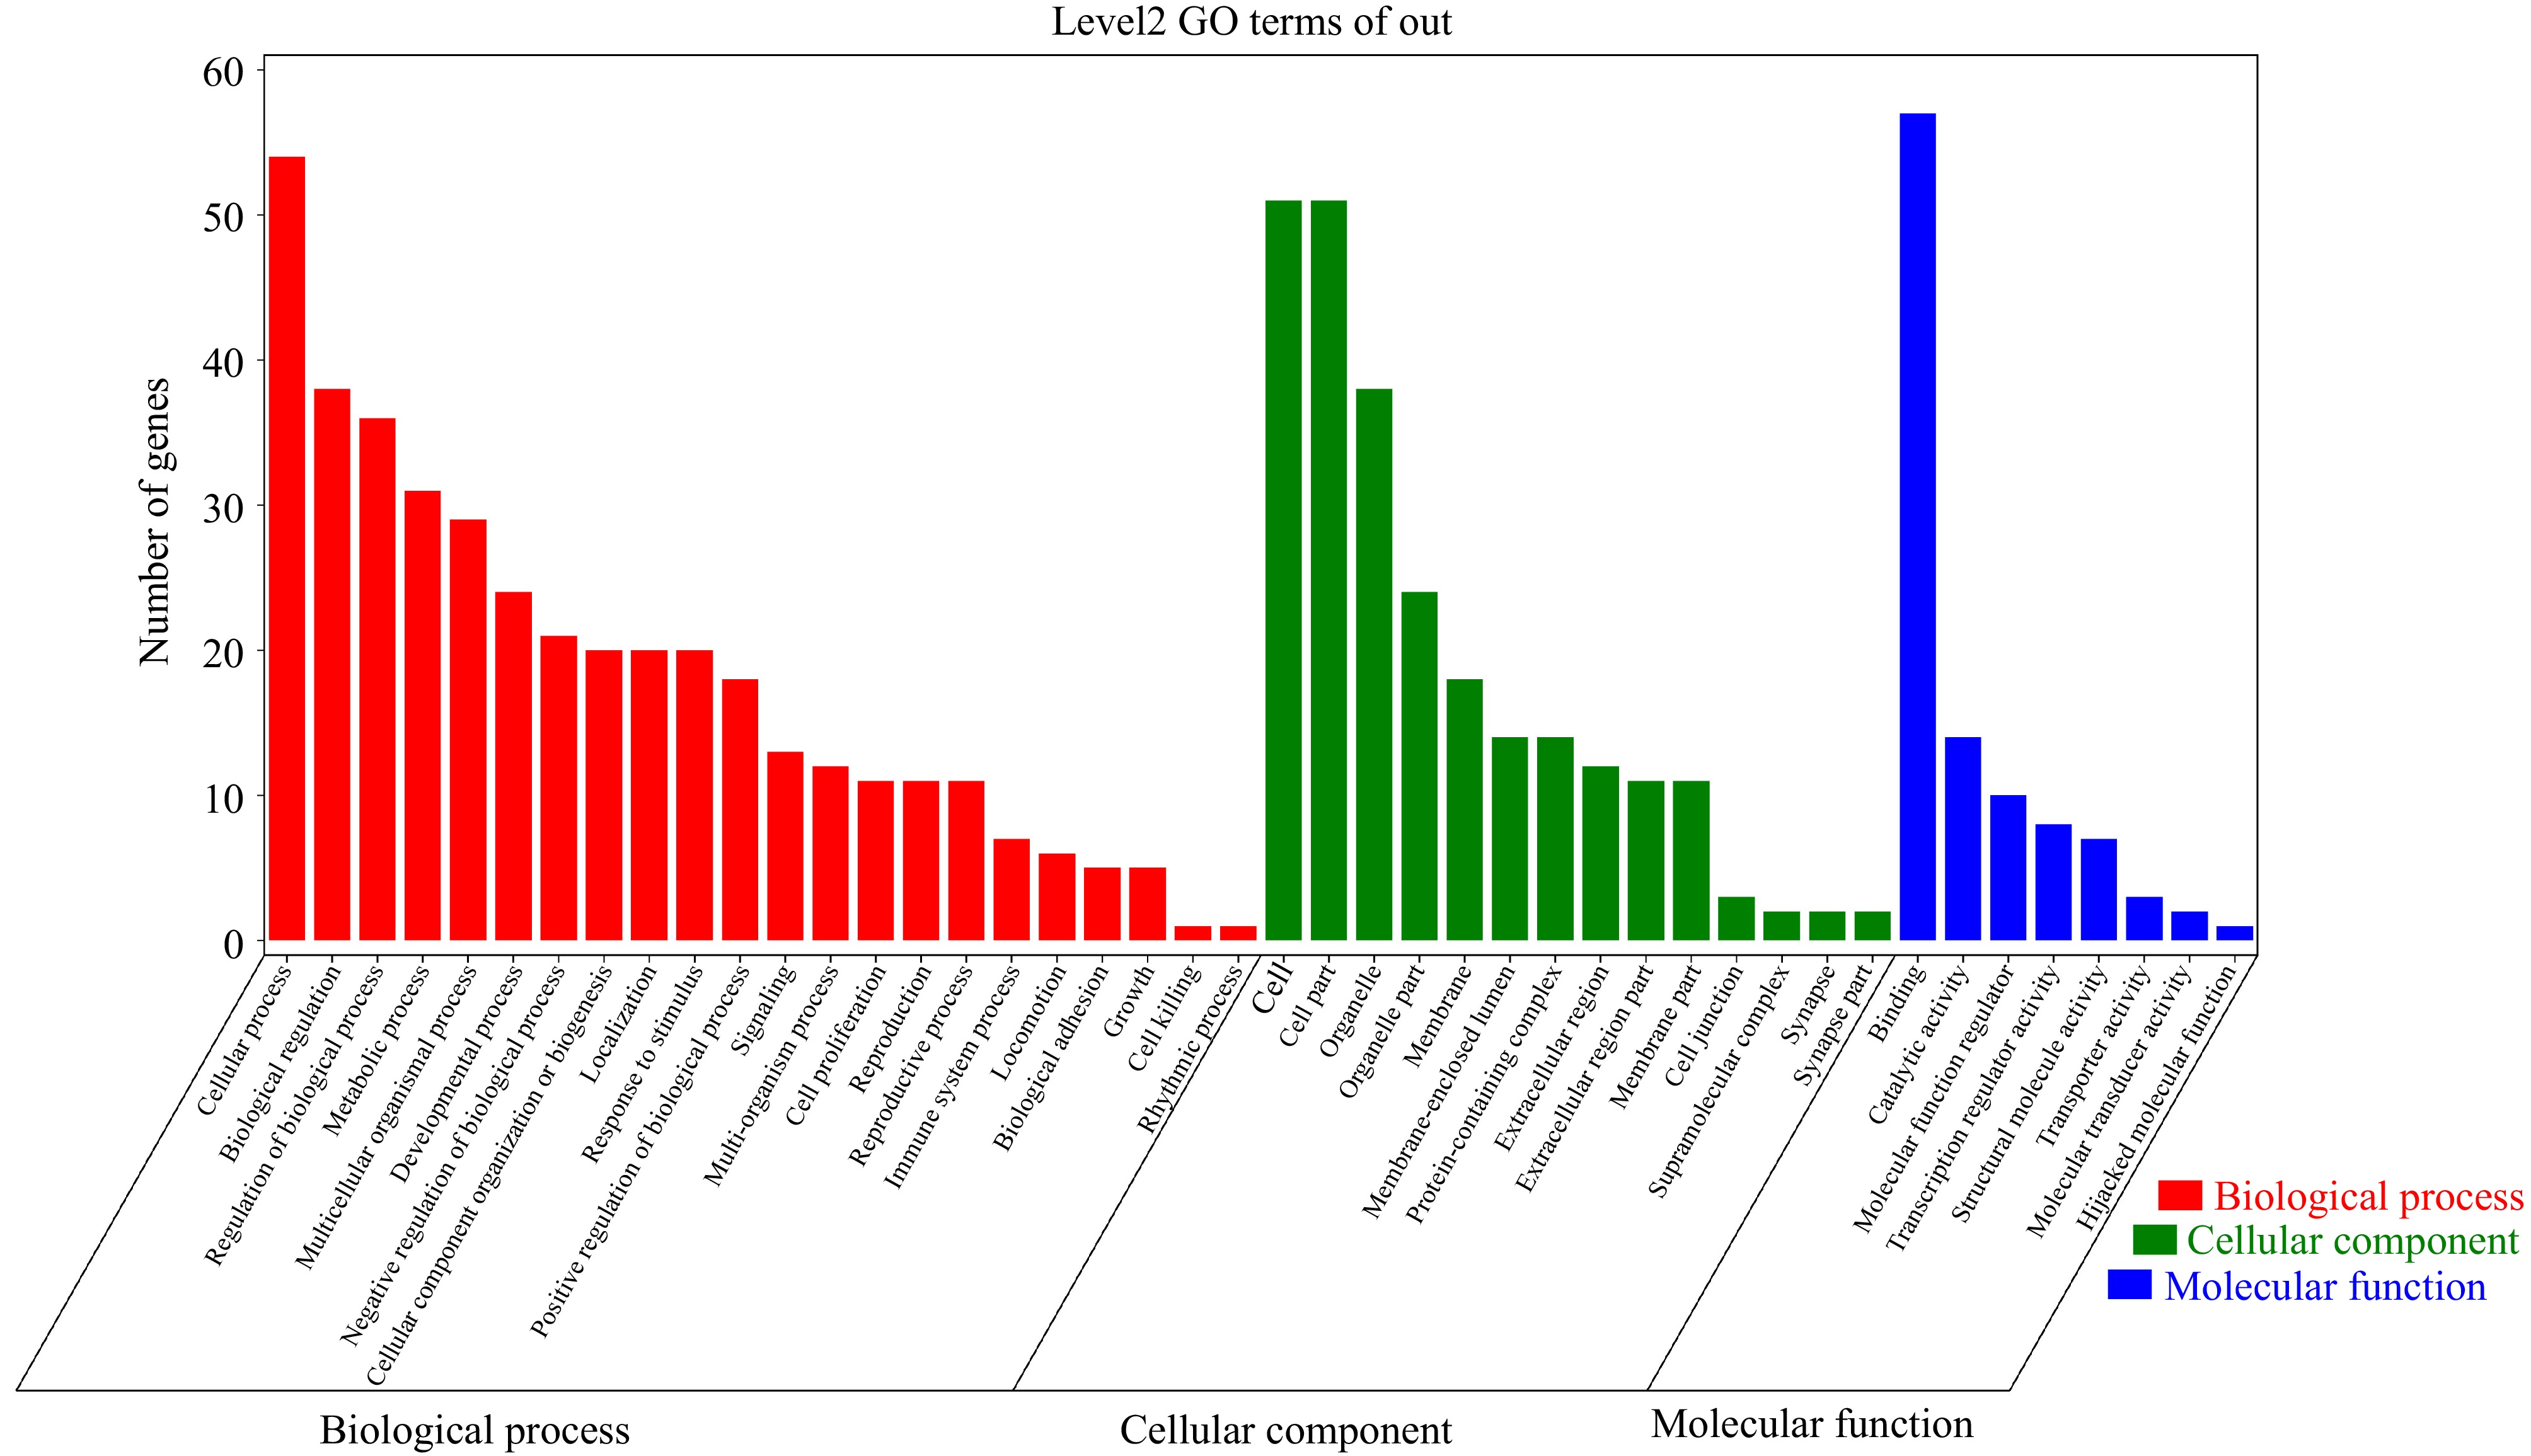
Figure 3.
GO terms enrichment analysis of DEGs.
-
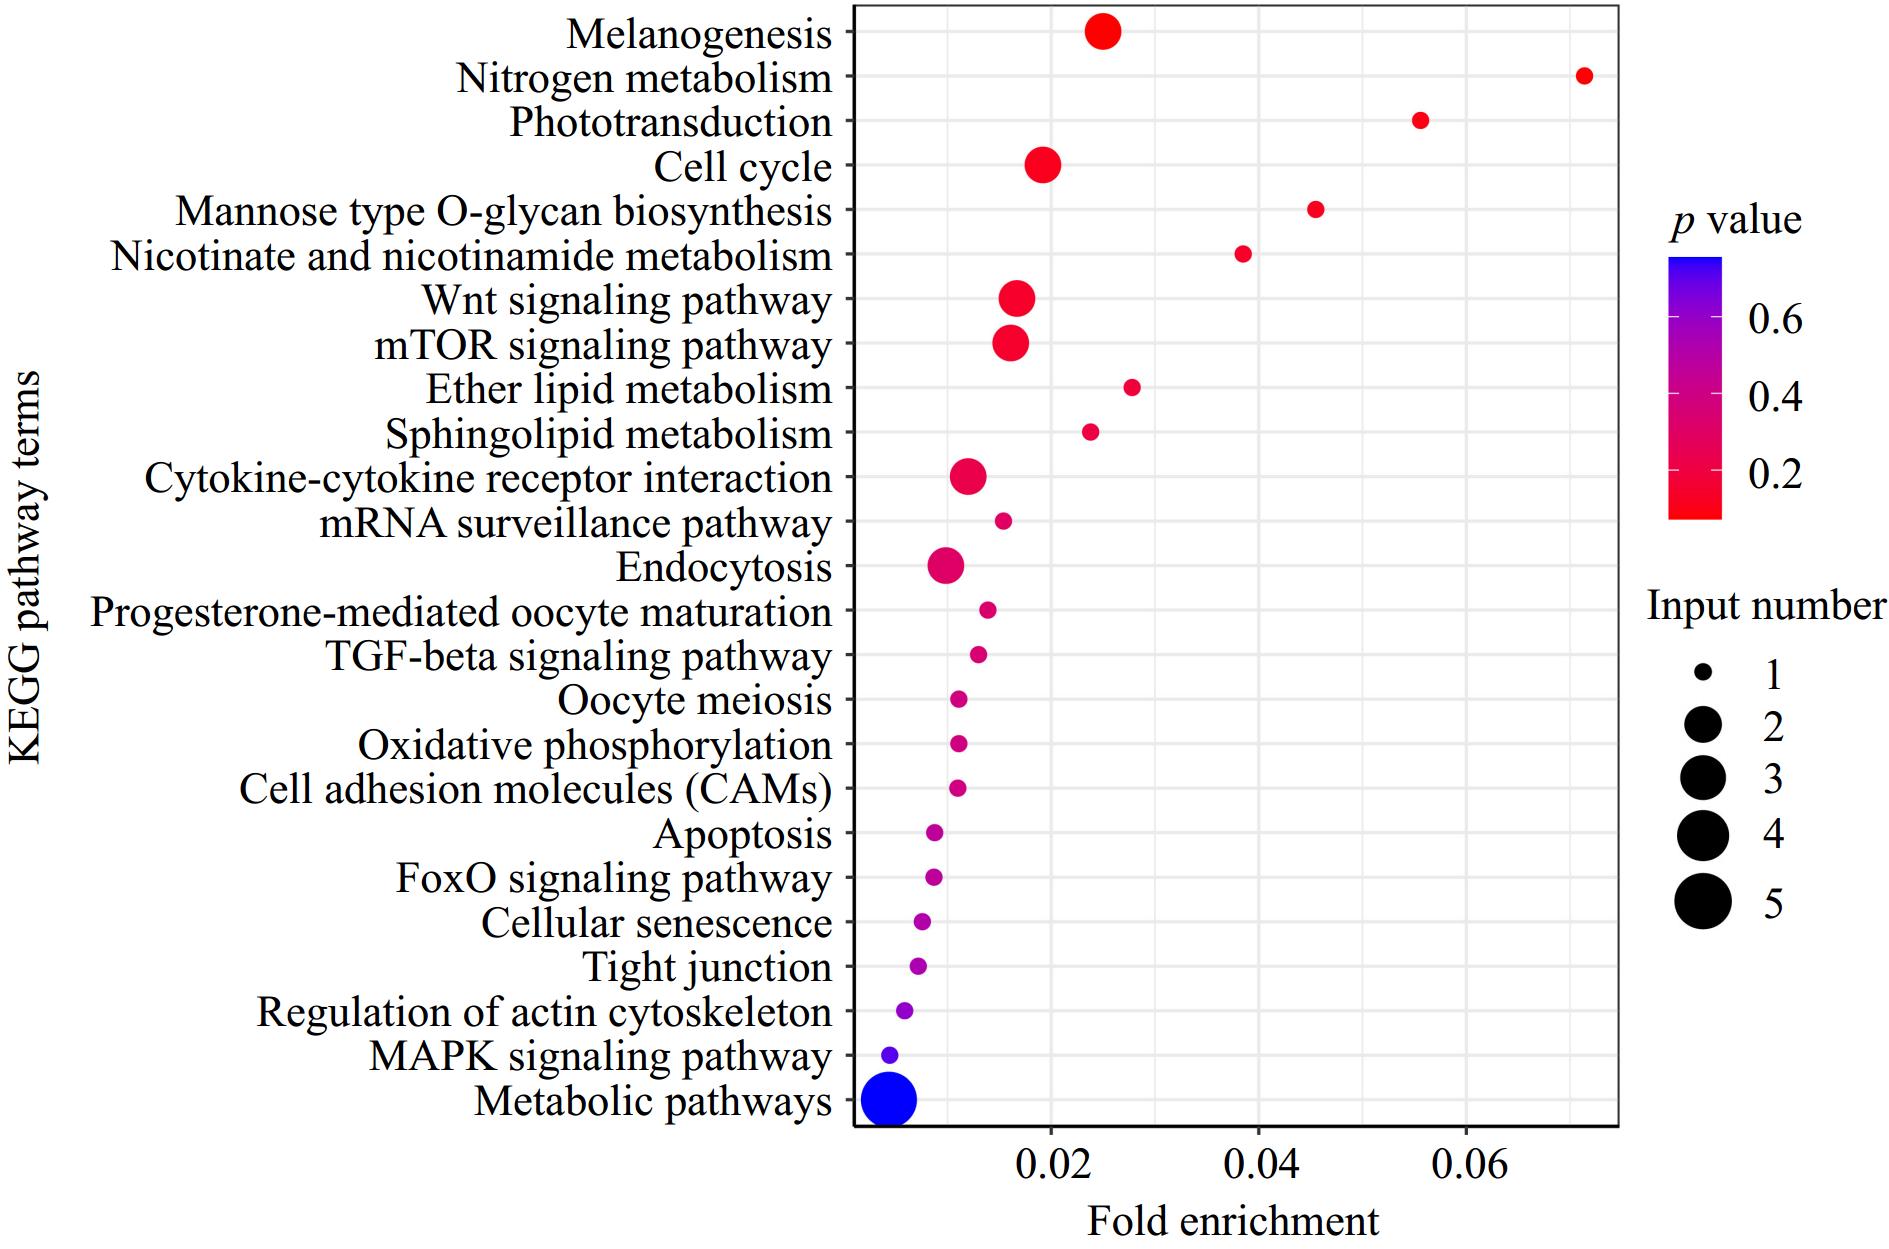
Figure 4.
KEGG pathway enrichment analysis of DEGs.
-
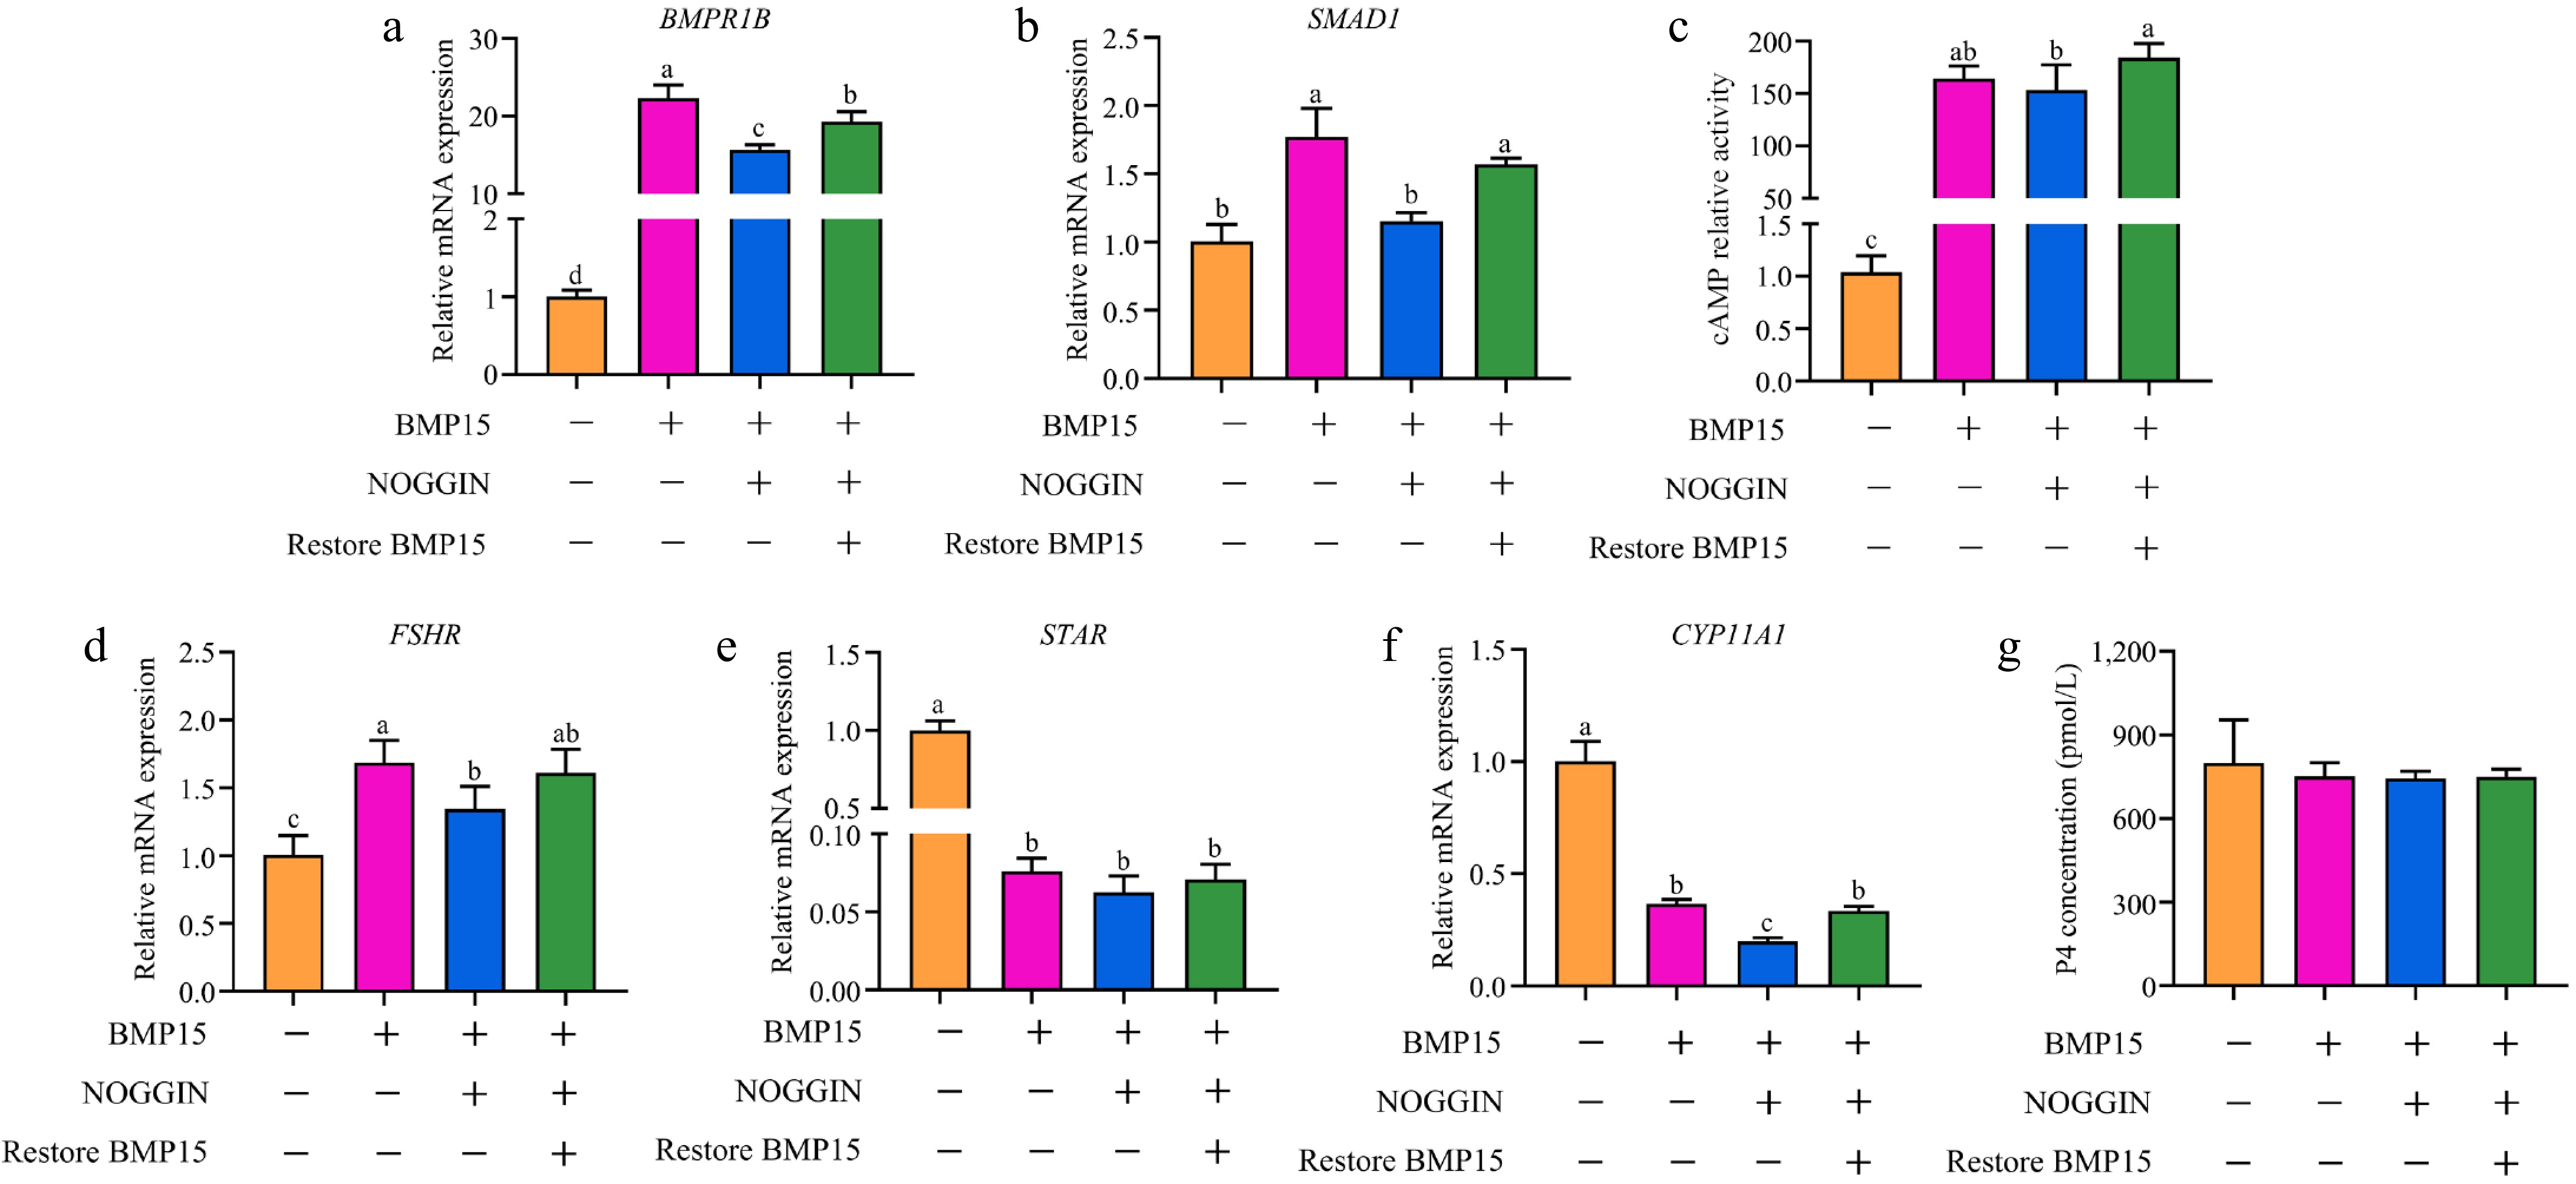
Figure 5.
Effects of recombinant BMP15 on gene expression in GCs. (a) BMPR1B, (b) SMAD1, (d) FSHR, (e) STAR, and (f) CYP11A1. (c) cAMP relative activity, and (g) P4 concentration. Note: All experiments were performed in triplicate, and the data are expressed as the mean SEM (different letters indicate significant difference, p < 0.05).
-
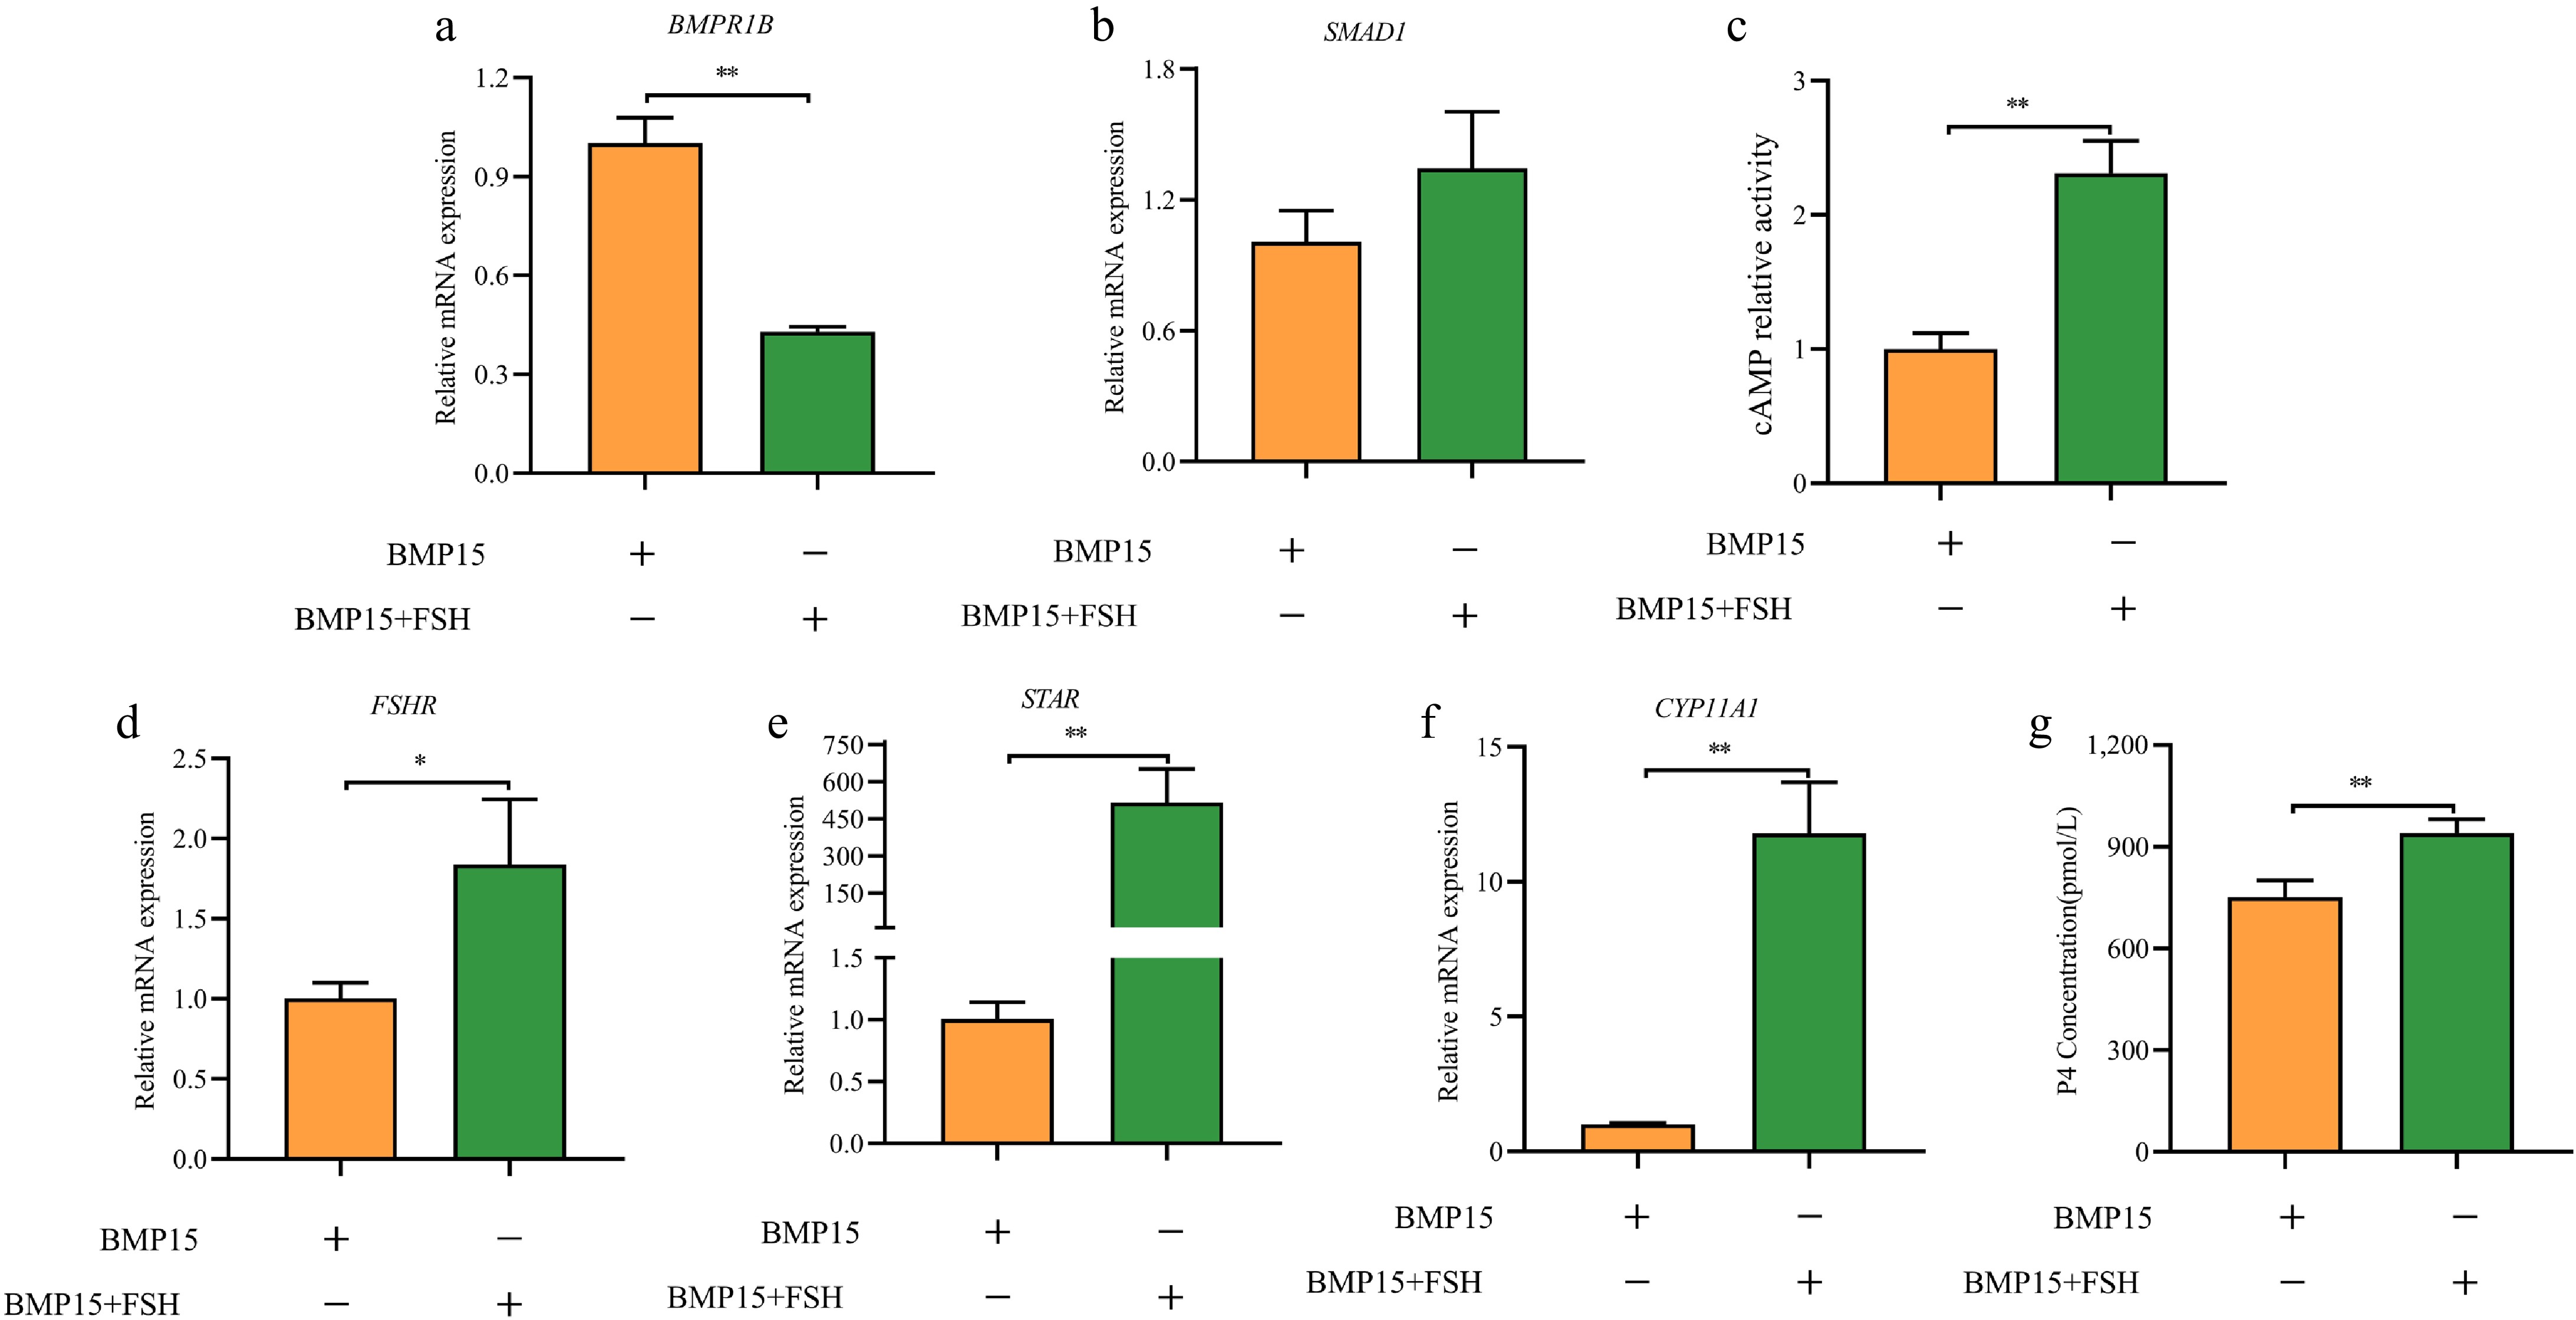
Figure 6.
FSH and BMP15 affected the expression of related genes. (a) BMPR1B, (b) SMAD1, (d) FSHR, (e) STAR, and (f) CYP11A1. (c) cAMP relative activity, and (g) P4 concentration. Note: All experiments were performed in triplicate, and the data are expressed as the mean SEM (* p < 0.05; ** p < 0.01).
-
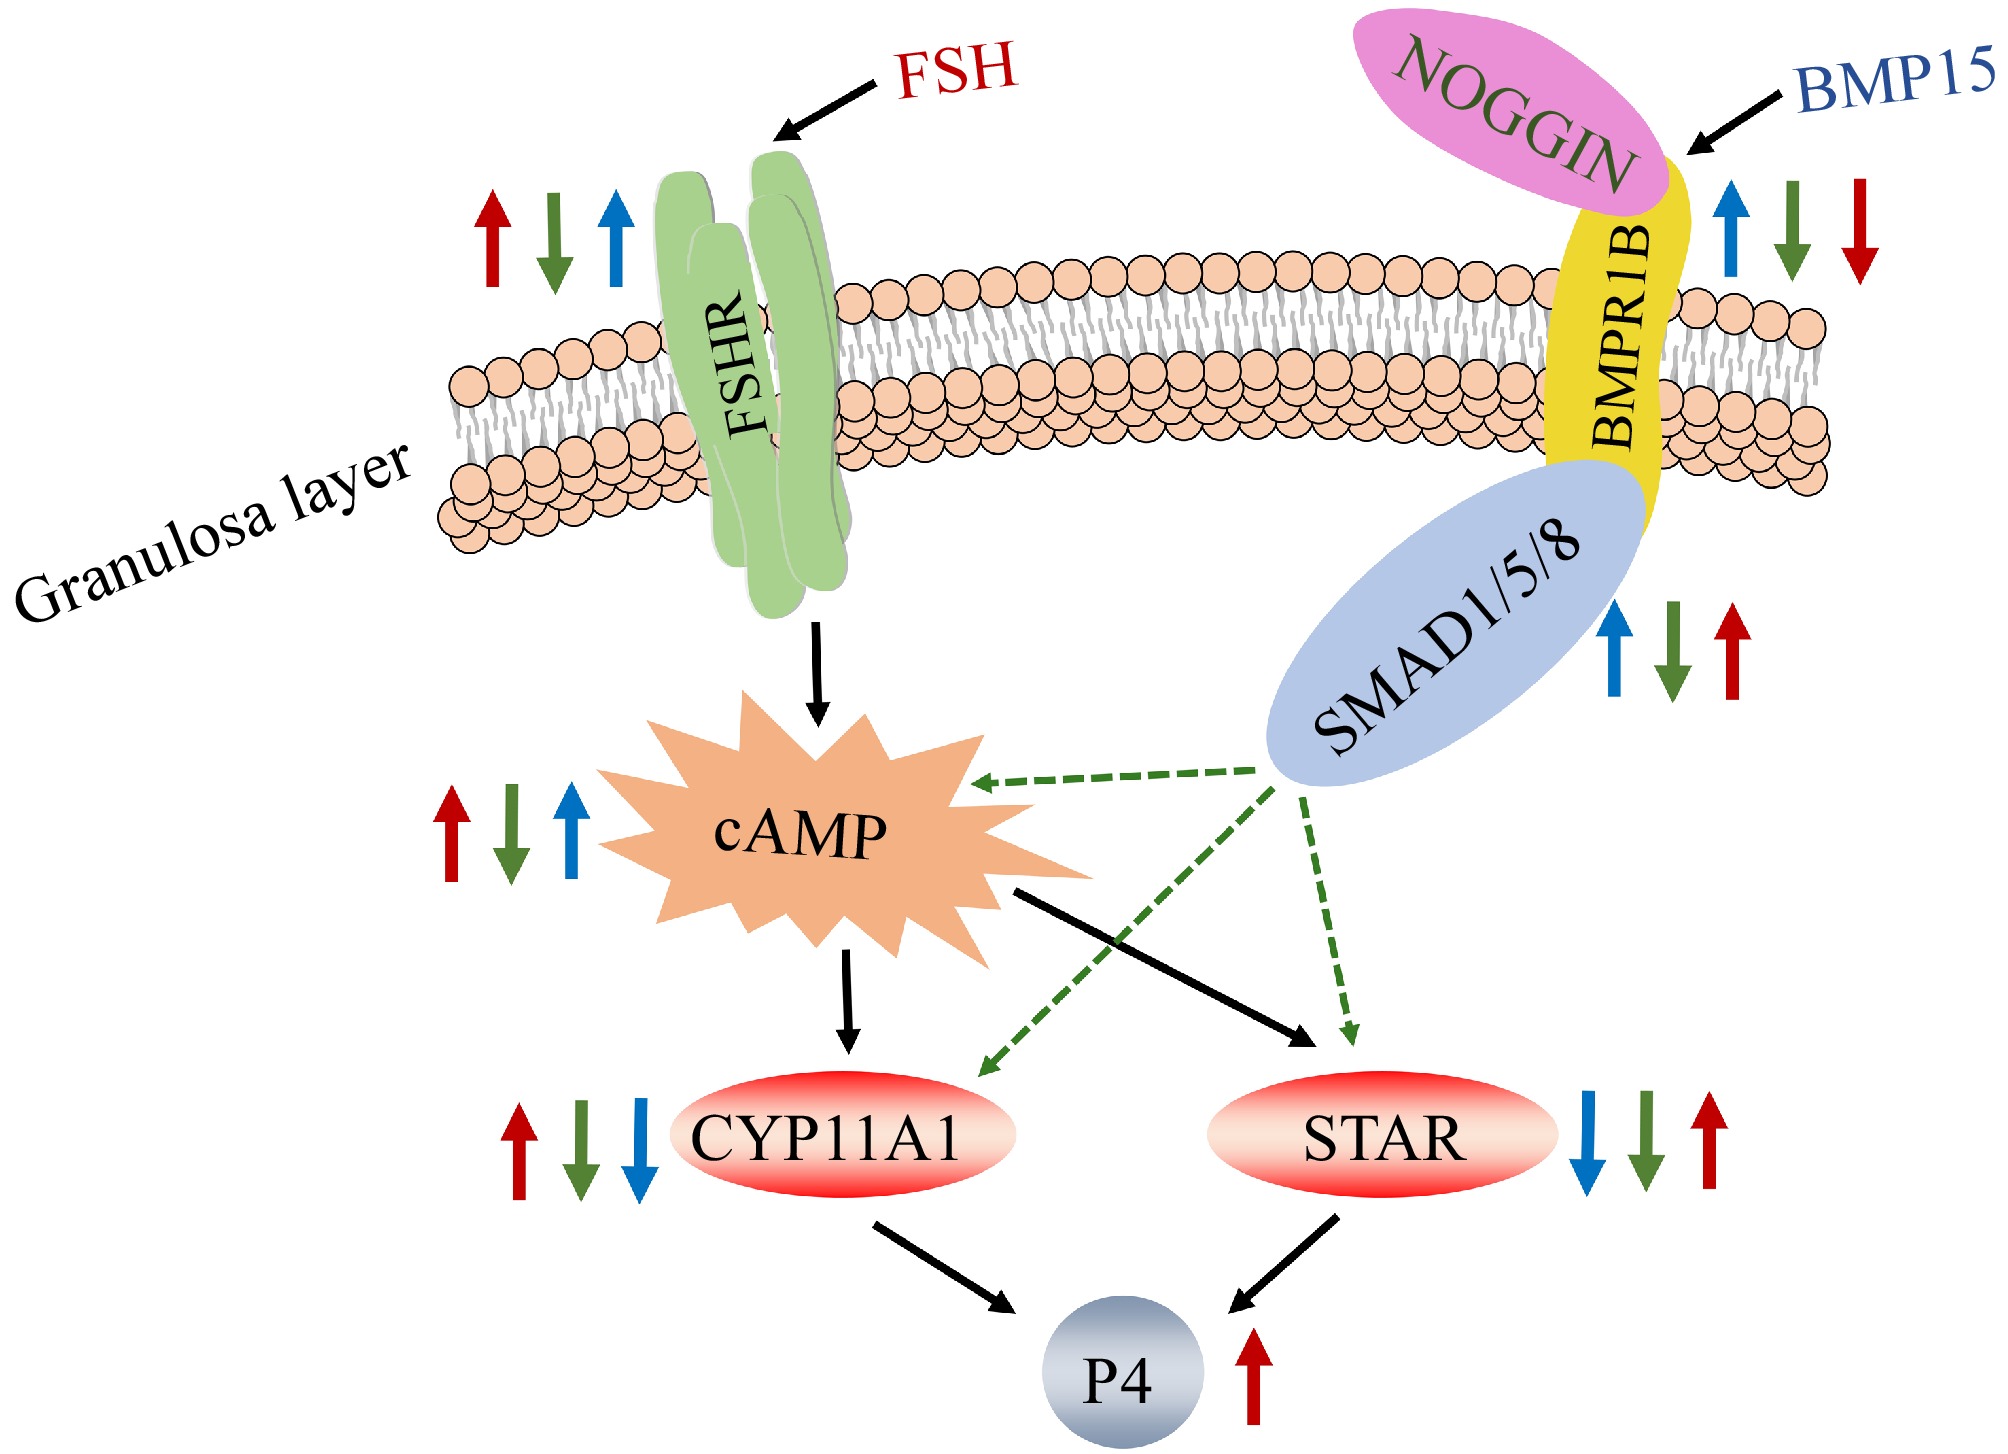
Figure 7.
Regulatory network model of BMP15 and FSH in chicken GCs. Note: The blue arrow shows that other genes expression levels after adding recombinant BMP15 protein; the green arrow shows that other genes expression levels after adding NOGGIN on the base of recombinant BMP15 protein added; the red arrow shows that other genes expression levels after adding FSH on the base of recombinant BMP15 protein added.
-
Target Primer sequence (5'-3') Product length (bp) BMP15 F: ATGCTGGAGCTGTACCAACG 135 R: CACGTACCAGCGACCTGC BMPR1B F: CTAGGATTAGAGGGCTCGGAC 167 R: GGCCTTATGGTGAATGTTTCCTT FSHR F: CTGAGTTACACCGTGAGGTCT 242 R: TGGTGAGGACAAATCTCAGTTC CYP11A1 F: GGCGTGCTCCTCAAGACAG 125 R: ACAAAGTCCTGGCTCACCTG STAR F: AGAACTGAGCTCCACTGCAC 214 R: GCCTGGAGCTGAGCAGG SMOC1 F: TCCAAACCACTCTGTGCCTC 124 R: TTTGGCCAGCATCTTTGCAC ZP4 F: GTGCTGACTGCTTGGGATACT 122 R: CAGCTGGTGTAGGAAACGGA ZP2 F: ATTGGGTGCTCAGACAGCTC 150 R: CAAGTCAGACATGCGCGTT MATN3 F: AAGACTTGCTCAAGAGCCACA 194 R: GTGAGTAGAACGCTGGCTCA GDF-9 F: AGGGACCCGATTACAGGAGAC 252 R: CTCAACCCACTTGCGCTTTC β-actin F: CACGGTATTGTCACCAACTG 200 R: ACAGCCTGGATGGCTACATA Table 1.
Primer list.
-
High egg-yielding (H) Low egg-yielding (L) 20−38 weeks 82.92 ± 8.76 83.69 ± 10.42 39−43 weeks 43.03 ± 2.00** 12.00 ± 3.71 The data are expressed as the mean ± SEM (* p < 0.05; ** p < 0.01) Table 2.
Average egg production.
-
Gene name Description log2FC FDR Type Wnt6 Wnt family member 6 −6.0031 8.56E-03 Down MNR2 Homeodomain protein −11.8637 1.97E-02 Down BMP15 Bone morphogenetic protein 15 −8.1033 5.56E-03 Down ZP2 Zona pellucida glycoprotein 2 −8.7247 7.86E-03 Down ZP4 Zona pellucida glycoprotein 4 −8.745 7.86E-03 Down WNT4 Wnt family member 4 −5.5719 3.46E-03 Down FOXL2 Forkhead box L2 −1.8021 2.01E-02 Down GDF-9 Growth differentiation factor 9 −6.44 4.14E-02 Down Table 3.
The list of DEGs in follicle development and selection.
Figures
(7)
Tables
(3)