-
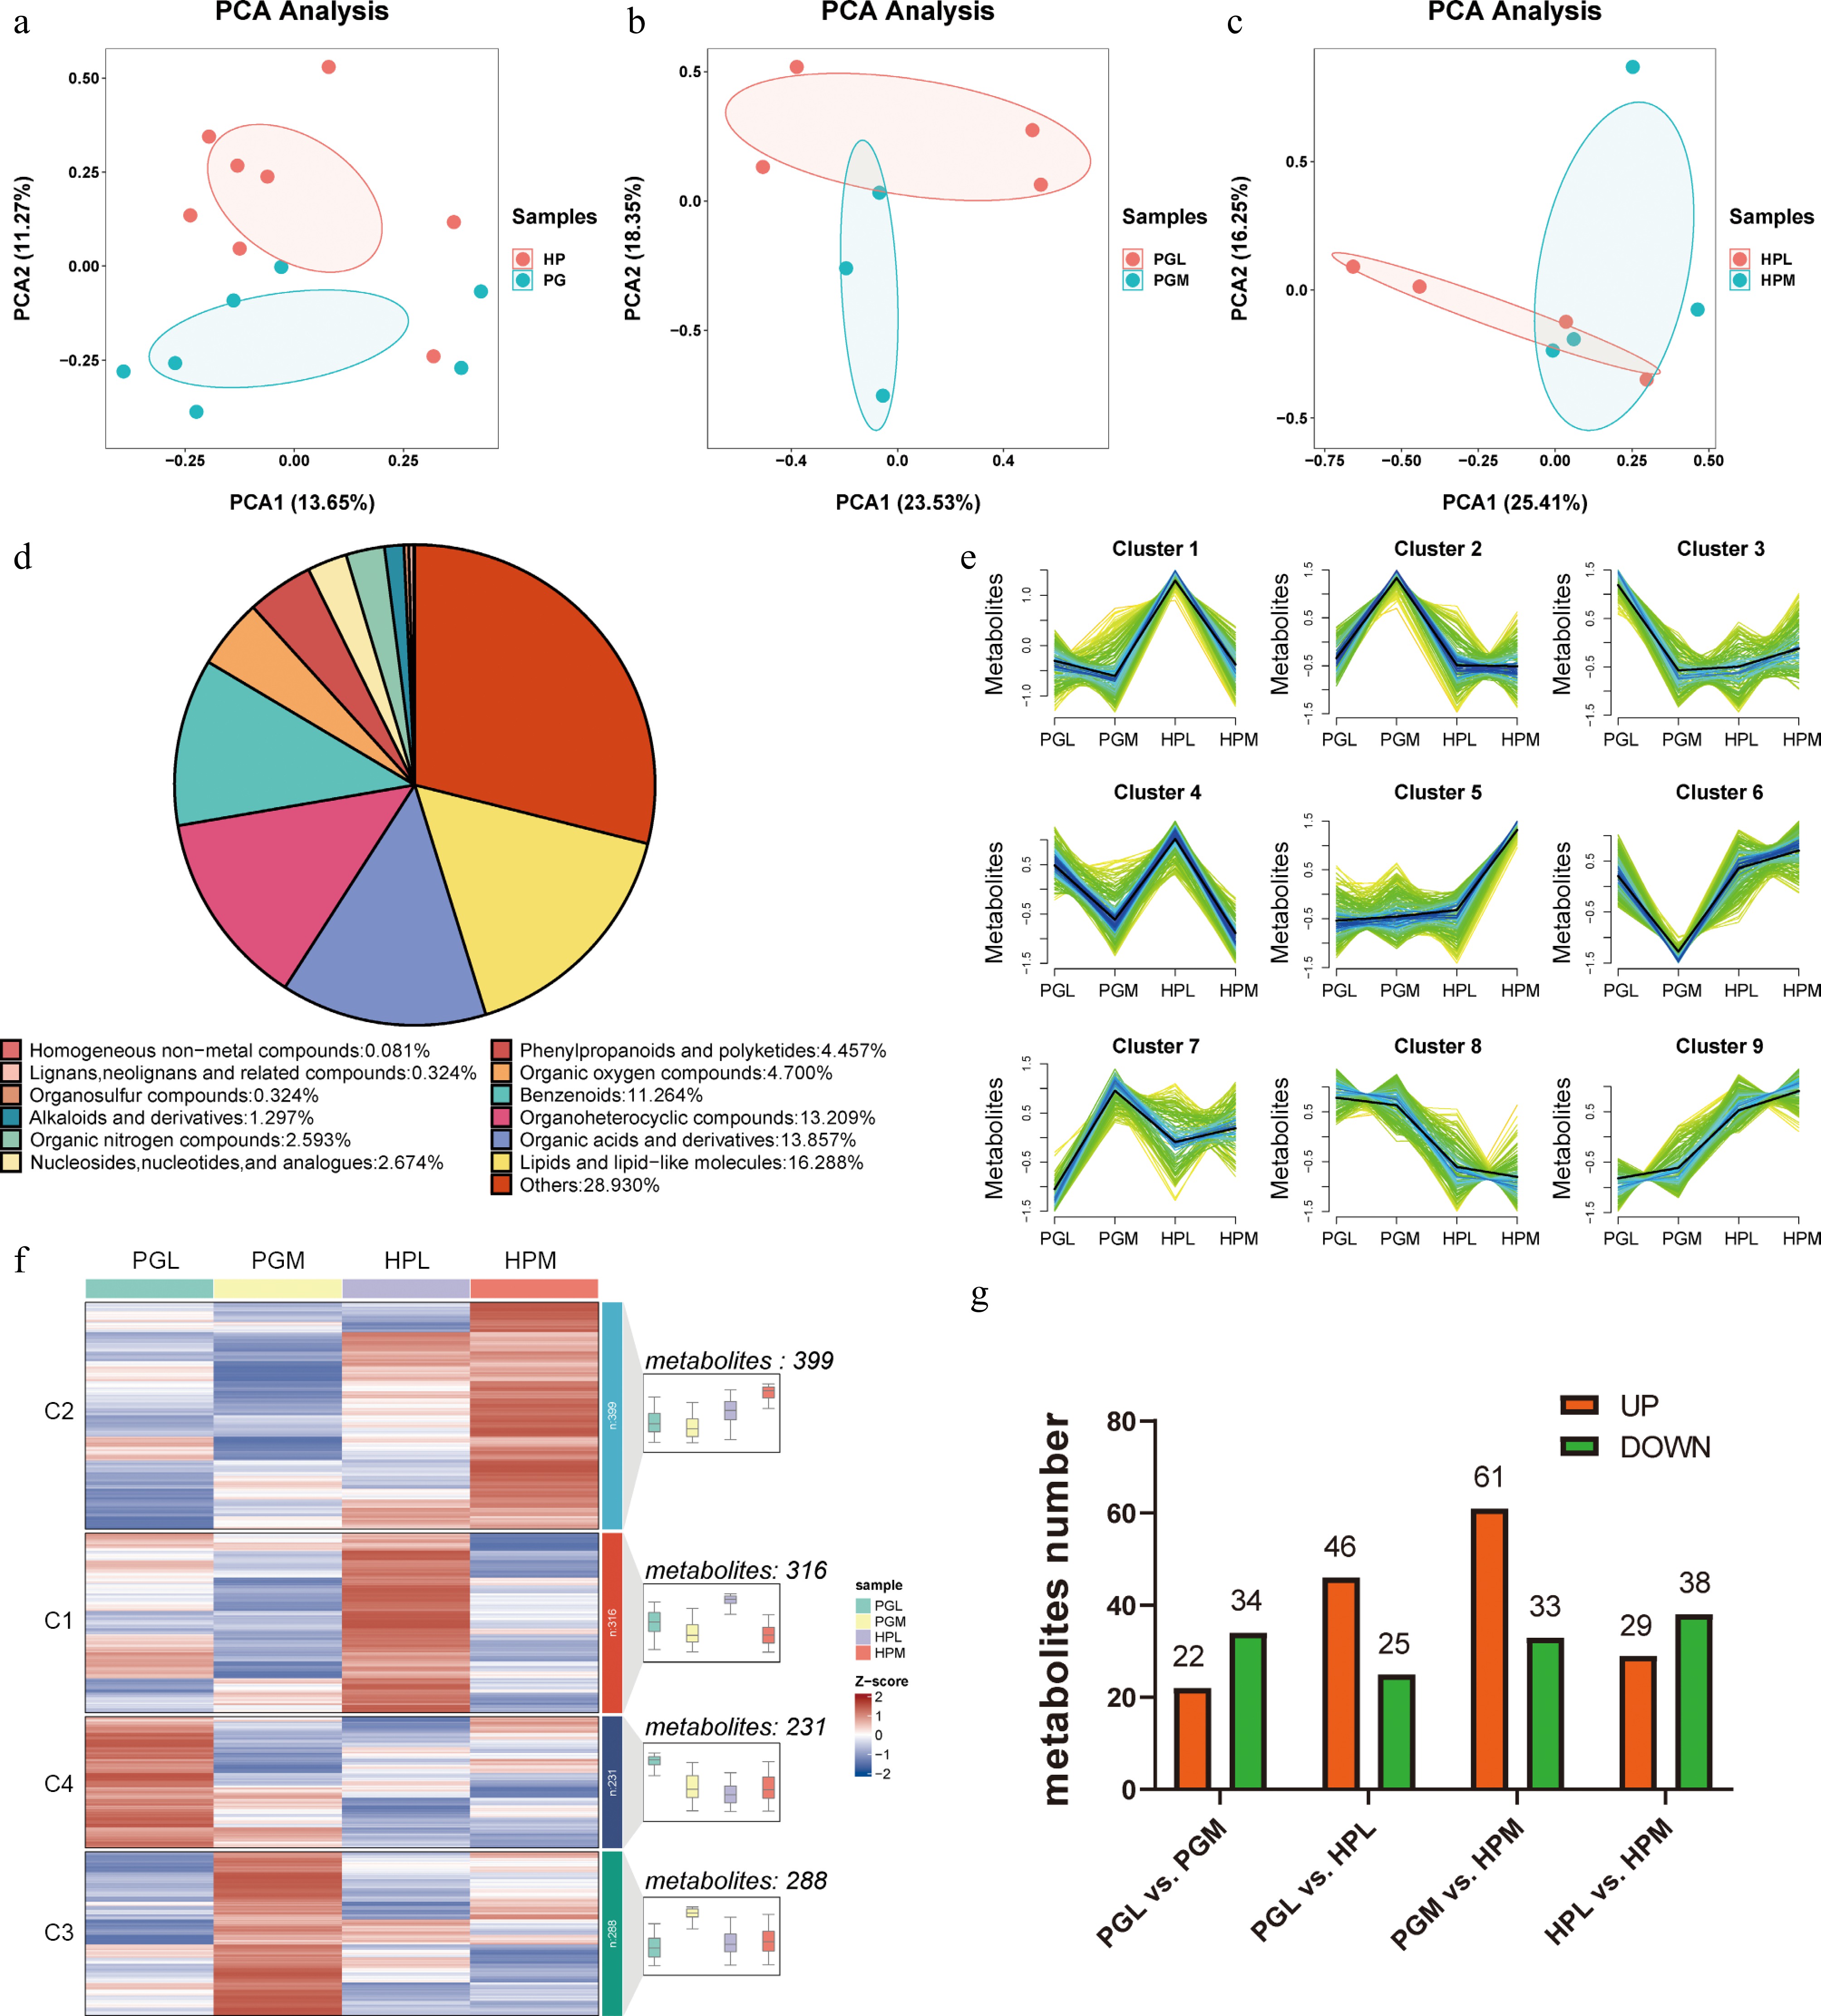
Figure 1.
Metabolite profiles between the hypothalamus (HP) and pituitary gland (PG) of pigs exhibiting varying levels of aggression. (a)−(c) are Principal Component Analysis (PCA) of metabolites identified from different tissues (HP vs PG) and aggression (the hypothalamus of the most aggressive (HPM) vs the hypothalamus of the least aggressive (HPL), the hypothalamus of the least aggressive pigs (HPL) vs the hypothalamus of the most aggressive pigs (HPM)). (d) Pie chart depicting the categories of metabolites. (e) and (f) represent cluster analysis of all detected metabolites using Mfuzz and Kmeans clustering methods, respectively. (g) The number of differentially expressed metabolites (DEMs) (VIP > 1 and p < 0.05) identified in different tissues (PGL vs HPL, PGM vs HPM) and aggression (PGL vs PGM, HPL vs PGM).
-
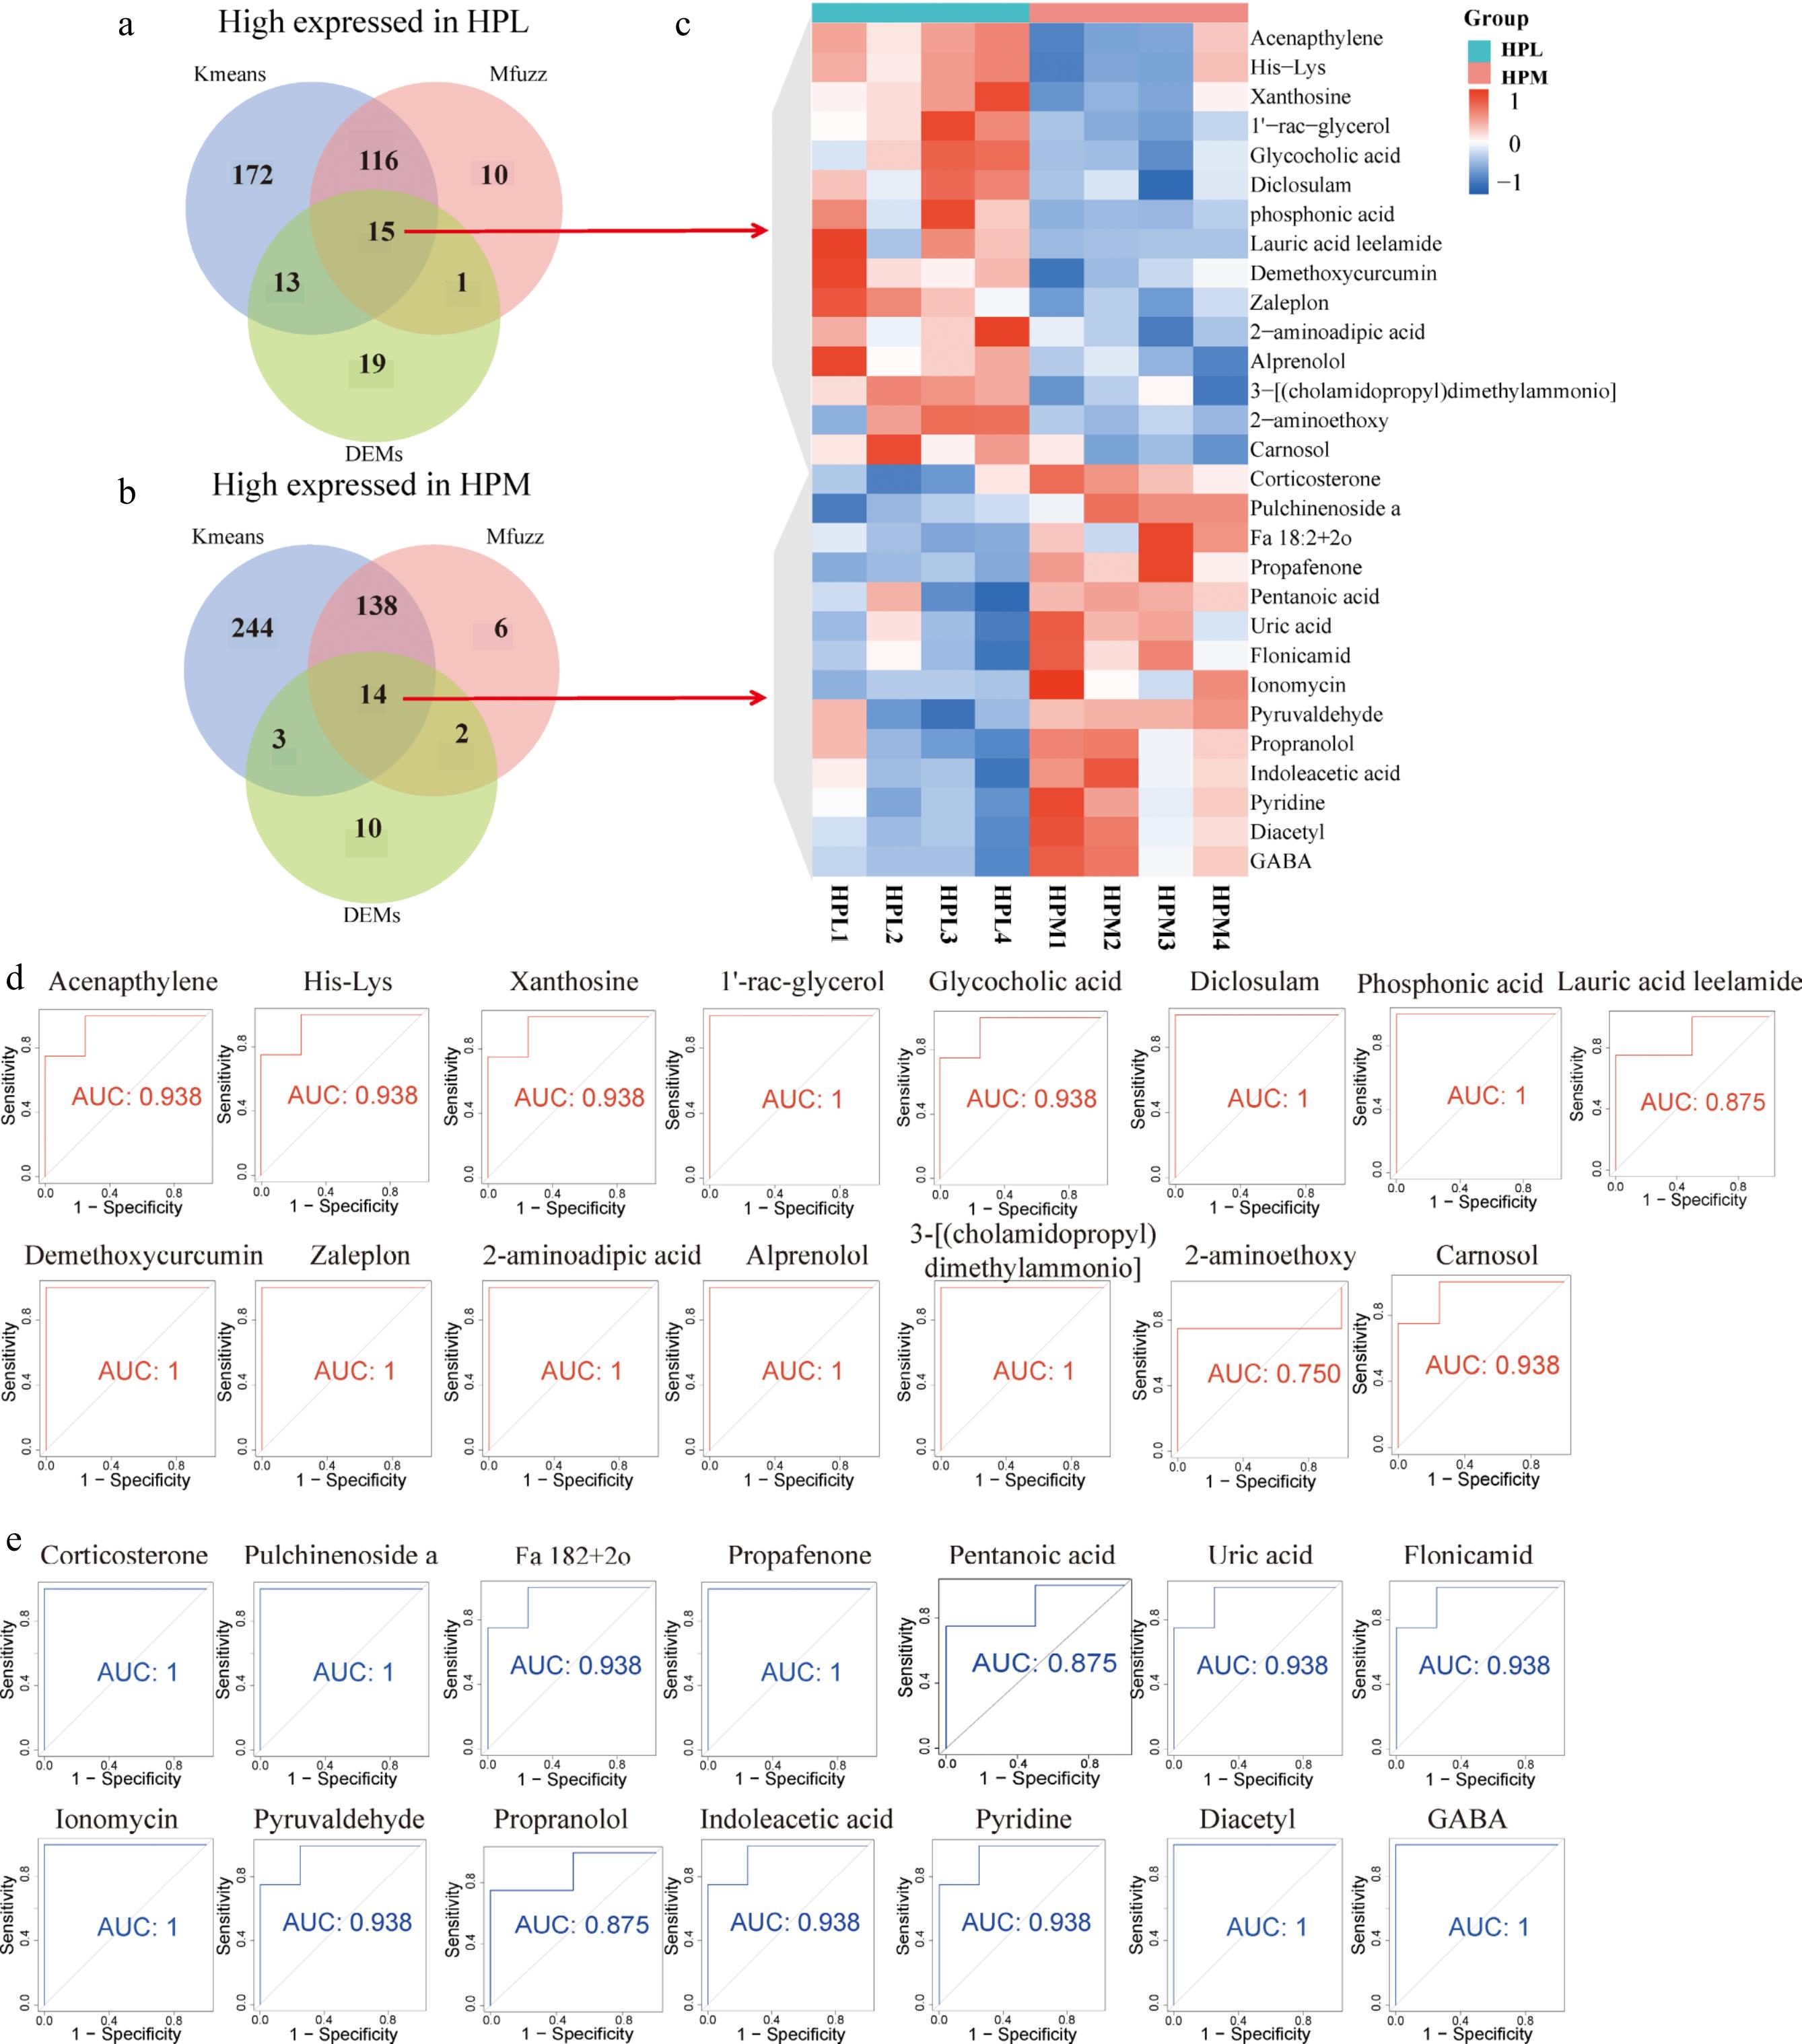
Figure 2.
Identification of molecular markers for metabolites associated with aggressive behavior. Metabolite markers in the HP of the (a) most and (b) least aggressive behavior identified by combining different data processing methods (kmeans, Mfuzz, and DEMs). (c) Heatmap of the expression levels of metabolic markers related to aggressive behavior in the HP. (d) and (e) The Receiver Operating Characteristic (ROC) curves for these candidate metabolic markers.
-
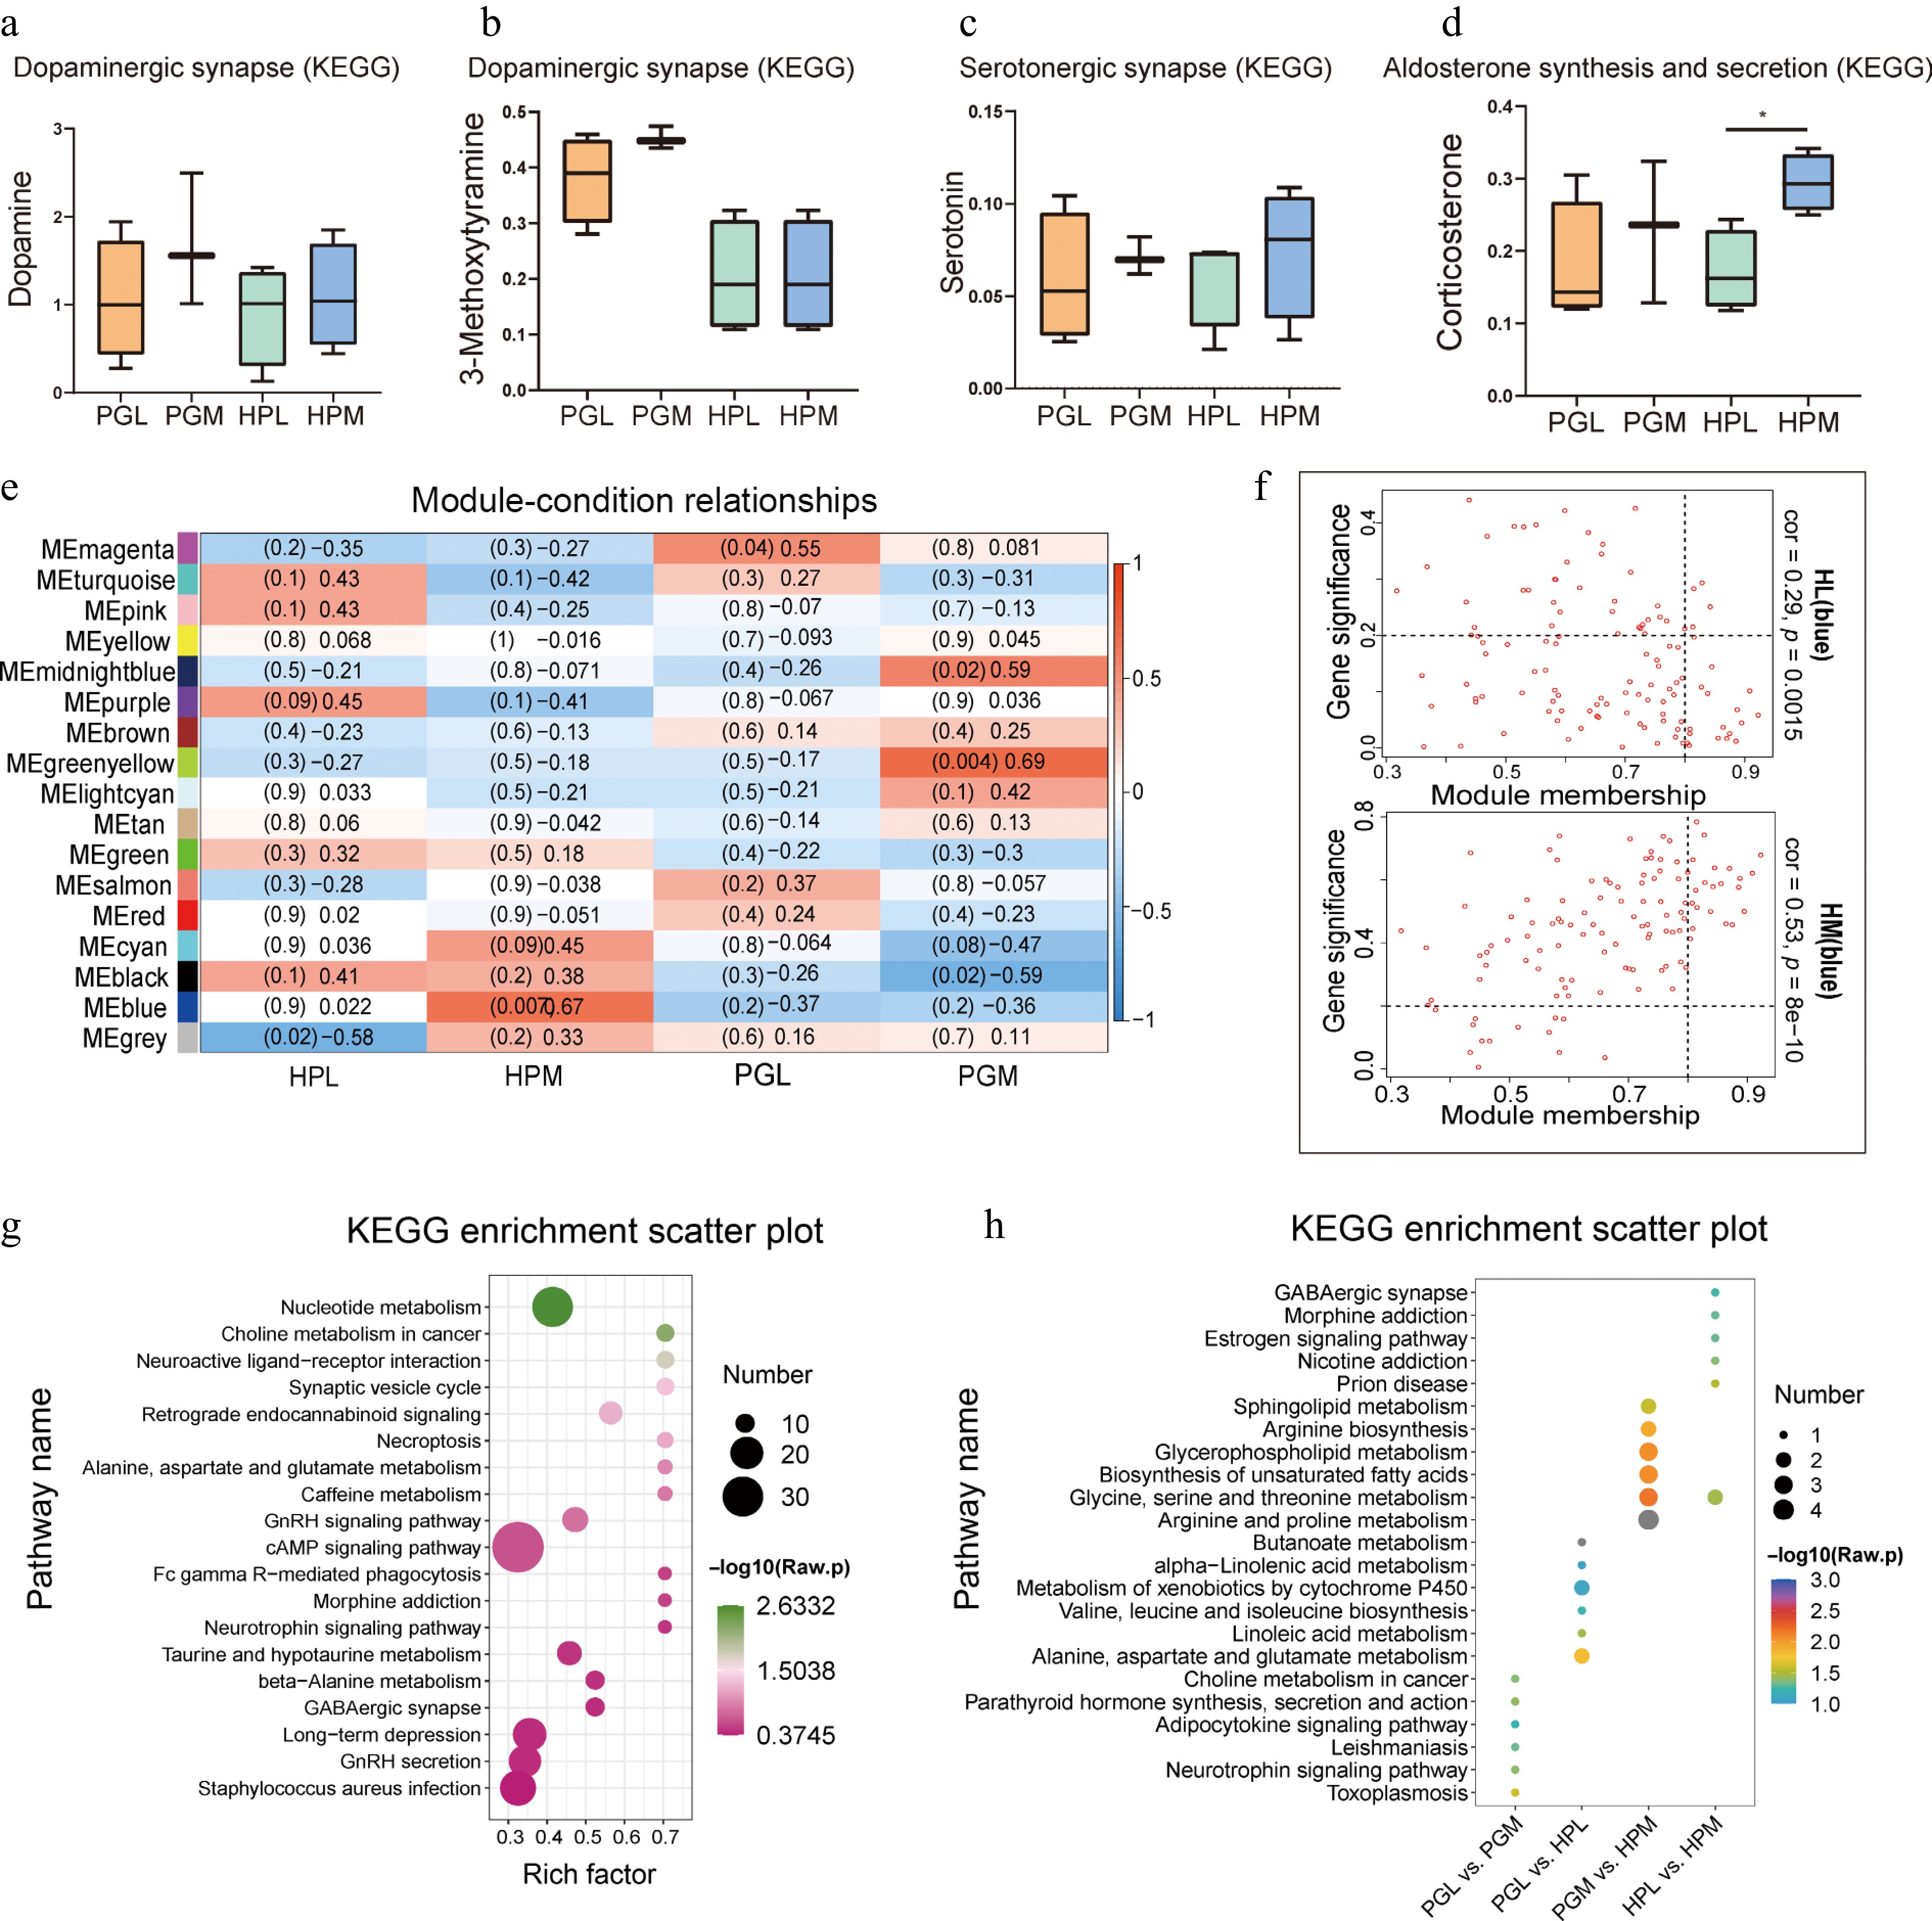
Figure 3.
Functional enrichment analysis of identified metabolites. (a) - (d) represent the relative expression of dopamine, 3-methoxytyamine, serotonin, and corticosterone in the hypothalamus (HP) and pituitary gland (PG) of pigs exhibiting varying degrees of aggression. Notably, a significant difference was observed in the relative expression of corticosterone between the least aggressive pigs (HPL) and the most aggressive pigs (HPM), denoted by an asterisk indicating p < 0.05. (e) Weighted Gene Co-expression Network Analysis (WGCNA) of metabolites in HP and PG of pigs with different aggressive behaviors. (f) Metabolites in the MEblue module were negatively correlated with HPL and positively correlated with HPM. (g) Kyoto Encyclopedia of Genes and Genomes (KEGG) enrichment plot of metabolites in the MEblue module. (h) KEGG enrichment plot of differentially expressed metabolites (DEMs) in tissues (PGL vs HPL, PGM vs HPM) and aggression (PGL vs PGM, HPL vs HPM), showcasing the pathways in which these DEMs are involved.
-
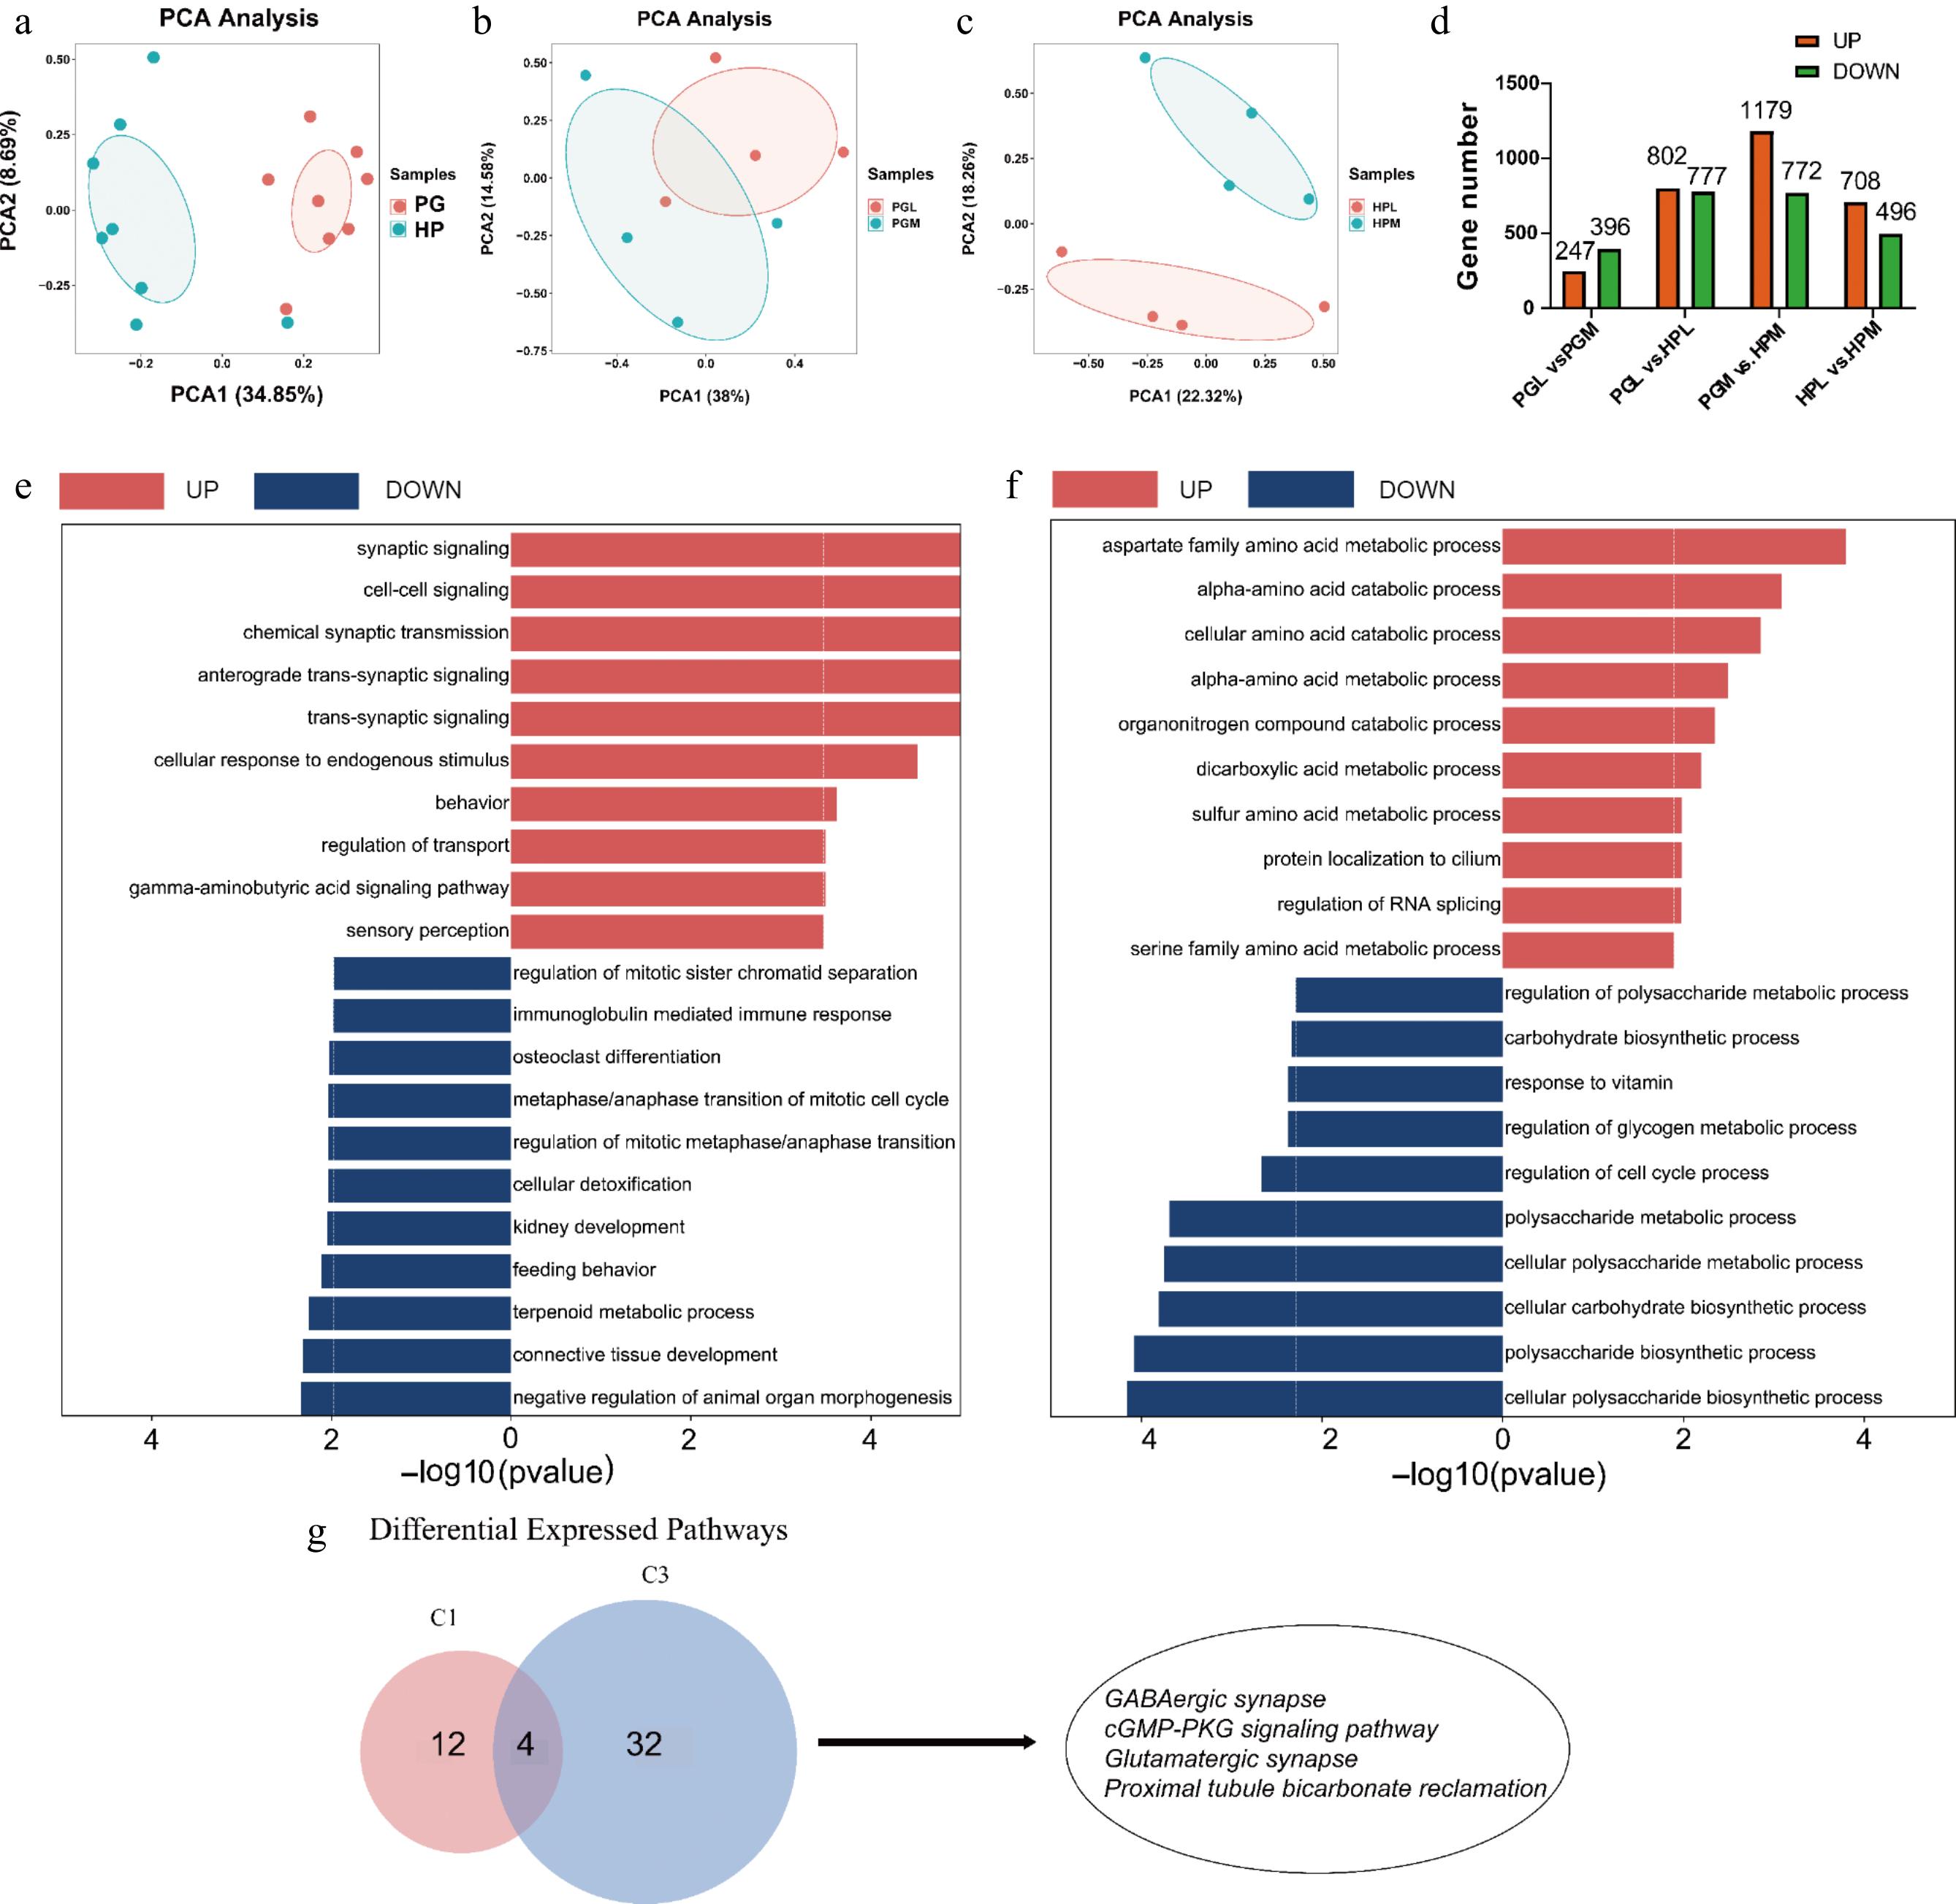
Figure 4.
Transcriptomic profiles of the hypothalamus (HP) and pituitary gland (PG) in the most and least aggressive pigs. (a)−(c) are PCA analyses of genes identified from different tissues (HP vs PG) and aggression (PGL vs PGM, HPL vs HPM). (d) Number of DEGs (fold change > 2 or < 0.5 and p-value < 0.05) identified in different tissues (PGL vs HPL, PGM vs HPM) and aggression (PGL vs PGM, HPL vs PGM). (e) and (f) represent GO enrichment analysis of DEGs for PG (PGL vs PGM) and HP (HPL vs HPM), respectively, where red entries indicate genes up-regulated in the most aggressive compared to least aggressive pigs, and blue indicates down-regulated genes. (g) The Venn plot demonstrates the KEGG pathway that is generally upregulated in the most aggressive pigs, C1 represents the pathway enriched in PGM, and C3 represents the pathway enriched in HPM, including GABAergic synapses, cGMP-PKG signaling, glutamatergic synapses, and proximal tubular carbonic acid synapses were consistently upregulated in both HPM and PGM groups.
-
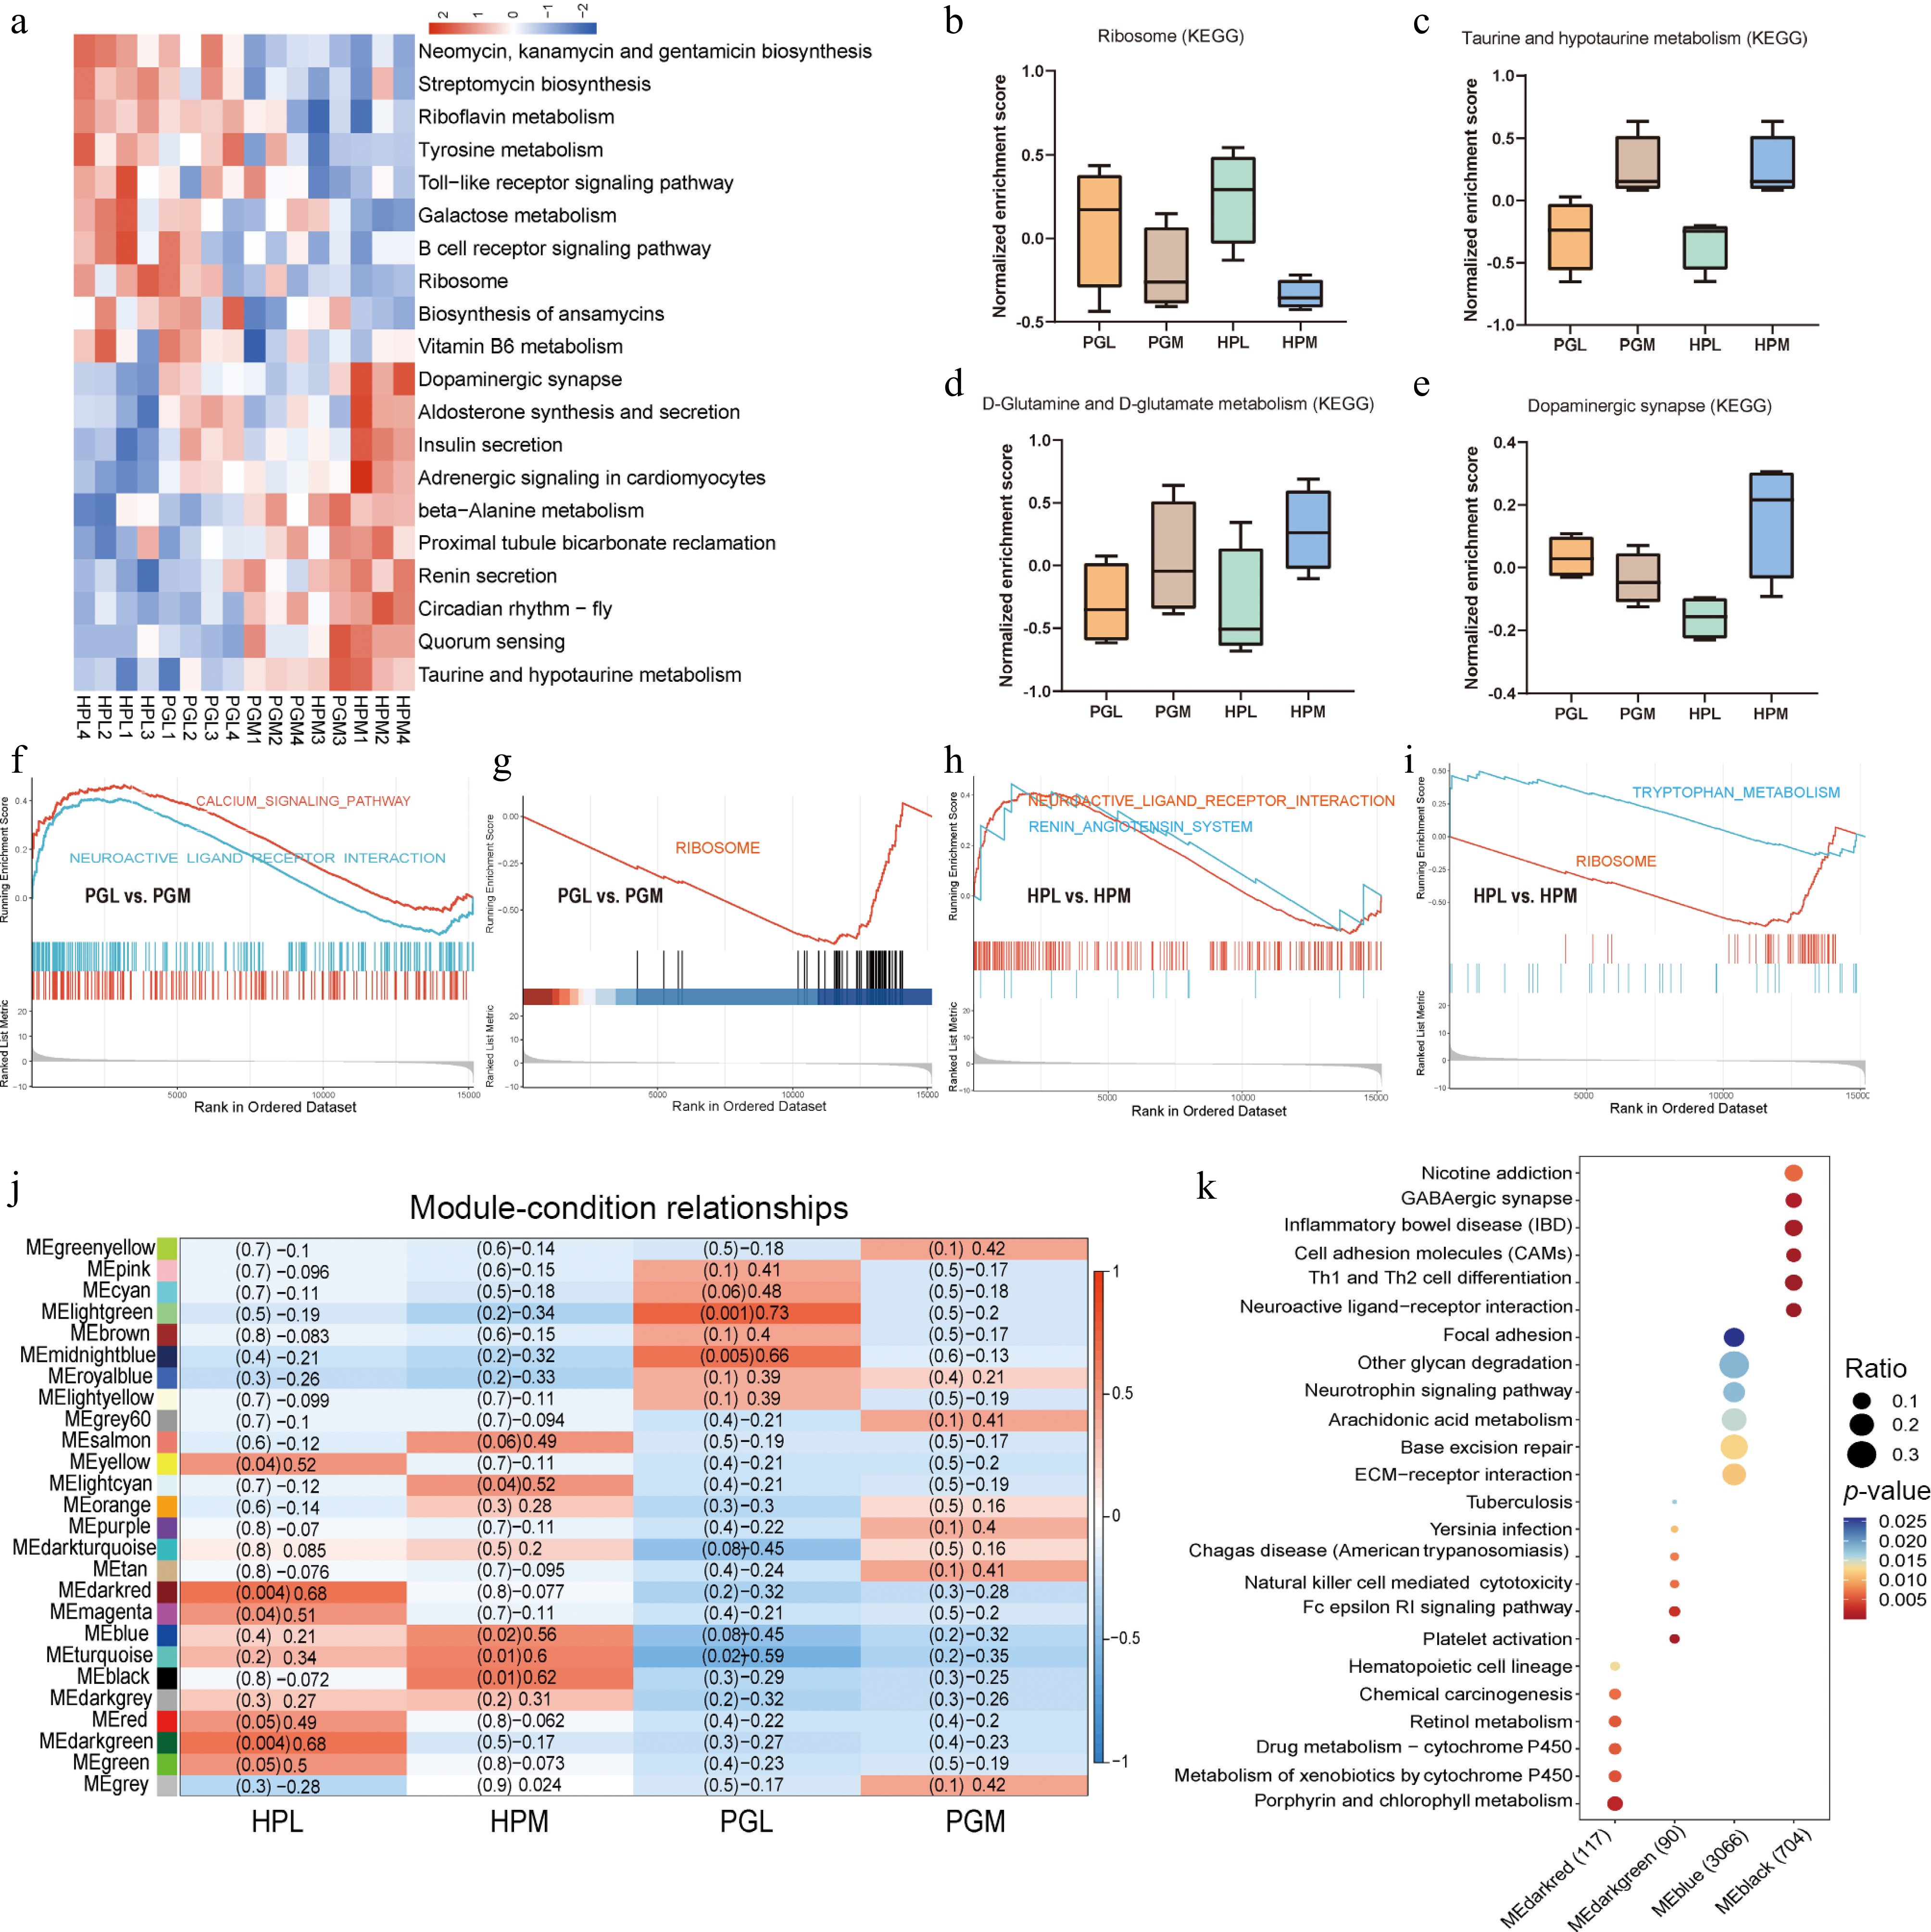
Figure 5.
Transcriptomic functional enrichment analysis. (a) The clustered heatmap represents the relationship between pathways of gene set variation analysis (GSVA) and aggressive behavior. (b)−(e) Box plots showing the GSVA normalized enrichment scores for 'Ribosome', 'Taurine and hypotaurine metabolism', 'D-glutamine and D-glutamate metabolism', and 'Dopaminergic synapse', respectively. (f)−(i) show the pathways in the gene set enrichment analysis (GSEA) related to aggressive behavior (PGL vs PGM, HPL vs HPM). (j) WGCNA analysis of genes in HP and PG of pigs with different aggressive behaviors. (k) KEGG enrichment pathway of MEdarkred (gene set: 117), MEdarkgreen (gene set: 90), MEblue (gene set: 3066), and MEblack (gene set, 704) modules.
-
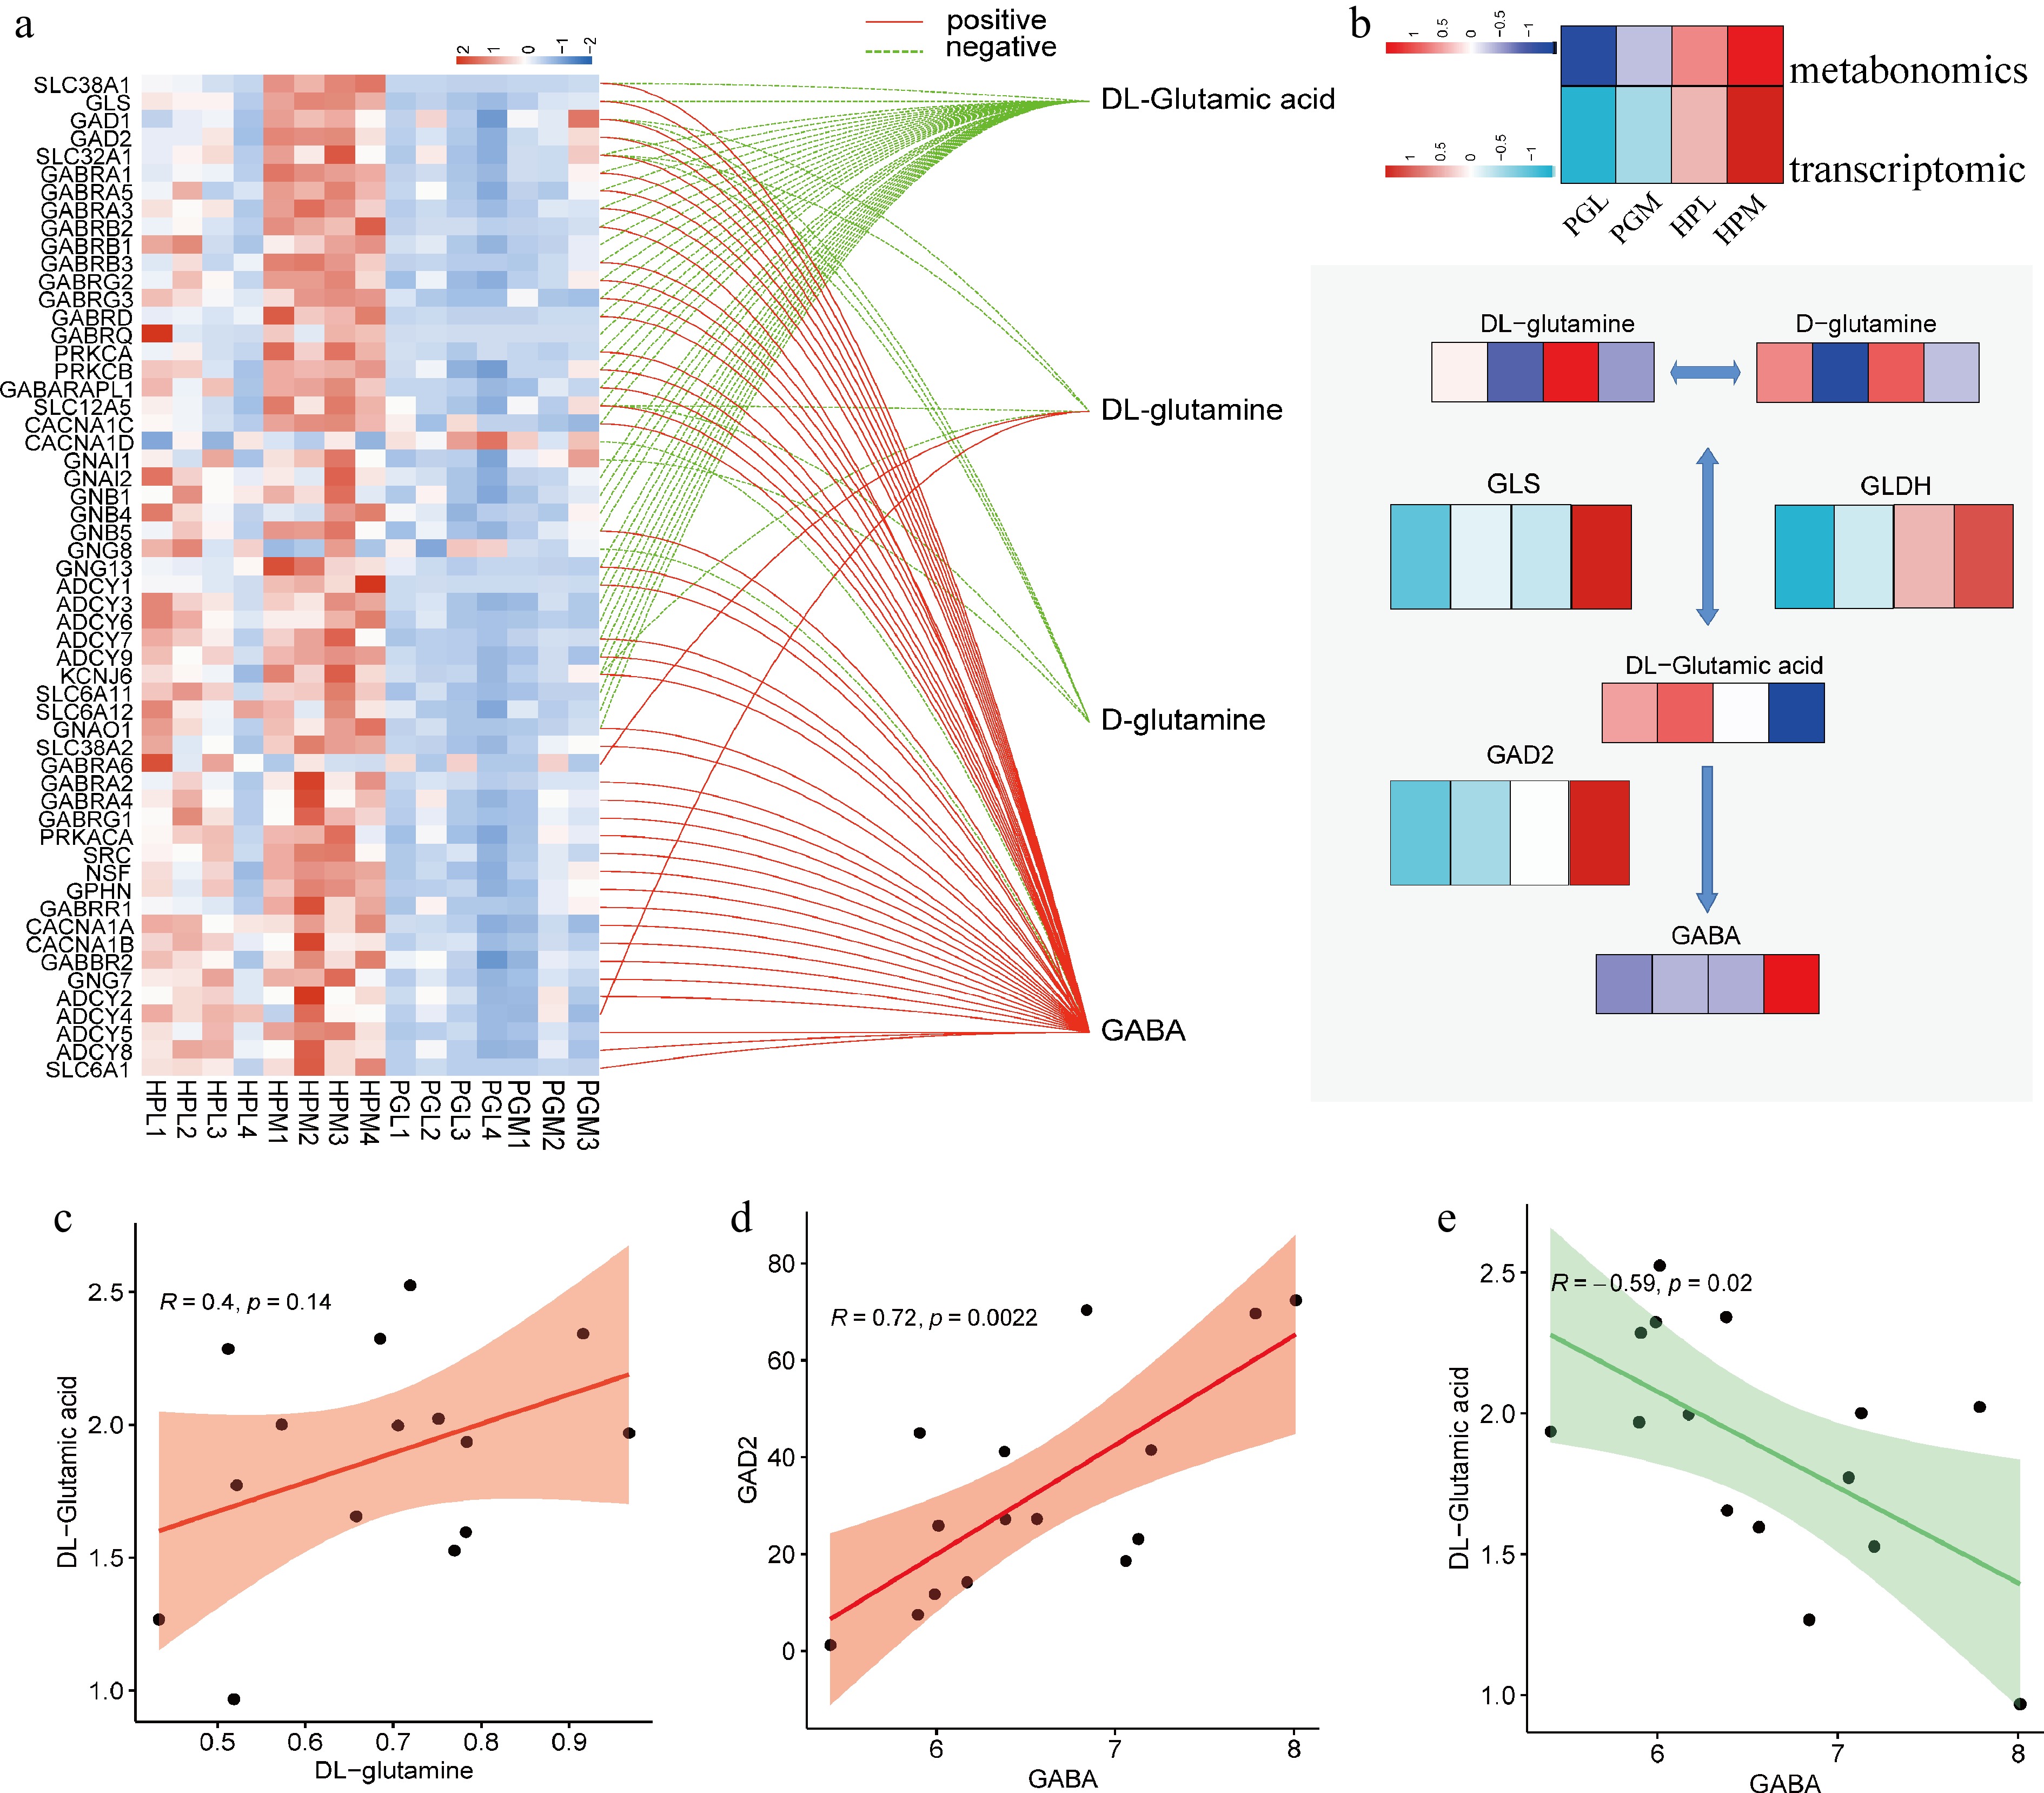
Figure 6.
Integrated analysis of metabolome and transcriptome. (a) Correlation analysis of GABA-related genes and GABA-related metabolites, with a threshold of the absolute value of the correlation coefficient > 0.5 (positive means r is greater than 0.5, and negative means r is less than −0.5) and p < 0.05. (b) Heatmap showing transcription and metabolism associated with GABA synthesis in PGL, PGM, HPL, and HPM groups. (c)−(e) Represent the relationships between DL-glutamine and DL-glutamic acid (R = 0.4, p = 0.14), GABA and GAD2 (R = 0.72, p = 0.0022), and GABA and DL-glutamic acid (R = 0.59, p = 0.02), respectively.
-
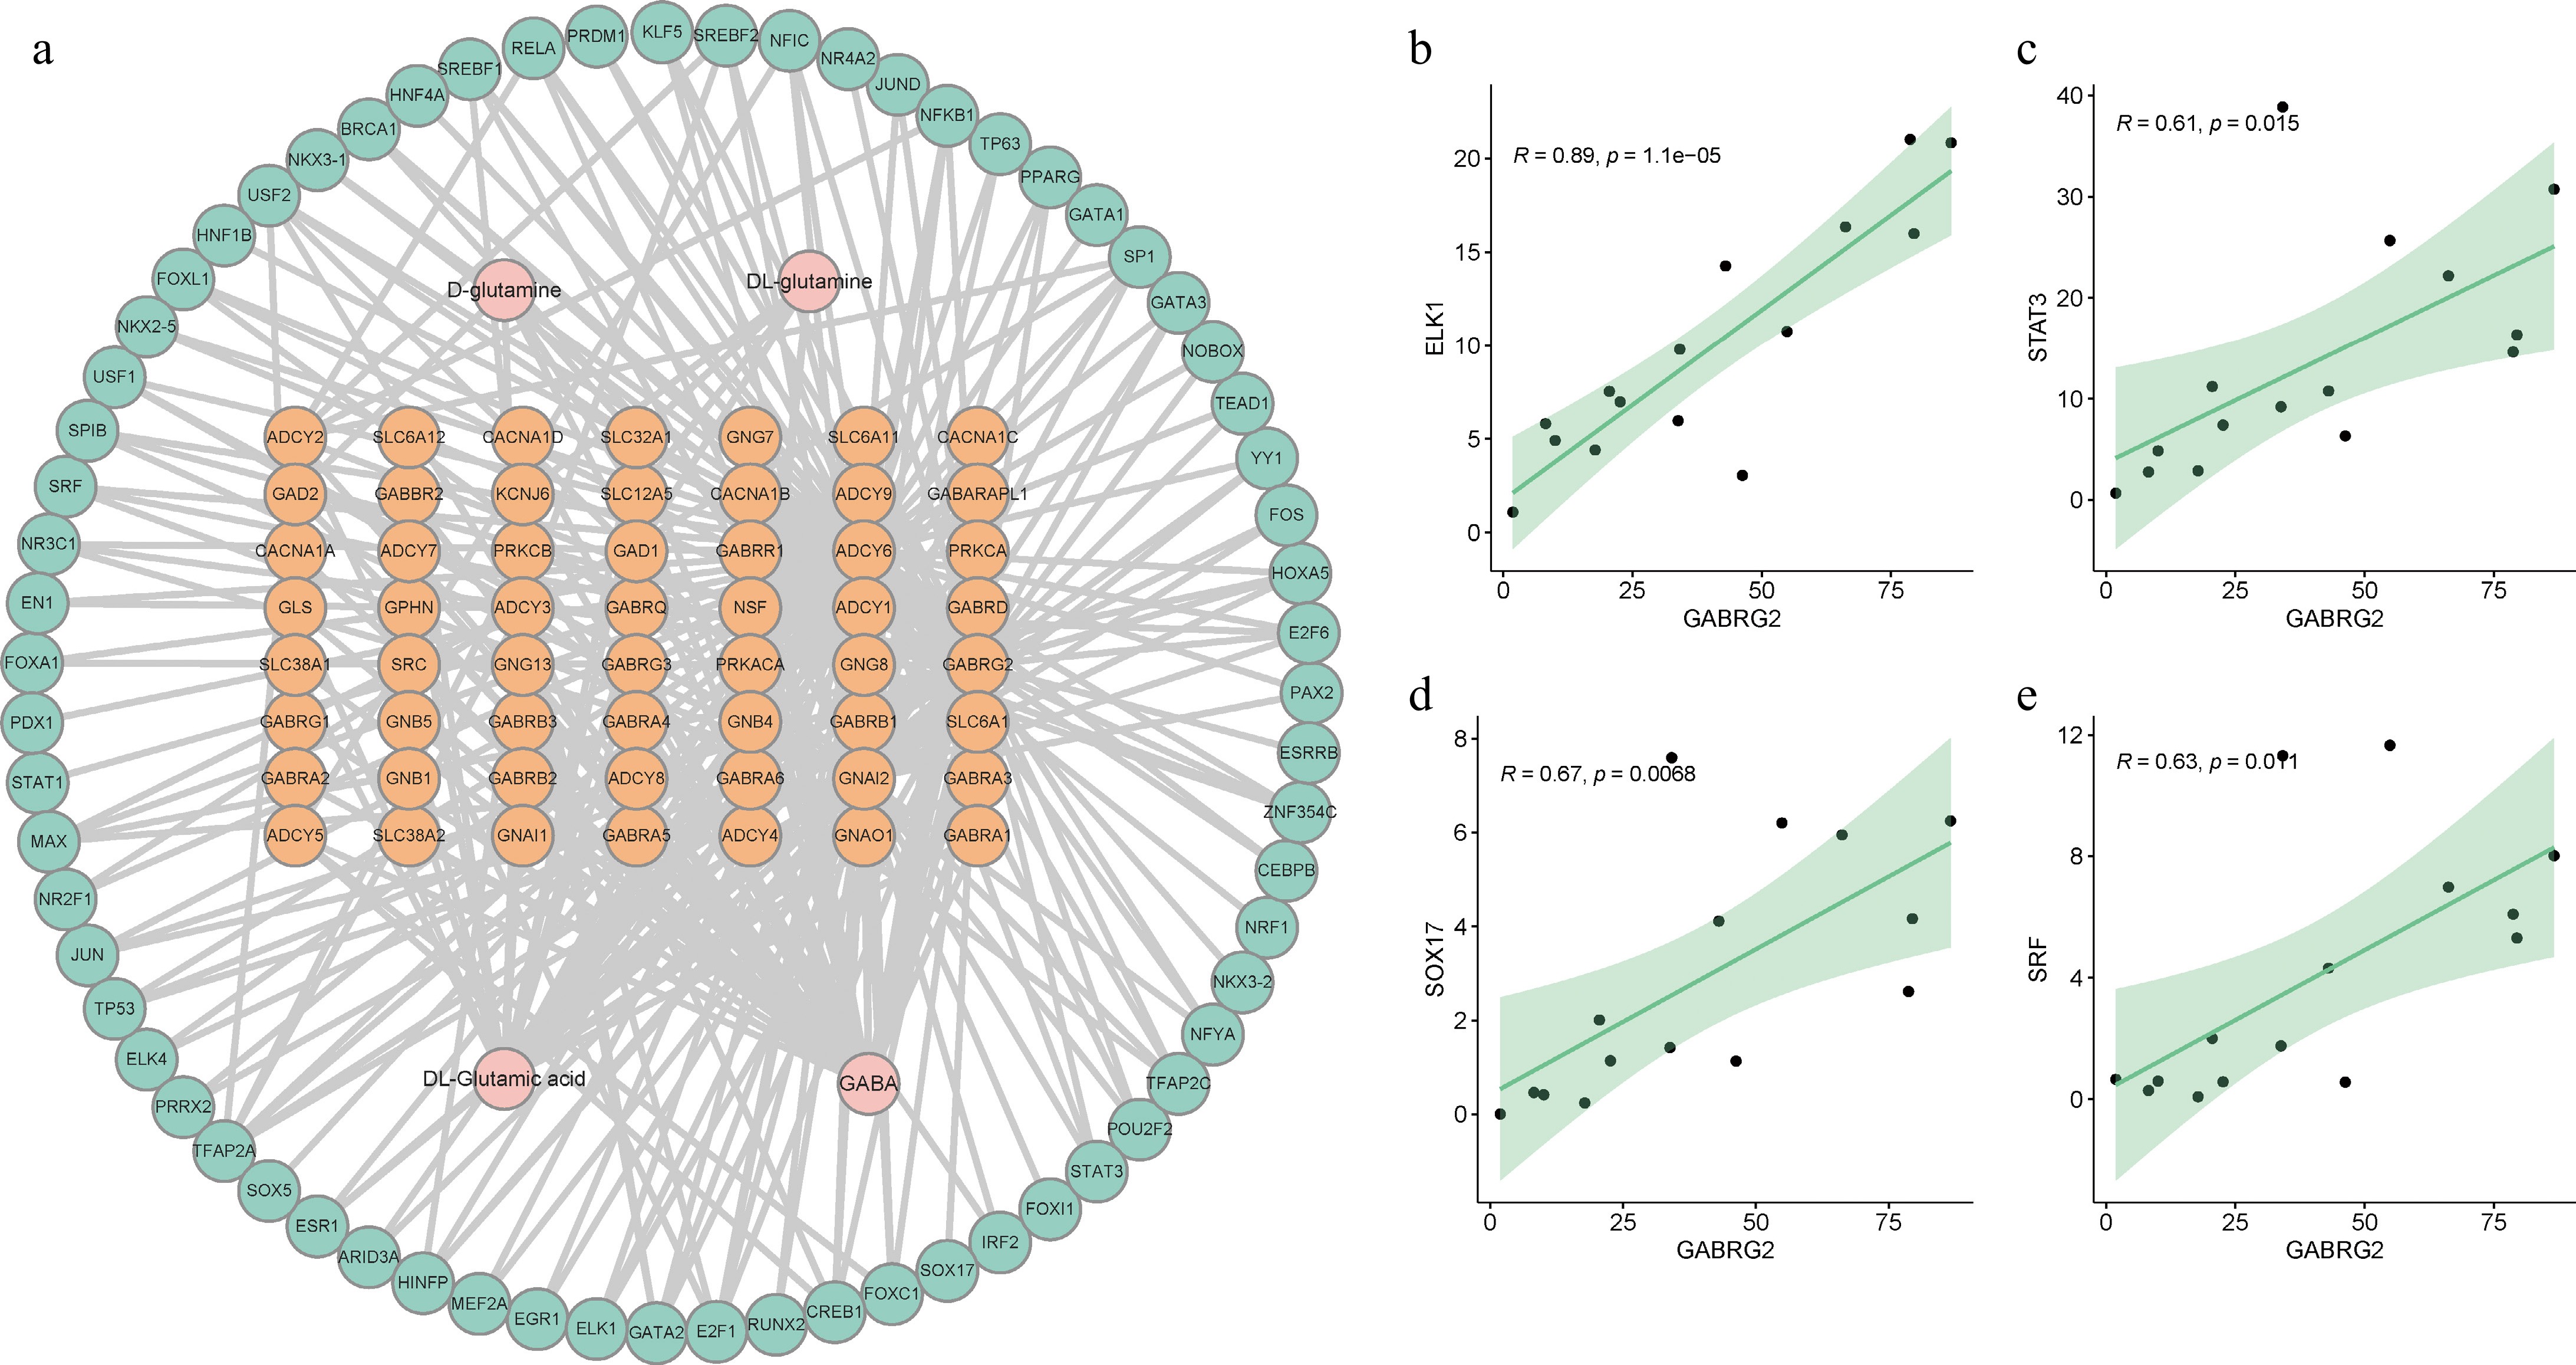
Figure 7.
Interaction network for GABA-related genes, transcription factors, and metabolites. (a) A comprehensive network of 273 regulatory pairs including interactions between GABA-related genes, transcription factors, and metabolites. (b)−(e) The correlation between the expression levels of specific transcription factors and the GABRG2 gene. Each panel shows the relative expression correlation for one of the transcription factors (ELK1, STAT3, SOX17, and SRF) with GABRG2, respectively.
Figures
(7)
Tables
(0)