-
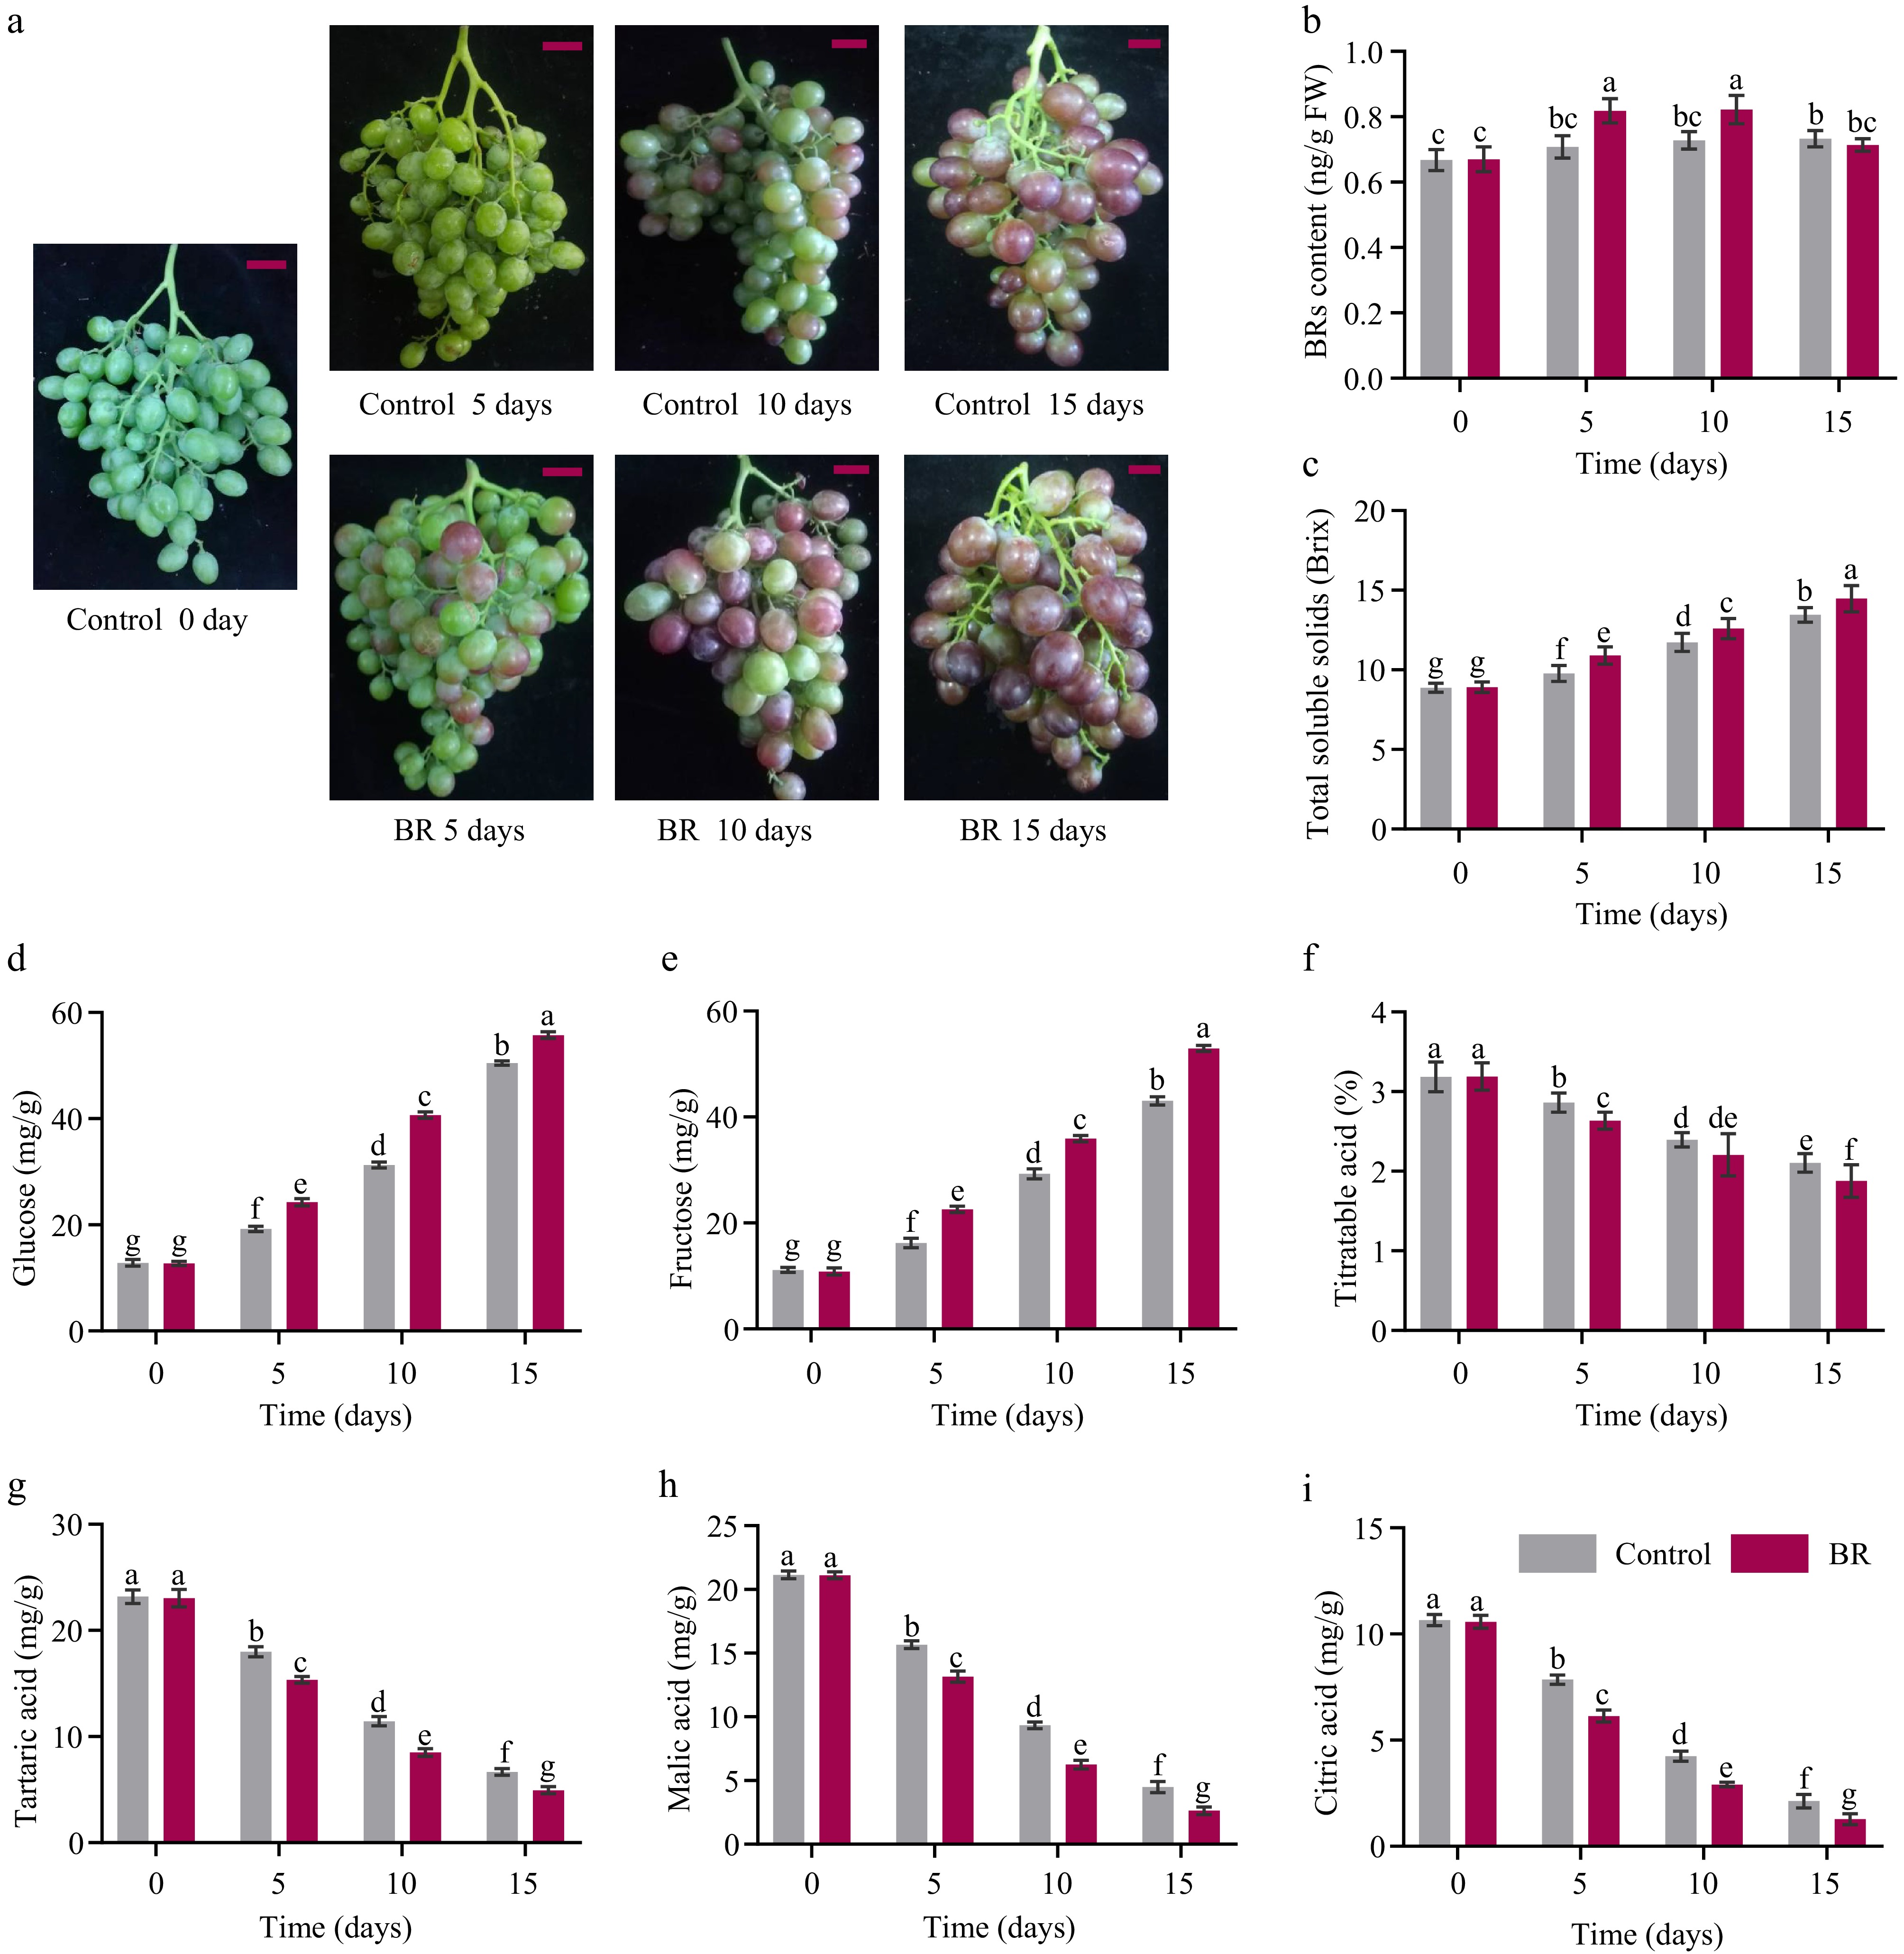
Figure 1.
The effect of exogenous 2,4-epibrassinolide (EBR) treatment on the berry ripening indexes of grape 'Muscat Hamburg'. (a) Color development and anthocyanin accumulation phenotypes under EBR treatment; The red bar indicates 5 cm, (b) BRs content, (c) total soluble solids, (d) glucose, (e) fructose, (f) titratable acid, (g) tartaric acid, (h) malic acid, and (i) citric acid were qualified post-EBR application. Data are expressed as the means ± standard deviation. Different letters indicate significant differences at p < 0.05 according to one-way ANOVA and Tukey's test.
-
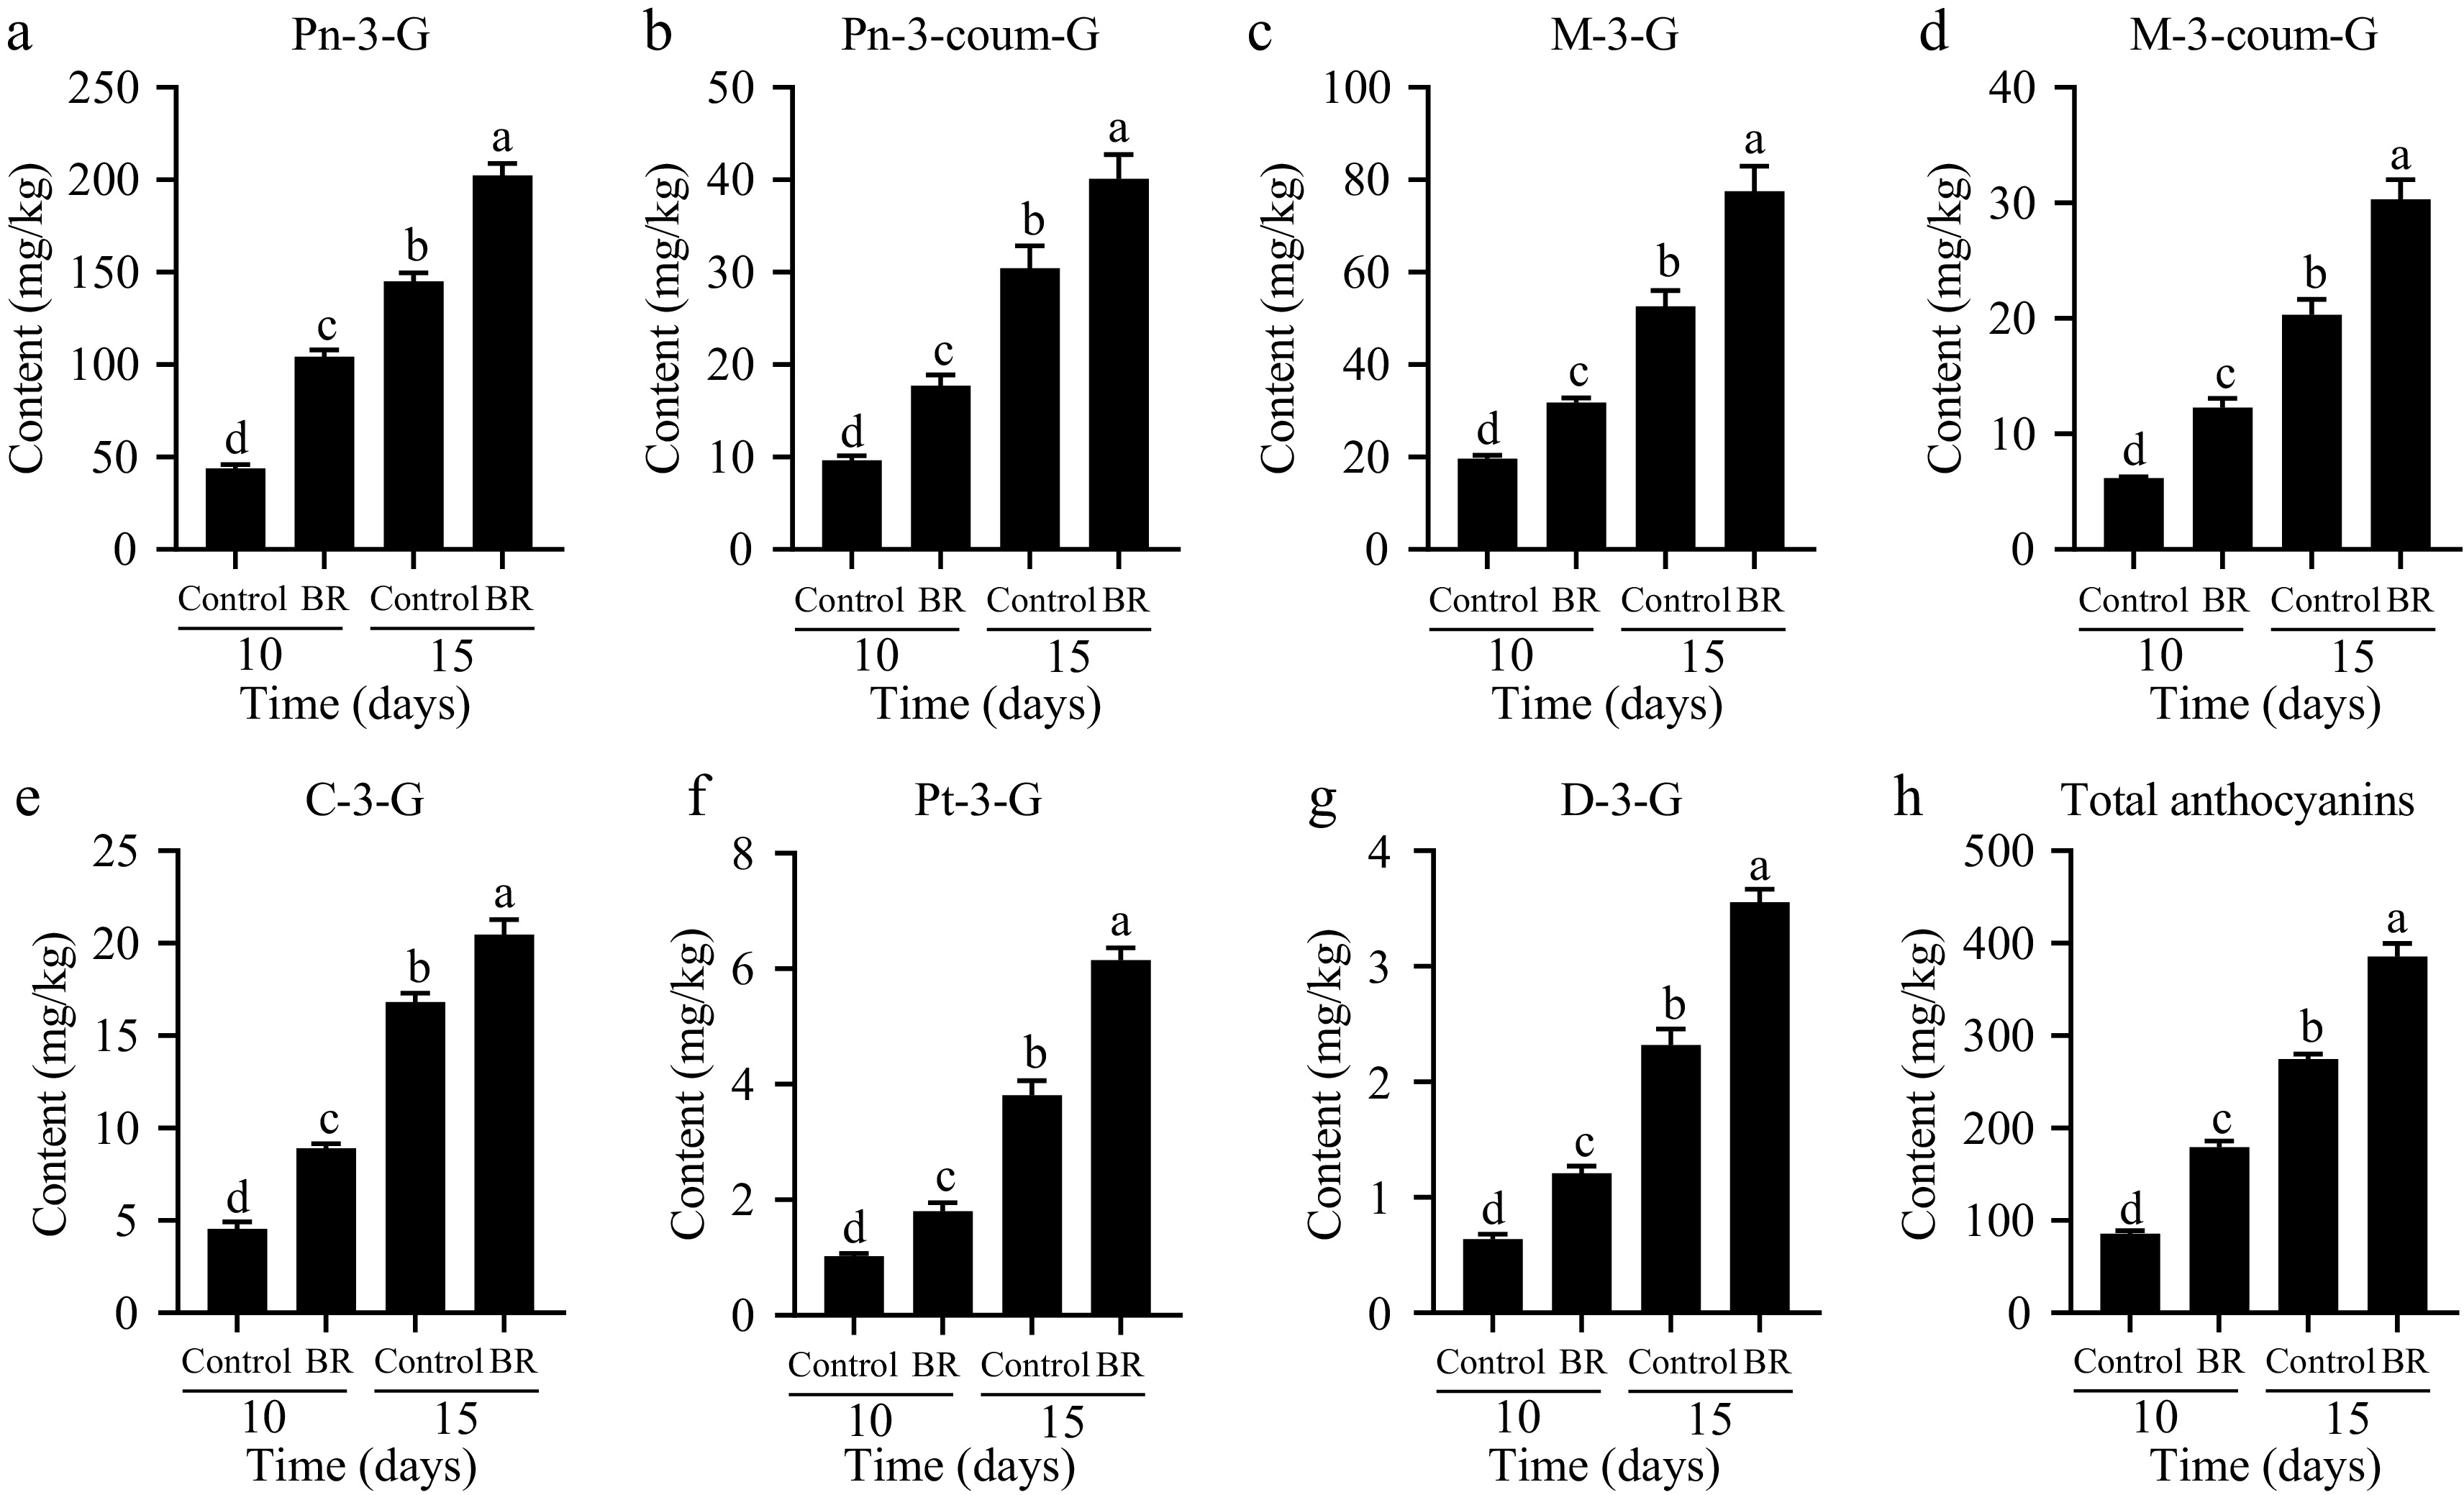
Figure 2.
The effect of exogenous 2,4-epibrassinolide (EBR) treatment on the content and constitute of anthocyanin during berry ripening process. (a) Pn-3-G, peonidin-3-O-glucoside. (b) Pn-3-coum-G, peonidin-3-O-(6-p-coumaroyl)-glucoside. (c) M-3-G, malvidin-3-O-glucoside. (d) M-3-coum-G, malvidin-3-O-(6-p-coumaroyl)-glucoside. (e) C-3-G, cyanidin-3-O-glucoside. (f) Pt-3-G, petunidin-3-O-glucoside. (g) D-3-G, delphinidin-3-O-glucoside. Data are shown as the means ± standard deviation of three biological replicate assays. Different letters indicate significant differences at p < 0.05 according to one-way ANOVA and Tukey's test.
-
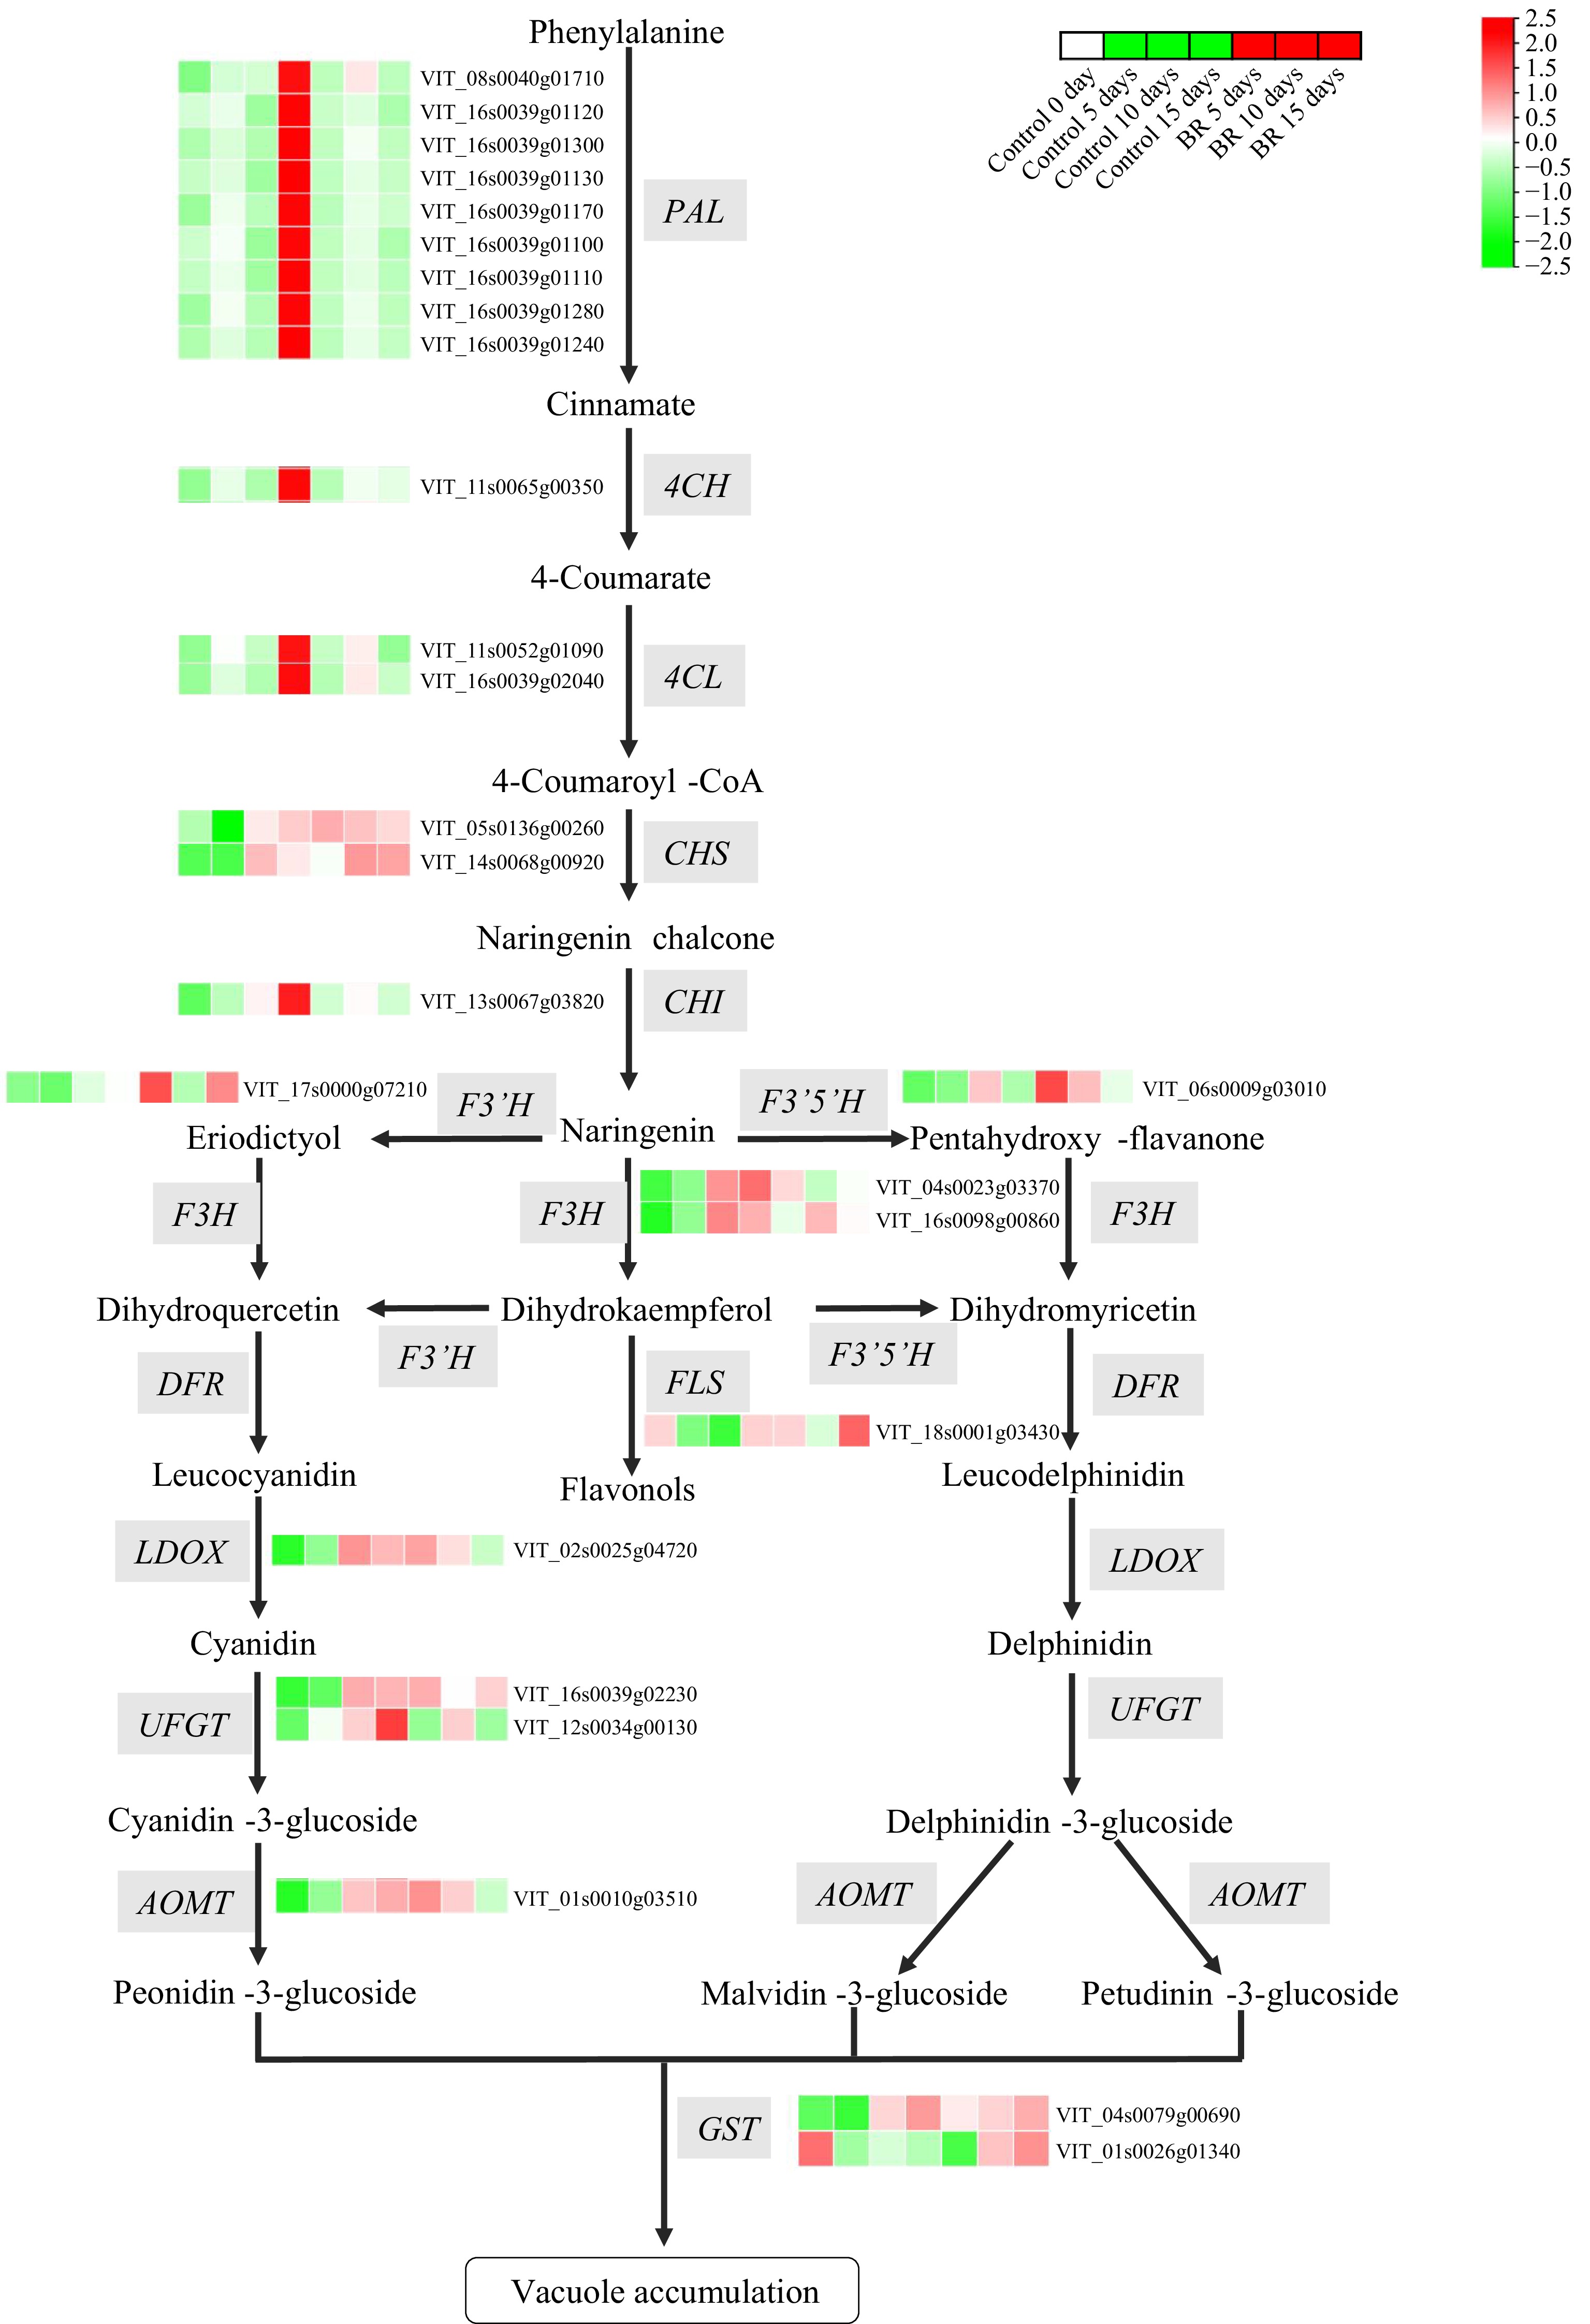
Figure 3.
The effect of exogenous 2,4-epibrassinolide (EBR) treatment on the anthocyanin biosynthetic pathway in grapevine berries. The heatmap was constructed based on relative log2 (FPKM) values obtained by RNA-Seq data during berry development. Green to red color indicates a gradual increase in gene expression level.
-
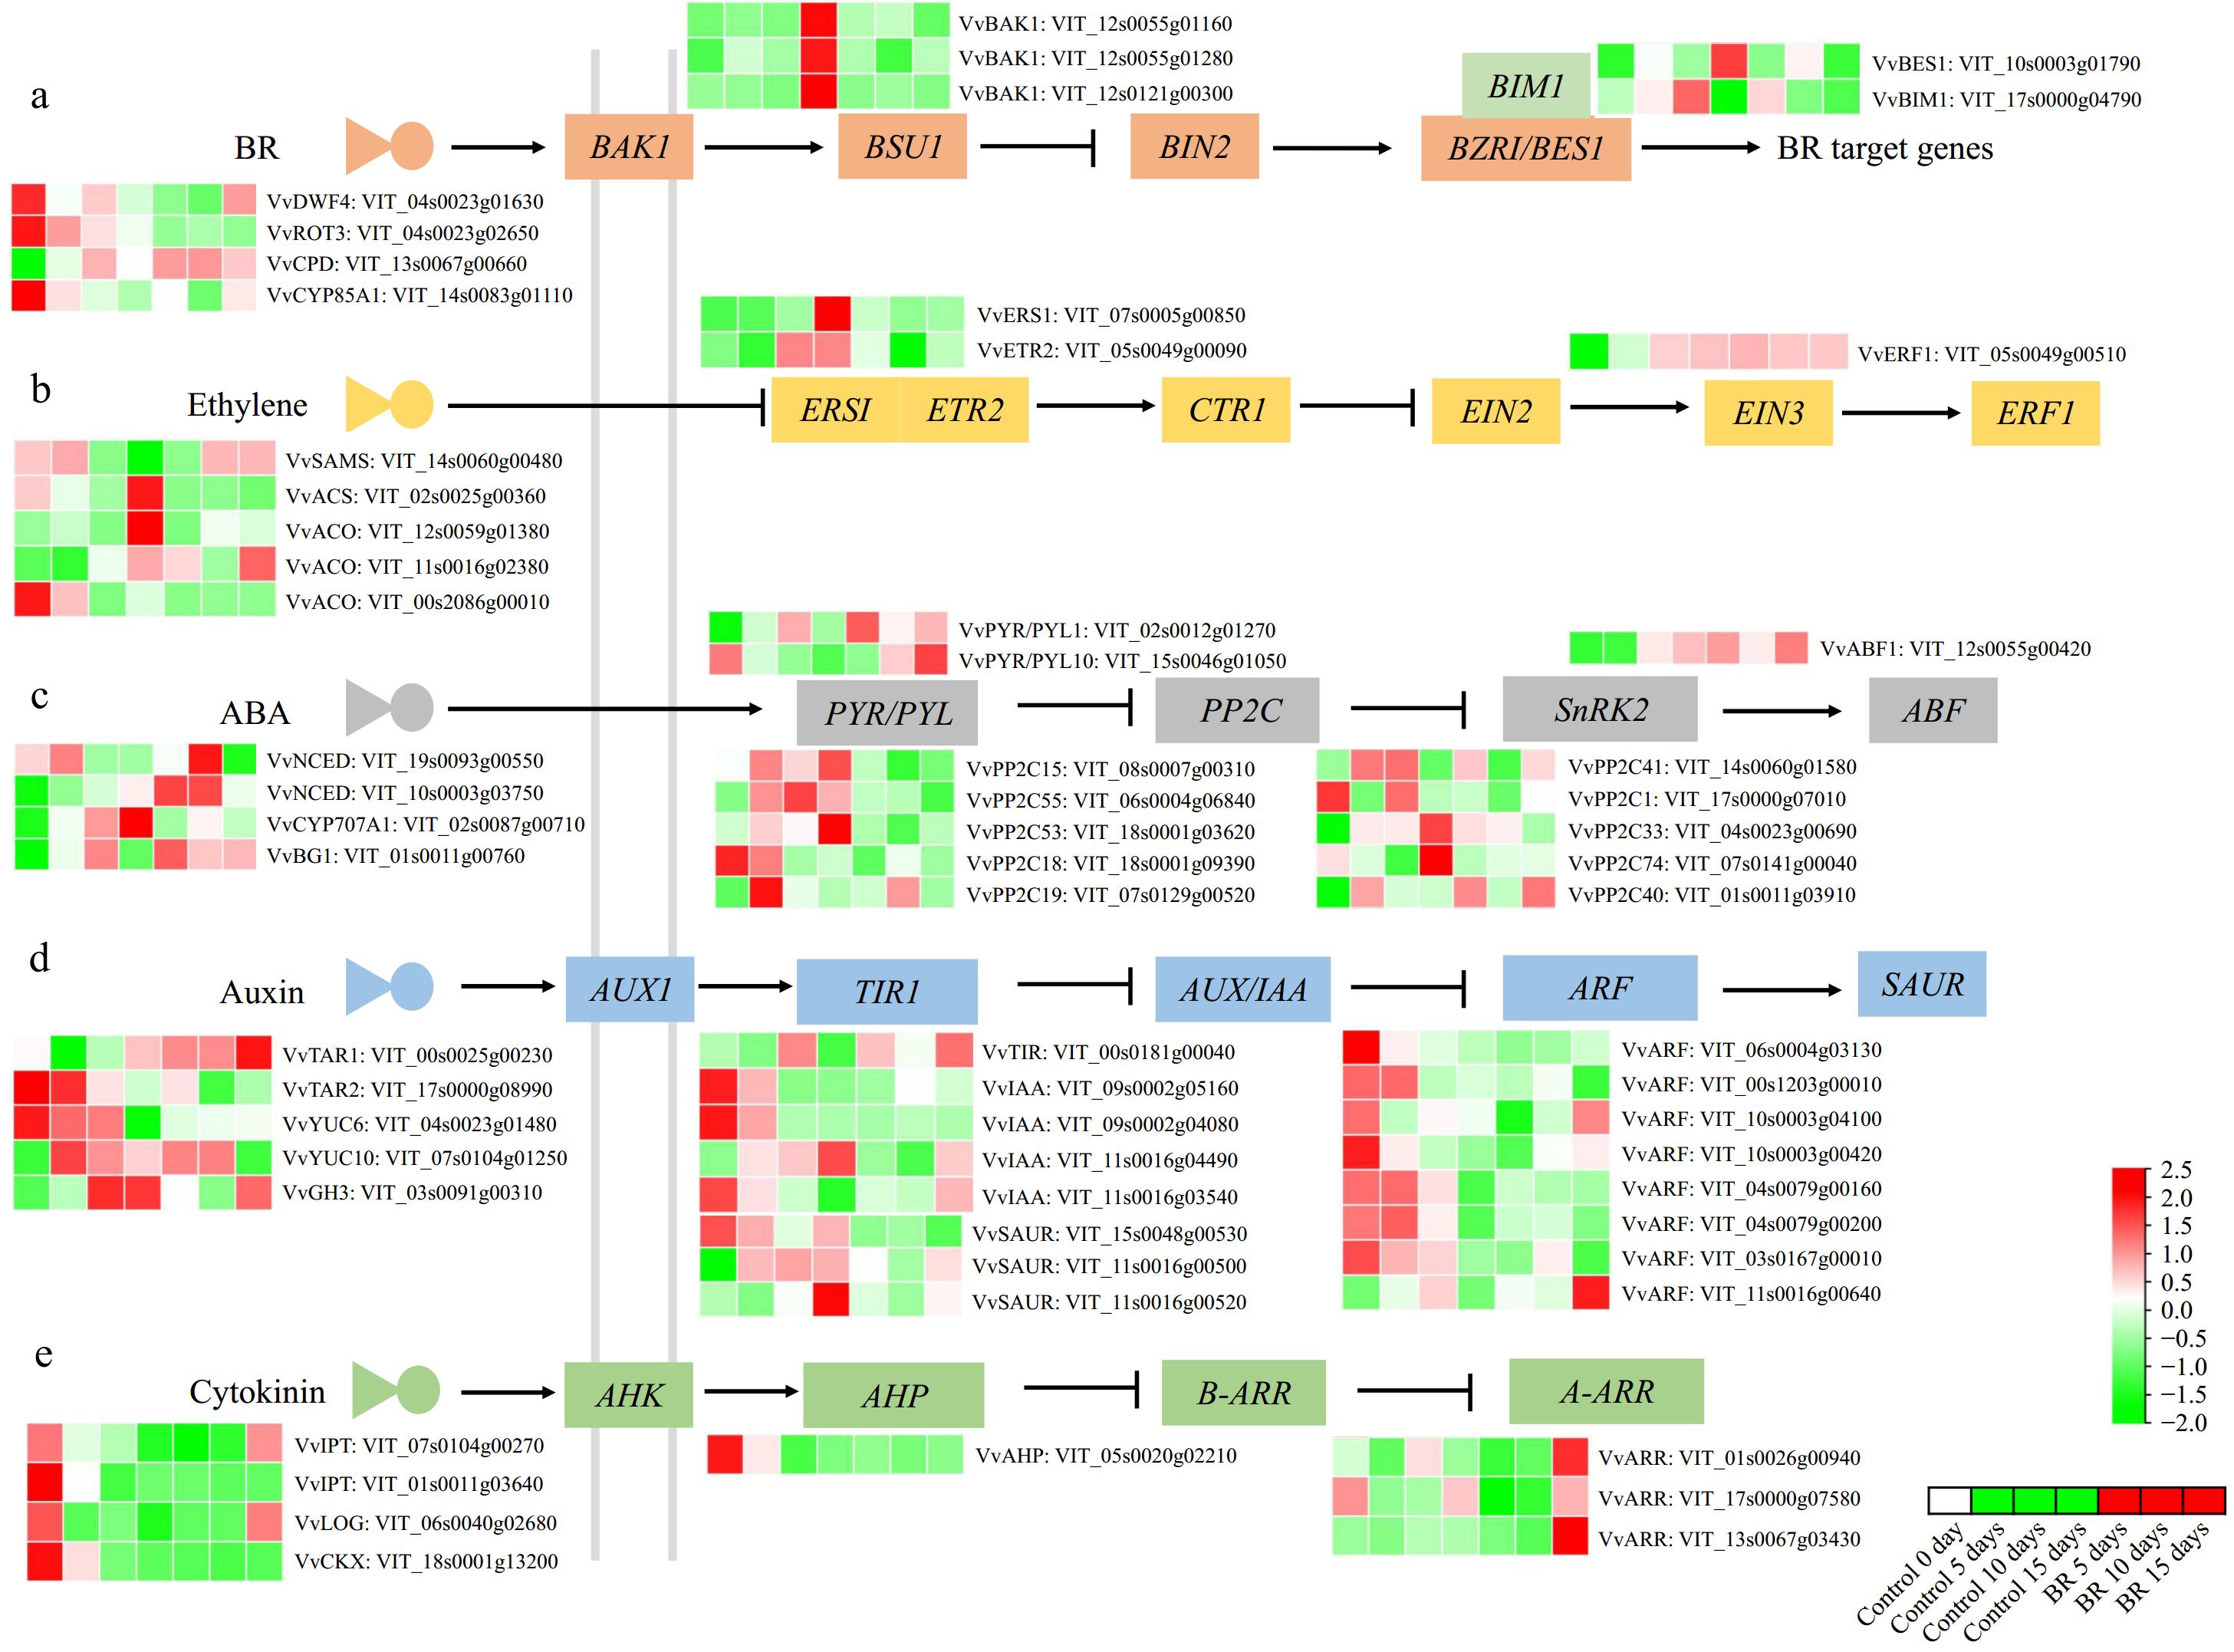
Figure 4.
The effect of exogenous 2,4-epibrassinolide (EBR) treatment on the phytohormones biosynthesis and signaling pathways in grapevine berries. (a) BRs, (b) ethylene, (c) abscisic acid (ABA), (d) auxin, and (e) cytokinin biosynthesis and signaling-related genes responded to EBR application, respectively. The heatmap was constructed based on relative log2 (FPKM) values obtained by RNA-Seq data during berry development. Green to red color indicates a gradual increase in gene expression level.
-
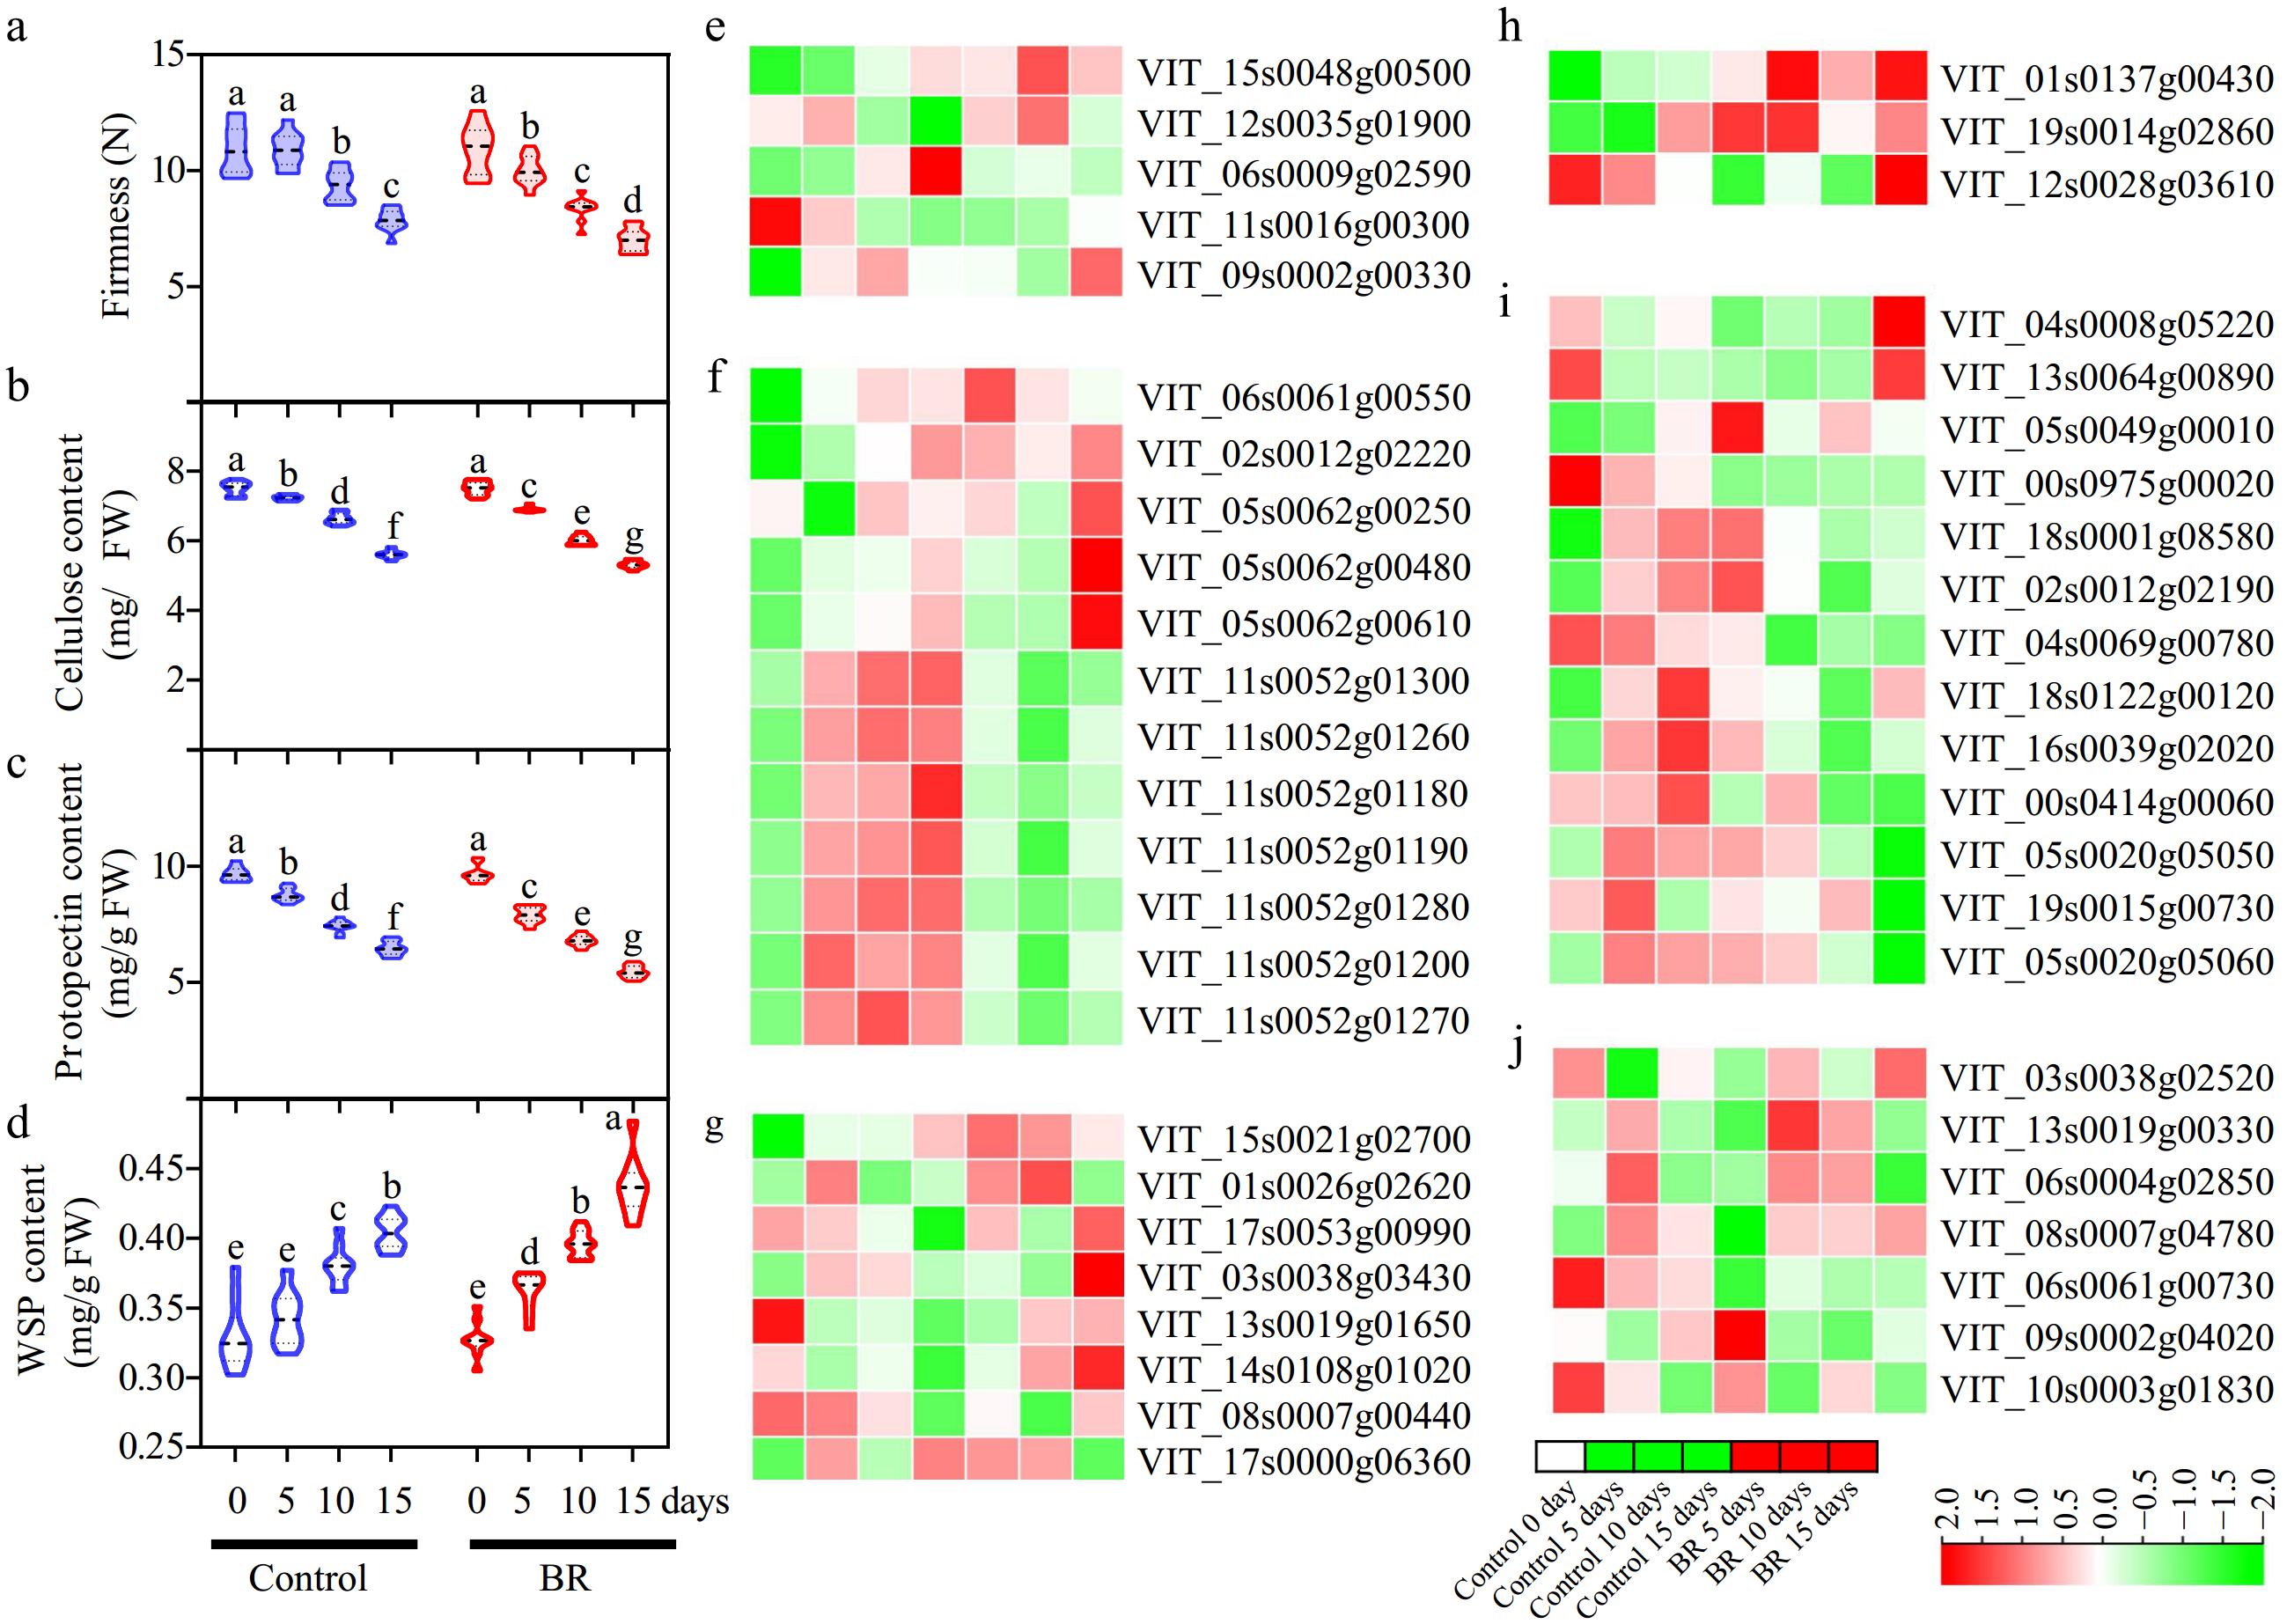
Figure 5.
The effect of exogenous 2,4-epibrassinolide (EBR) treatment on the cell wall components and the expression of genes related to the degrading enzymes of the cell wall. (a) Firmness, (b) cellulose, (c) protopectin, and (d) water-soluble pectin (WSP) content after EBR treatment. Data are expressed as mean ± standard from three biological replicates. Different letters indicate significant differences (p < 0.05) between two different treatments at each sampling point.
-
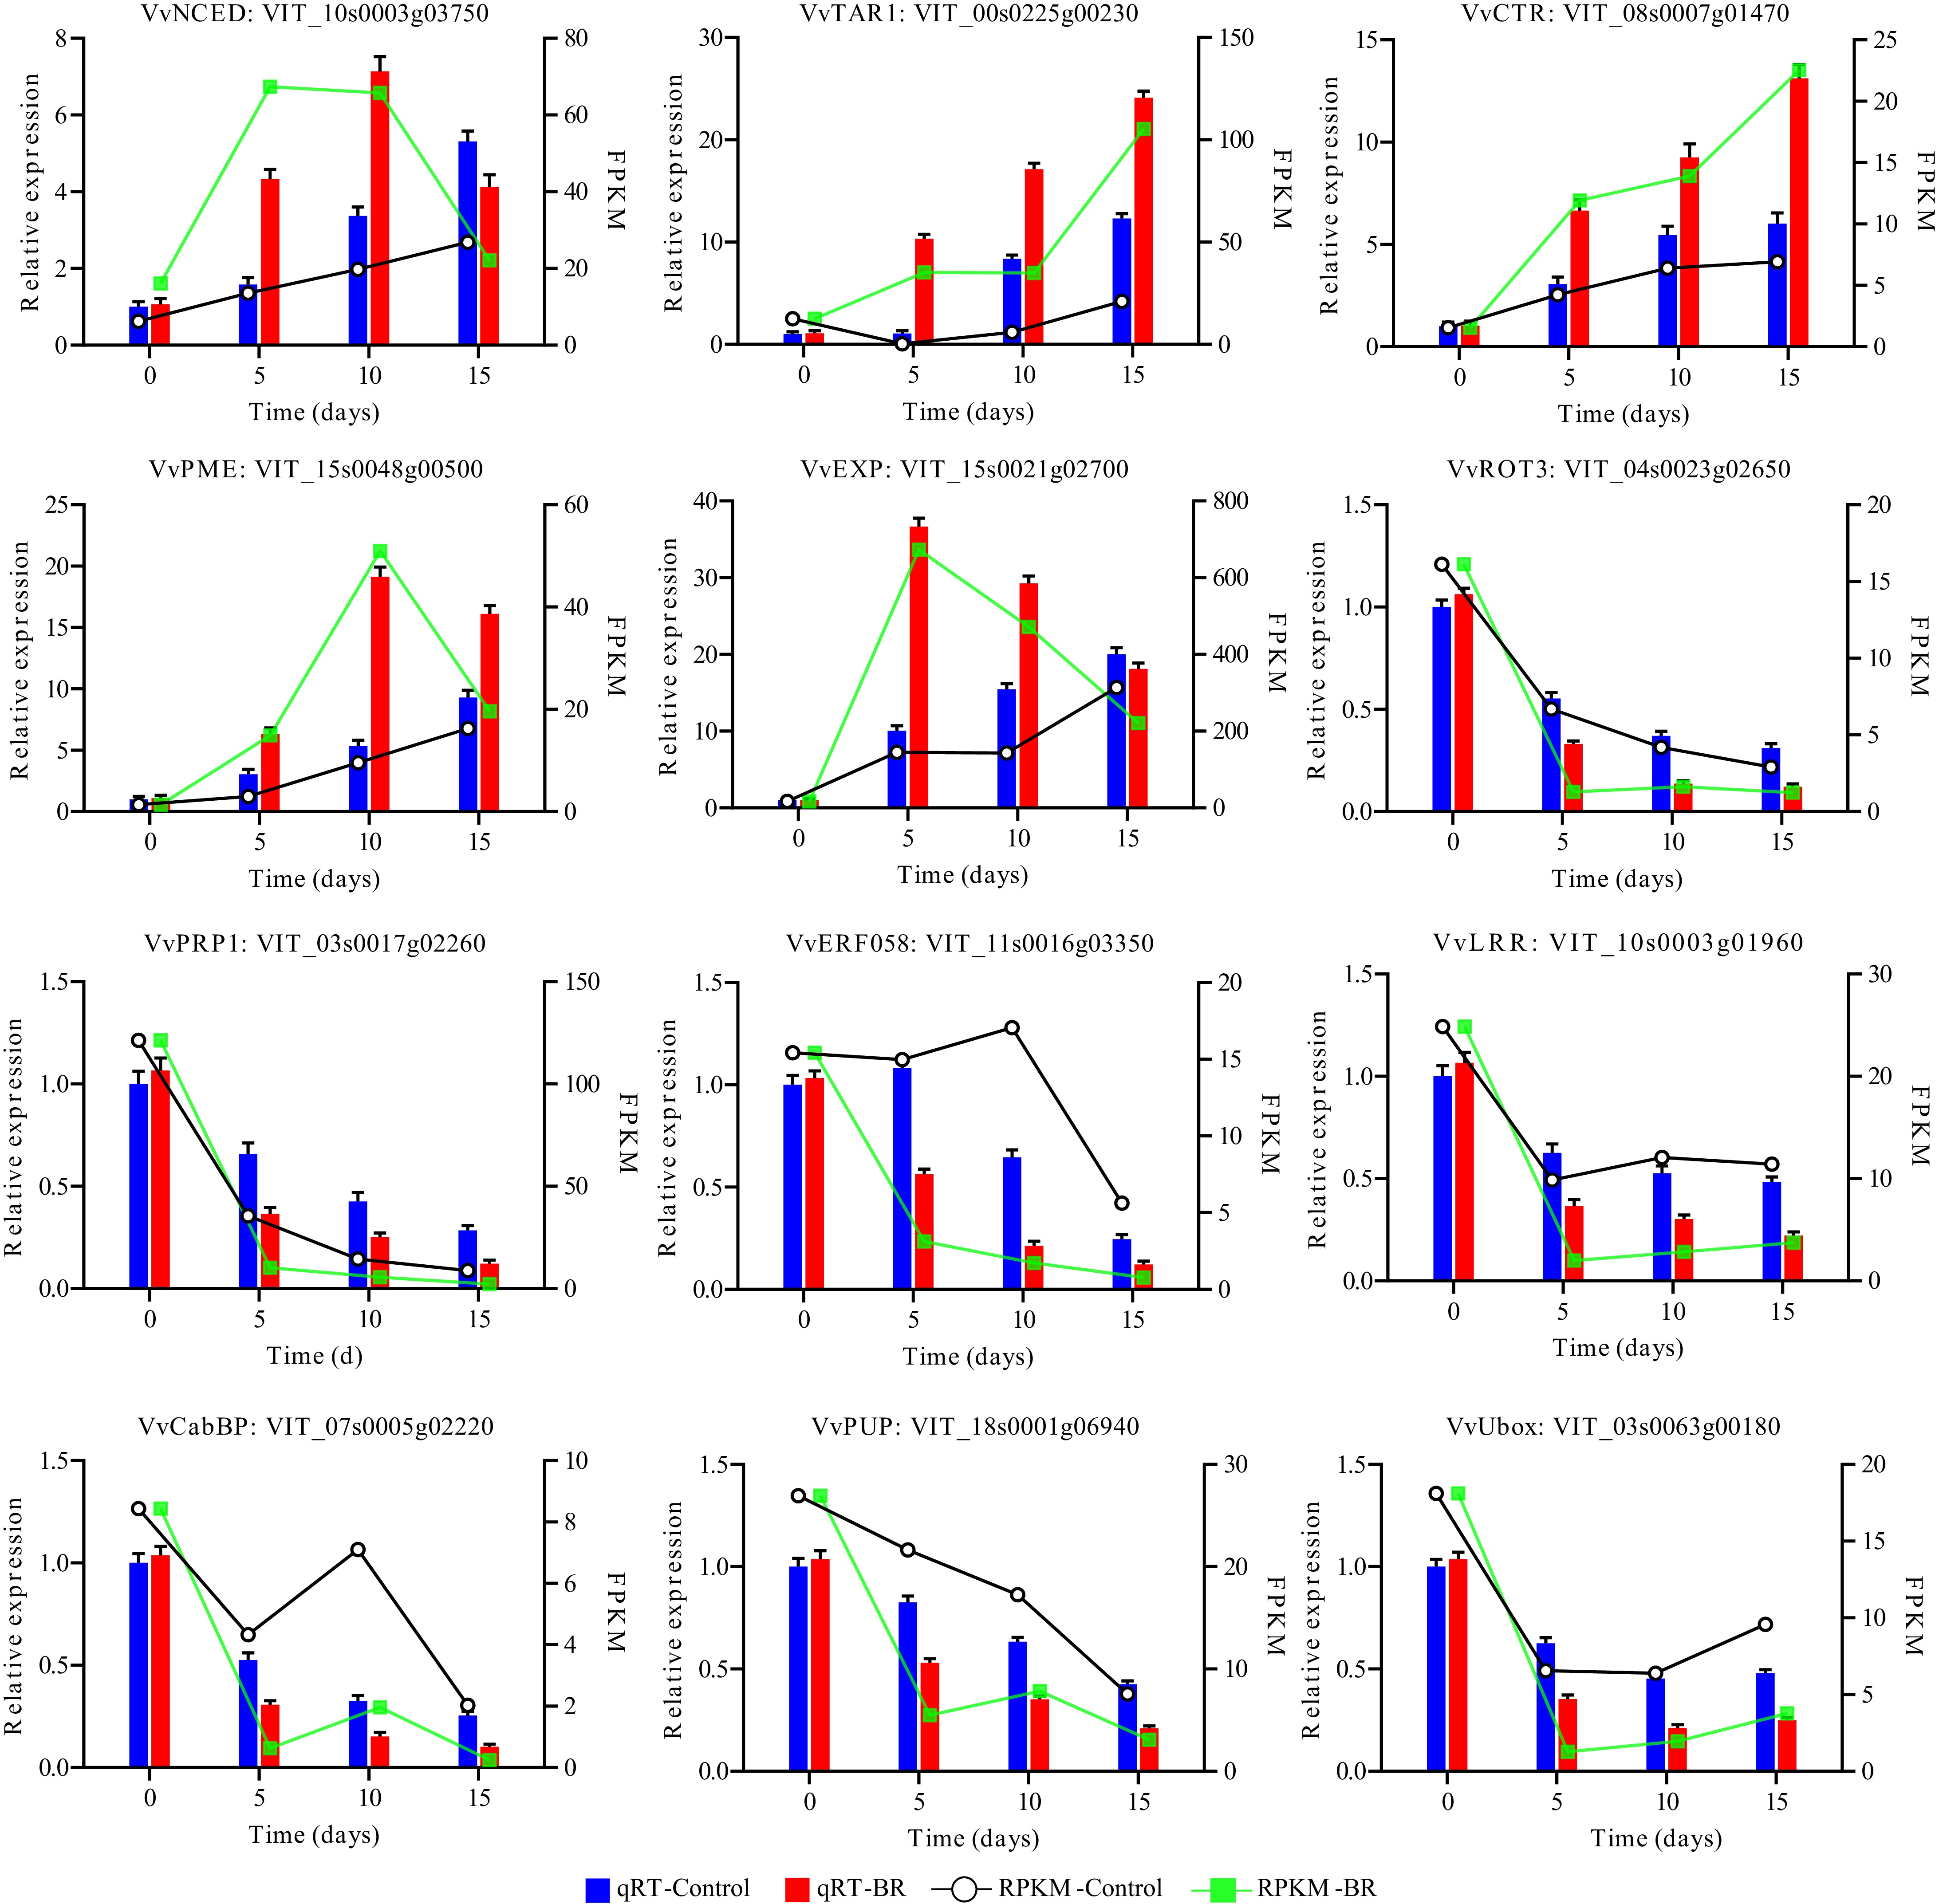
Figure 6.
Validation of 12 differentially expressed genes by qRT-PCR under EBR treatment in grapevine berry.
-
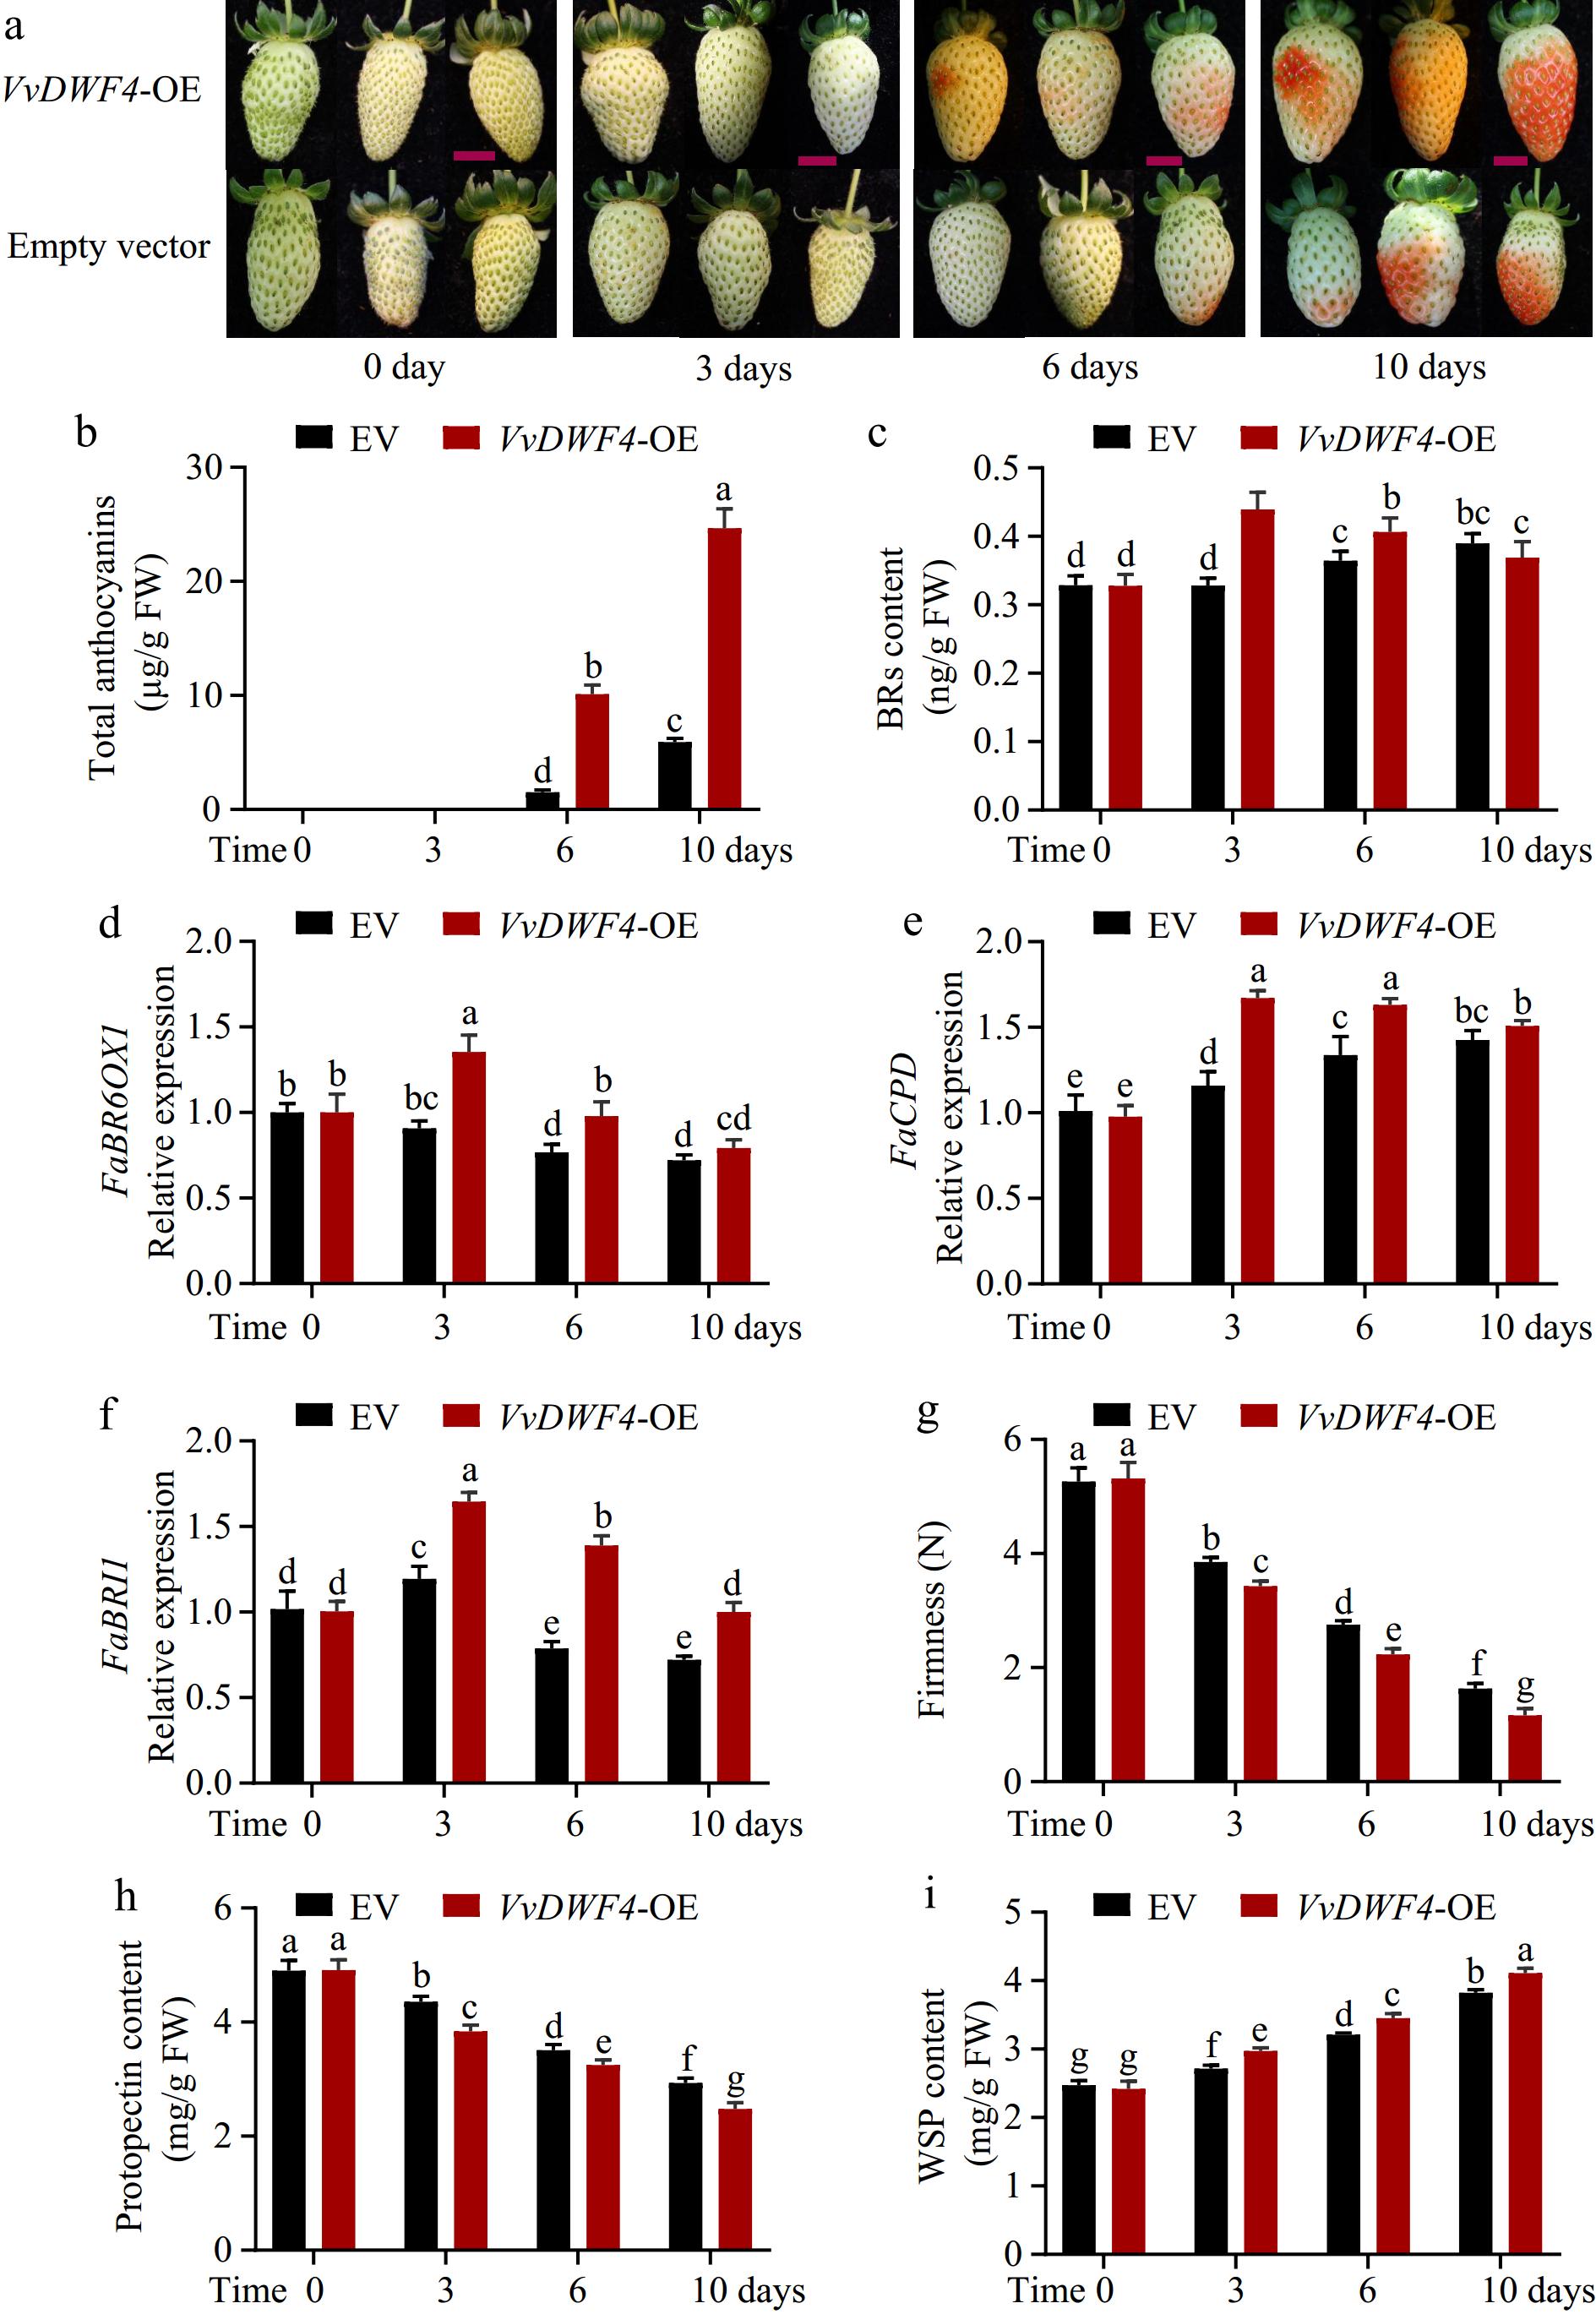
Figure 7.
Effects of transient overexpression of VvDWARF4 (VvDWF4) in strawberry fruits. (a) The phenotype of strawberry fruits after transient overexpression VvDWF4. The red bar indicates 5 cm. (b) Anthocyanin contents in grape shin. FW, fresh weight; EV, empty vector. (c) BRs content. The relative expression of brassinosteroid-6-oxidase (BR6OX1) (d), cytochrome P450 90A1 (CPD) (e), and BRASSINOSTEROID-INSENSITIVE 1 (BRI1) (f), respectively. (g) Firmness, (h) Protopectin, and (i) water-soluble pectin (WSP), content after transient overexpression VvDWF4. Data are expressed as mean ± standard from three biological replicate analysis, and different letters indicate significant differences (p < 0.05) between two different treatments at each sample.
Figures
(7)
Tables
(0)