-
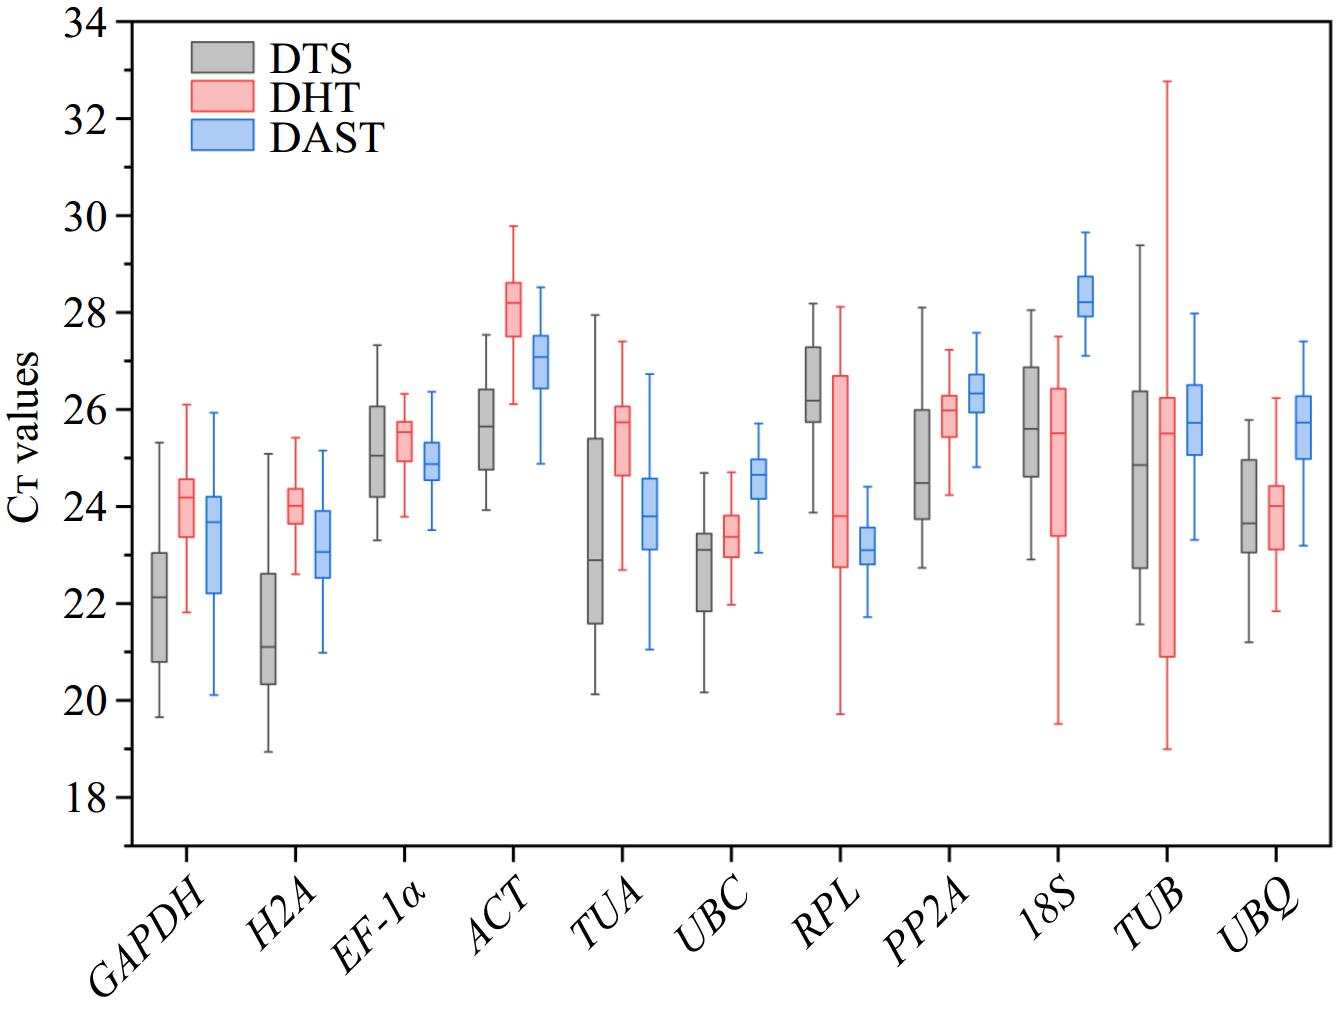
Figure 1.
The Cᴛ value distribution of 11 candidate reference genes in P. hunanense across three groups: DTS (roots, stems, leaves, flowers, rhizomes, buds), DHT (GA3, ABA, GA3 + ABA, dH2O), and DAST (high temperature, low temperature, drought, salinity, heavy metal stress). The center of the box represents the median; the upper edge of the box denotes the upper quartile; the lower edge of the box signifies the lower quartile; the top whisker indicates the maximum value; and the bottom whisker represents the minimum value.
-
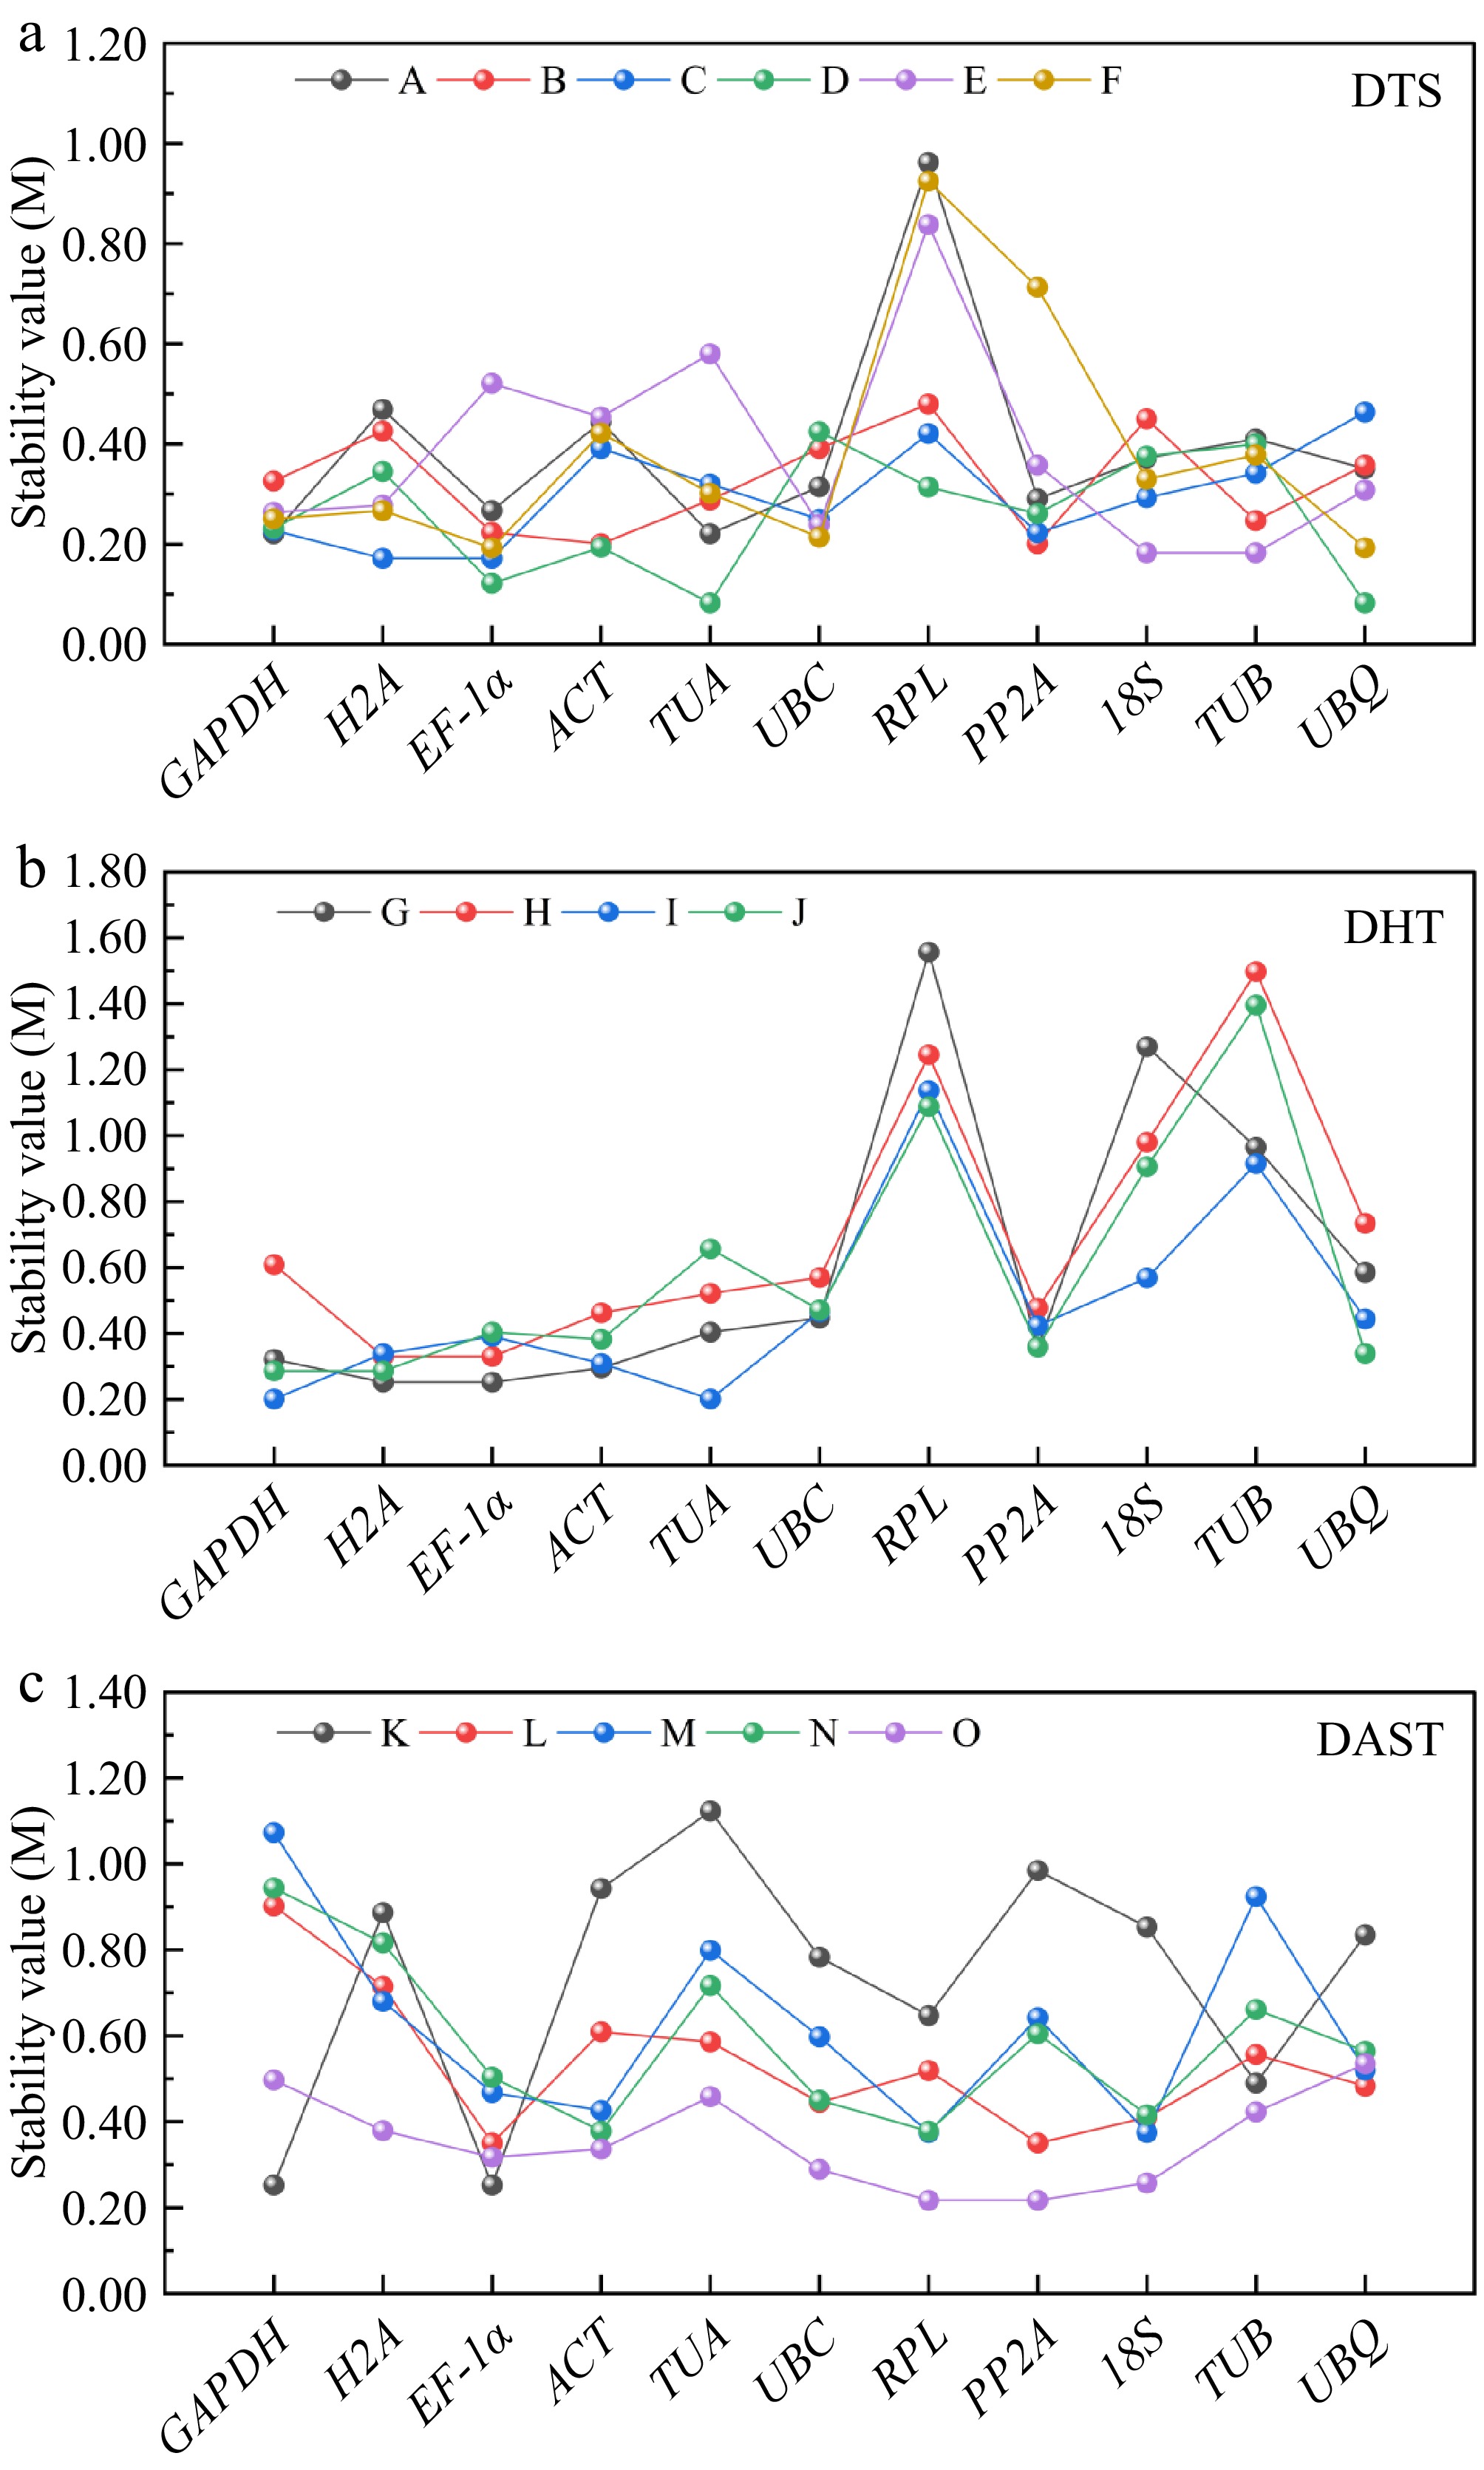
Figure 2.
Presents the stability evaluation of 11 candidate reference genes using GeNorm algorithm across three experimental groups: (a) tissues (DTS: root [A], stem [B], leaf [C], flower [D], rhizome [E], and bud [F]). (b) Hormonal treatments (DHT: GA3 [G], ABA [H], GA3 + ABA co-treatment [I], and dH2O control [J]). (c) Abiotic stresses (DAST: high-temperature [K], low-temperature [L], drought [M], salinity [N], and heavy metal [O]). The M-value metric, a well-established stability parameter in GeNorm analysis, inversely correlates with expression consistency, where values < 1.5 indicate superior stability.
-
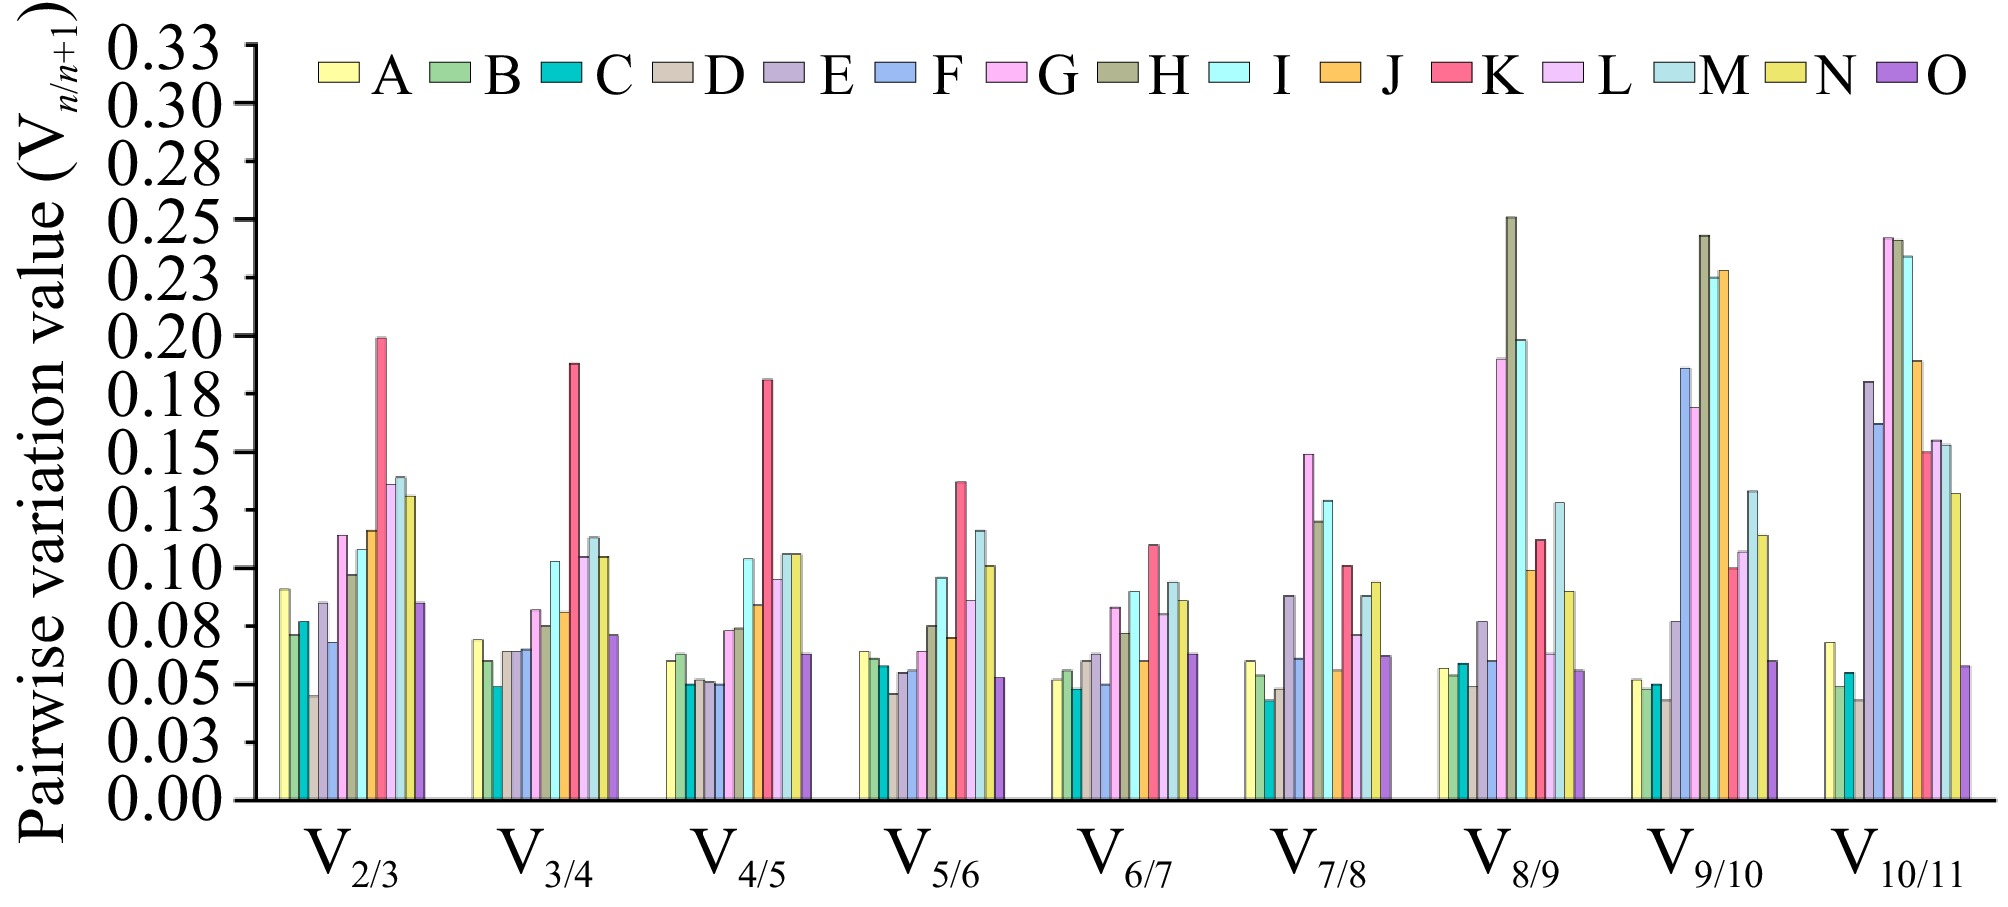
Figure 3.
The GeNorm algorithm was systematically applied to quantify sequential normalization factor variations (Vn/n+1) across 15 experimental conditions encompassing three biological dimensions: (A) root, (B) stem, (C) leaf, (D) flower, (E) rhizome, and (F) bud tissues; (G) GA3, (H) ABA, (I) GA3 + ABA, and (J) dH2O hormonal treatments; along with (K) high-temperature, (L) low-temperature, (M) drought, (N) salinity, and (O) heavy metal abiotic stress conditions. Using a predefined threshold of Vn/n+1 < 0.15 for stabilization validation, the minimum combinatorial requirement of reference genes was determined to ensure robust normalization of qRT-PCR datasets. This systematic evaluation established that dual reference gene combinations provided sufficient normalization precision across all examined biological scenarios, with GeNorm-derived stability values (M) consistently below the recommended cut-off threshold.
-
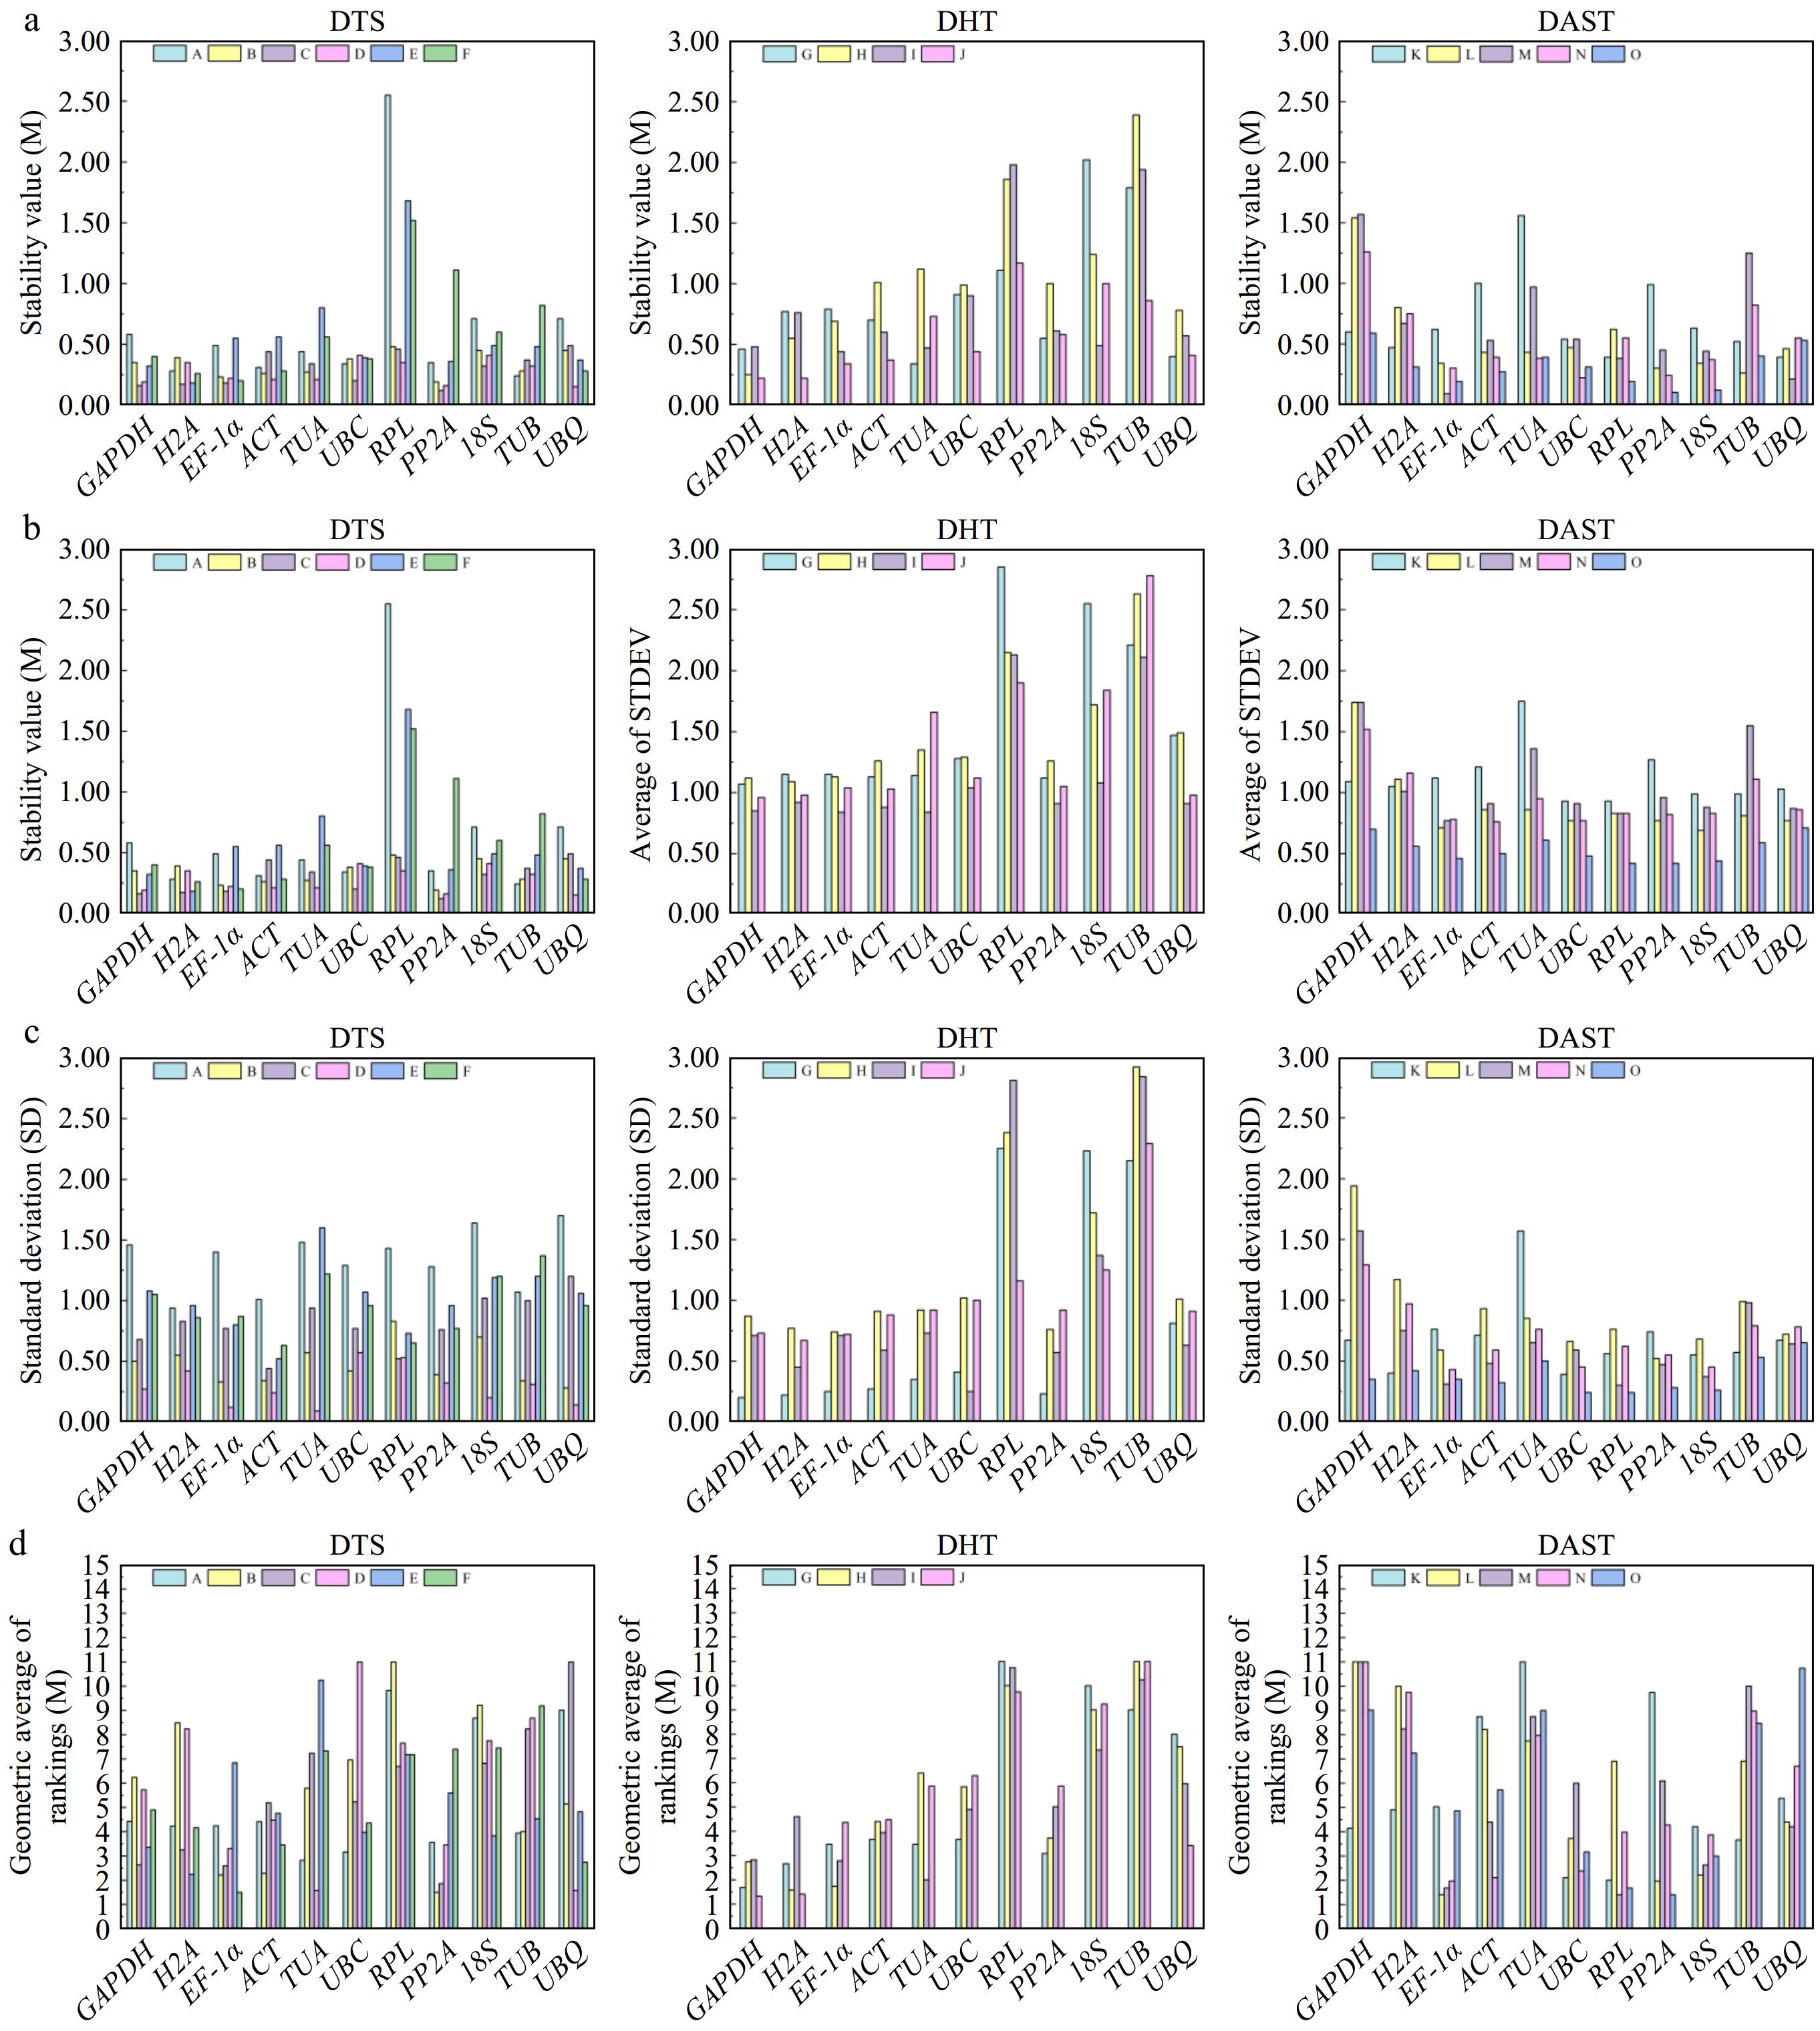
Figure 4.
Presents the stability analysis results of candidate reference genes for P. hunanense across diverse tissues, various hormone treatments, and different abiotic stresses using four software tools. Panels (a)−(d) respectively represent the results calculated by NormFinder, Delta Cᴛ, BestKeeper, and RefFinder. The lower the height of the rectangular column, the higher the stability of the reference gene. DTS includes (A) root, (B) stem, (C) leaf, (D) flower, (E) rhizome, and (F) bud. DHT consists of (G) GA3, (H) ABA, (I) GA3 + ABA , and (J) dH2O. DAST comprises (K) high-temperature stress, (L) low-temperature stress, (M) drought stress, (N) salinity stress, and (O) heavy metal stress.
-
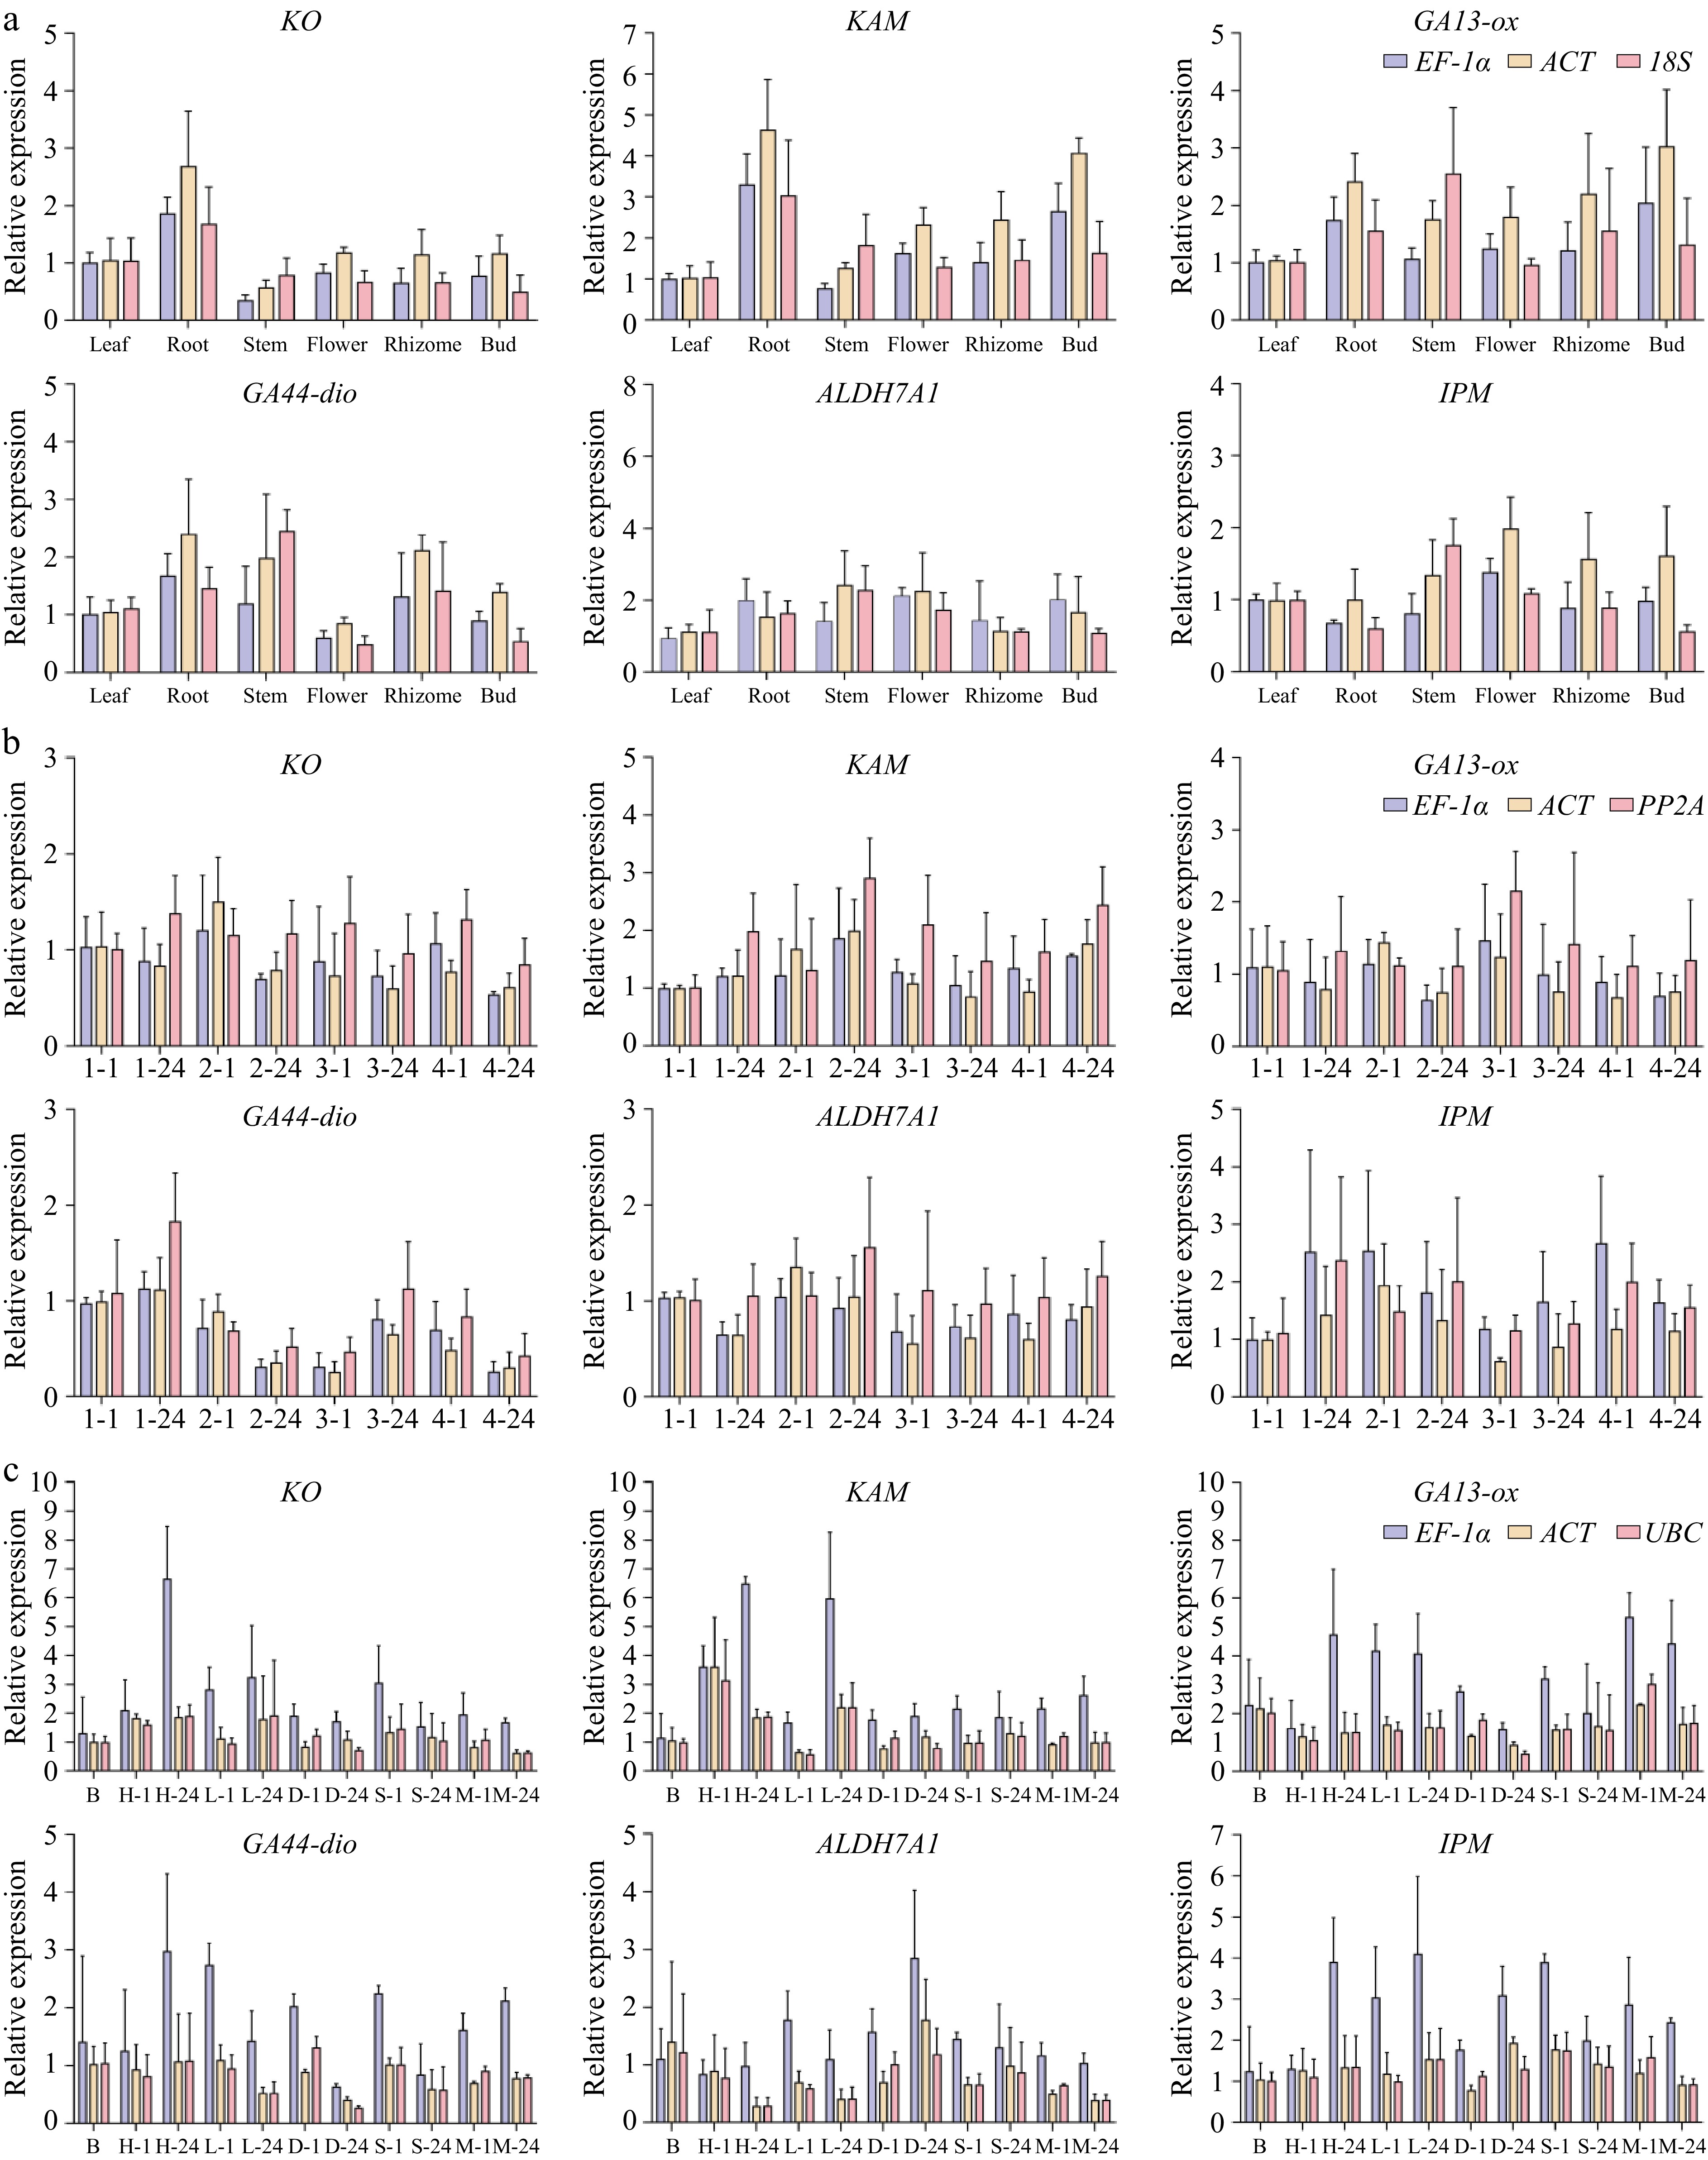
Figure 5.
Demonstrates the expression patterns of phytohormone metabolism-associated genes in P. hunanense across heterogeneous biological samples. (KO: ent-kaurene oxidase; KAM: ent-kaurenoic acid monooxygenase; GA13-ox: gibberellin 13-oxidase; GA44-dio: gibberellin 44-dioxygenase; ALDH7A1: aldehyde dehydrogenase family 7 member A1; IPM: indole-3-pyruvate monooxygenase) across three experimental dimensions, with all data points representing means ± standard error (n = 3). (a) Tissue expression was quantified in root, stem, leaf, flower, rhizome, and bud using the EF-1α, ACT and 18S normalization system. The relative expression of the target gene under distinct hormone inductions and time periods was calculated by taking EF-1α, PP2A, and H2A as internal references; (b) The relative expression of the target gene under distinct hormone inductions and time periods was calculated by taking EF-1α, PP2A, and H2A as internal references; the x-axis represents the various hormone induction conditions, from left to right being dH2O for 1 h, dH2O at 24 h, ABA at 1 h, ABA at 24 h, GA3 at 1 h, GA3 at 24 h, GA3+ ABA at 1 h, and GA3 + ABA at 24 h. (c) The relative expression of the target gene under different abiotic stress treatments and timeframes was determined using EF-1α, UBC, and 18S as internal references.The x-axis indicates the diverse treatment conditions, from left to right: blank control, high temperature at 1 h, high temperature at 24 h, low temperature at 1 h, low temperature at 24 h, drought at 1 h, drought at 24 h, salinity stress at 1 h, salinity stress at 24 h, heavy metal stress at 1 h and heavy metal stress at 24 h.
-
Gene Slope (k) Correlation
coefficient (R2)Amplification
efficiency (%)GAPDH −3.416 0.9785 96.19 H2A −3.331 0.9827 99.63 EF-1α −3.137 0.9683 108.31 ACT −3.096 0.9990 110.40 TUA −3.048 0.9784 112.86 UBC −3.342 0.9771 99.16 RPL −3.514 0.9771 92.56 PP2A −3.165 0.9698 106.99 18S −3.251 0.9591 103.02 TUB −3.292 0.9628 101.25 UBQ −3.297 0.9849 101.05 Glyceraldehyde-3-phosphate dehydrogenase, GAPDH; Histone H2A, H2A; Elongation factor 1-alpha, EF-lα; Actin, ACT; Tubulin alpha, TUA; Ubiquitin-conjugating enzyme, UBC; Ribosomal protein L, RPL; Protein Phosphatase 2A, PP2A; 18S ribosome RNA, 18S; Tubulin beta, TUB; and Ubiquitin, UBQ. Table 1.
Primer amplification parameters of 11 candidate reference genes in P. hunanense.
-
Gene GeNorm NormFinder Delta Cᴛ BestKeeper RefFinder M Rank M Rank SD Rank SD Rank Stability Rank GAPDH 0.918 7 0.68 6 1.17 5 1.32 8 6.12 7 H2A 0.962 8 0.56 5 1.15 4 1.37 9 5.83 5 EF-1α 0.498 1 0.36 1 1.02 1 1.03 4 1.41 1 ACT 0.498 1 0.39 2 1.05 2 0.86 1 1.68 2 TUA 1.050 9 1.09 9 1.42 9 1.83 10 9.24 10 UBC 0.698 3 0.77 7 1.22 6 0.95 3 4.41 4 RPL 1.309 11 1.19 10 2.08 11 0.83 1 6.04 6 PP2A 0.862 6 0.49 3 1.23 7 1.05 6 6.24 8 18S 0.767 4 0.52 4 1.12 3 1.17 7 3.98 3 TUB 1.137 10 1.28 11 1.62 10 1.96 11 10.24 11 UBQ 0.813 5 0.83 8 1.32 8 1.03 4 6.32 9 Table 2.
Reference gene stability of different tissues were comprehensively analyzed.
-
Gene GeNorm NormFinder Delta Cᴛ BestKeeper RefFinder M Rank M Rank SD Rank SD Rank Stability Rank GAPDH 0.496 5 0.42 1 1.13 3 0.78 6 3.08 5 H2A 0.465 4 0.58 3 1.13 3 0.55 1 2.21 2 EF-1α 0.448 3 0.57 2 1.12 1 0.62 2 1.86 1 ACT 0.436 1 0.67 5 1.15 4 0.72 5 2.99 4 TUA 0.707 8 0.87 8 1.42 8 0.95 8 8.00 8 UBC 0.541 6 0.81 7 1.26 6 0.65 3 5.63 6 RPL 1.263 10 1.61 9 2.38 10 2.19 10 10.00 10 PP2A 0.436 1 0.69 6 1.16 5 0.65 3 2.94 3 18S 0.982 9 1.25 10 1.96 9 1.75 9 9.00 9 TUB 1.521 11 2.01 11 2.68 11 2.78 11 11.00 11 UBQ 0.632 7 0.59 4 1.33 7 0.83 7 6.74 7 Table 3.
Reference gene stability of different hormone treatment was comprehensively analyzed.
-
Gene GeNorm NormFinder Delta Cᴛ BestKeeper RefFinder M Rank M Rank SD Rank SD Rank Stability Rank GAPDH 1.071 11 1.15 11 1.52 11 1.20 11 11.00 11 H2A 0.871 9 0.70 8 1.19 9 0.92 9 8.74 9 EF-1α 0.676 6 0.34 1 0.91 4 0.50 2 2.63 3 ACT 0.618 4 0.55 7 0.97 6 0.64 6 5.42 5 TUA 0.970 10 0.95 10 1.42 10 1.09 10 10.00 10 UBC 0.553 1 0.47 4 0.89 2 0.49 1 1.86 2 RPL 0.593 3 0.45 3 0.89 2 0.55 5 3.08 4 PP2A 0.707 7 0.53 6 0.99 7 0.52 4 6.09 7 18S 0.553 1 0.40 2 0.88 1 0.50 2 1.57 1 TUB 0.784 8 0.70 8 1.18 8 0.84 8 8.24 8 UBQ 0.642 5 0.47 4 0.94 5 0.70 7 5.44 6 Table 4.
Reference gene stability of different abiotic stress treatments was comprehensively analyzed.
Figures
(5)
Tables
(4)