-
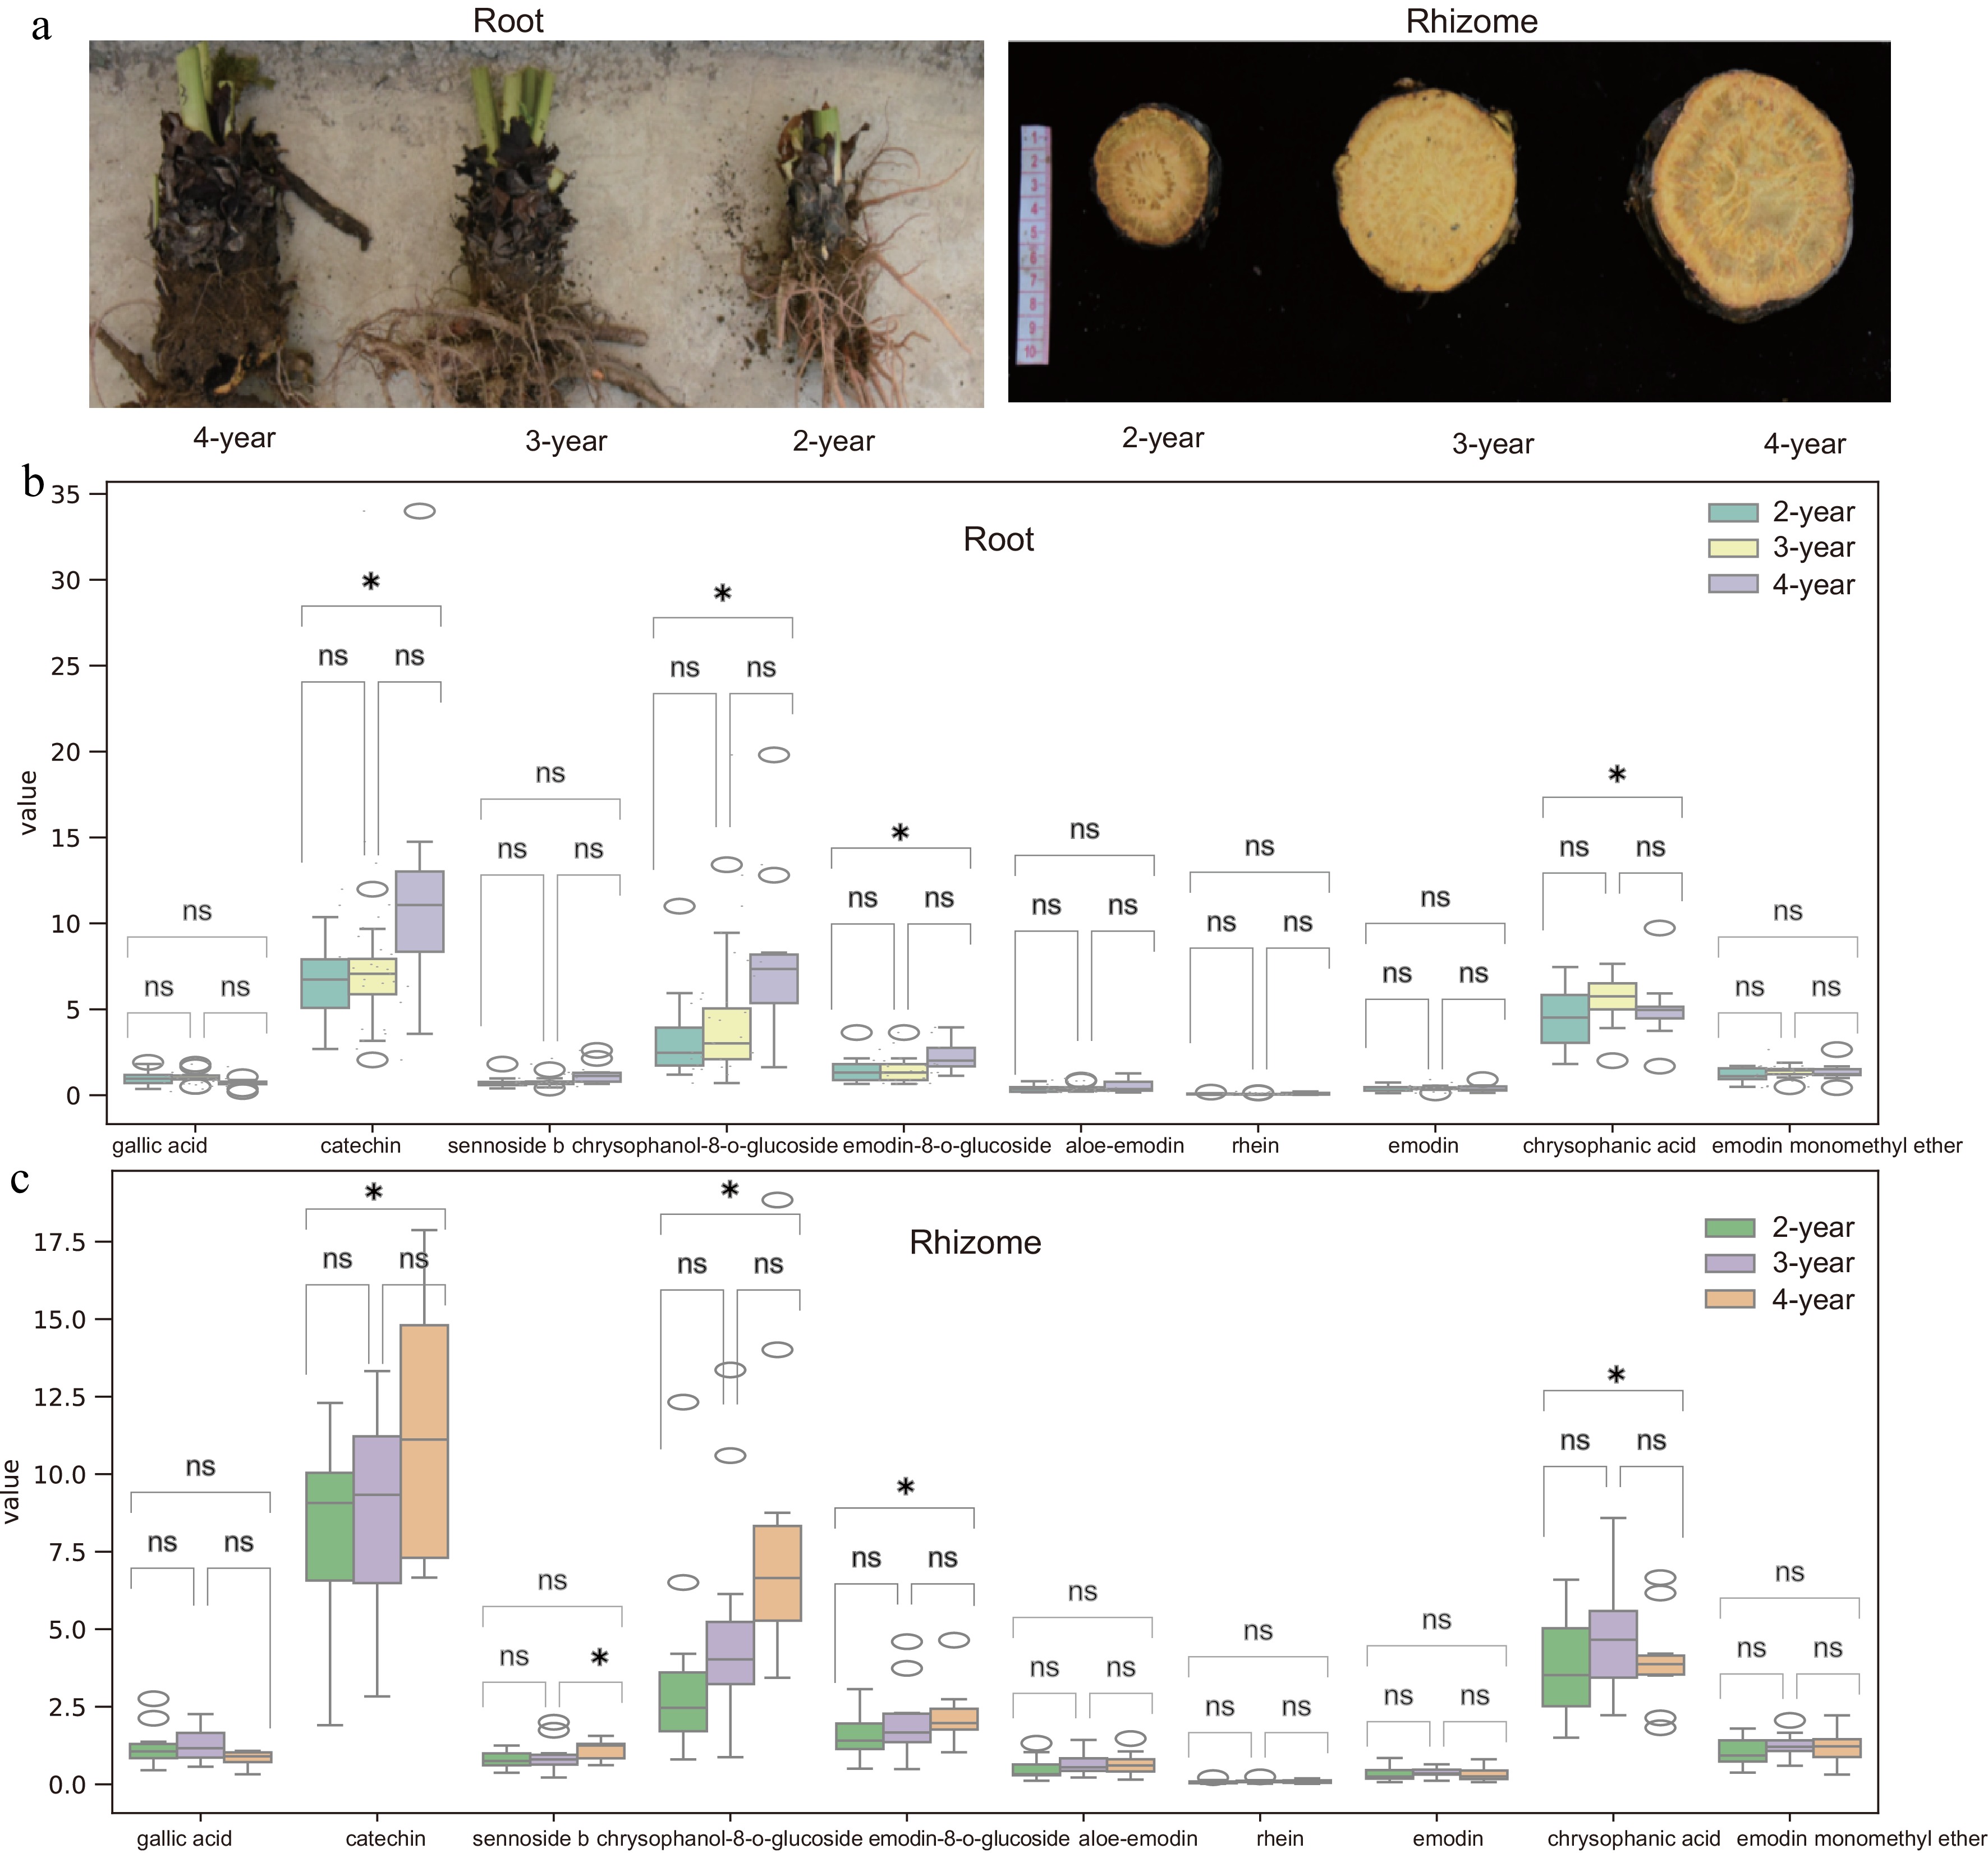
Figure 1.
Morphological and bioactive component changes in R. officinale roots and rhizomes at different ages. (a) Right to left: 2-, 3-, and 4-year-old roots; Left to right: 2-, 3-, and 4-year-old rhizomes. (b), (c) Bioactive compound content (dry weight) at different ages. Data represent mean ± SD (n = 3 biological replicates). Statistical significance was assessed by one-way ANOVA (* p < 0.05, ** p < 0.01).
-
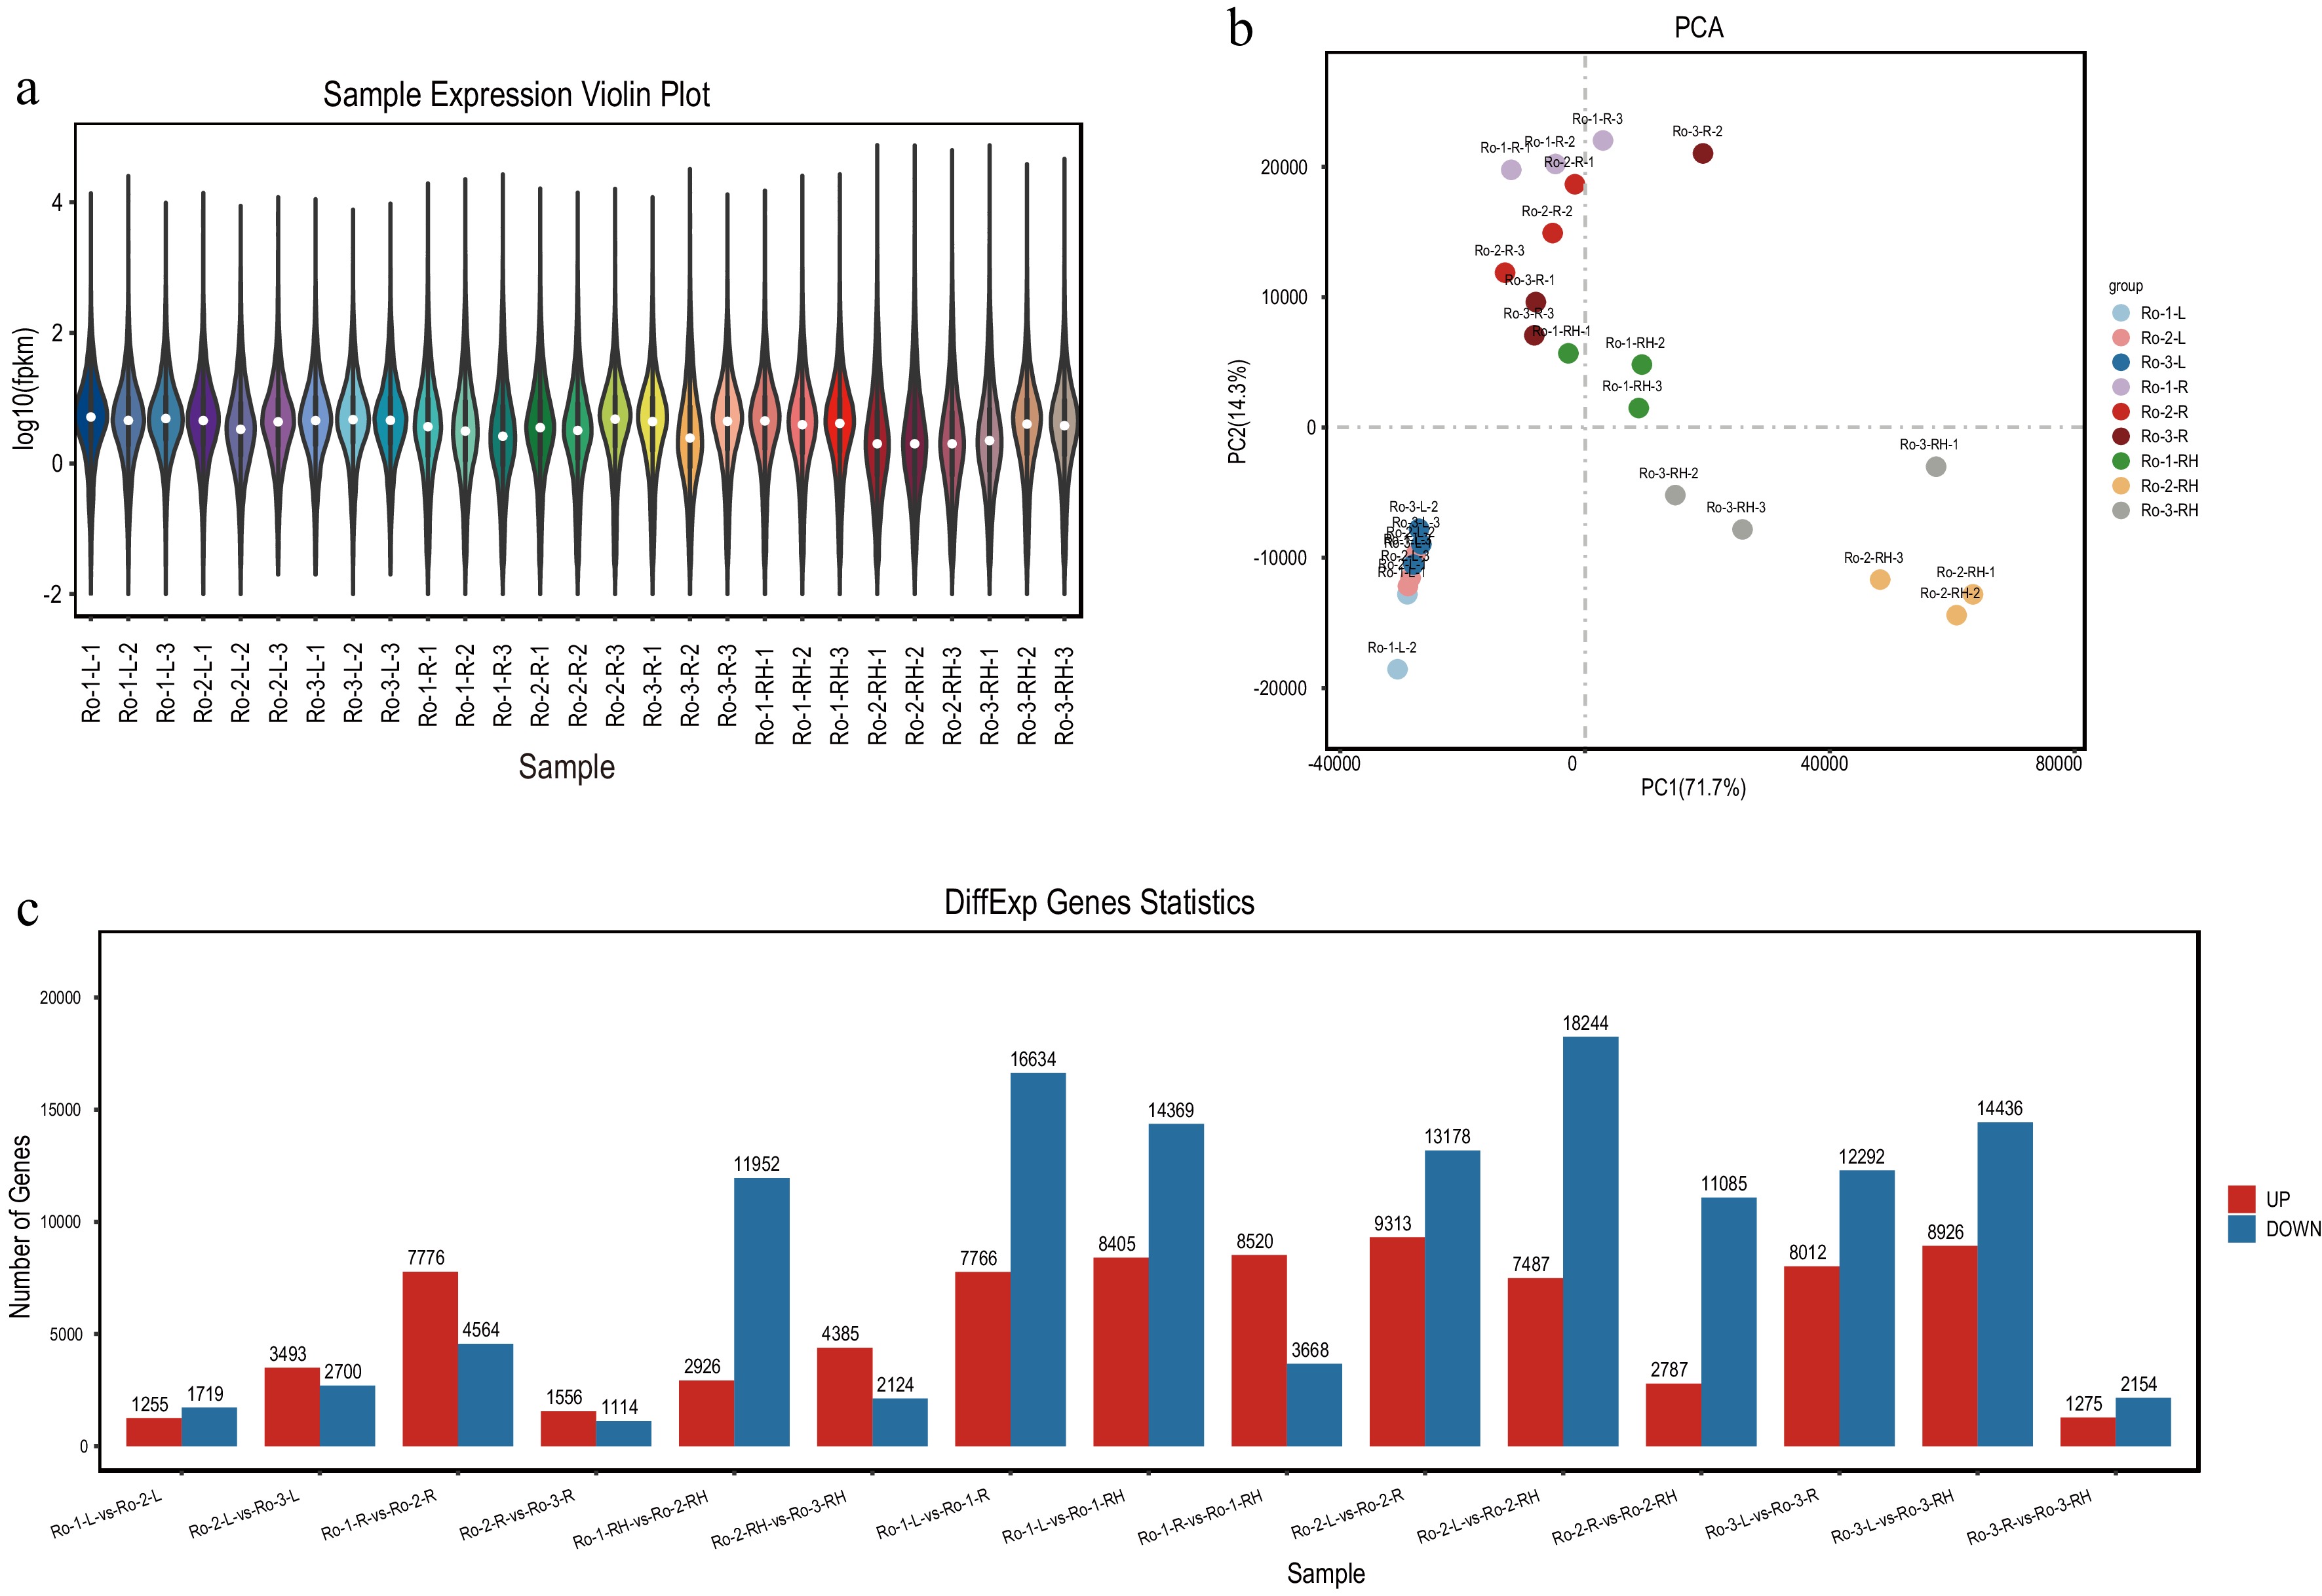
Figure 2.
The expression profiling of unigenes in roots, rhizomes and leaves of R. officinale at different ages. (a) Violin plot of unigenes with mean expression level in leaves, roots, and rhizomes. (b) The PCA analysis of unigenes based on the expression level in leaves, roots, rhizomes. (c) The statistics of DEGs among three groups of root, rhizome and leaf, respectively.
-
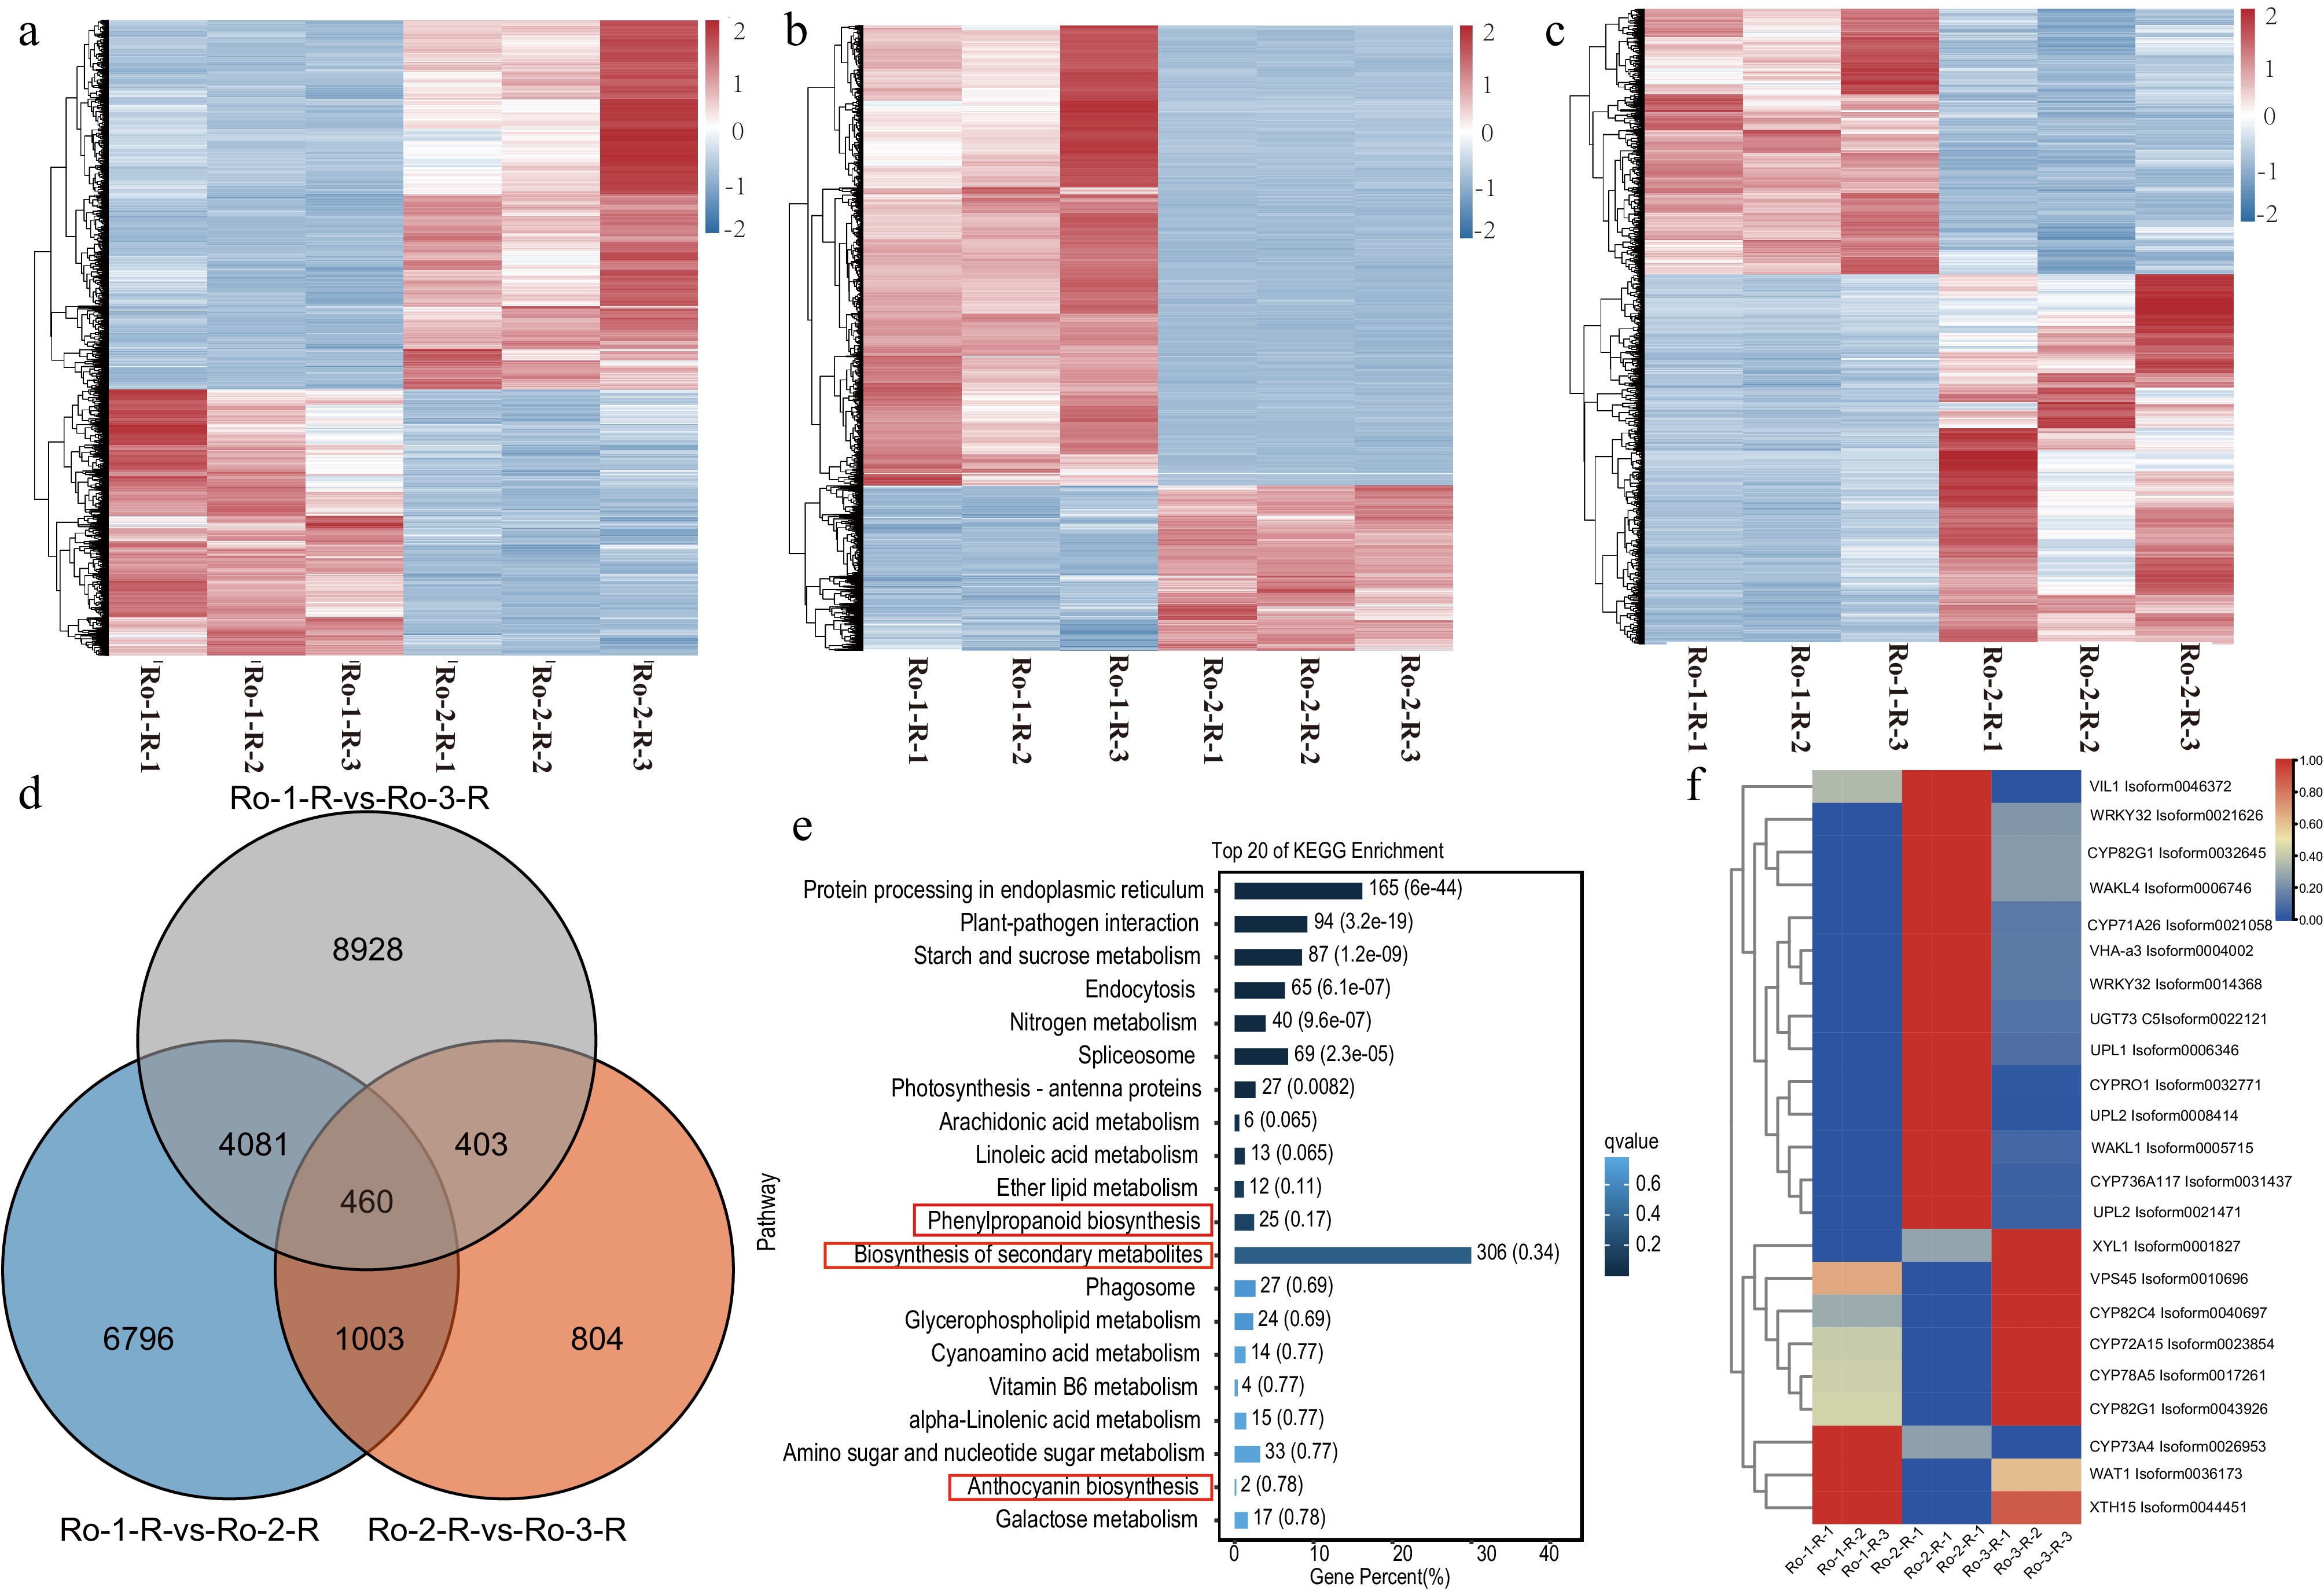
Figure 3.
The comparative transcriptomic analysis of R. officinale during three ages of roots. (a)−(c) The heatmap of DEGs during three ages of roots of R. officinale. (d) The Venn plot of DEGs at three ages of R. officinale. (e) The KEGG enrichment analysis of DEGs at three ages. (e) The heatmap of significantly differential unigenes during three stages of roots of R. officinale. Ro-1-R: 2021-9; Ro-2-R: 2021-9; Ro-3-R: 2022-9.
-
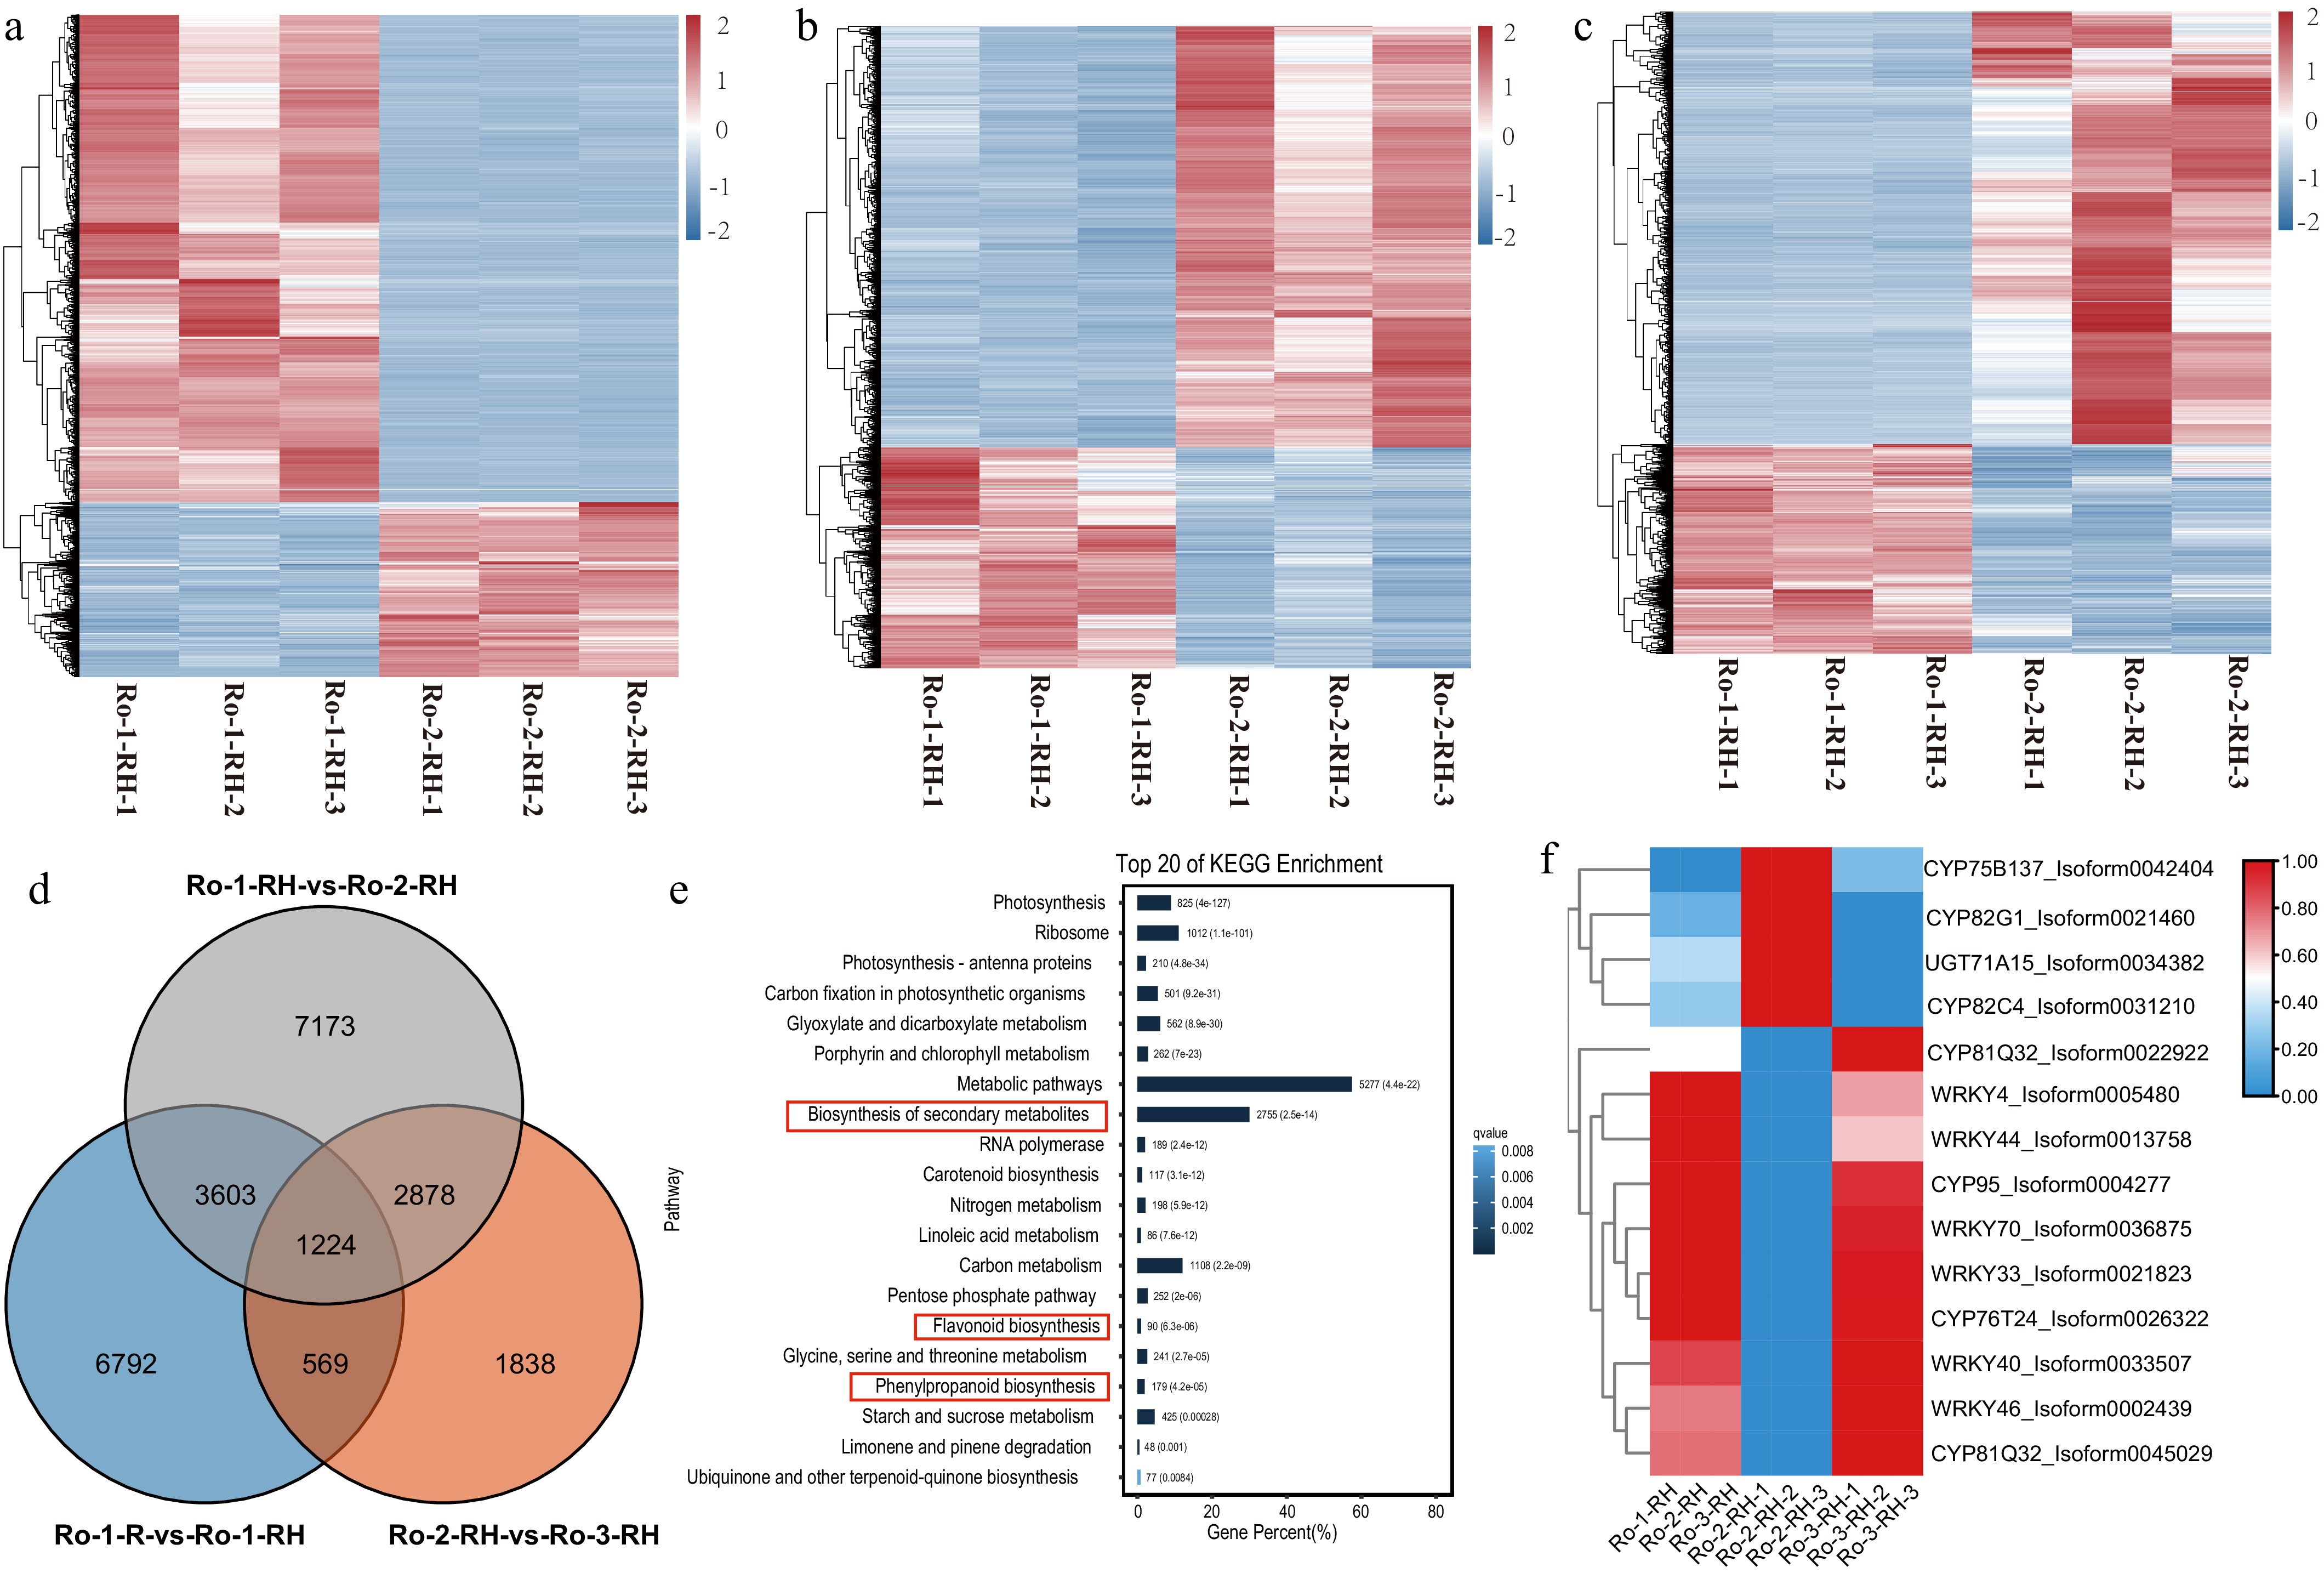
Figure 4.
The comparative transcriptome at three ages of rhizomes of R. officinale. (a)−(c) The heatmap of DEGs during three ages of rhizomes of R. officinale. (d) The Venn plot of DEGs during three ages of R. officinale. (e) The KEGG enrichment analysis of DEGs between CK and MeJA treatment. (f) The heatmap of significantly differential unigenes during three stages of rhizomes of R. officinale. RO-1-RH: 2020-9-1; RO-2-RH: 2021-9-1; RO-3-RH: 2022-9-1.
-
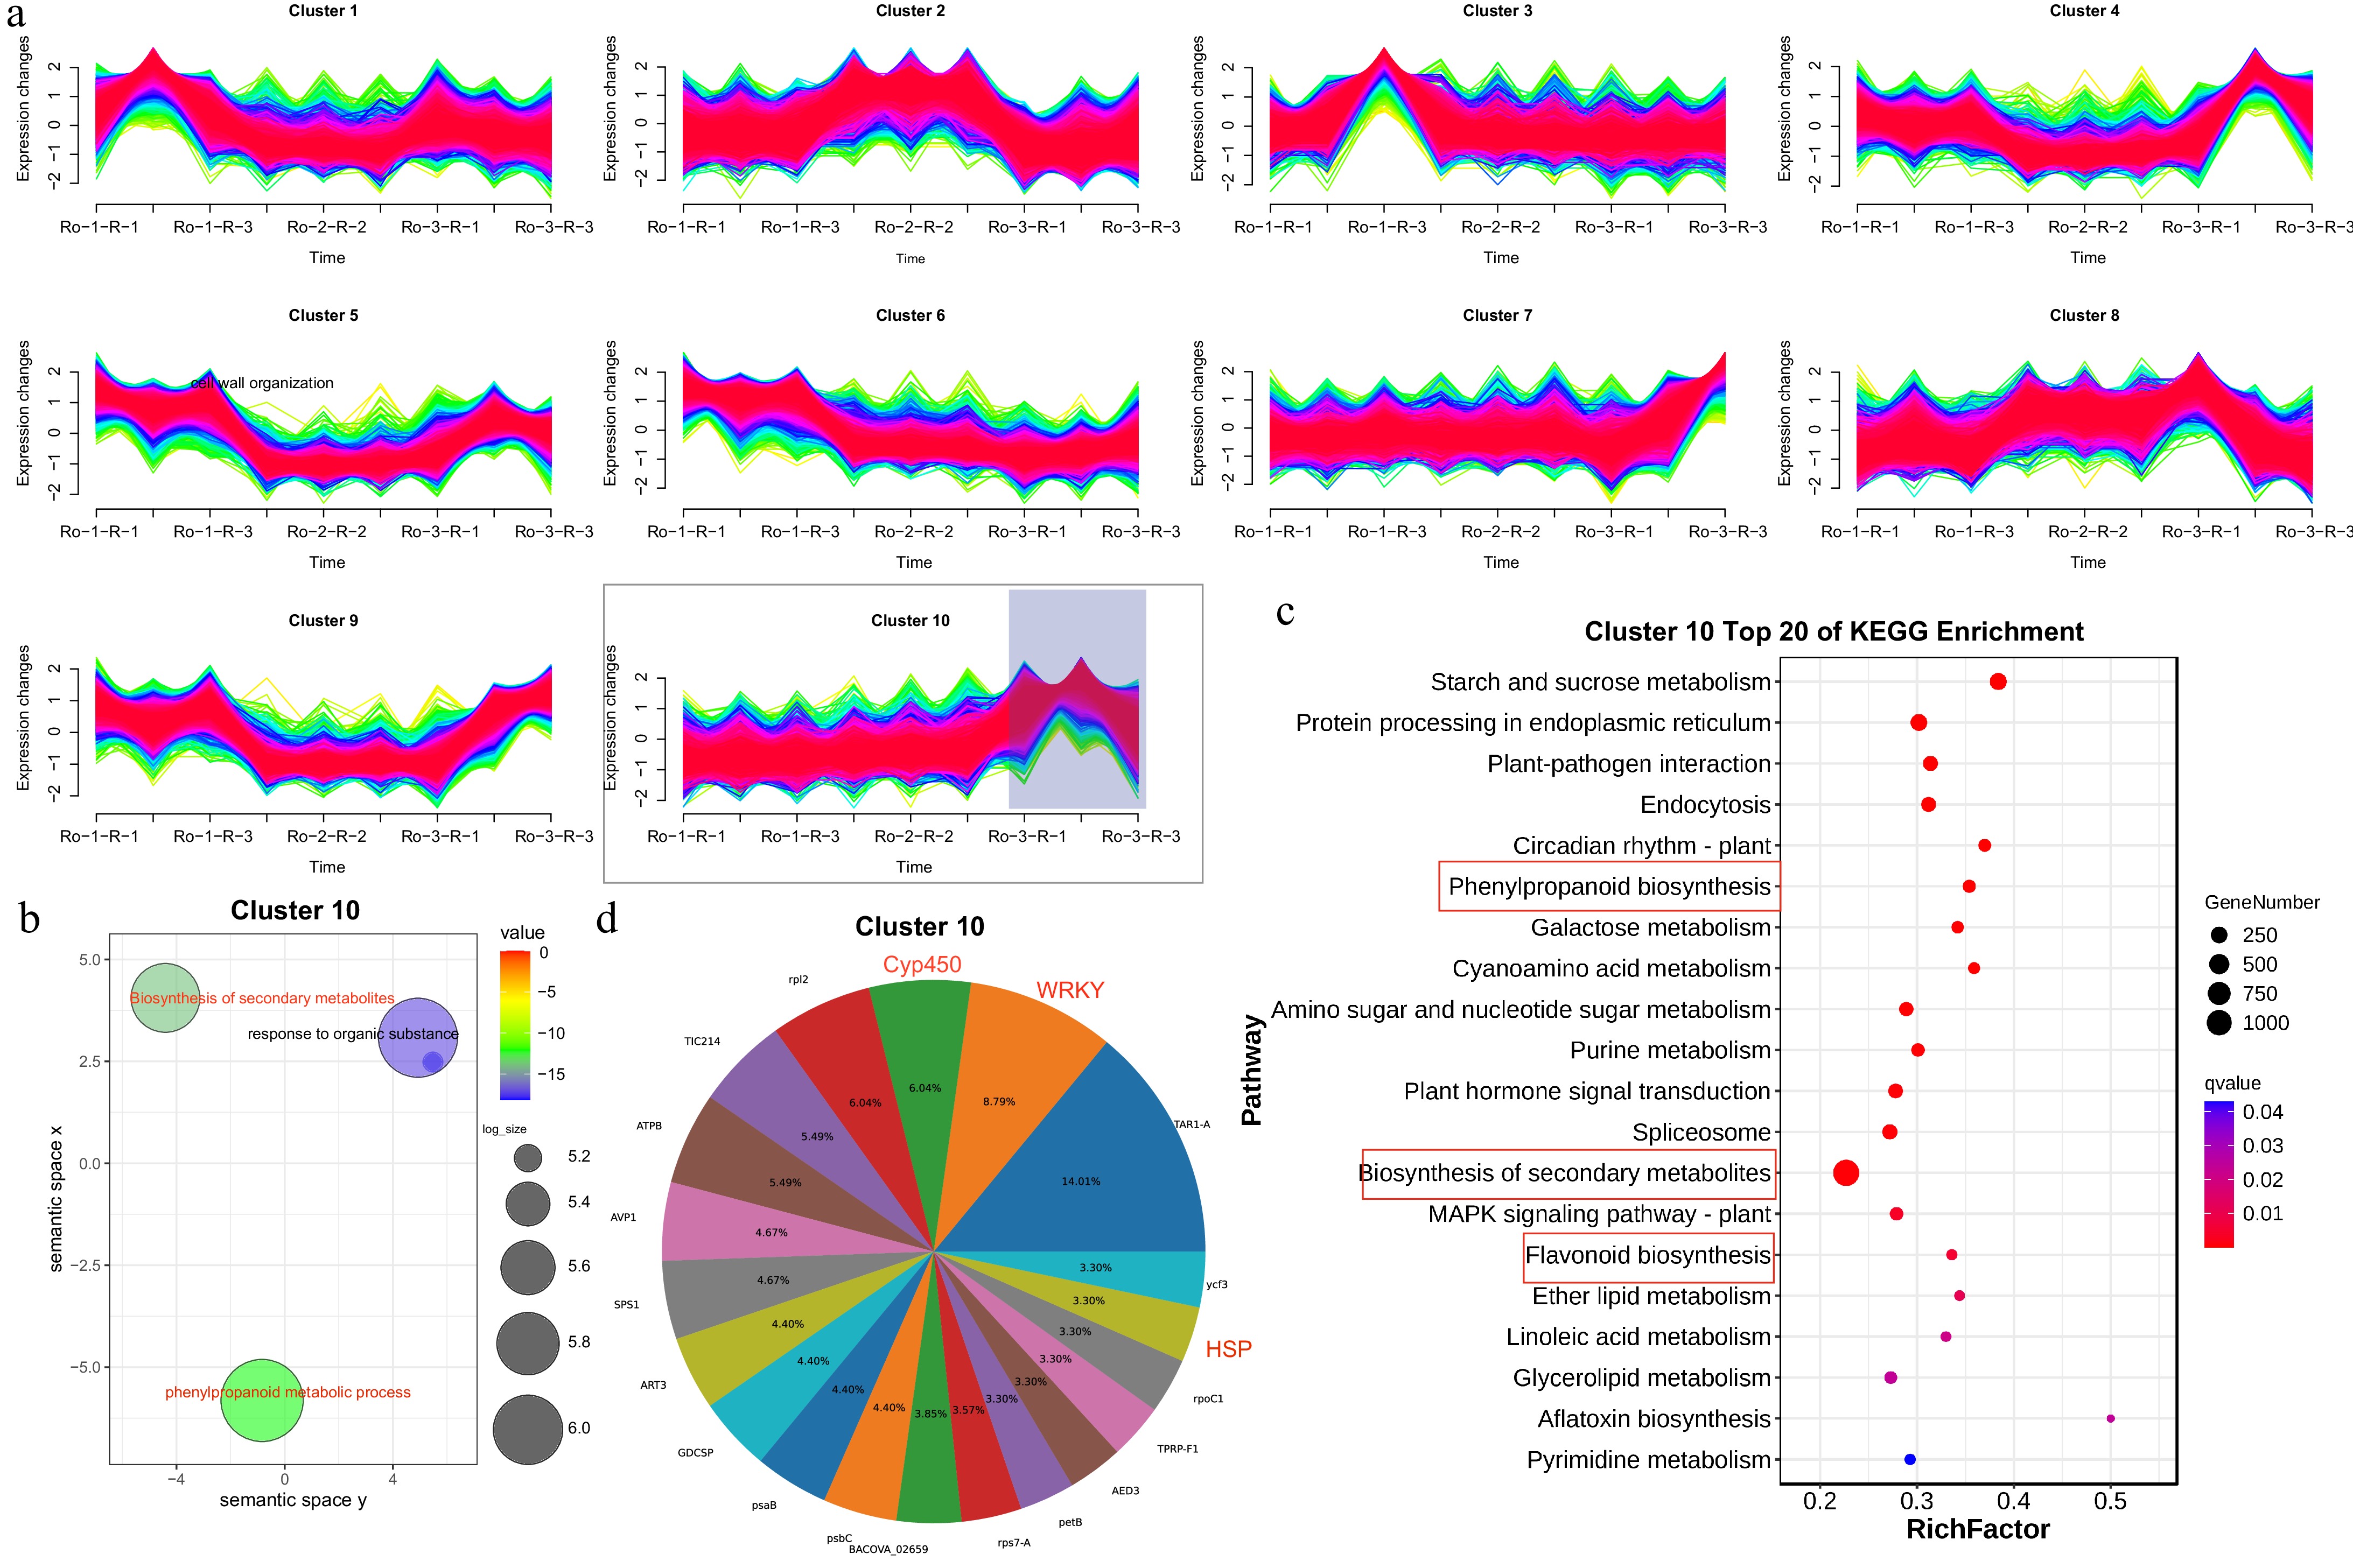
Figure 5.
Spatiotemporal gene expression pattern of R. officinale roots and functional enrichment analysis. (a) Cluster 1 to 10 showing DEGs in RO-1-R, RO-1-R, and RO-1-R. (b) GO enrichment pathway analysis of DEGs from cluster 10. (c) KEGG enrichment pathway analysis of DEGs from cluster 10. (d) The gene family cluster analysis of cluster 10.
-
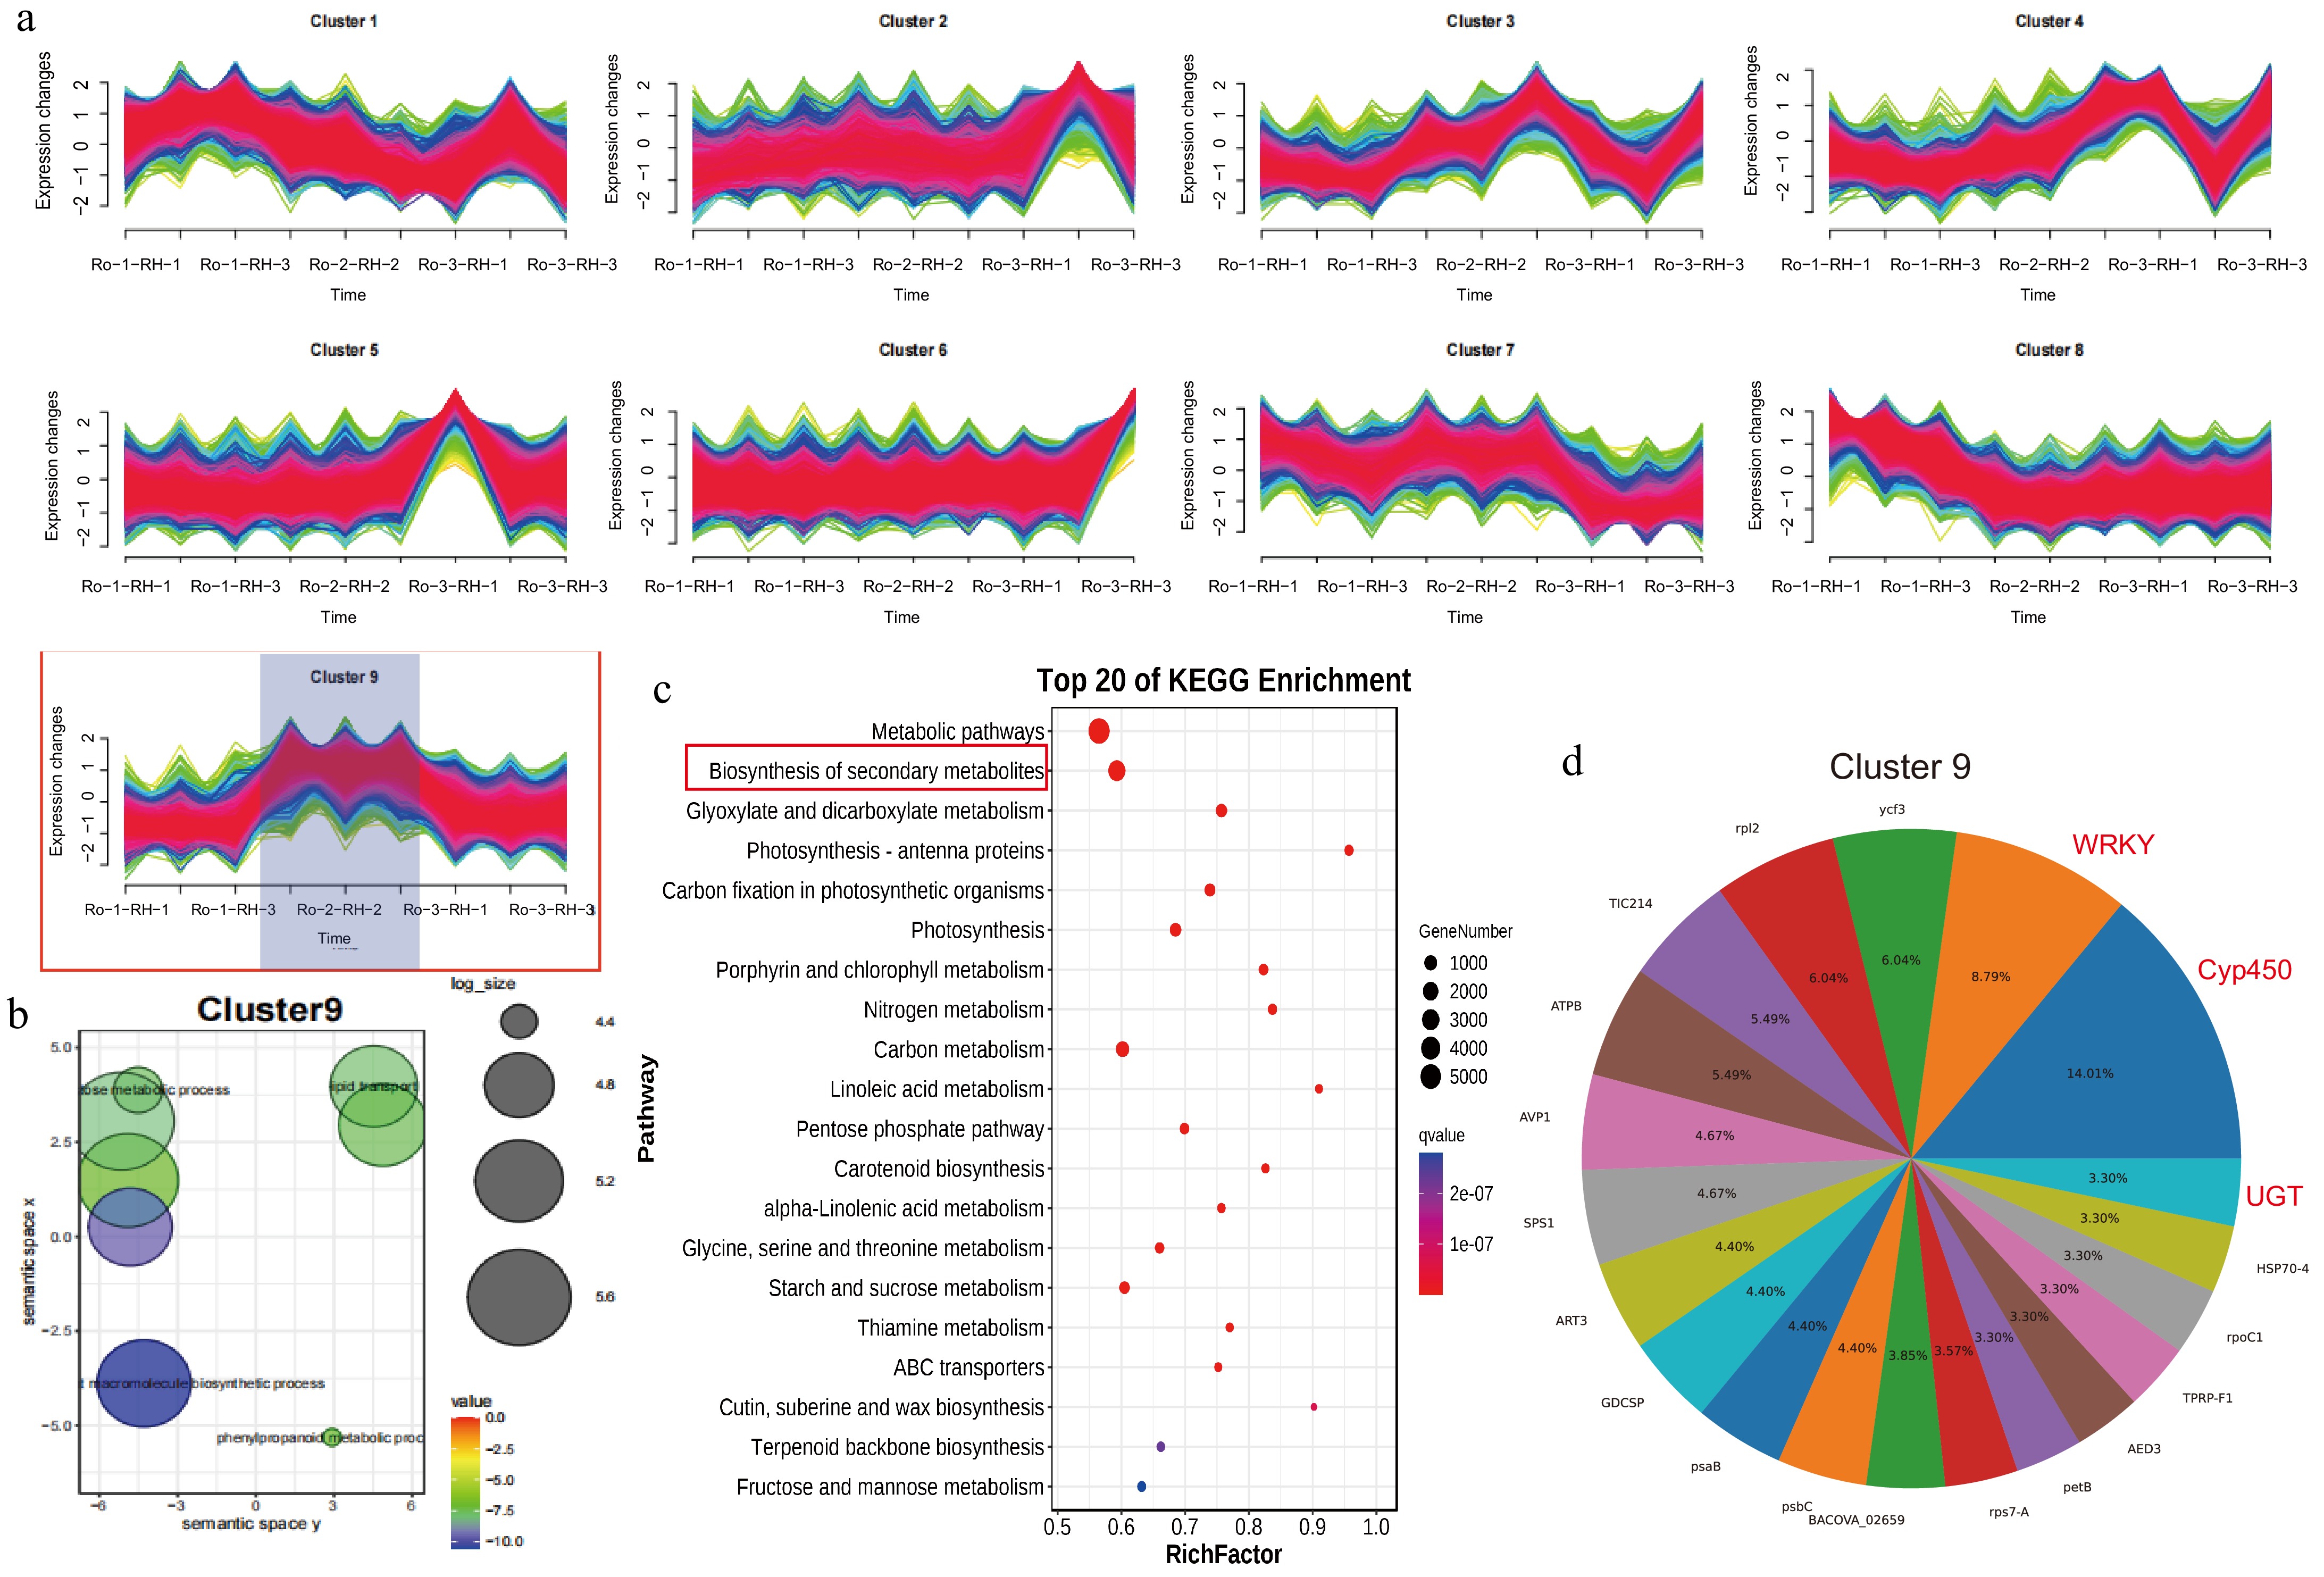
Figure 6.
Spatiotemporal gene expression patterns of R. officinale rhizomes and functional enrichment analysis. (a) Cluster 1 to 9 showing DEGs in RO-1-RH, RO-1-RH, and RO-1-RH. (b) GO enrichment pathway analysis of DEGs from cluster 9. (c) KEGG enrichment pathway analysis of DEGs from cluster 10. (d) The gene family cluster analysis of cluster 9.
-
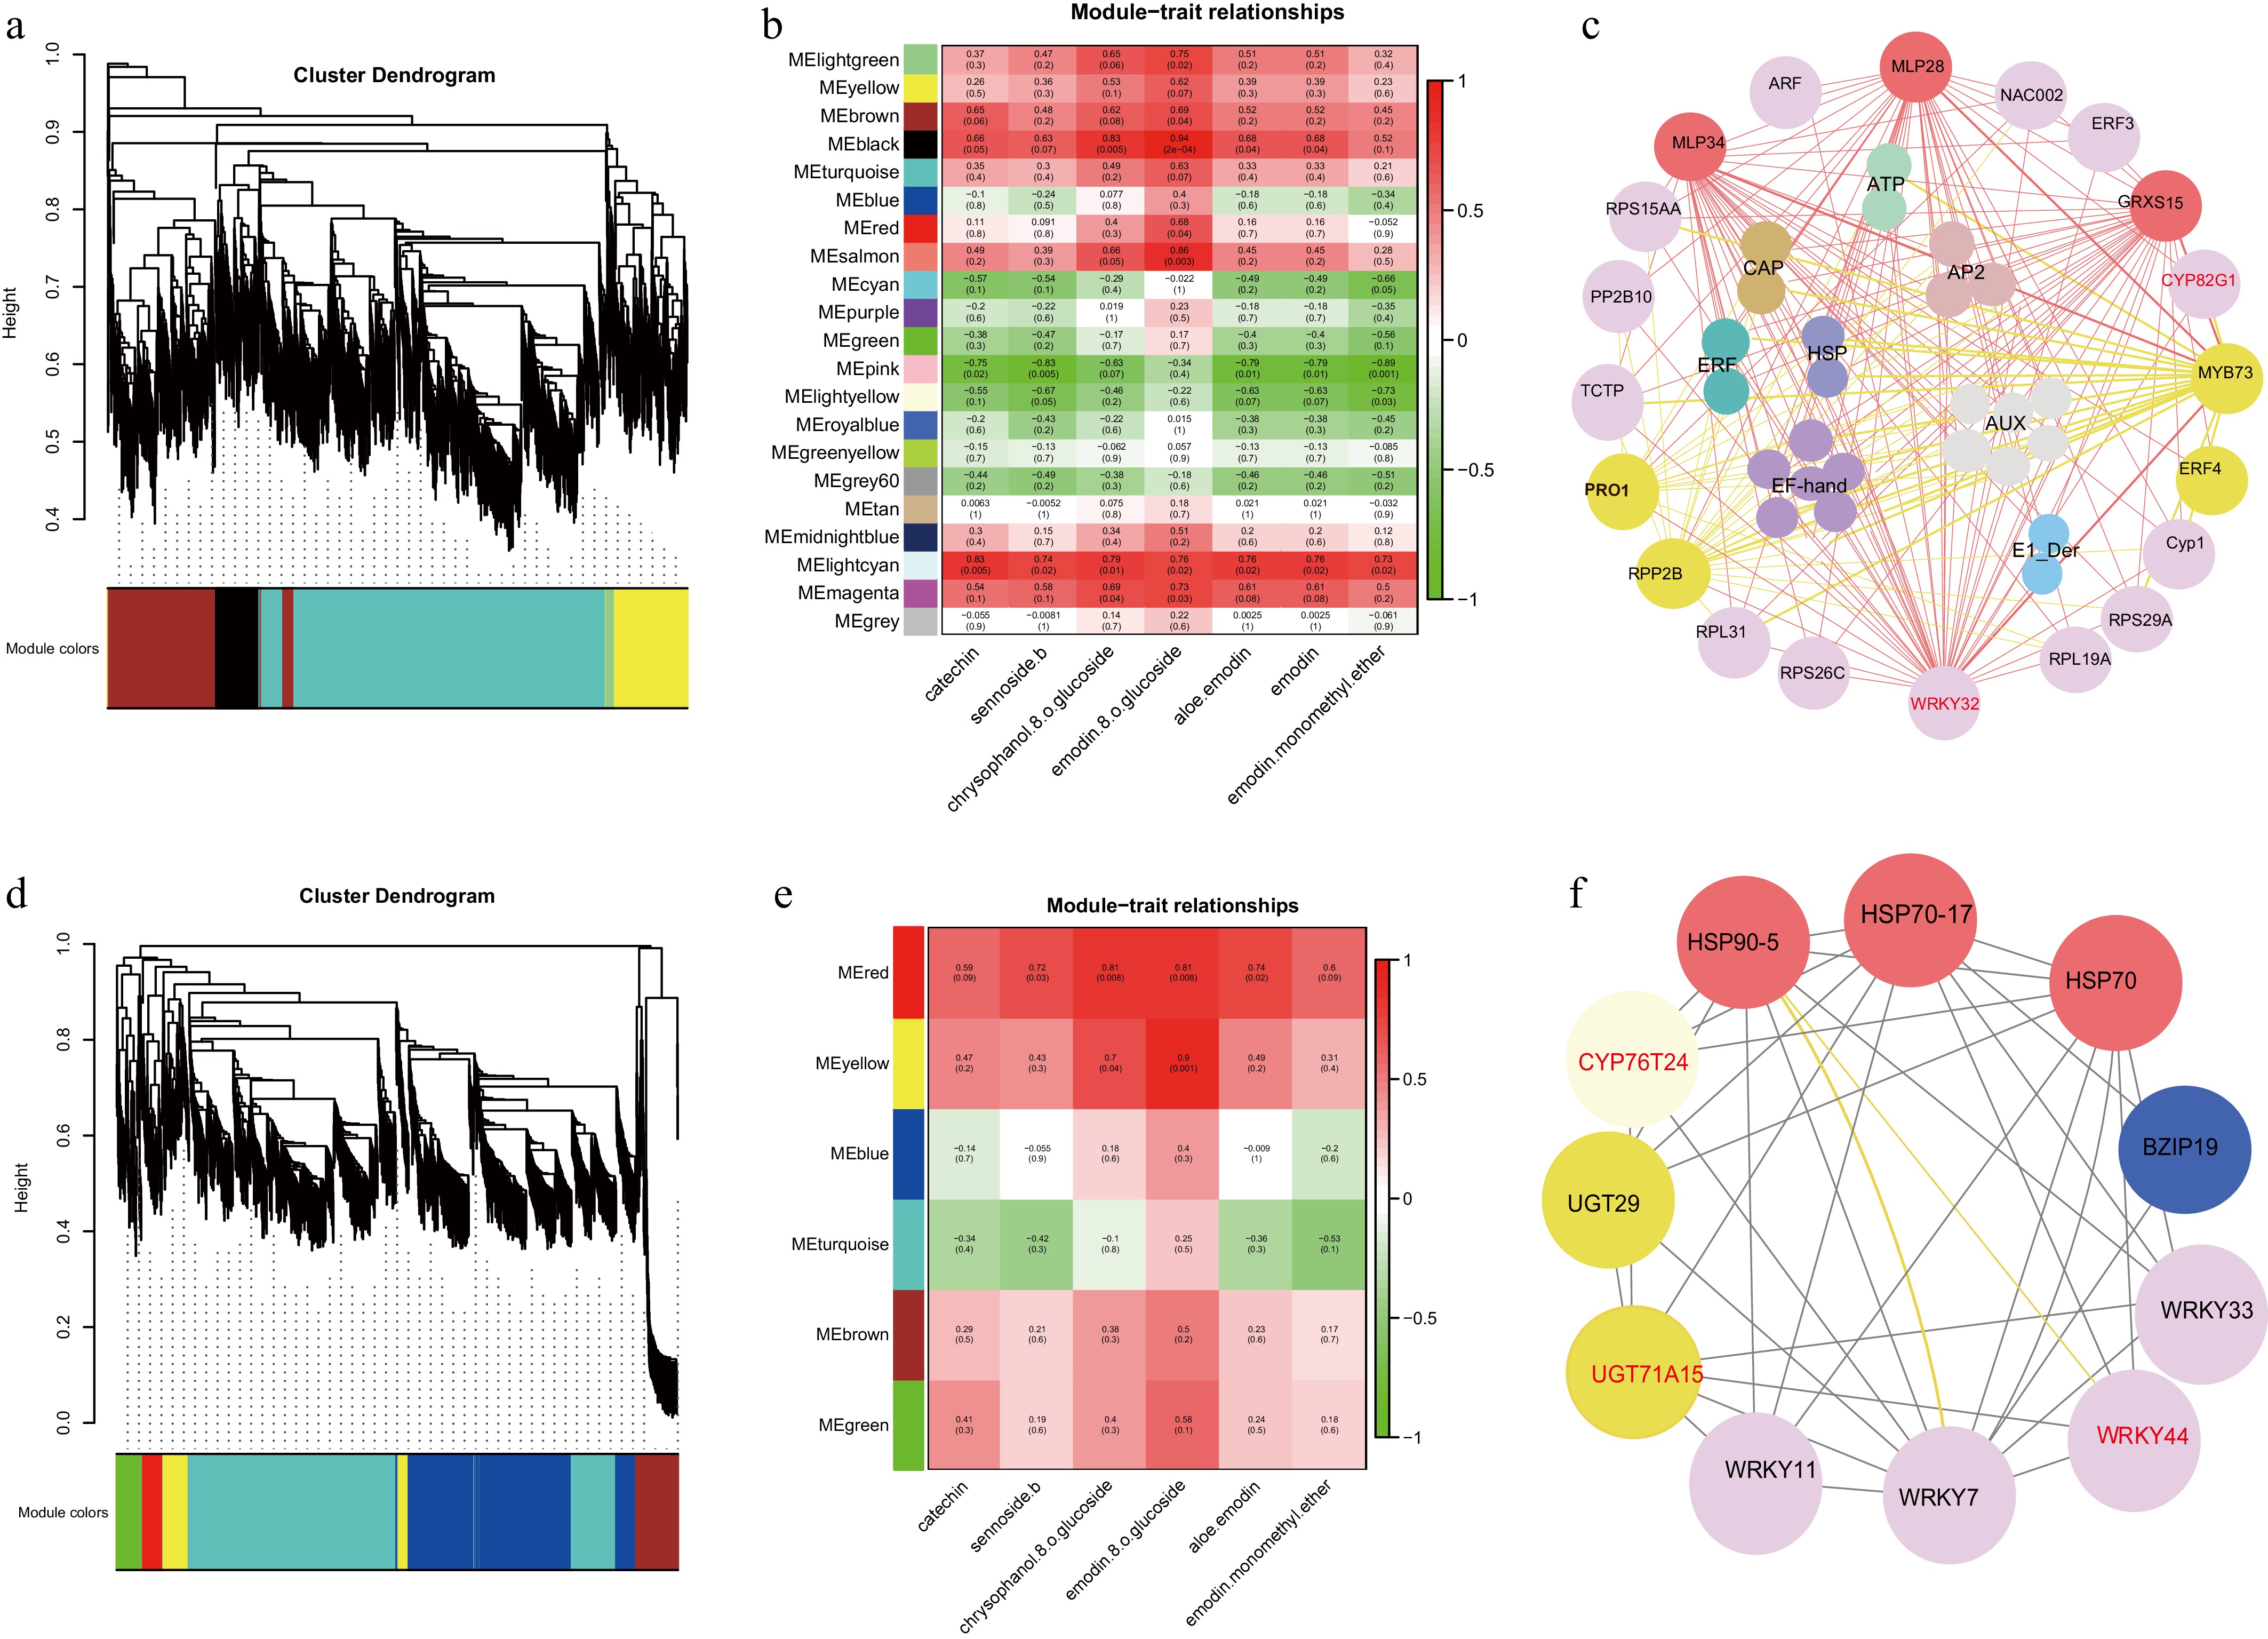
Figure 7.
WGCNA analysis was carried out in the roots and rhizomes of R. officinale. (a), (d) Network topology for different soft-thresholding powers. Numbers in the plots indicate the corresponding soft thresholding powers. The approximate scale-free topology can be attained at the soft-thresholding power of 8. (b), (e) Heatmap plot of the adjacencies of modules. Red represents high adjacency (positive correlation) and blue represents low adjacency (negative correlation). (c), (f) Transcriptome co-expression network diagram.
-
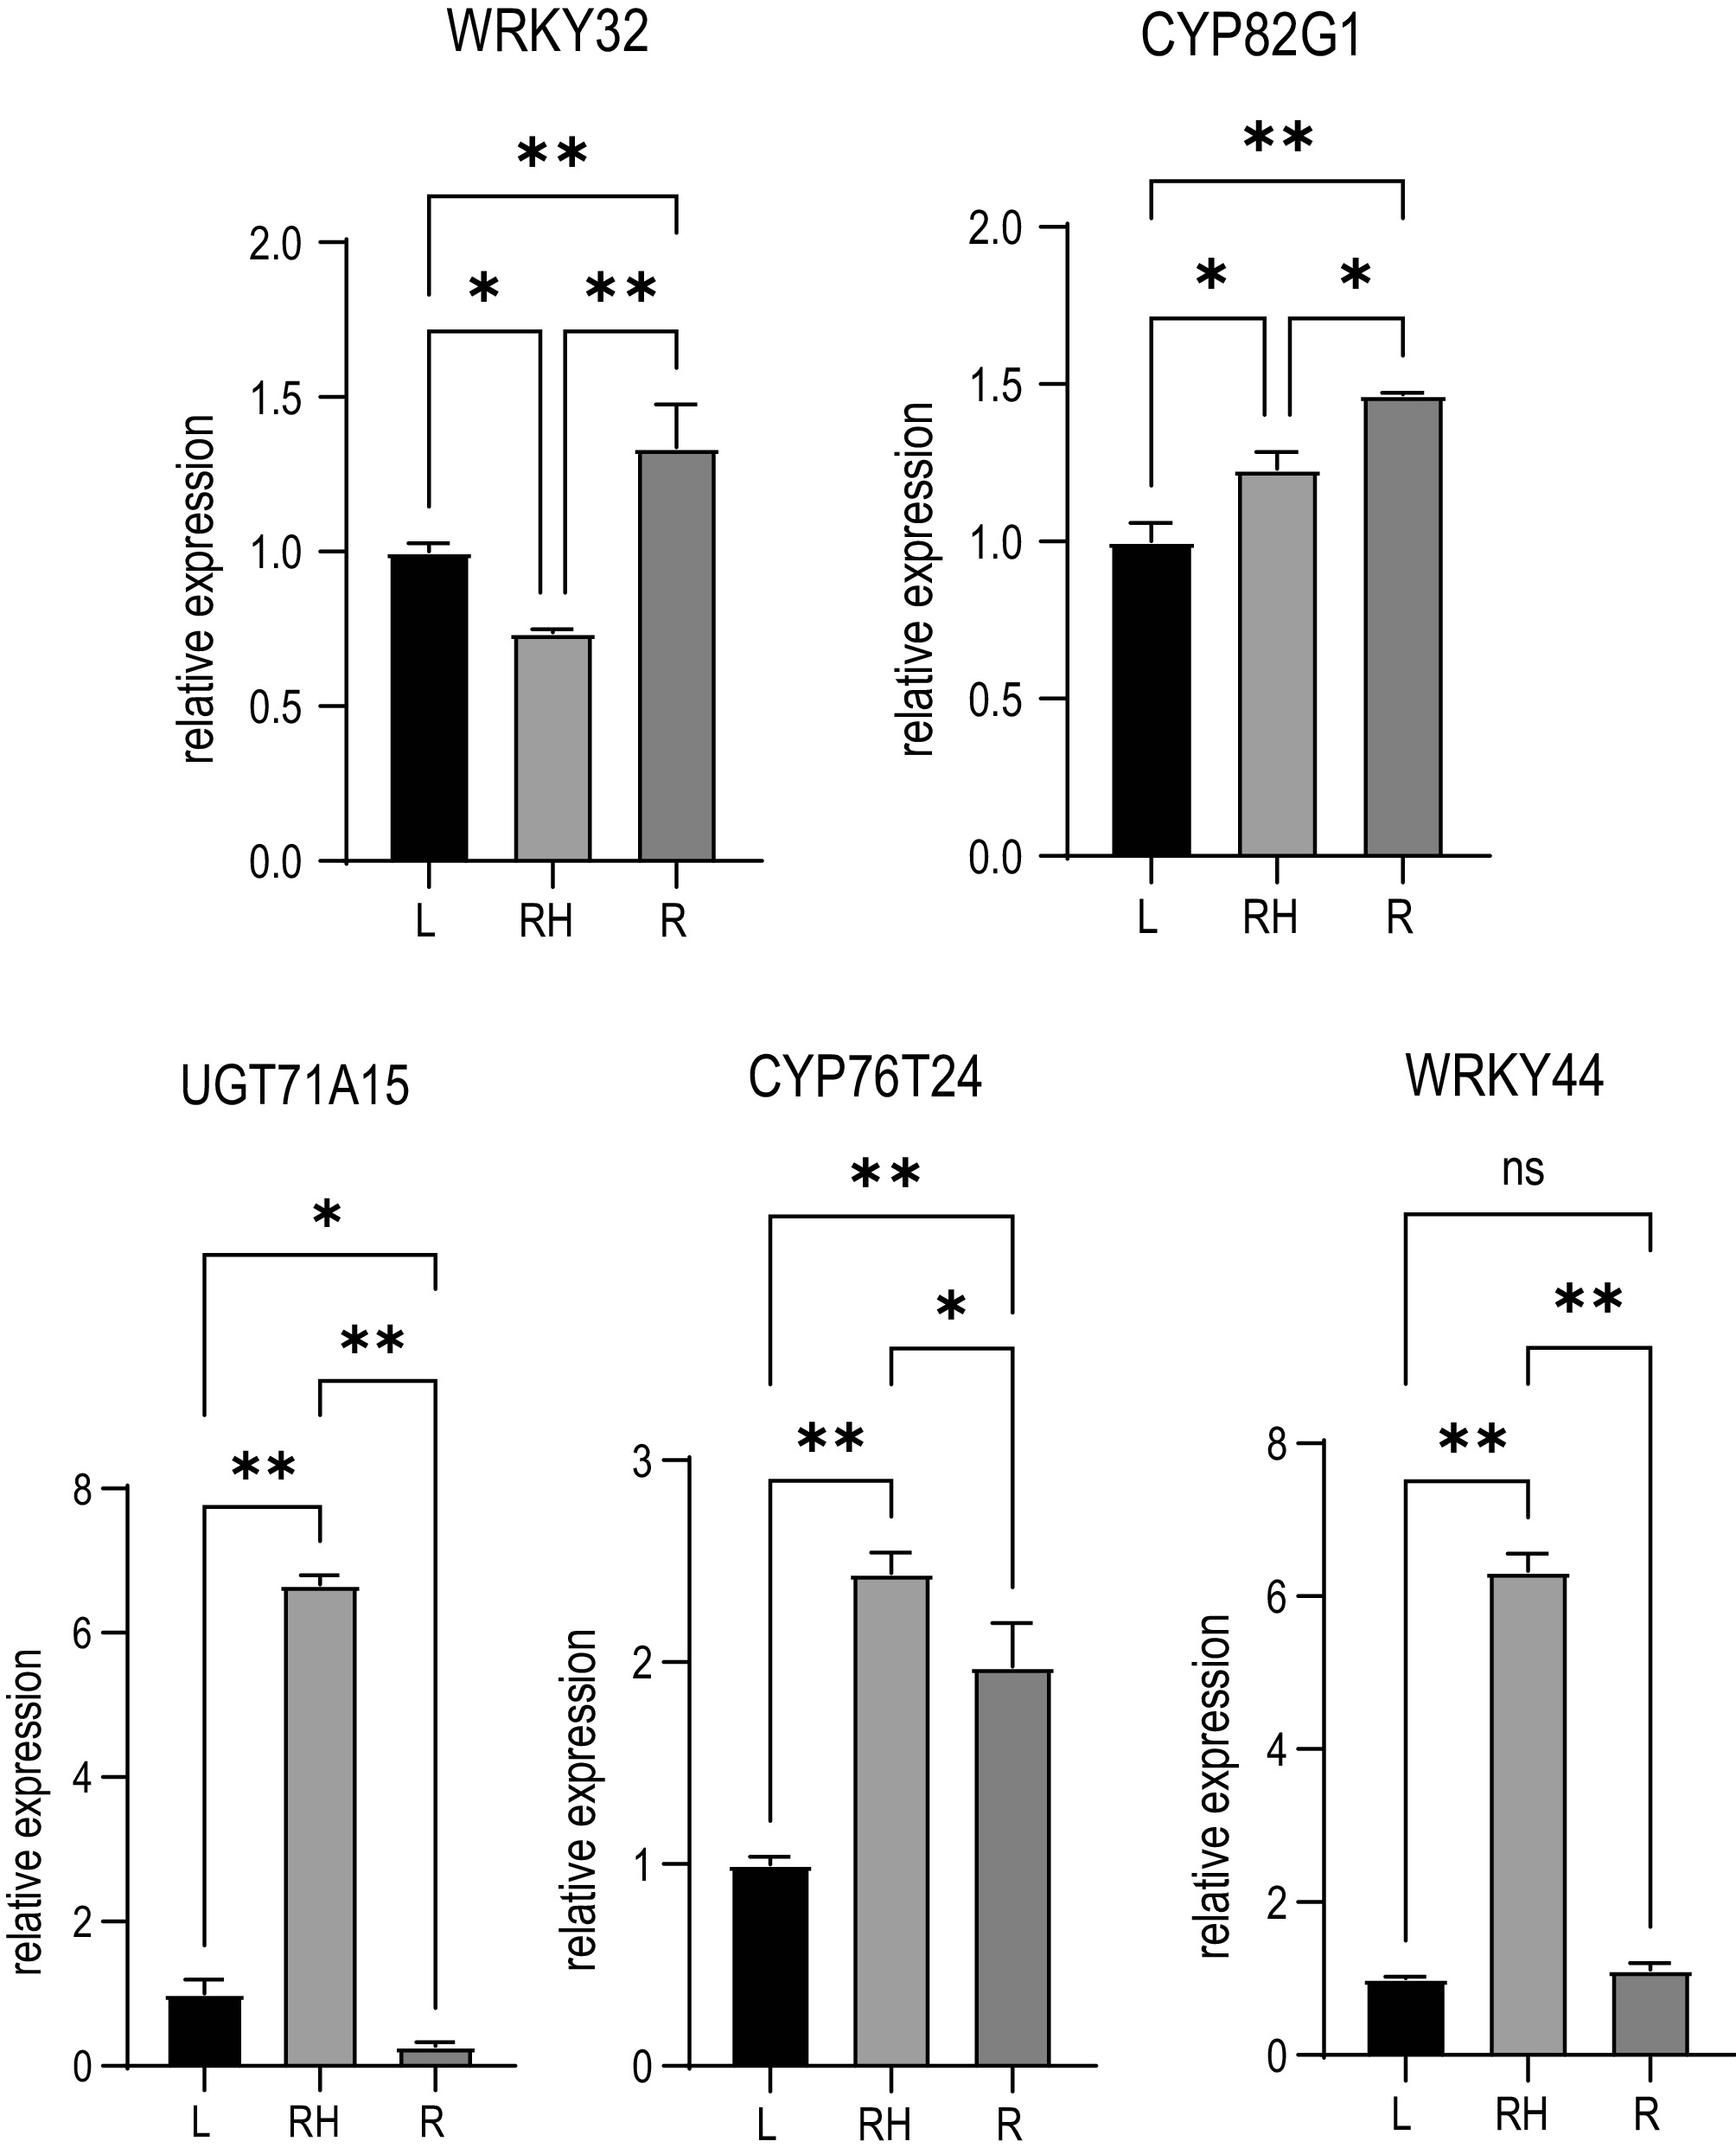
Figure 8.
qRT-PCR validation of gene expression for five candidate genes. Data represent mean ± SD (n = 3 biological replicates). Statistical significance was determined using Student's t-test (* p < 0.05, ** p < 0.01).
Figures
(8)
Tables
(0)