-
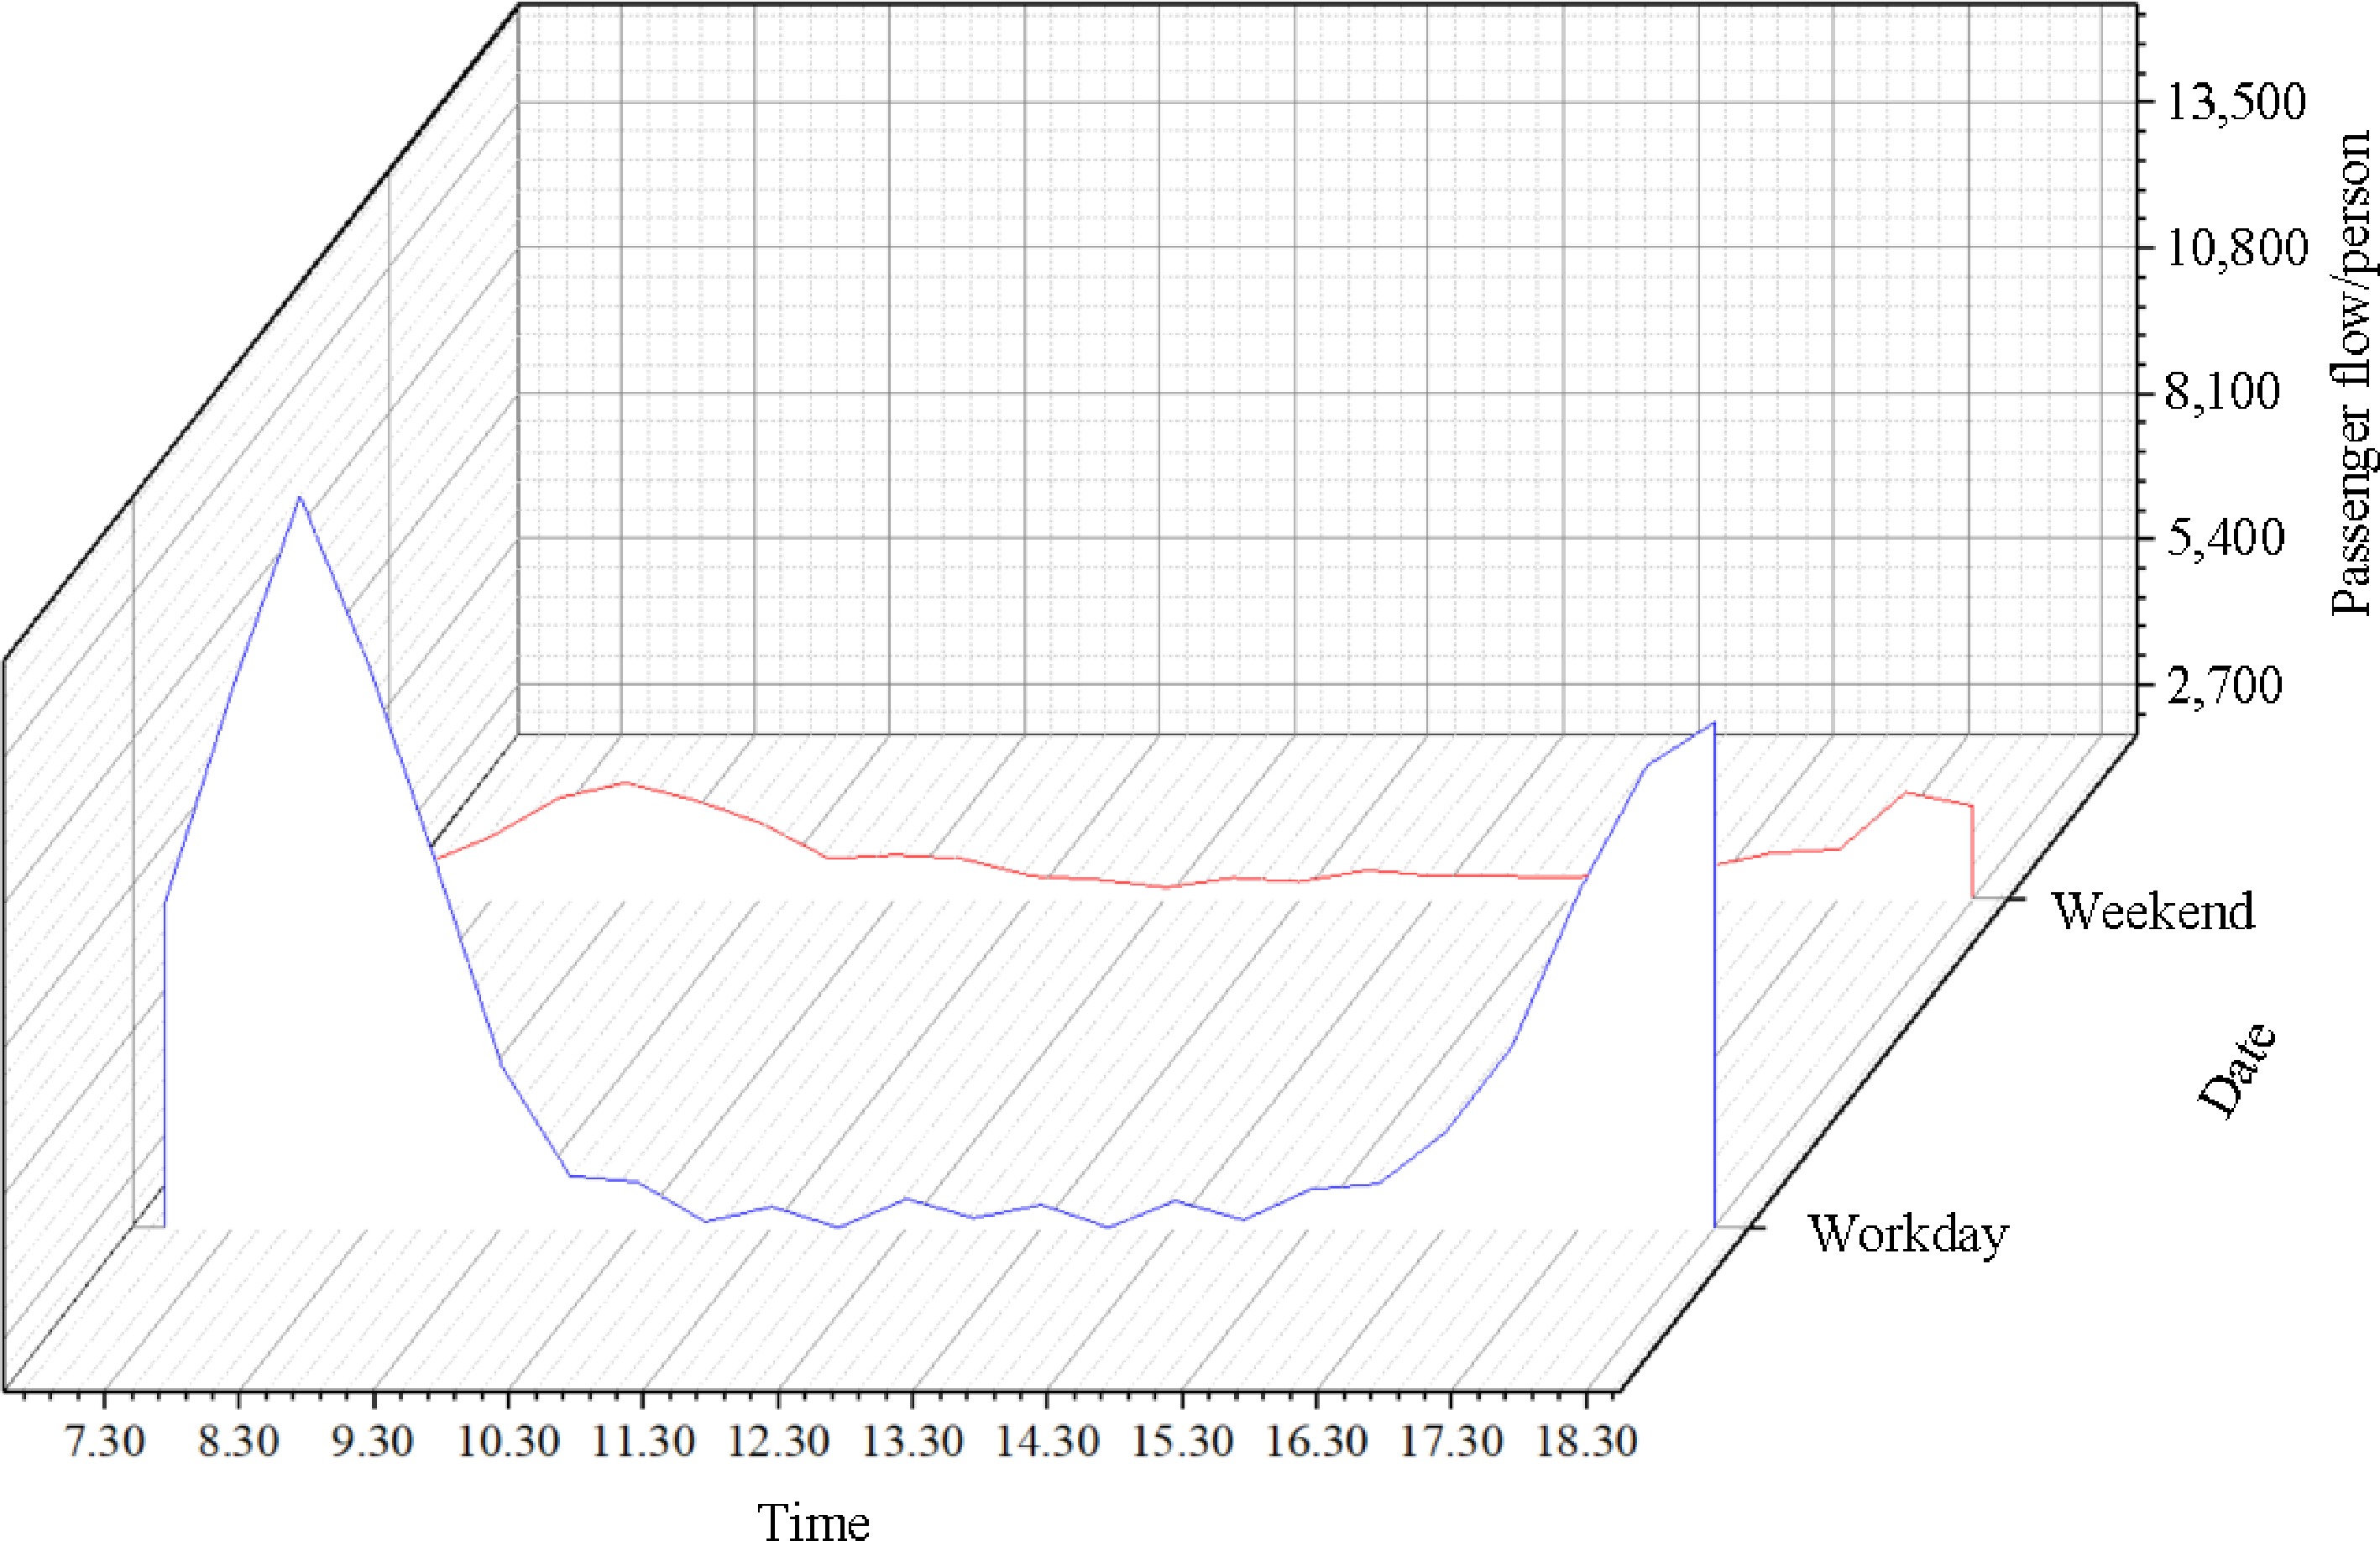
Figure 1.
Distribution characteristics of hourly passenger flow at different periods.
-
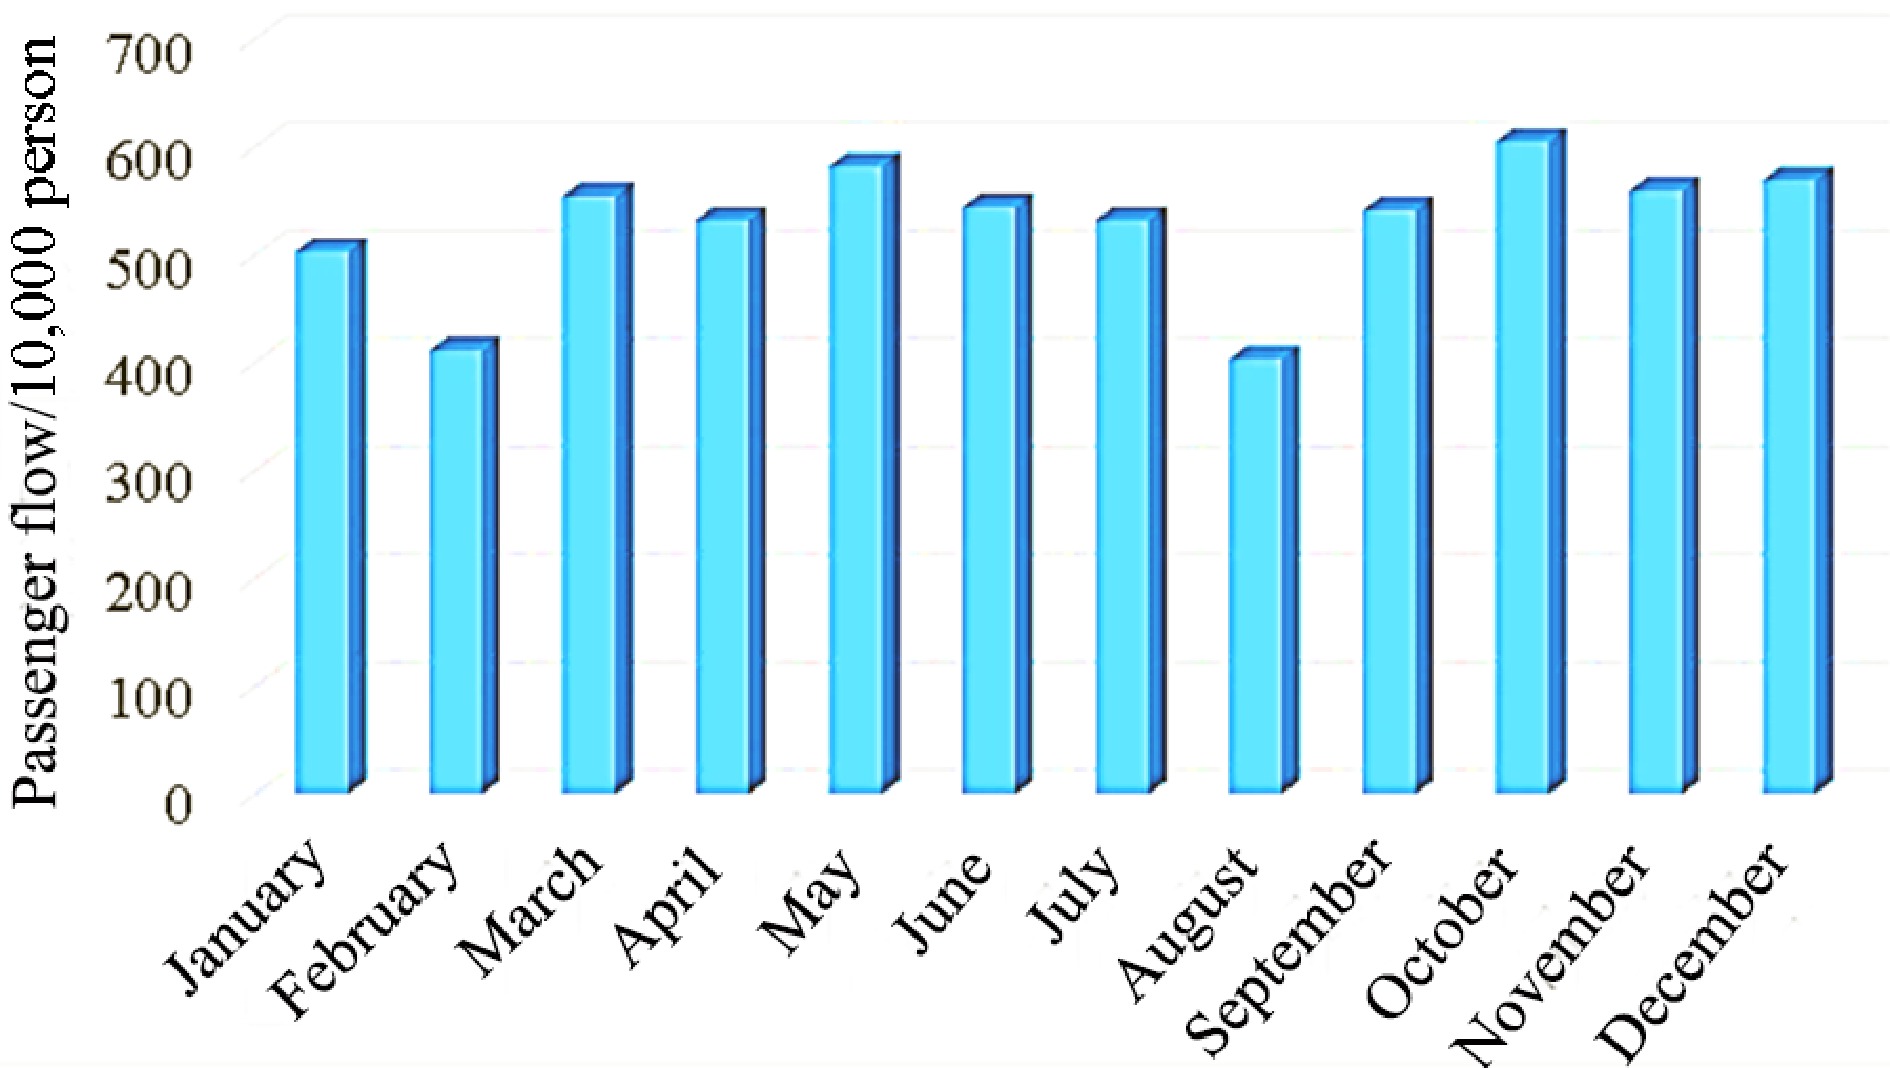
Figure 2.
Monthly passenger flow distribution characteristics of rail transit.
-
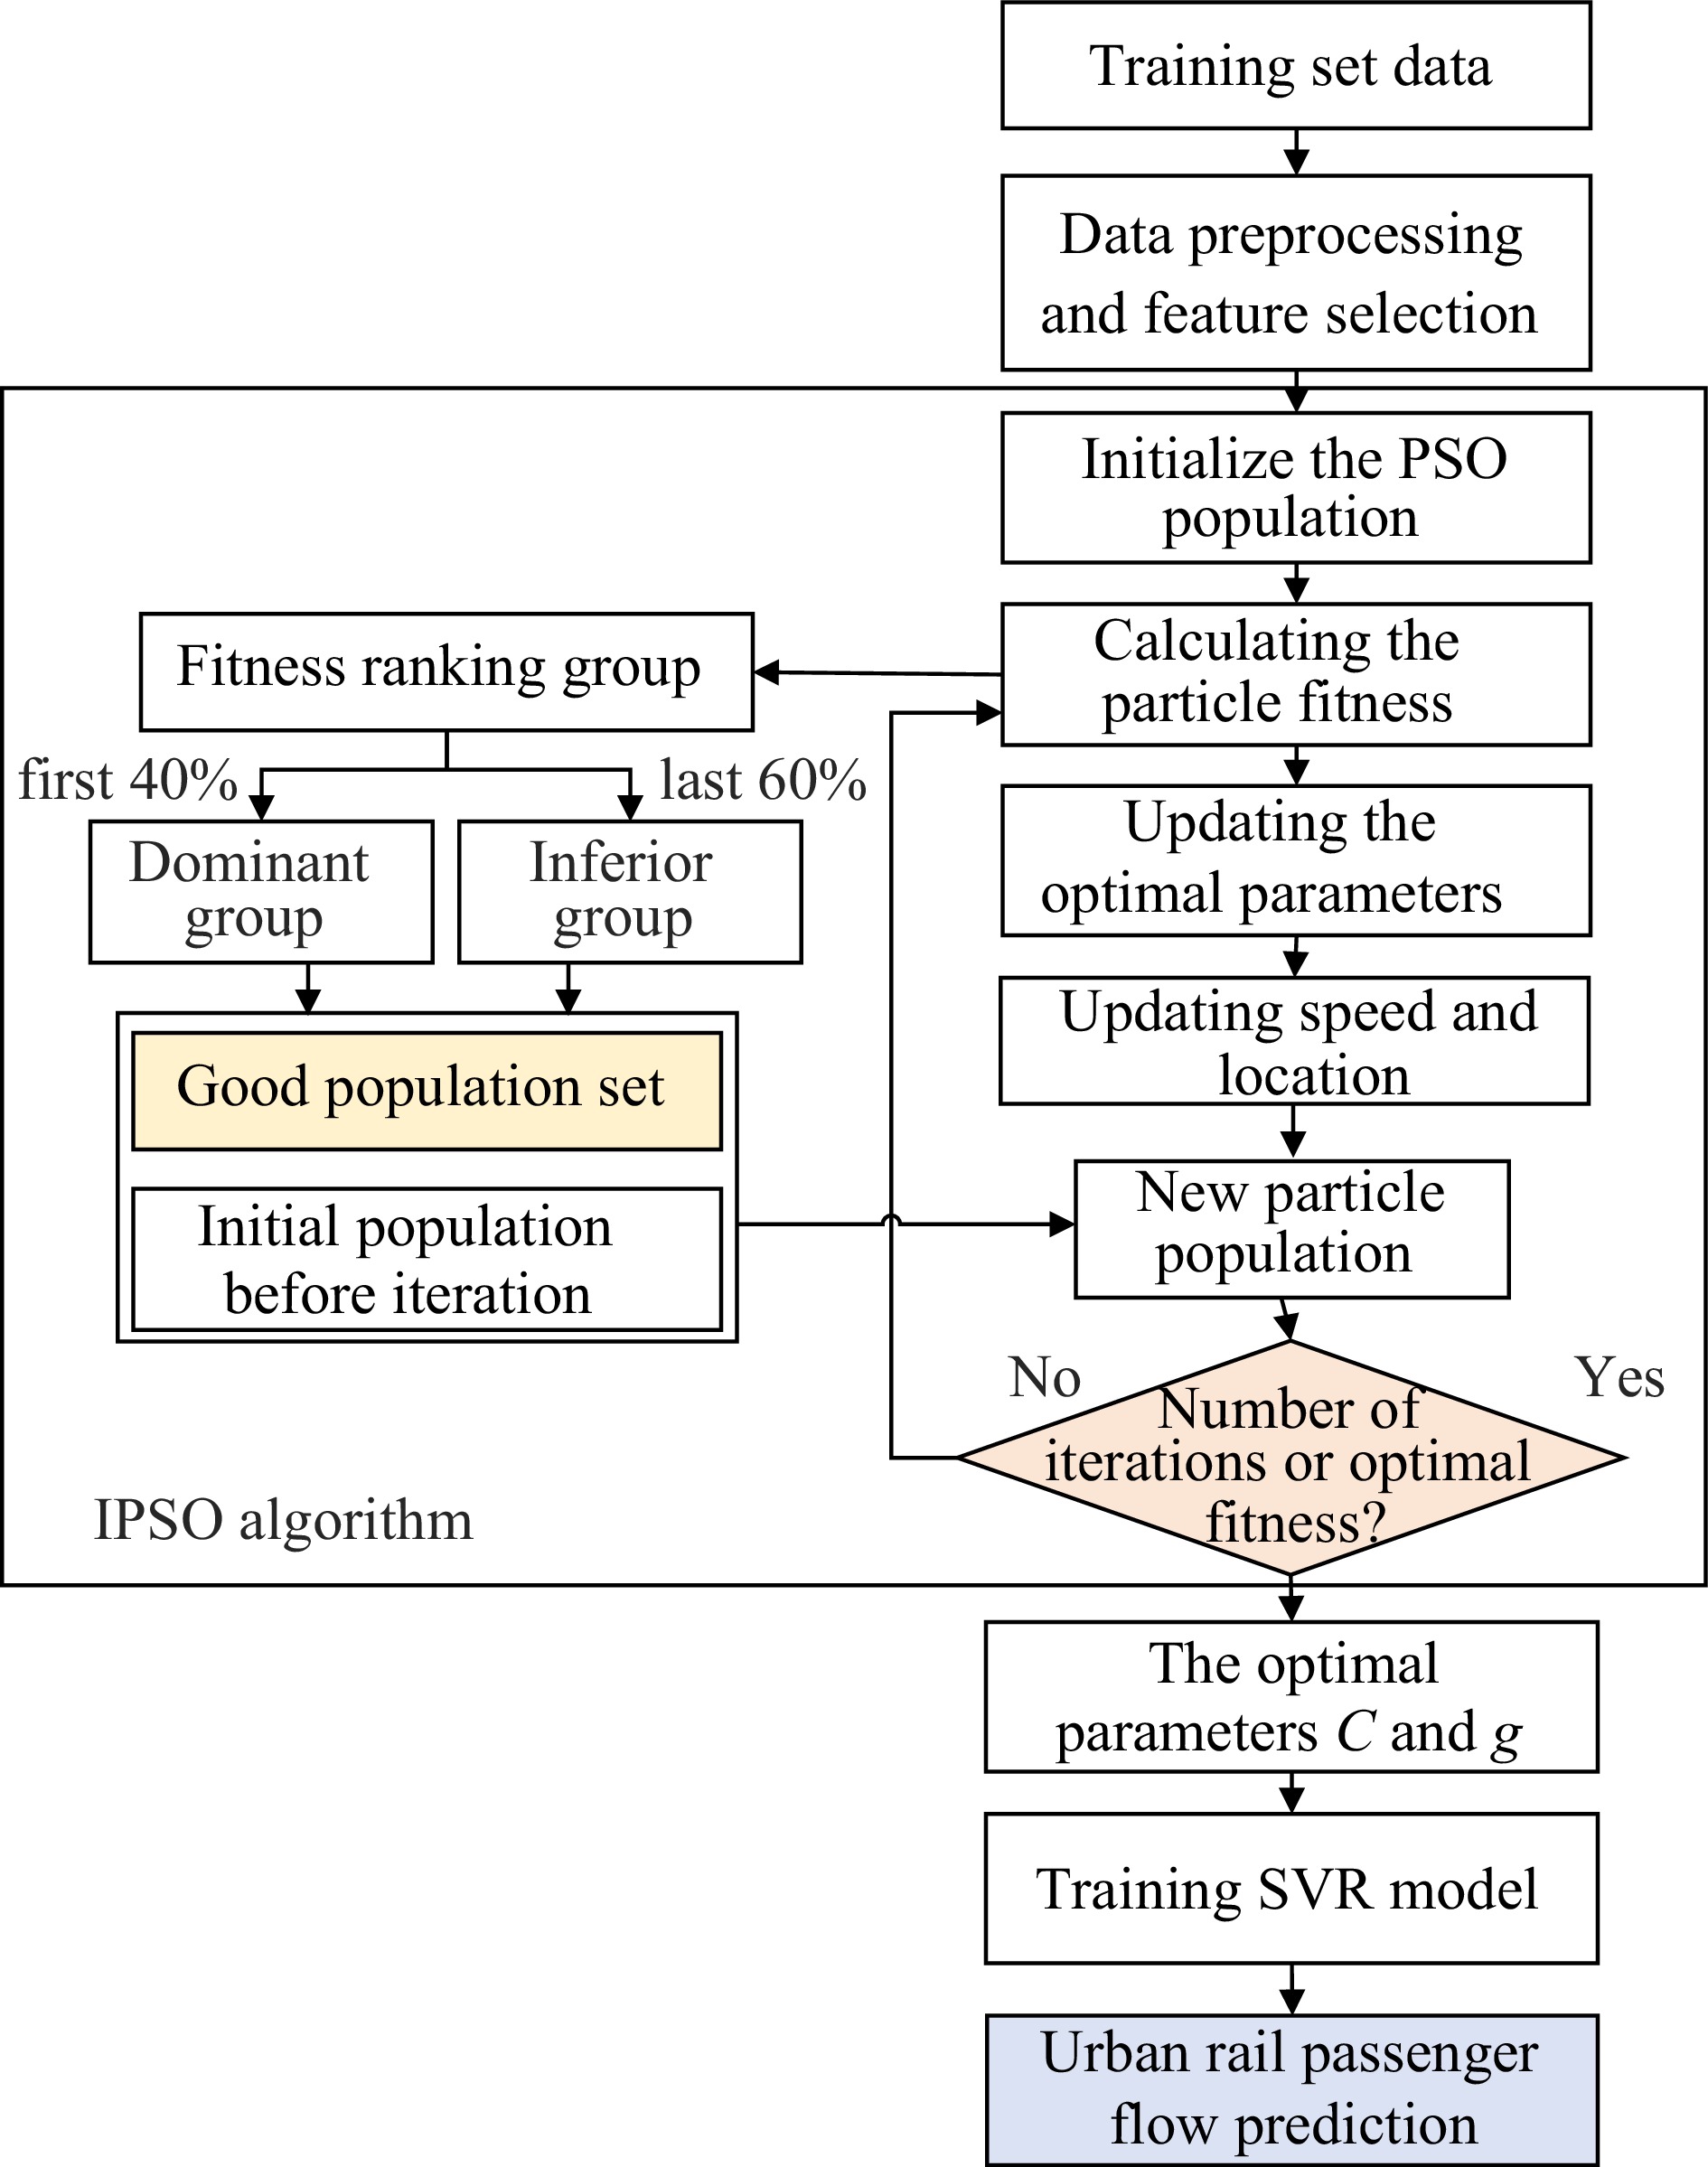
Figure 3.
IPSO-SVR algorithm iterative calculation flow chart.
-
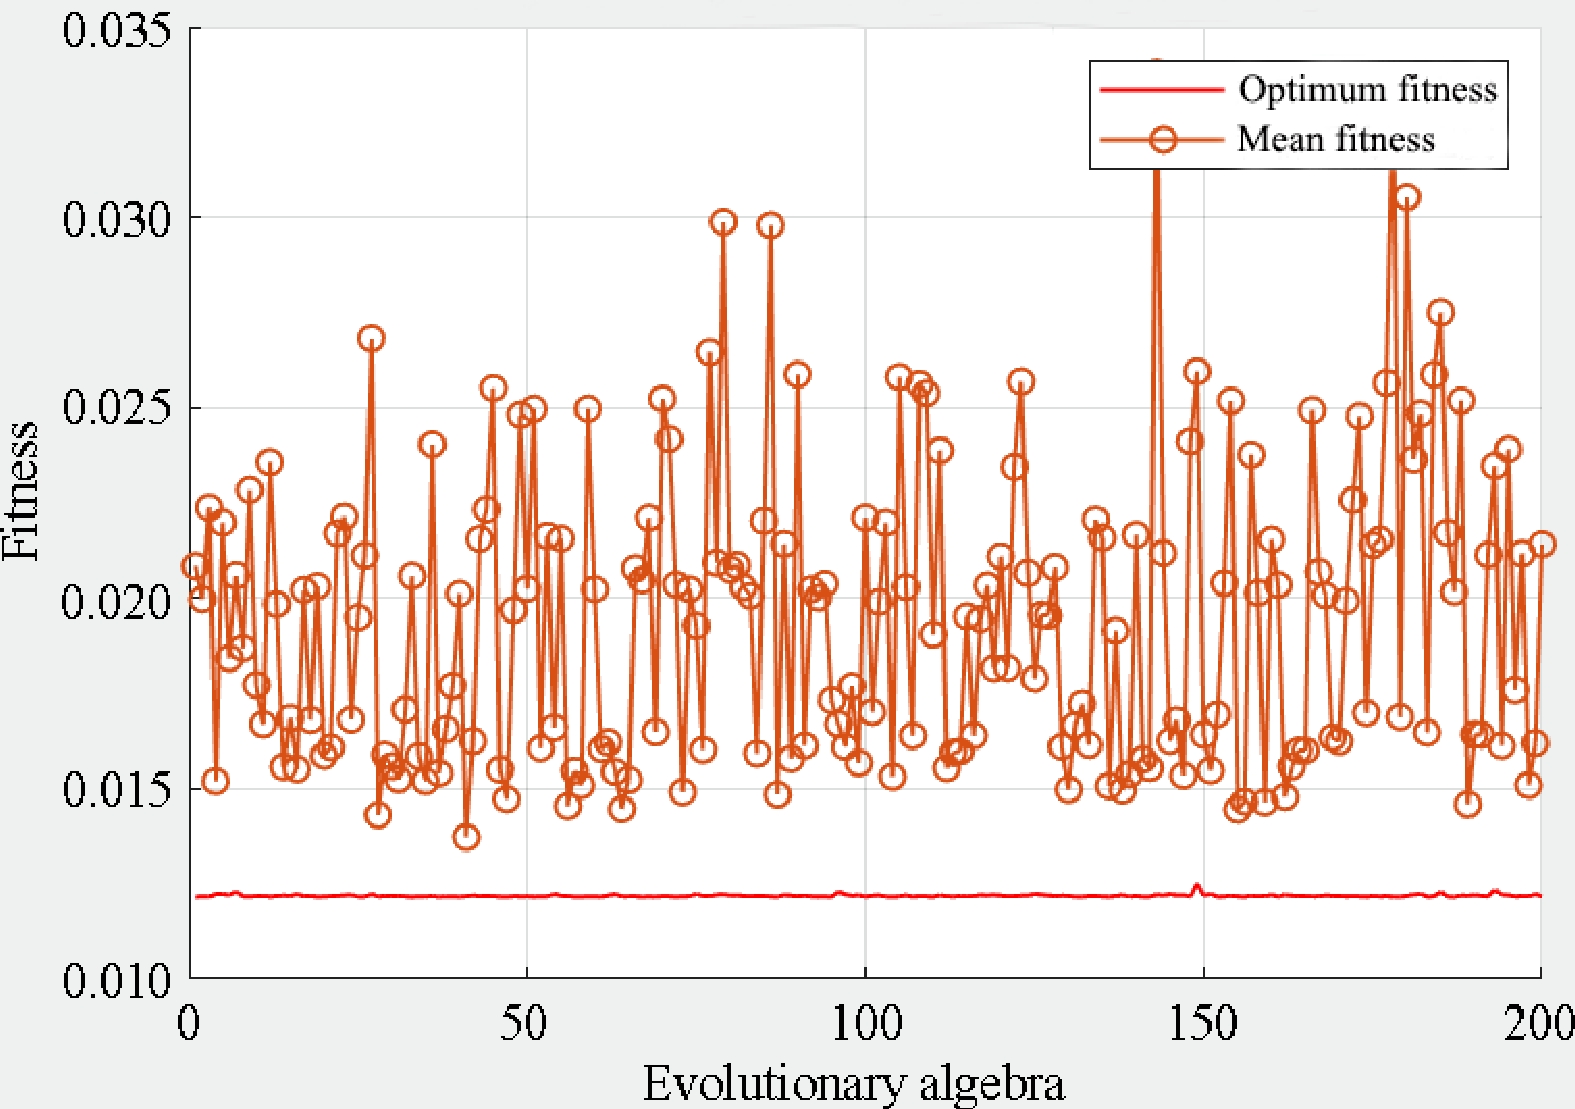
Figure 4.
Change curve of model parameter population fitness value.
-
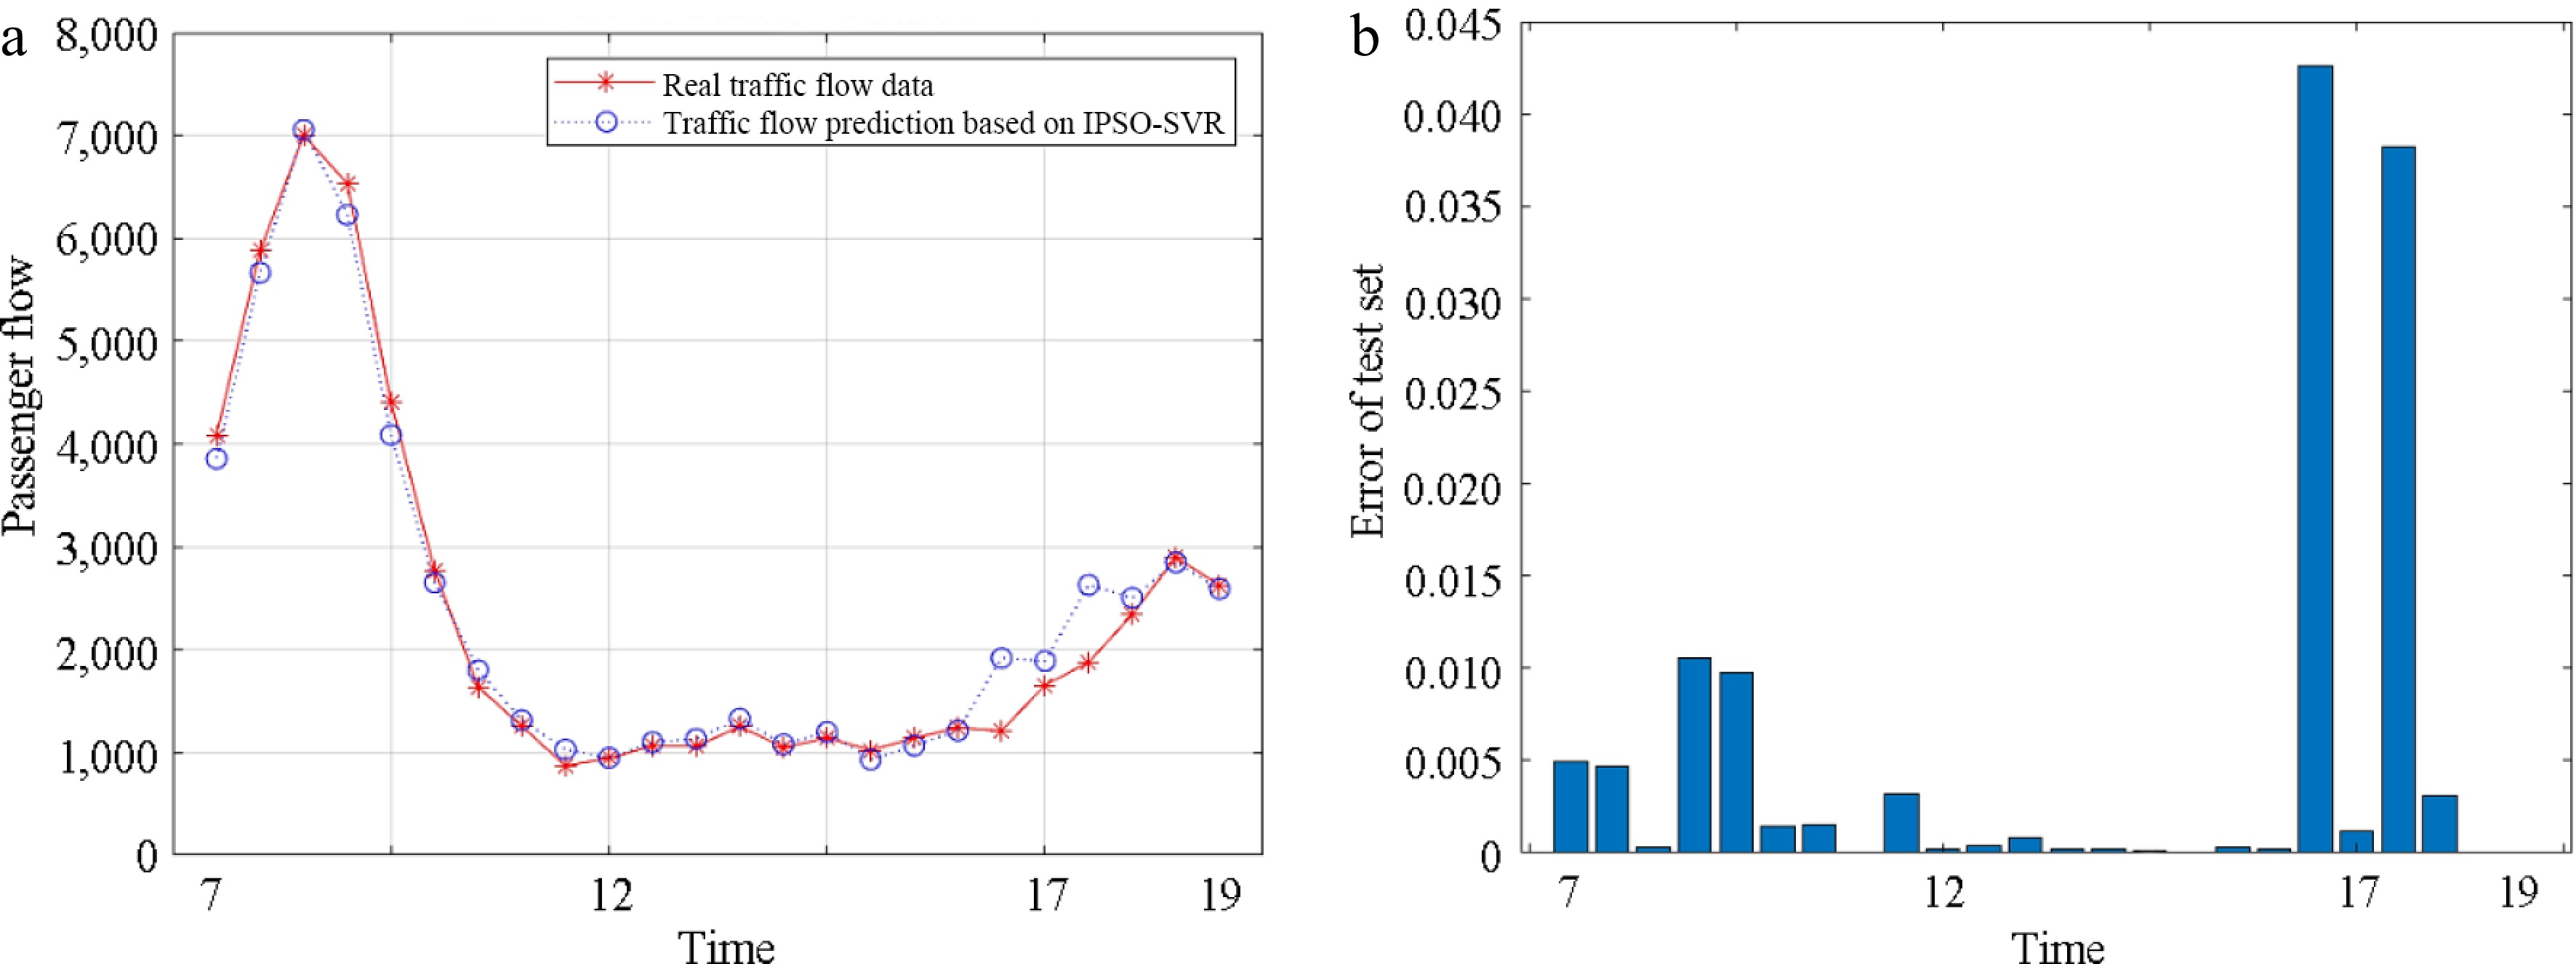
Figure 5.
Results of IPSO-SVR passenger flow prediction model. (a) Passenger flow prediction results. (b) Mean square error.
-
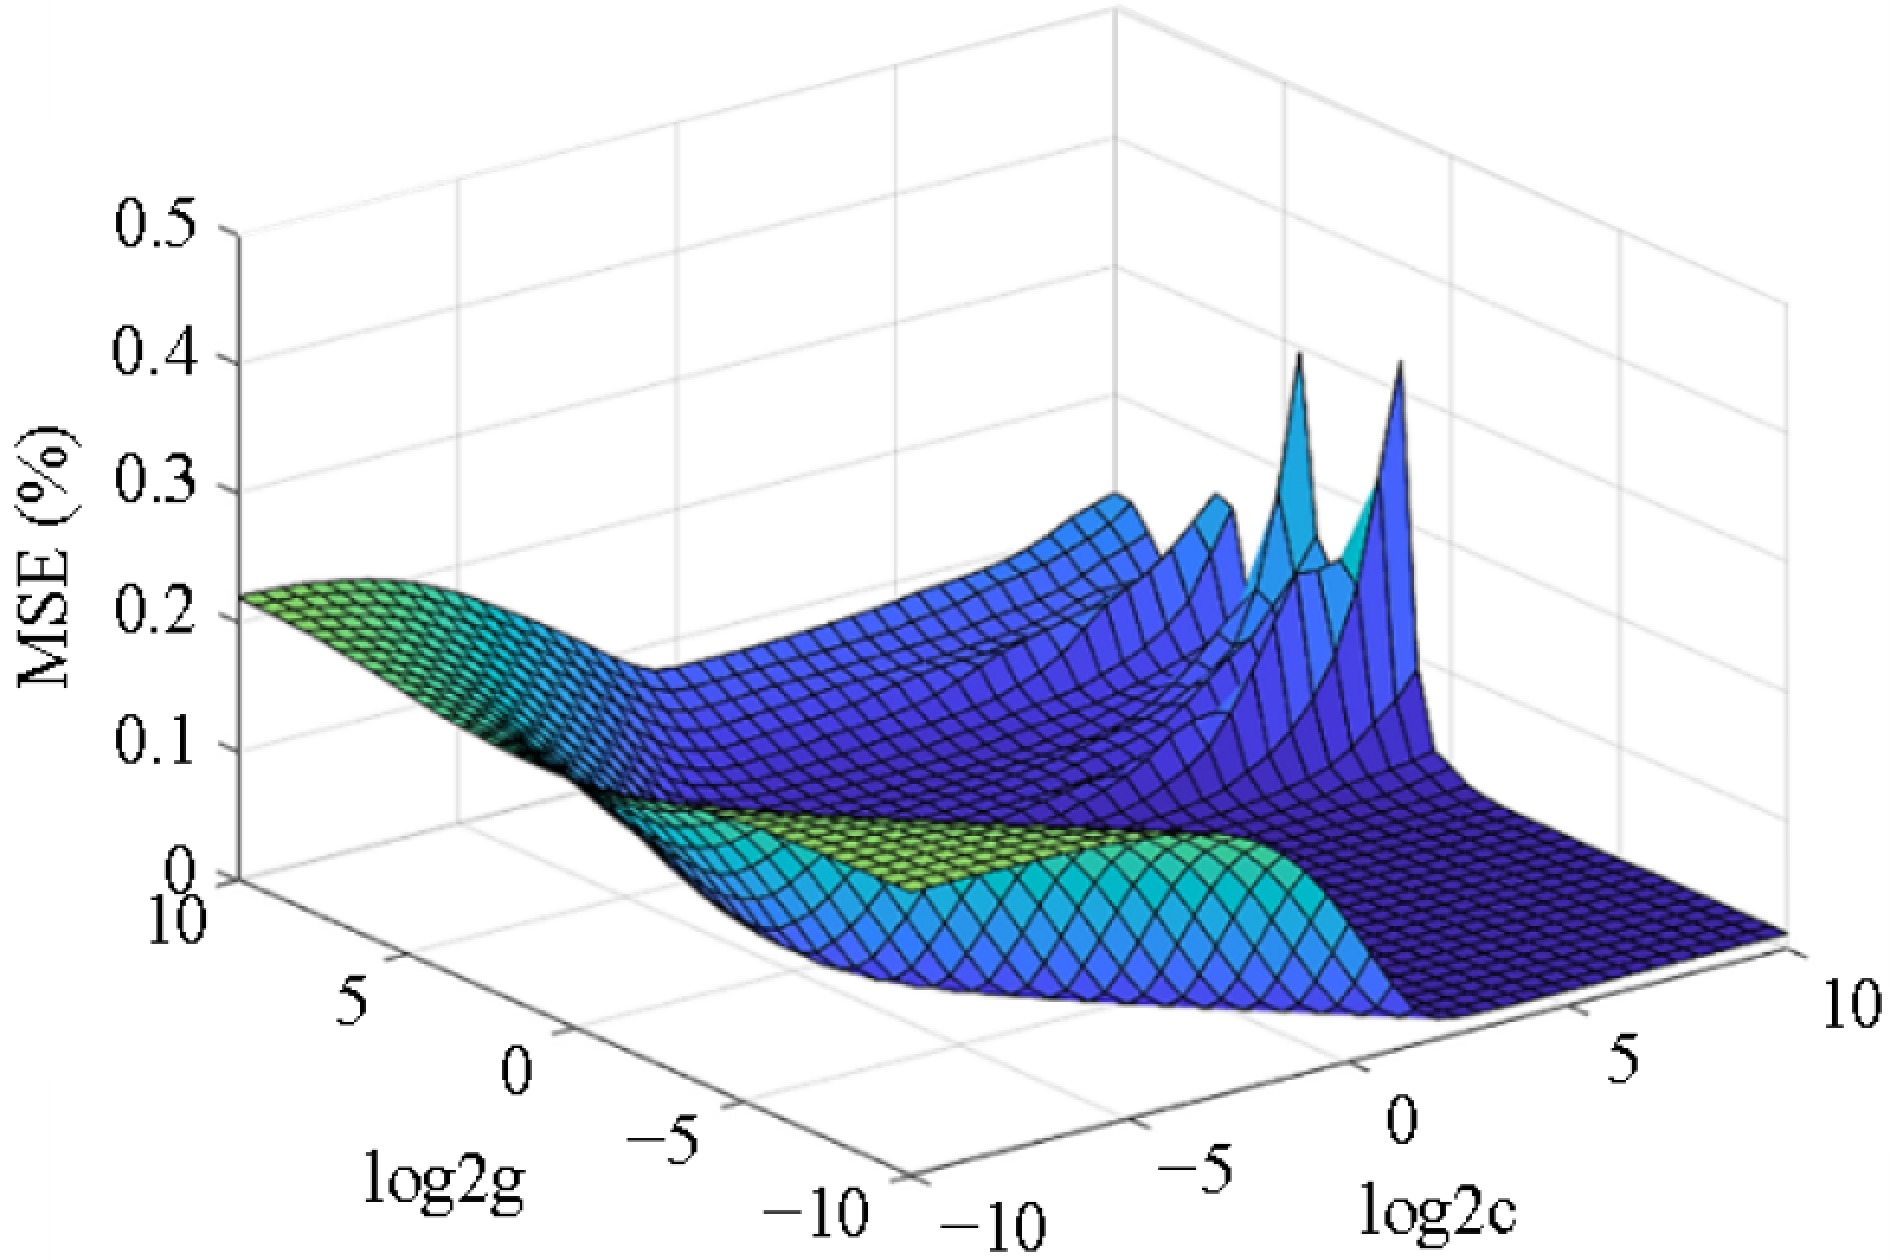
Figure 6.
MSE curve of the SVR prediction model with the grid method.
-
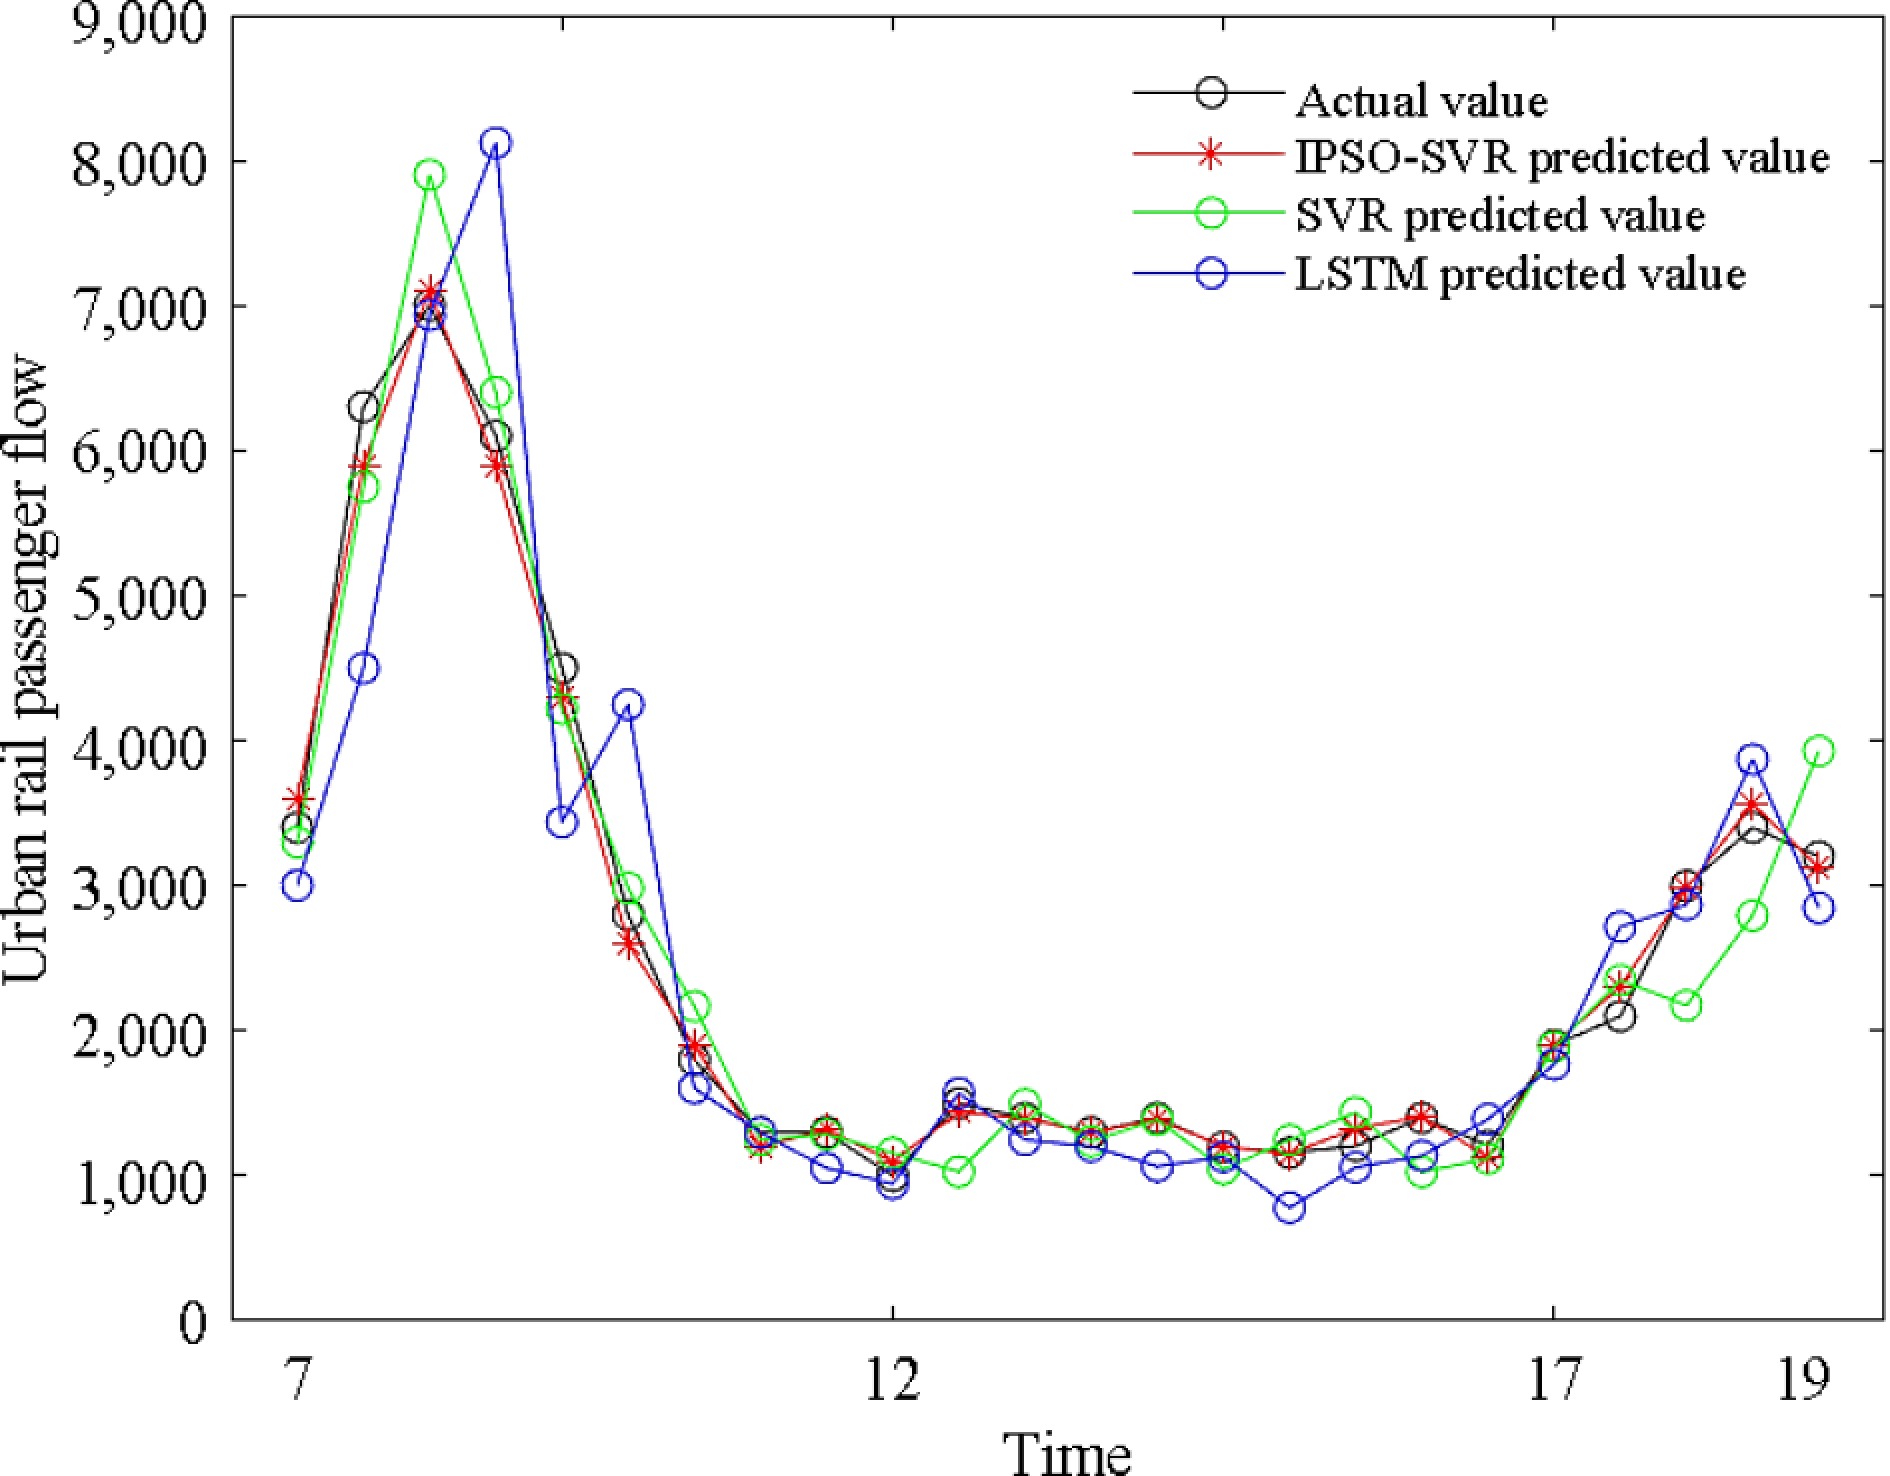
Figure 7.
Results of passenger flow prediction based on different models.
-
Field name Field meaning Data samples CARD_ID Card number ***180025 CARD_TYPE Card type 2 ENTYR_TIME Entry time 2019***568253 ENTYR_LINE_NUM Code of entry time 4 ENTYR_STATION_NUM Code of entry station 5 EXIT_TIME Exit time 2019***315549 EXIT_LINE_NUM Code of exit time 4 EXIT_STATION_NUM Code of exit station 12 Table 1.
Key fields of the Beijing rail transit AFC data sample.
-
Field Field name Data example DATE Date 2019/9/11 PRCP 1-h precipitation (mm) 0 HUM Relative humidity (%) 56.5 TEMP Temperature 1.6 SPD 10-min wind speed (m/s) 4.8 PRE Atmospheric pressure (HPa) 1014 Table 2.
Main fields of weather data.
-
Prediction models Evaluation metrics MSE RA IPSO-SVR 1.54% 92.37% LSTM 1.71% 89.54% SVR 1.94% 87.92% Table 3.
Results of passenger flow prediction evaluation indexes of different models.
Figures
(7)
Tables
(3)