-
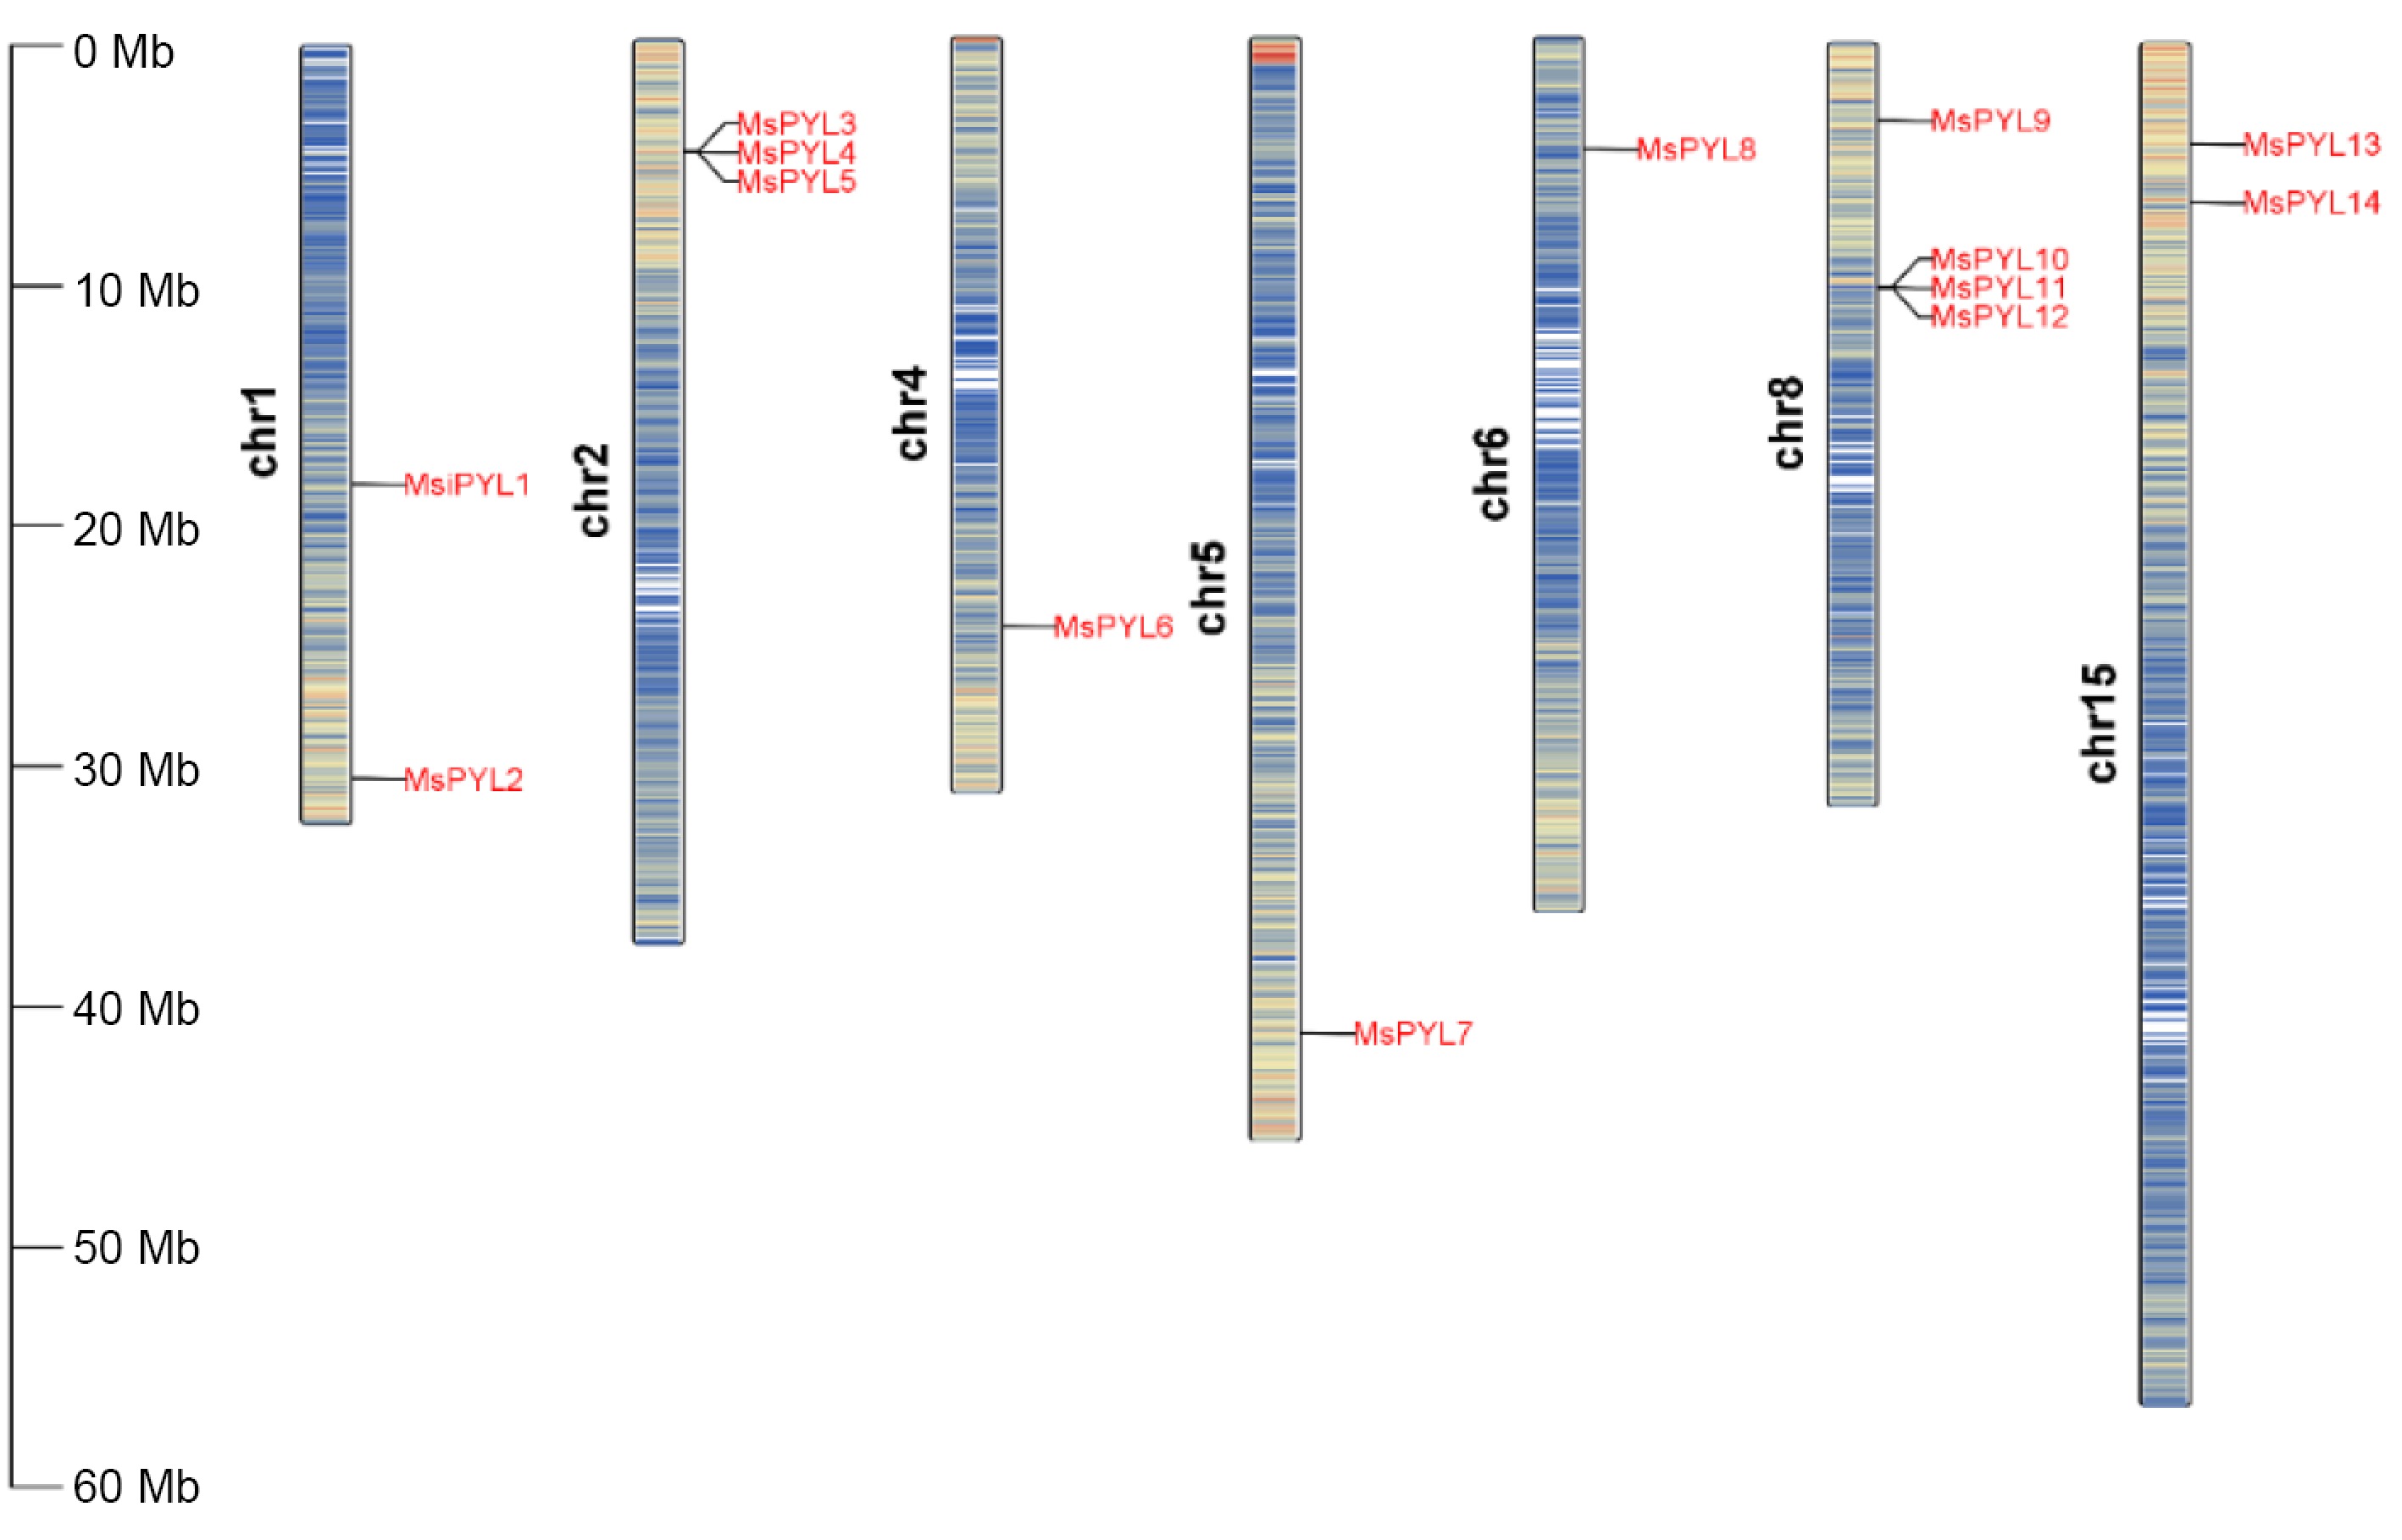
Figure 1.
Chromosomal locations of MsPYLs in Malus sieversii, the scale units on the left are in mega bases.
-
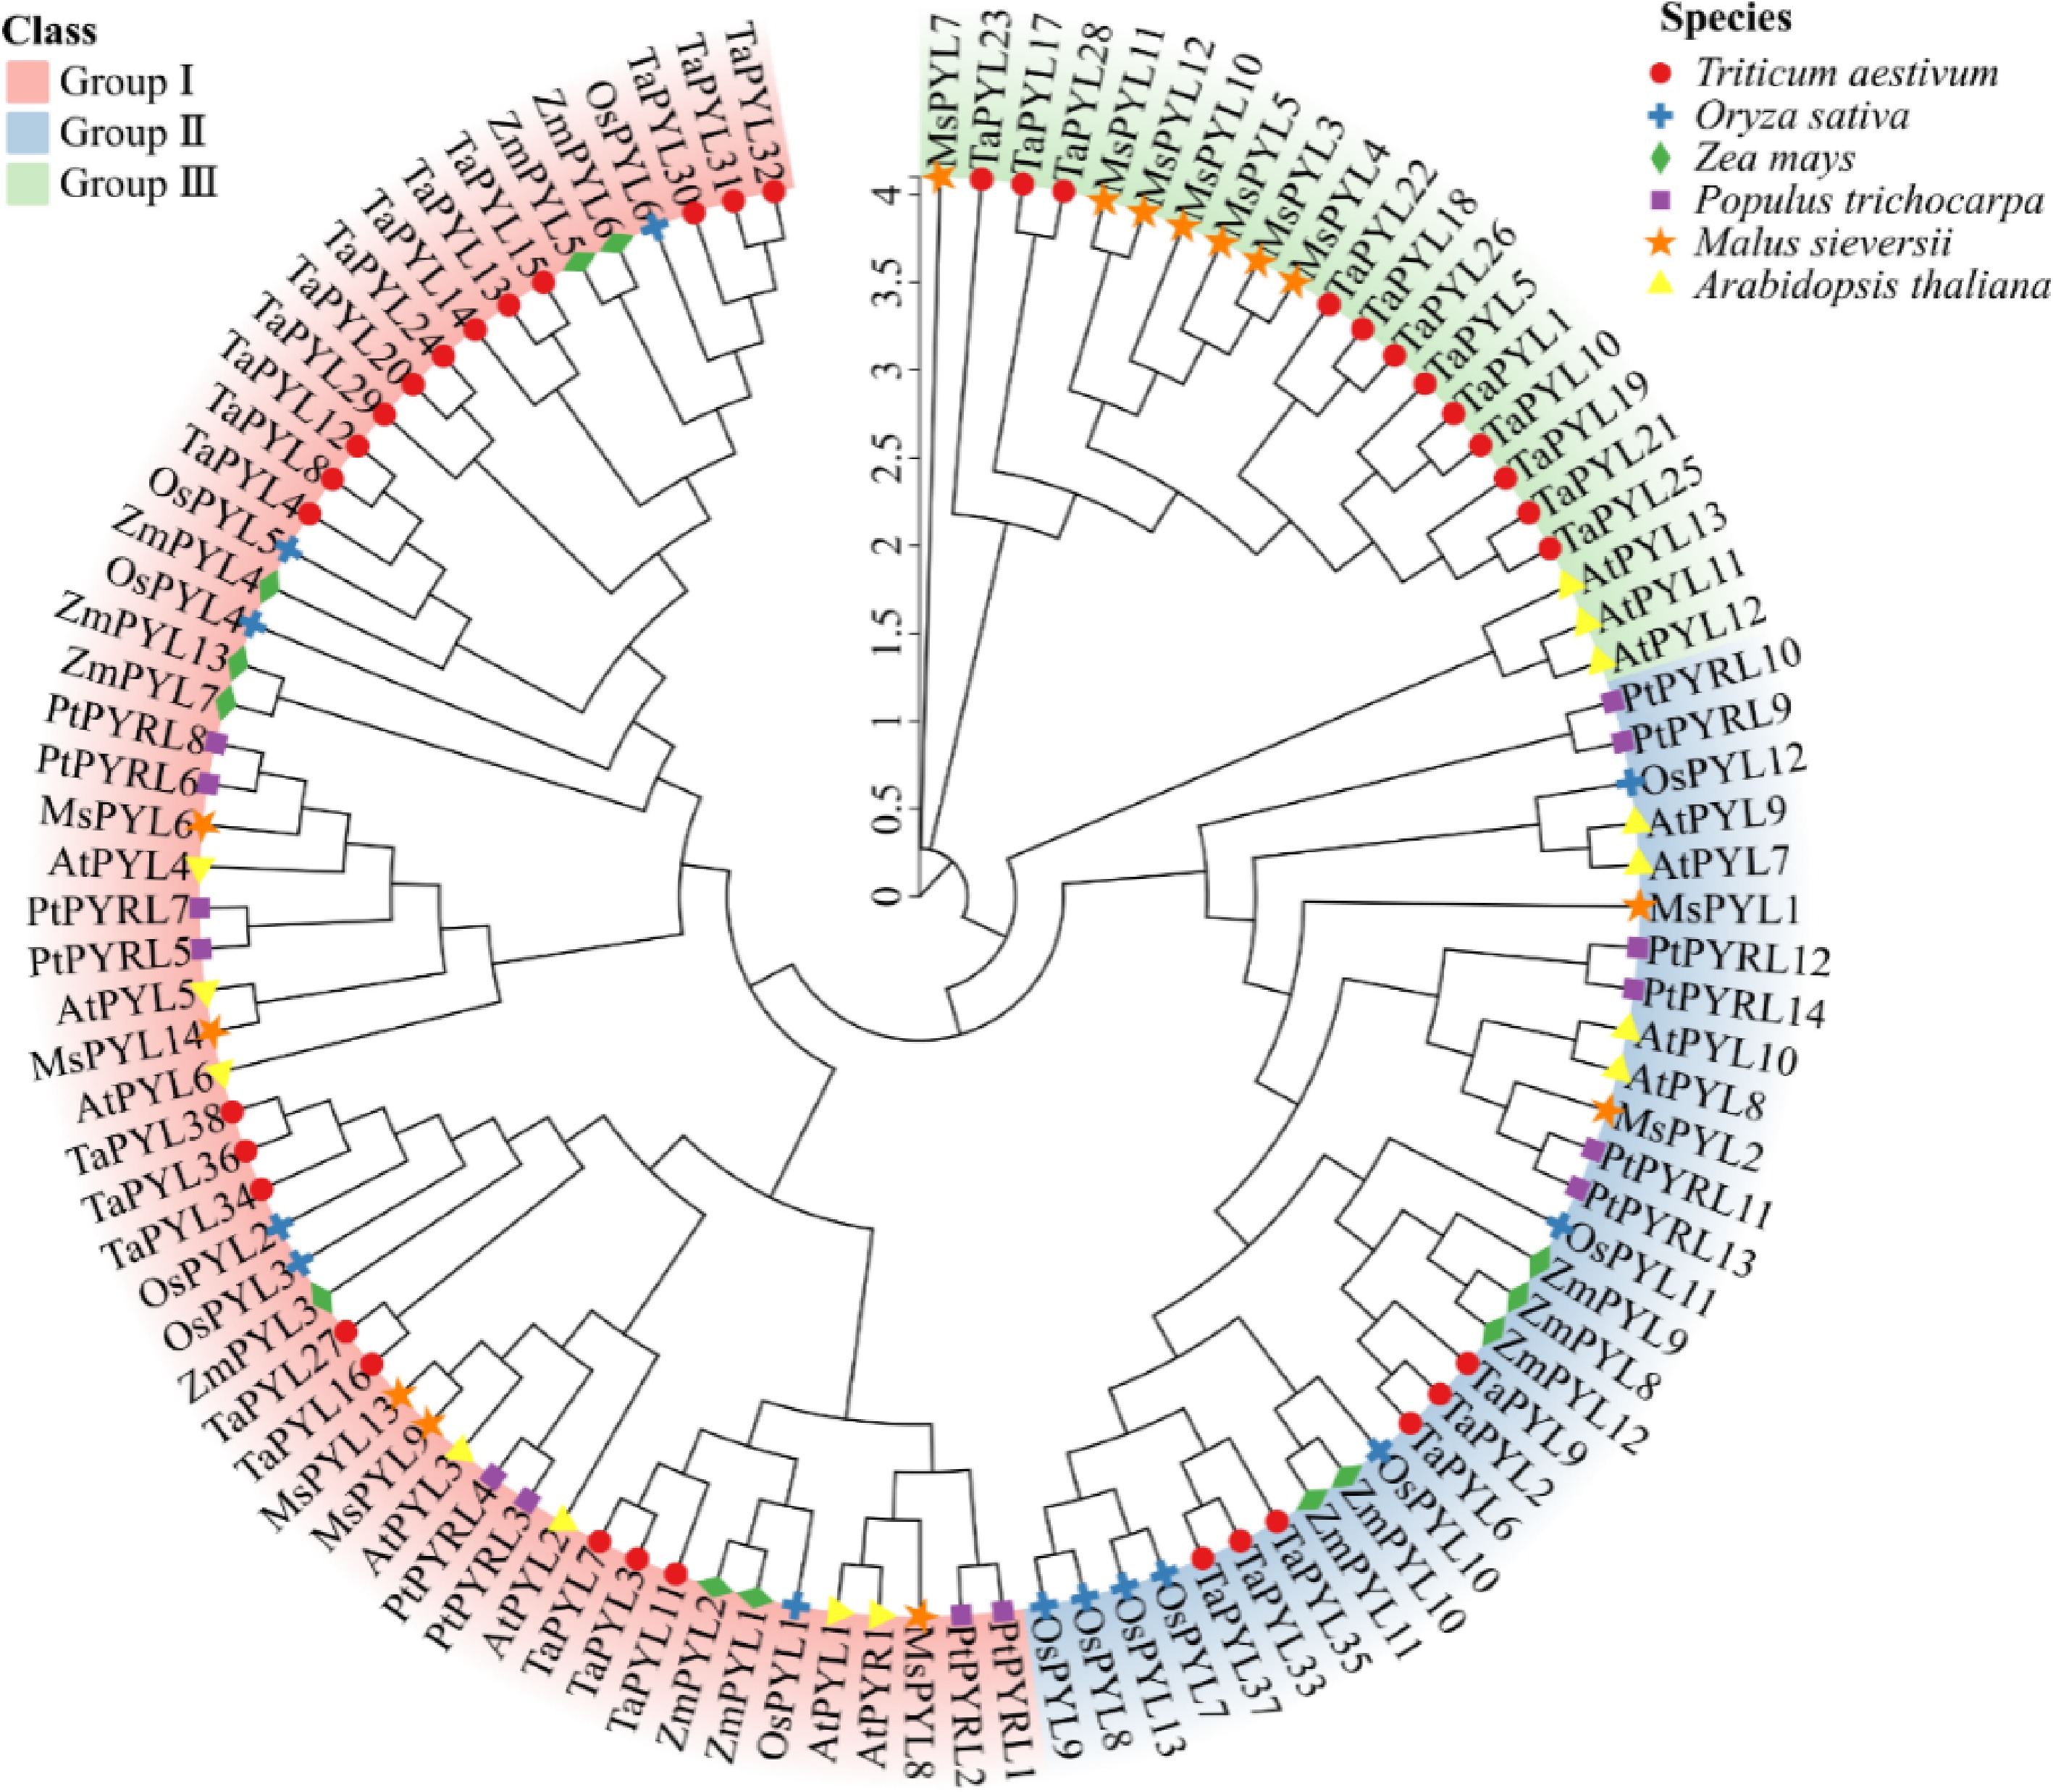
Figure 2.
Phylogenetic relationships of PYL proteins Malus sieversii, Triticum aestivum, Oryza sativa, Zea mays, Arabidopsis thaliana, and Populus trichocarpa. Different colours show the three groups (I, II, III) of PYL. Thirty-eight wheat PYLs are represented by red circles, 13 rice PYLs are represented by blue crosses, 13 maize PYLs are represented by green diamonds, 14 Populus trichocarpa PYLs are represented by purple rectangles, 14 Malus sieversii PYLs are represented by orange pentagrams, and 14 Arabidopsis thaliana PYLs are represented by yellow triangles.
-
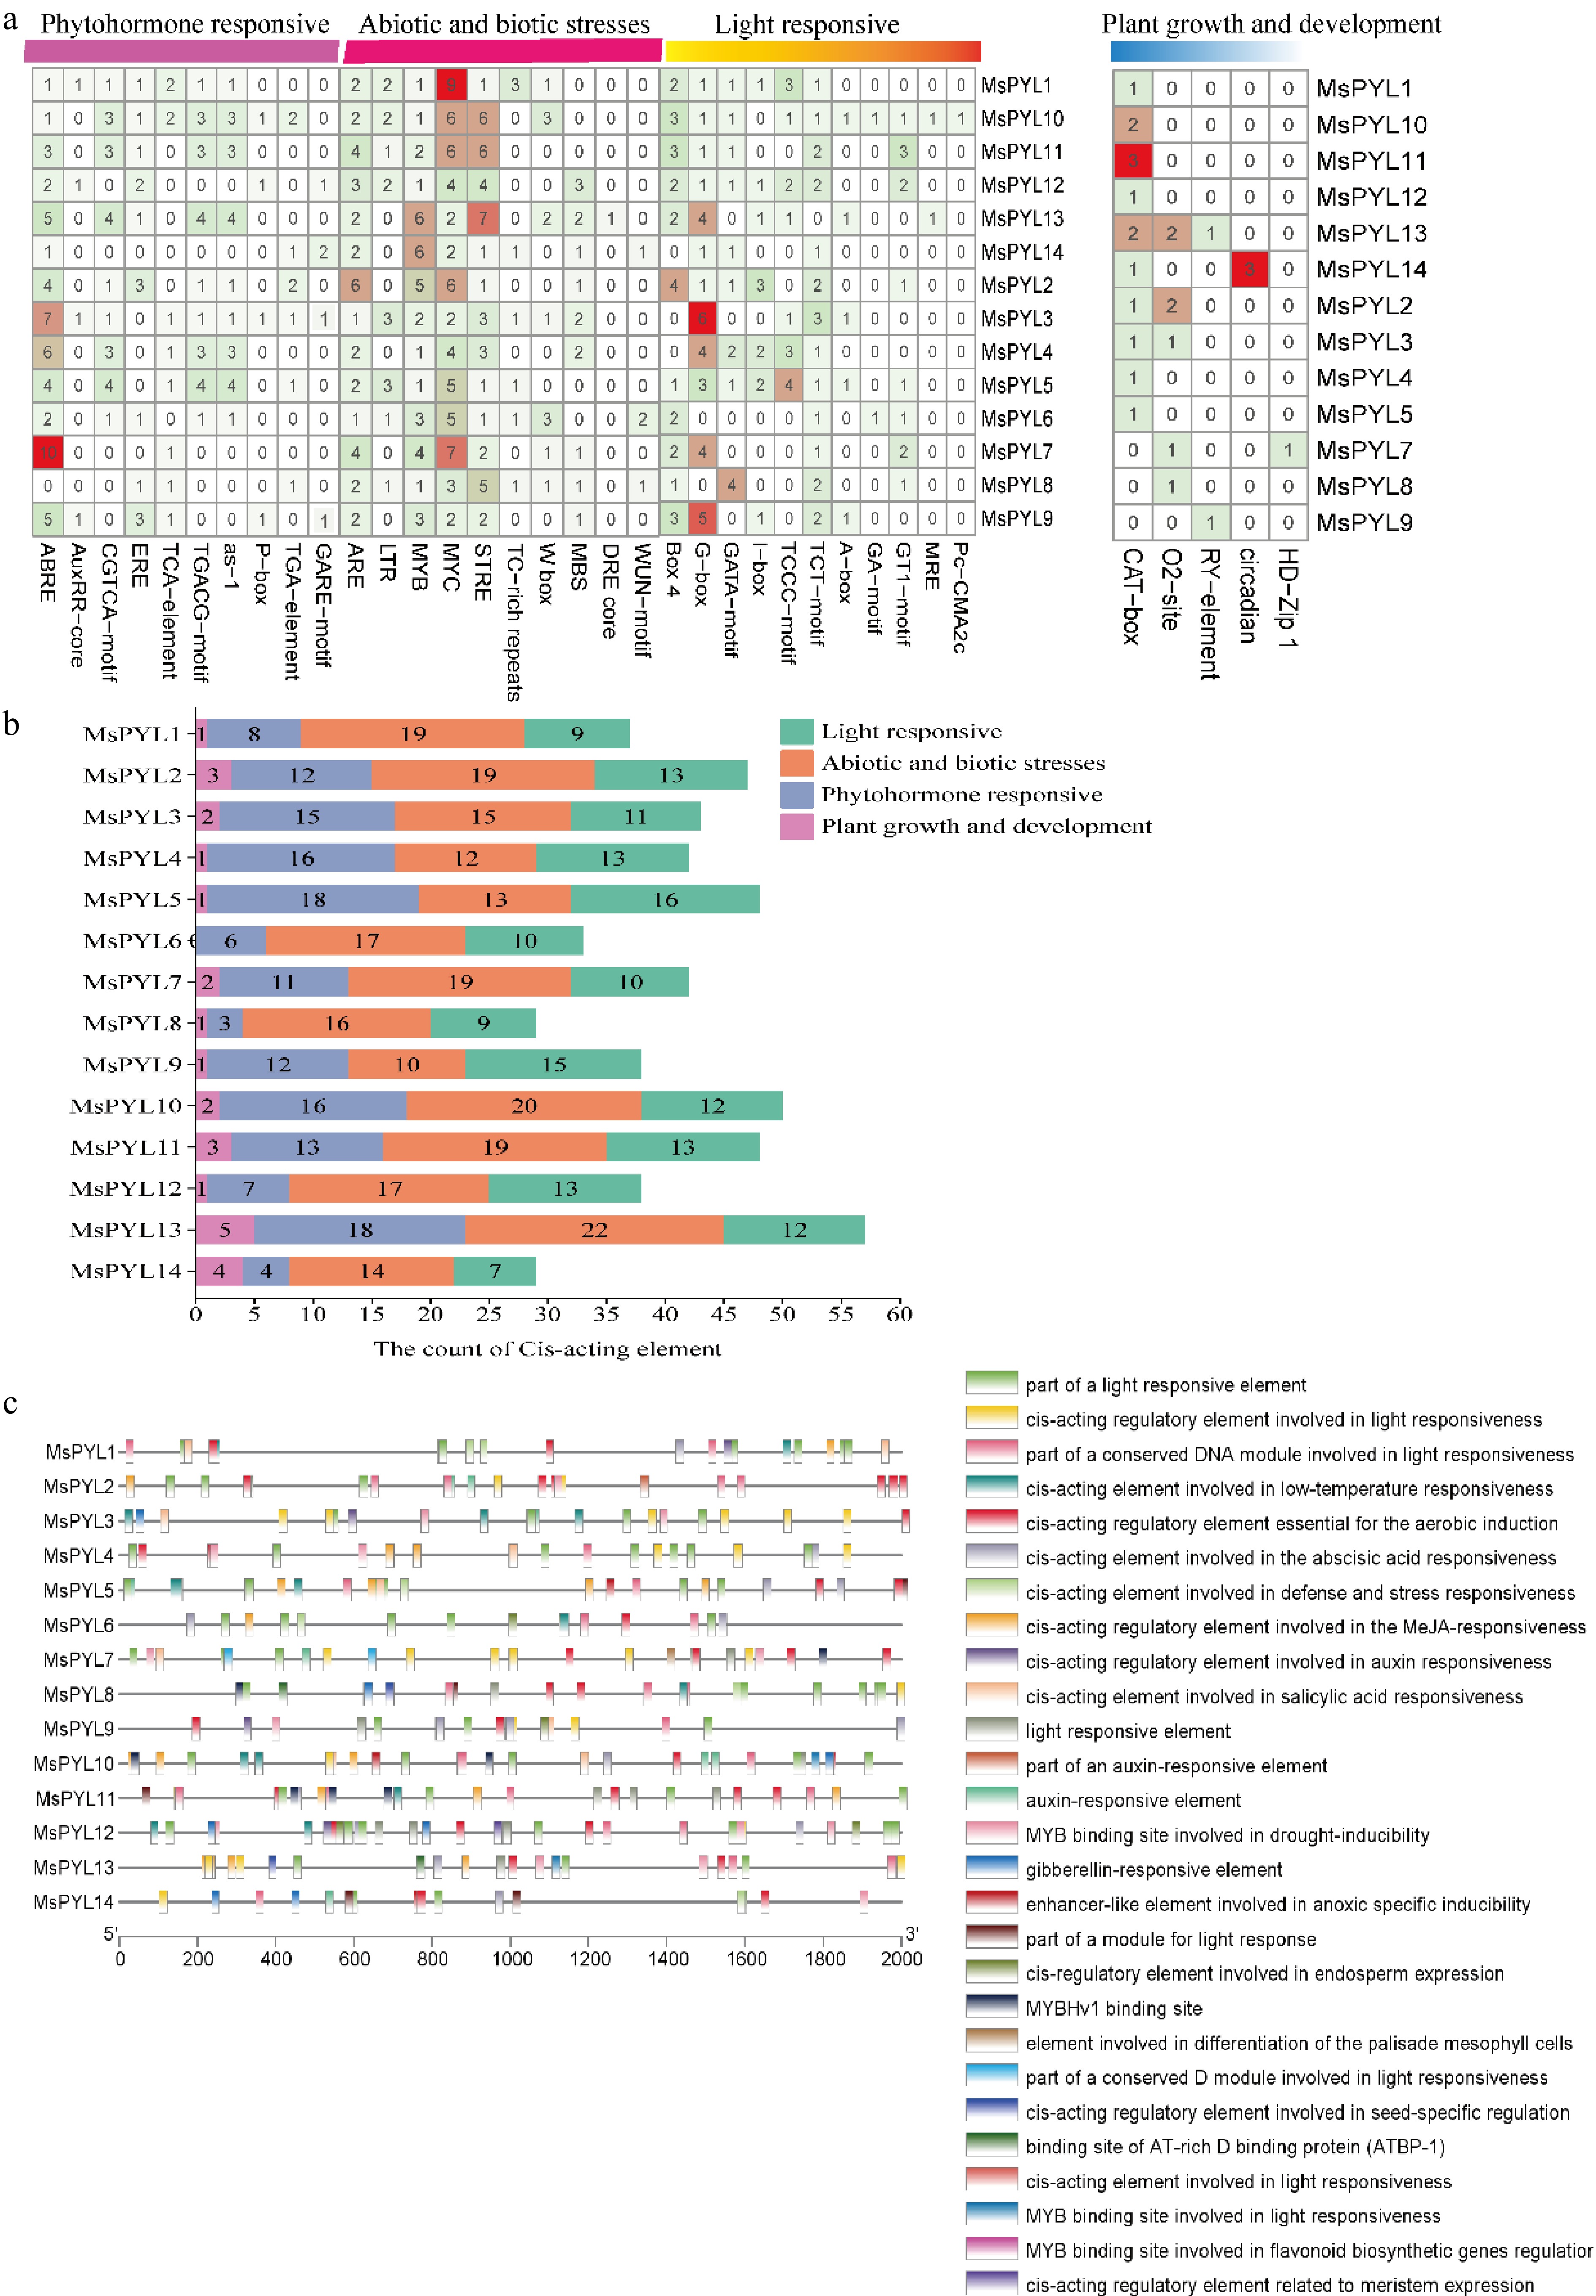
Figure 3.
Cis-acting elements on the promoter of the MsPYL gene. (a) Four types of cis-acting elements. (b) Statistics of the total number of cis-acting elements. (c) Distribution of cis-acting elements: different colour modules on the right represent different cis-acting elements. ABRE, ABA responsive motif; TGACG motif, and CGTCA motif, MeJA responsive motif.
-
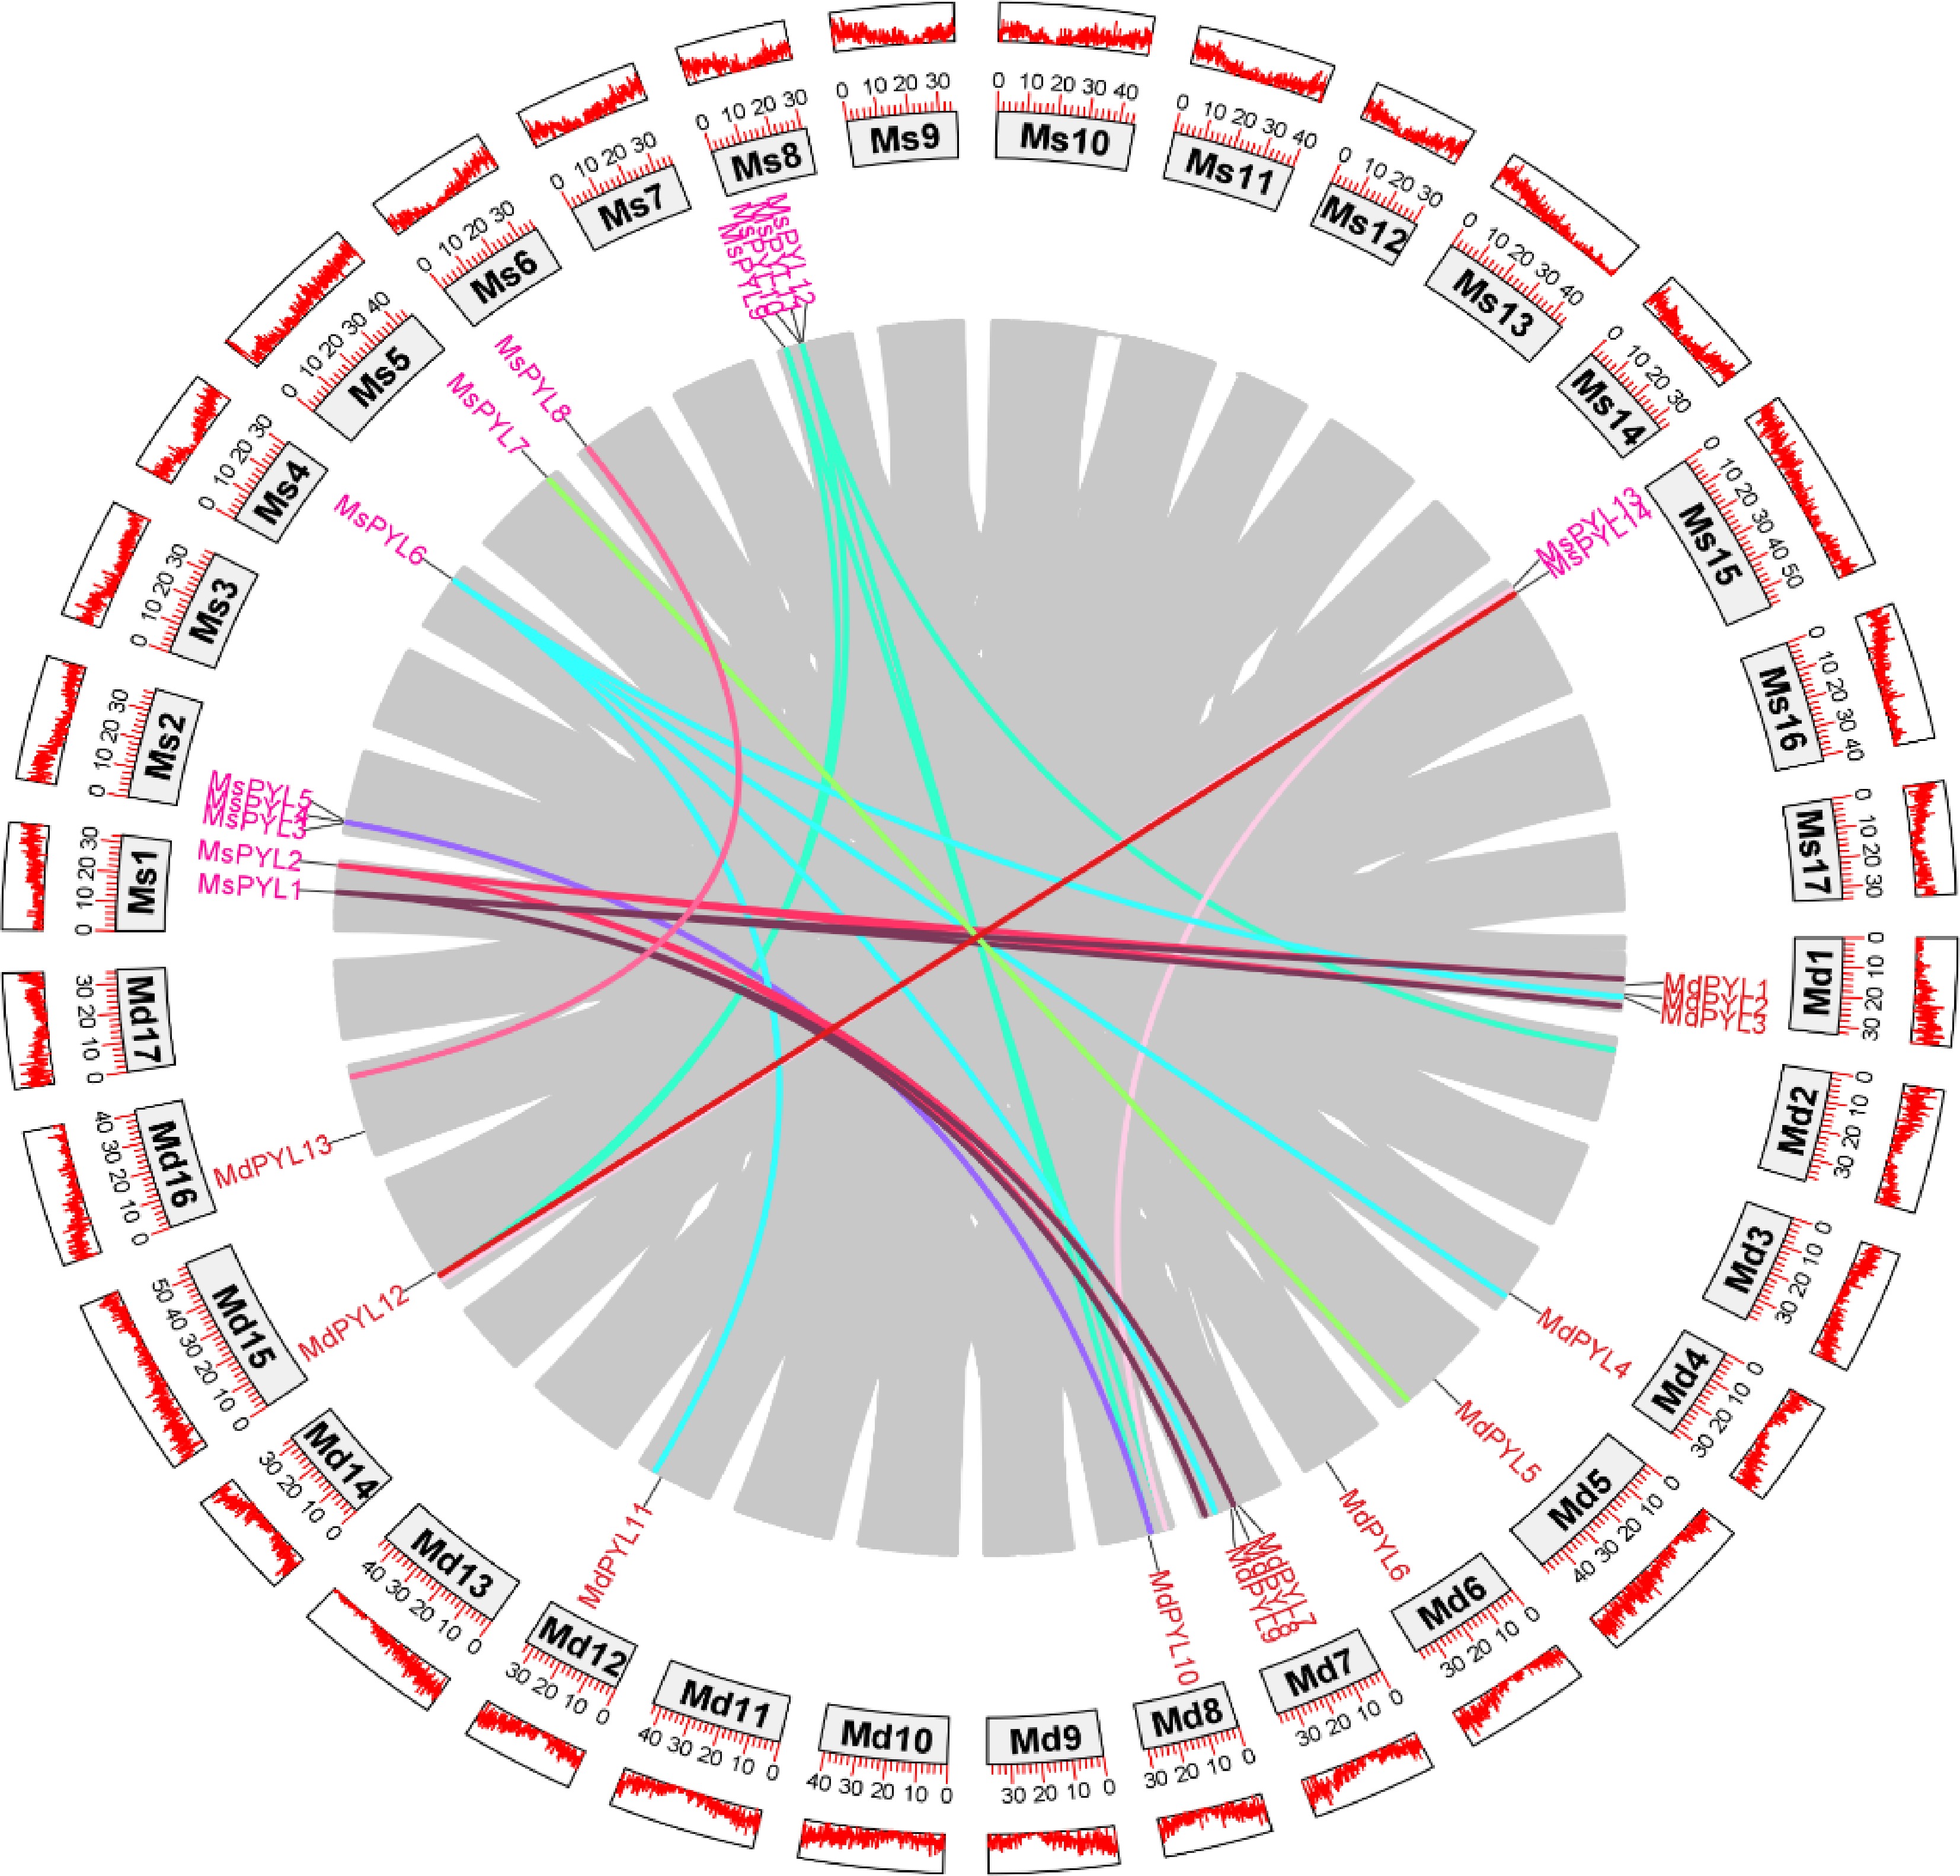
Figure 4.
Genome-wide collinearity pairs analysis between the Malus sieversii and Malus domestica PYL gene families. Different colours represent different PYL gene collinearity pairs.
-
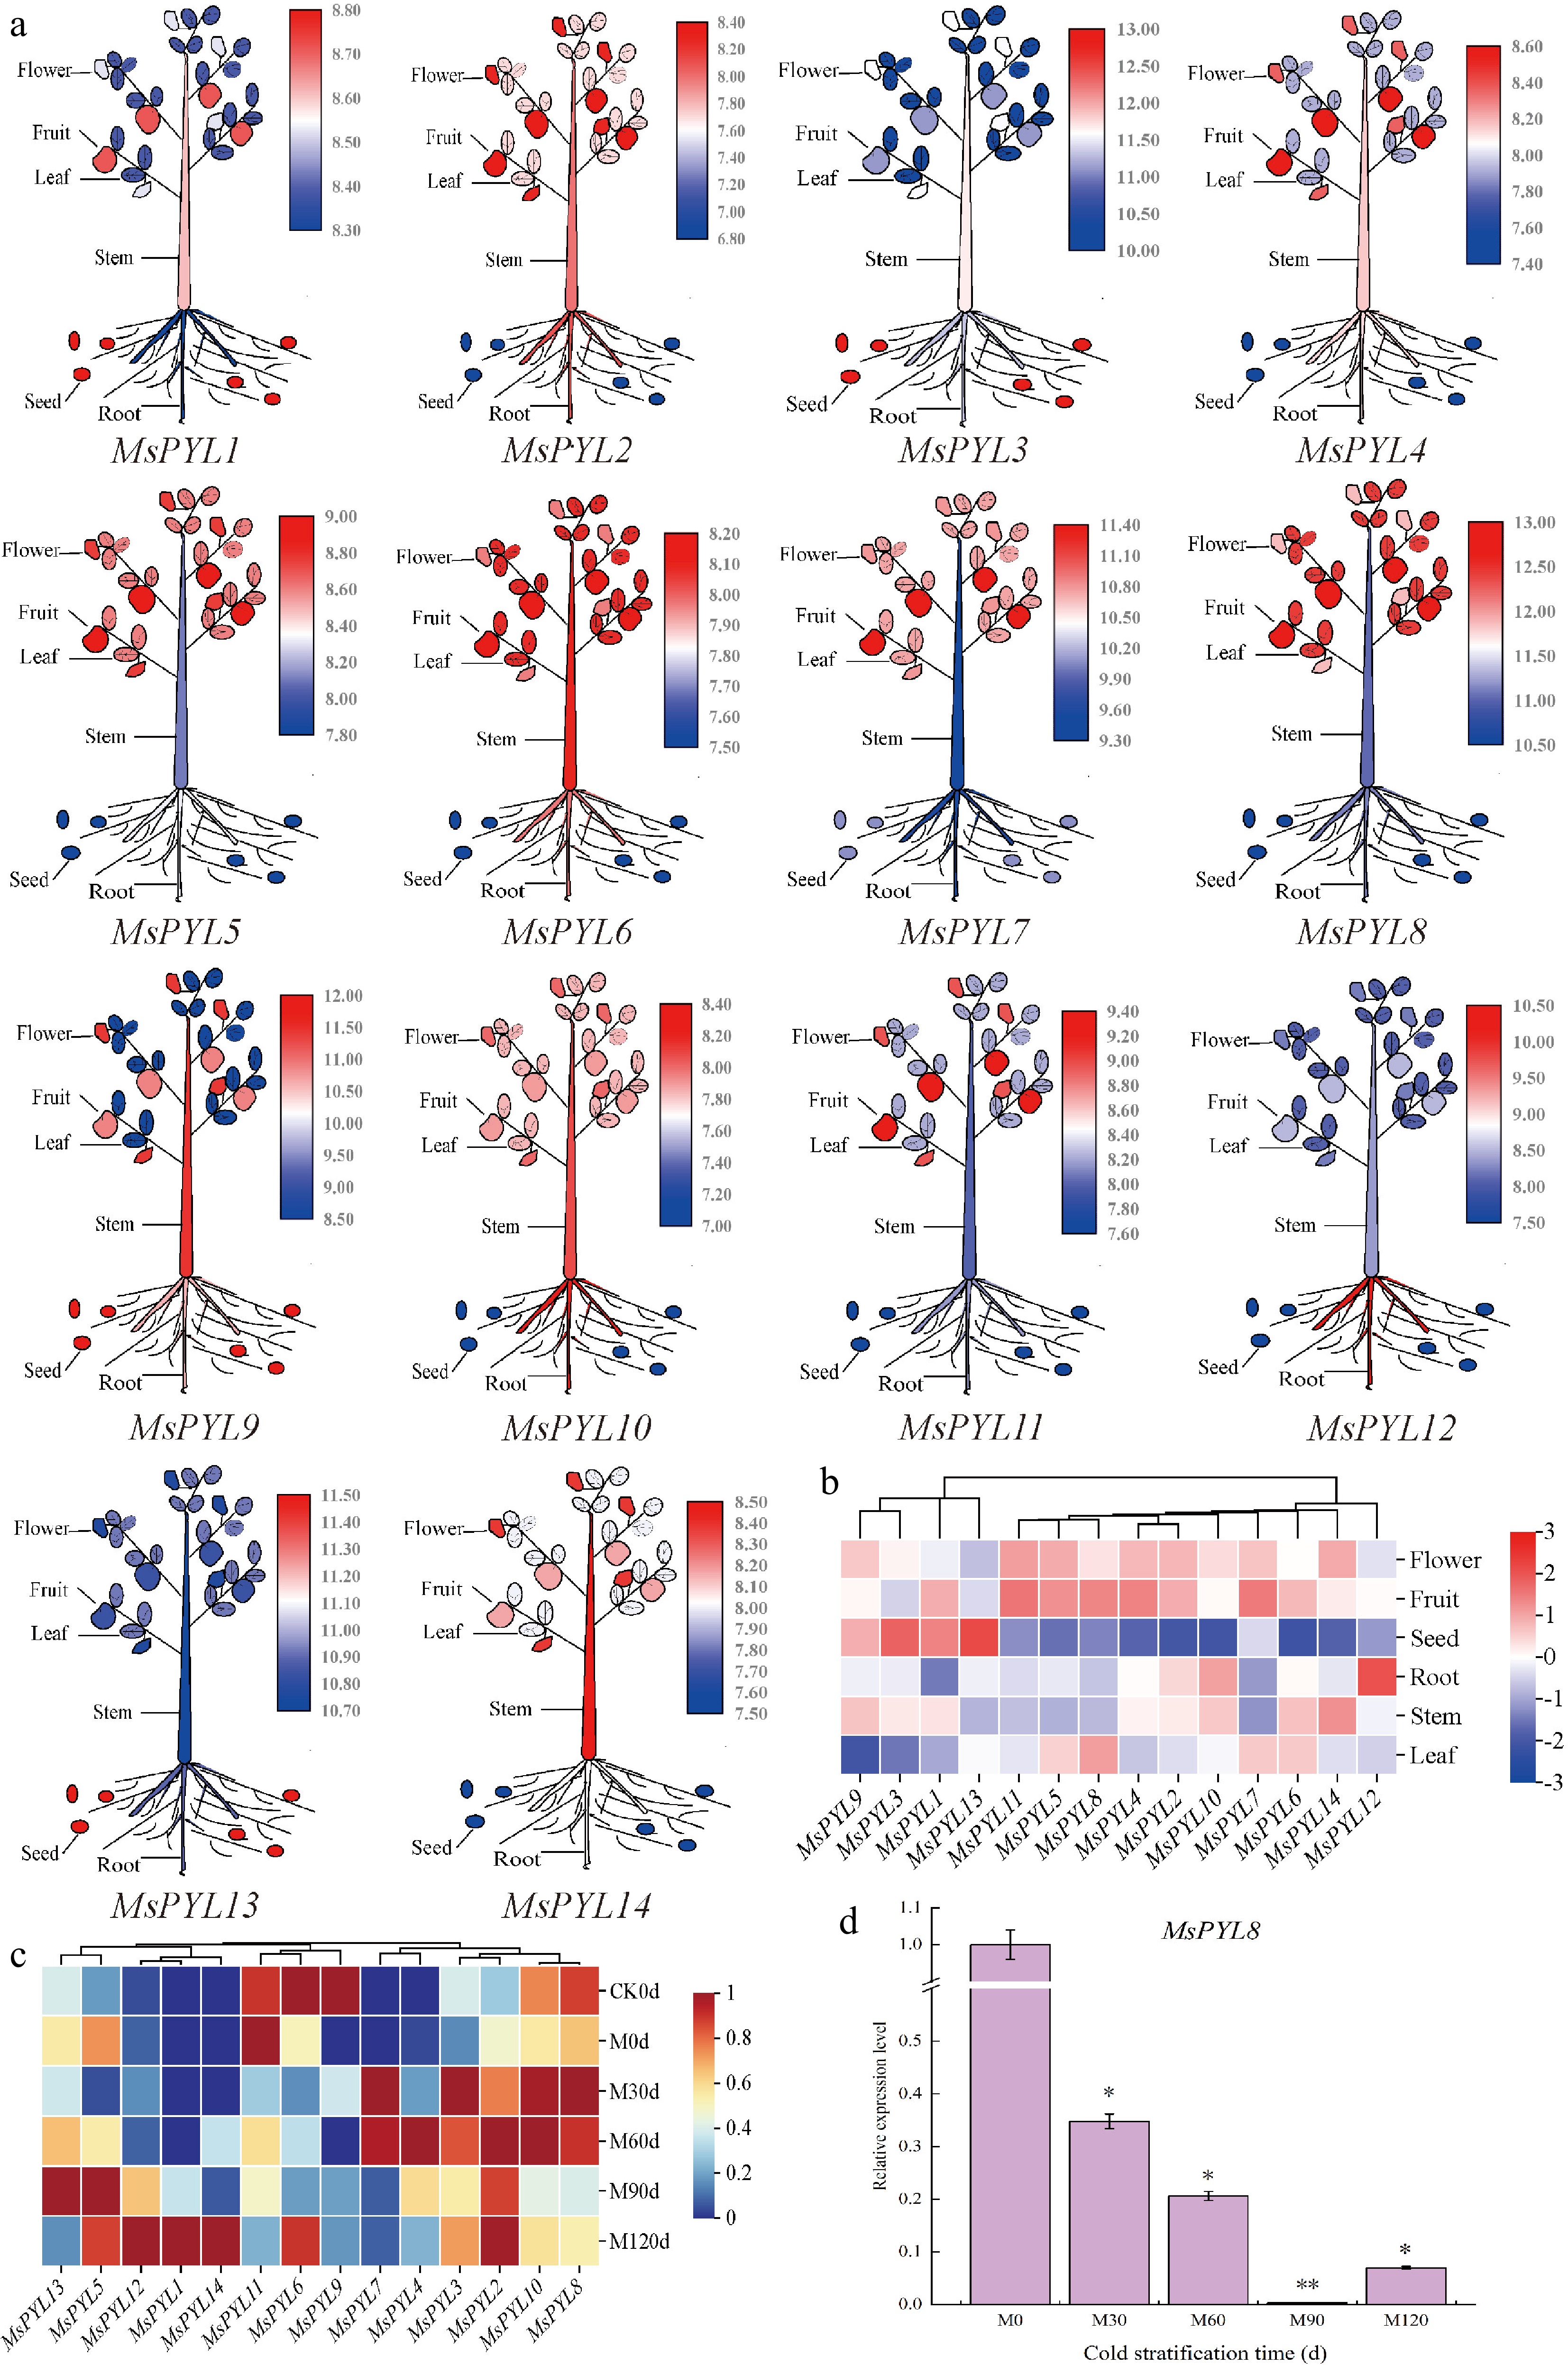
Figure 5.
PYL gene expression in Malus sieversii. (a) The expression pattern of the Malus sieversii PYL gene in six organs (seeds, roots, stems, leaves, mature fruits, and flowers) is shown in the form of a cartoon diagram of plant simulation. Red colour indicates high expression and blue colour indicates low expression. (b) Heat map showing the expression of PYL gene in six organs. (c) Heatmap demonstrating the expression pattern of PYL genes in seeds at different periods of low-temperature stratification. (d) MsPYL8 was analyzed by qRT-PCR. Error lines indicate standard deviation, and the values in the graphs are the mean ± standard deviation (SD) of three independent biological replicates. Student's t-test asterisks indicate significant up- or down-regulation of the MsPYL8 compared to the un-stratified treatment (* p < 0.05, ** p < 0.01).
-
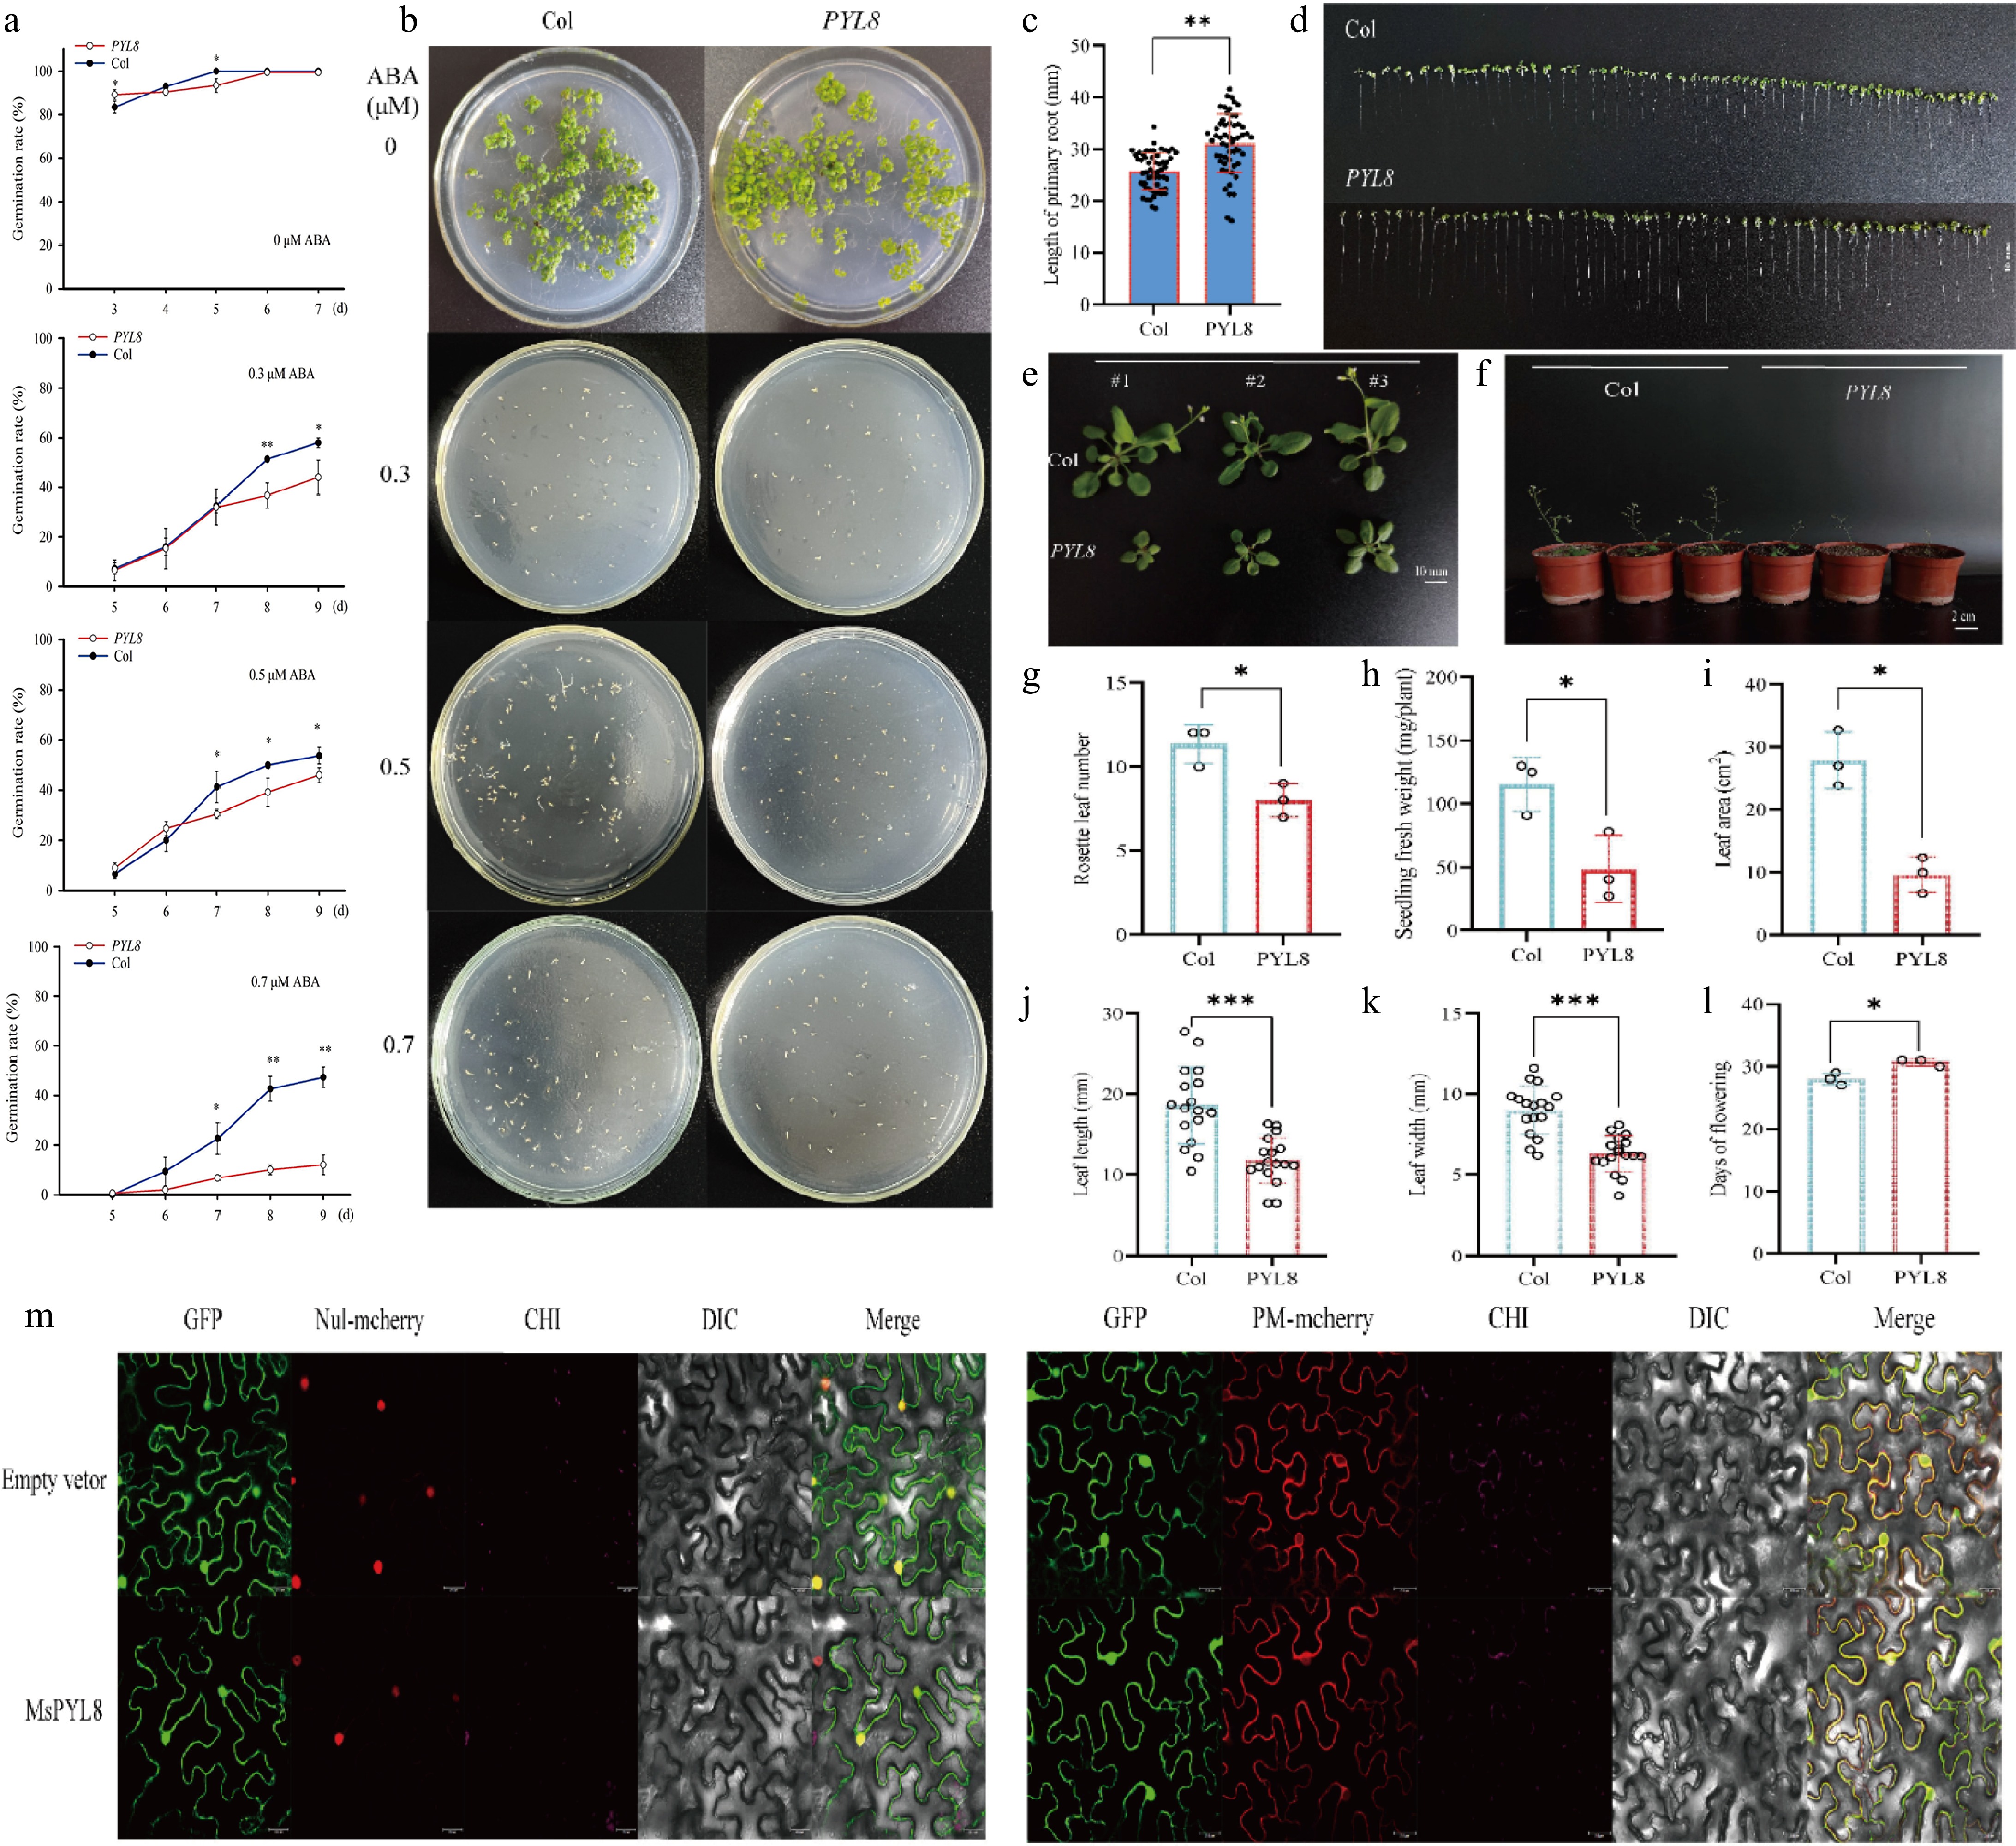
Figure 6.
PYL8 functional validation and PYL8 subcellular localization. (a) Germination rate measurement. Seeds of Col and PYL8 strains were seeded on Murashige and Skoog (MS) medium containing different concentrations of ABA. Germination was defined as the emergence of embryo growth, with germination rates recorded daily until day 7 (for controls without ABA), or day 9 (for treatments with 0.3, 0.5, and 0.7 μM ABA). Data are means ± SD (n = 3), Student's t-test (* p < 0.05) (** p < 0.01). (b) Seed germination of PYL8 strain was inhibited by different concentrations of ABA. Col seeds were cultured on MS medium without ABA (control) for 7 d, and PYL8 seeds were cultured on MS medium containing different concentrations of ABA (0.3, 0.5, and 0.7 μM ABA) for 12 d. (c) Seven-day root length statistics of Col and PYL8 strains. Values are means ± SD (n = 56), Student's t-test (** p < 0.01). (d) Seven-day root length of Col and PYL8 strains. Scale bar represents 10 mm. (e) Phenotypic analysis of 28-d Col, PYL8 strains. Col, PYL8 transgenic plants that sprouted and grew on MS medium at 7 d of age were transferred to nutrient soil and continued to grow for 21 d. Scale bar = 10 mm. (f) Flowering phenotypes of 35-d Col, PYL8 strains. (g) Statistical analysis of Arabidopsis rosette leaves. Data are means ± SD (n = 3), Student's t-test (* p < 0.05). (h) Statistical analysis of fresh weight of plant above-ground parts. Data are means ± SD (n = 3), Student's t-test (* p < 0.05). (i) Statistical analysis of total plant leaf area. Data are presented as mean ± SD (n = 3), Student's t-test (* p < 0.05). (j) Statistical analysis of plant leaf length. Data are presented as mean ± SD (n = 17), Student's t-test (*** p < 0.001). (k) Statistical analysis of plant leaf width. Data are presented as mean ± SD (n = 17), Student's t-test (*** p < 0.001). (l) Statistical analysis of plant flowering time. Data are presented as mean ± SD (n = 3), Student's t-test (* p < 0.05). (m) Subcellular localization of MsPYL8 protein in N. benthamiana leaves. Scale bars = 25 μm.
-
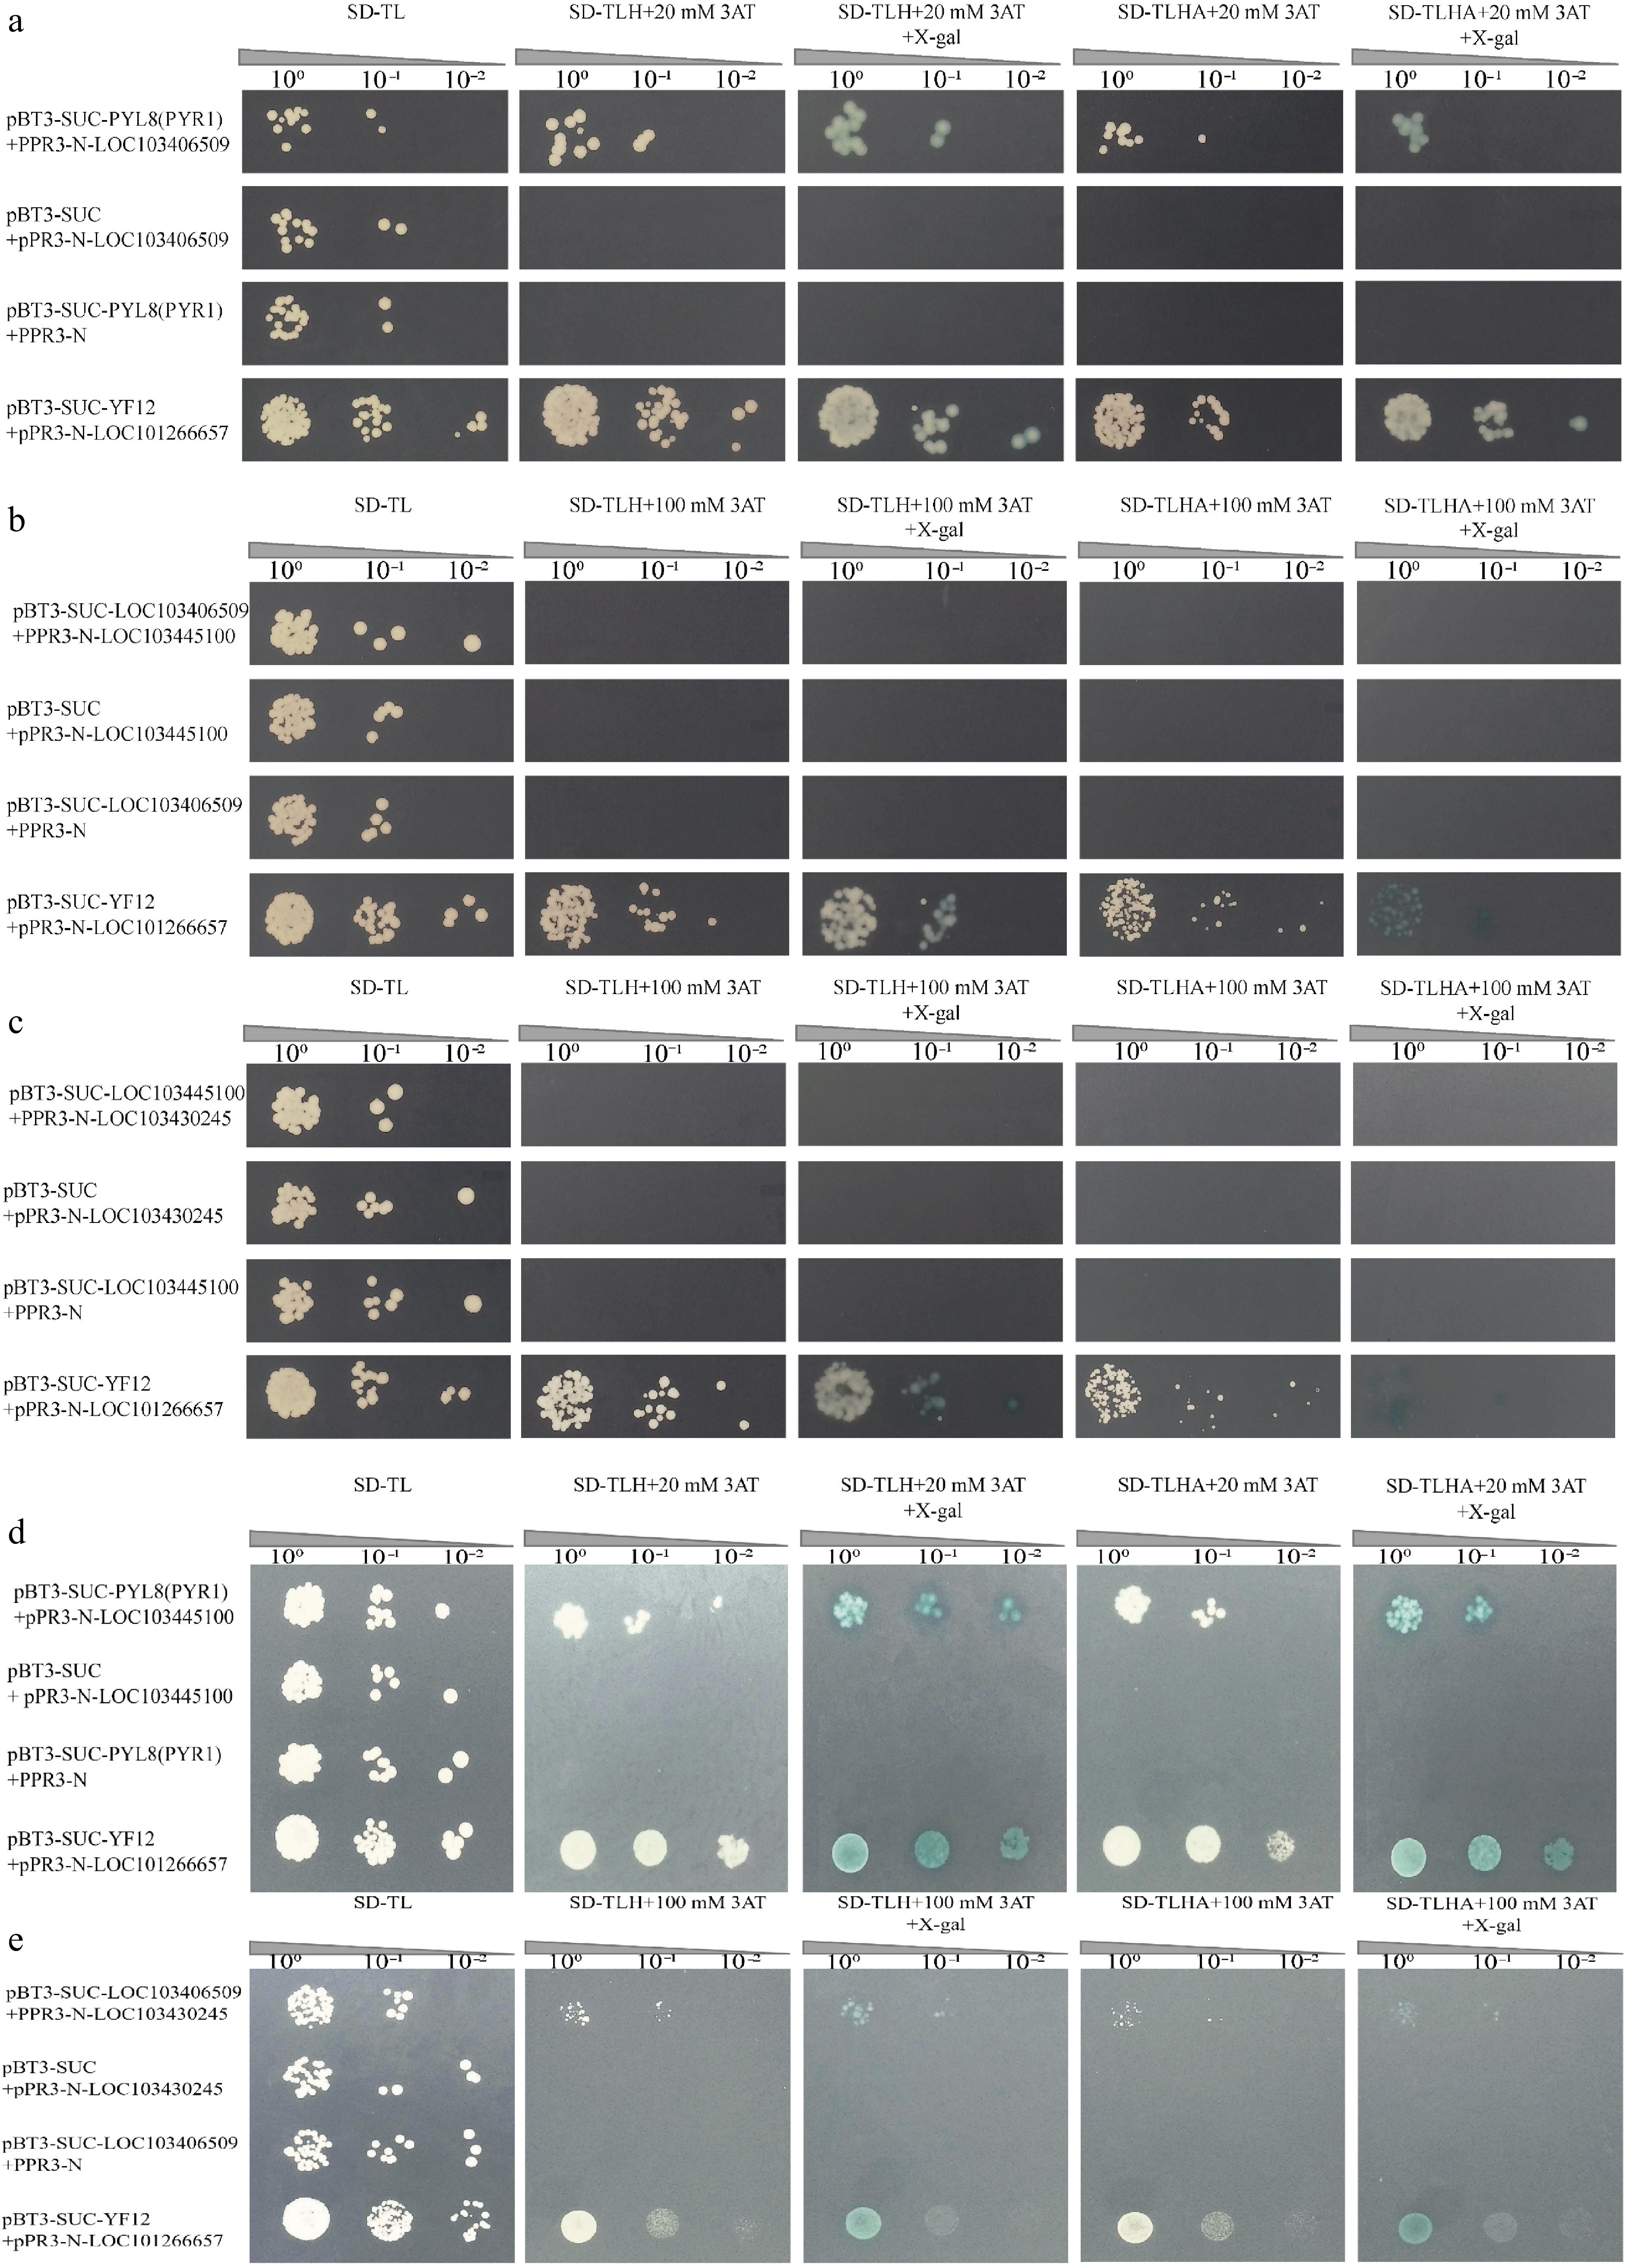
Figure 7.
Point-to-point through Y2H assay of MsPYL8 interactions proteins. (a) Positive plasmids were tested with the Y2H assay for point-to-point validation of MsPYL8-MsLTI. pBT3-SUC-PYL8(PYR1) + pPR3-N and pBT3-SUC-LOC103406509 + pPR3-N were the negative controls. (b) Point-to-point validation of the positive plasmid with MsLTI-MsLEA. pBT3-SUC-LOC103406509 + pPR3-N and pBT3-SUC-LOC103445100 + pPR3-N were as negative controls. (c) Point-to-point validation of positive plasmids with MsLEA-MsABI5. (d) Positive plasmids were tested with the Y2H assay for point-to-point validation of MsPYL8-MsLEA. pBT3-SUC-PYL8(PYR1) + pPR3-N and pBT3-SUC-LOC103445100 + pPR3-N were the negative controls. (e) Point-to-point validation of positive plasmids with MsLTI-MsABI5. pBT3-SUC + pPR3-N-LOC103406509, pBT3-SUC + pPR3-N-LOC103430245 were used as negative controls. Spotting dilution gradient was 100, 10−1, 10−2 from left to right. SD-TL is a SD/-Trp-Leu-deficient plate, SD-TLHA is a SD/-Trp-Leu-His-Ade-deficient plate, where X-gal was added to produce a blue colour.
-
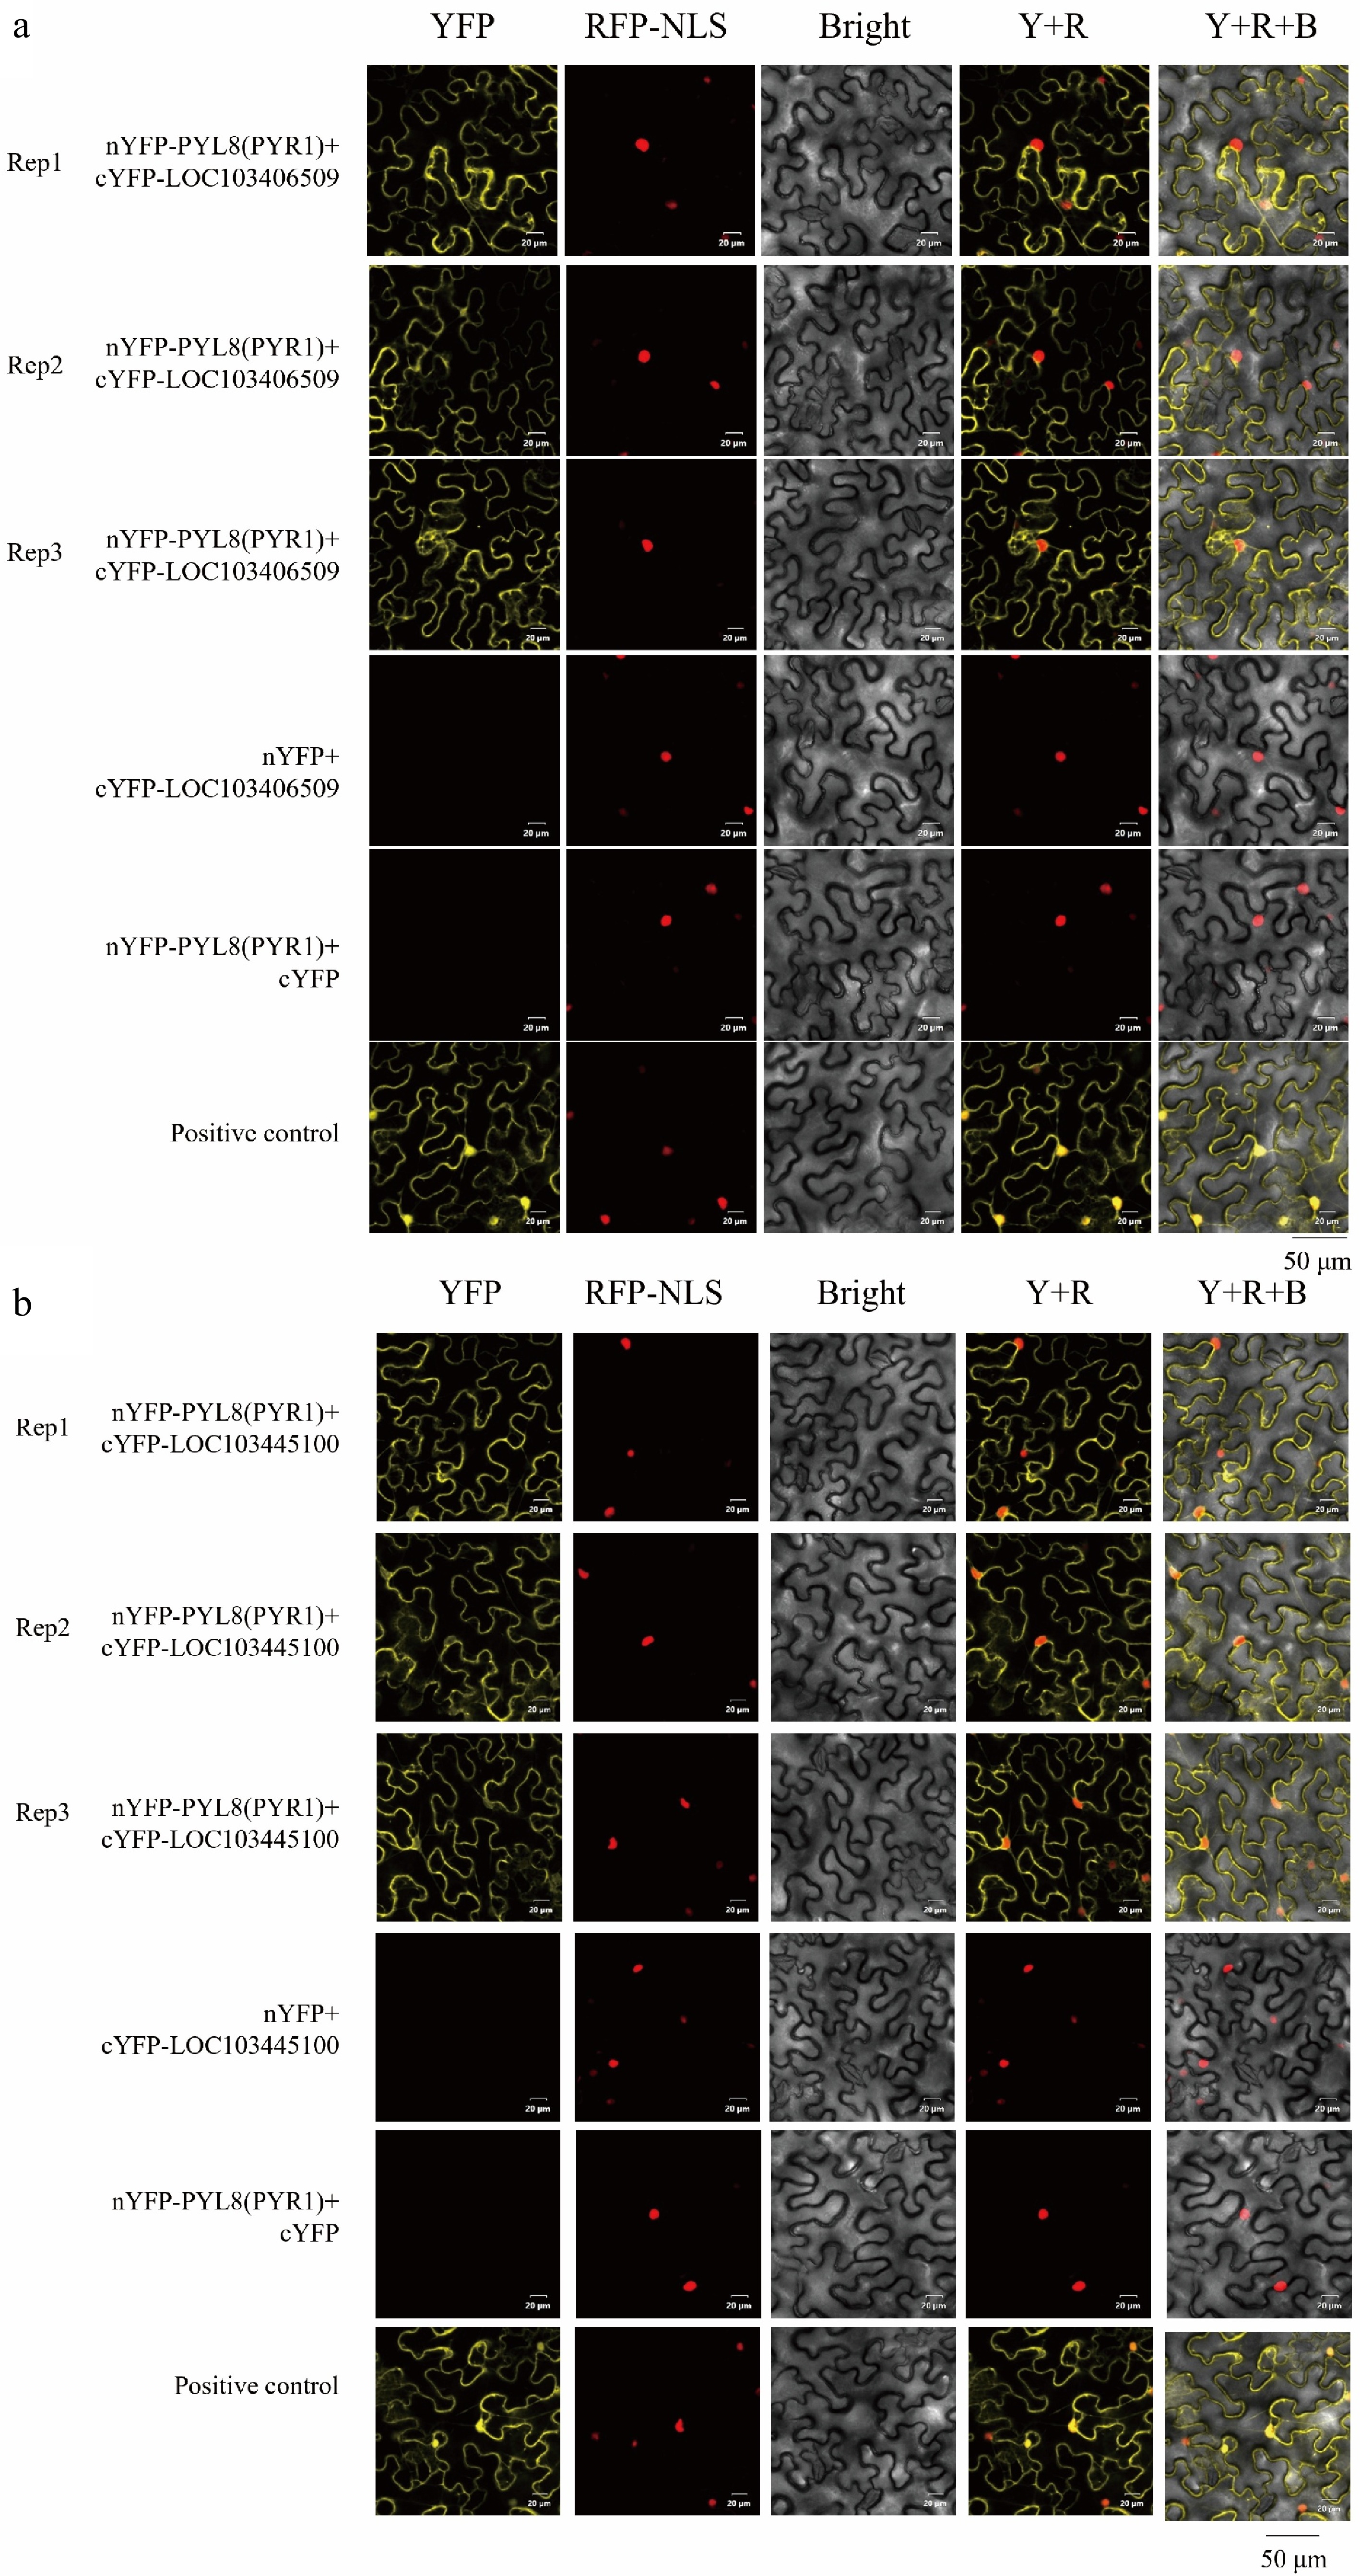
Figure 8.
BiFC assay of MsPYL8 interactions proteins. (a) BiFC assay demonstrating the interactions of MsPYL8 with MsLTI at the nucleus and in the cytoplasm in tobacco leaves. (b) BiFC assay demonstrating the interactions of MsPYL8 with MsLEA at the cytoplasm in tobacco leaves. Scale bar = 20 μm.
-
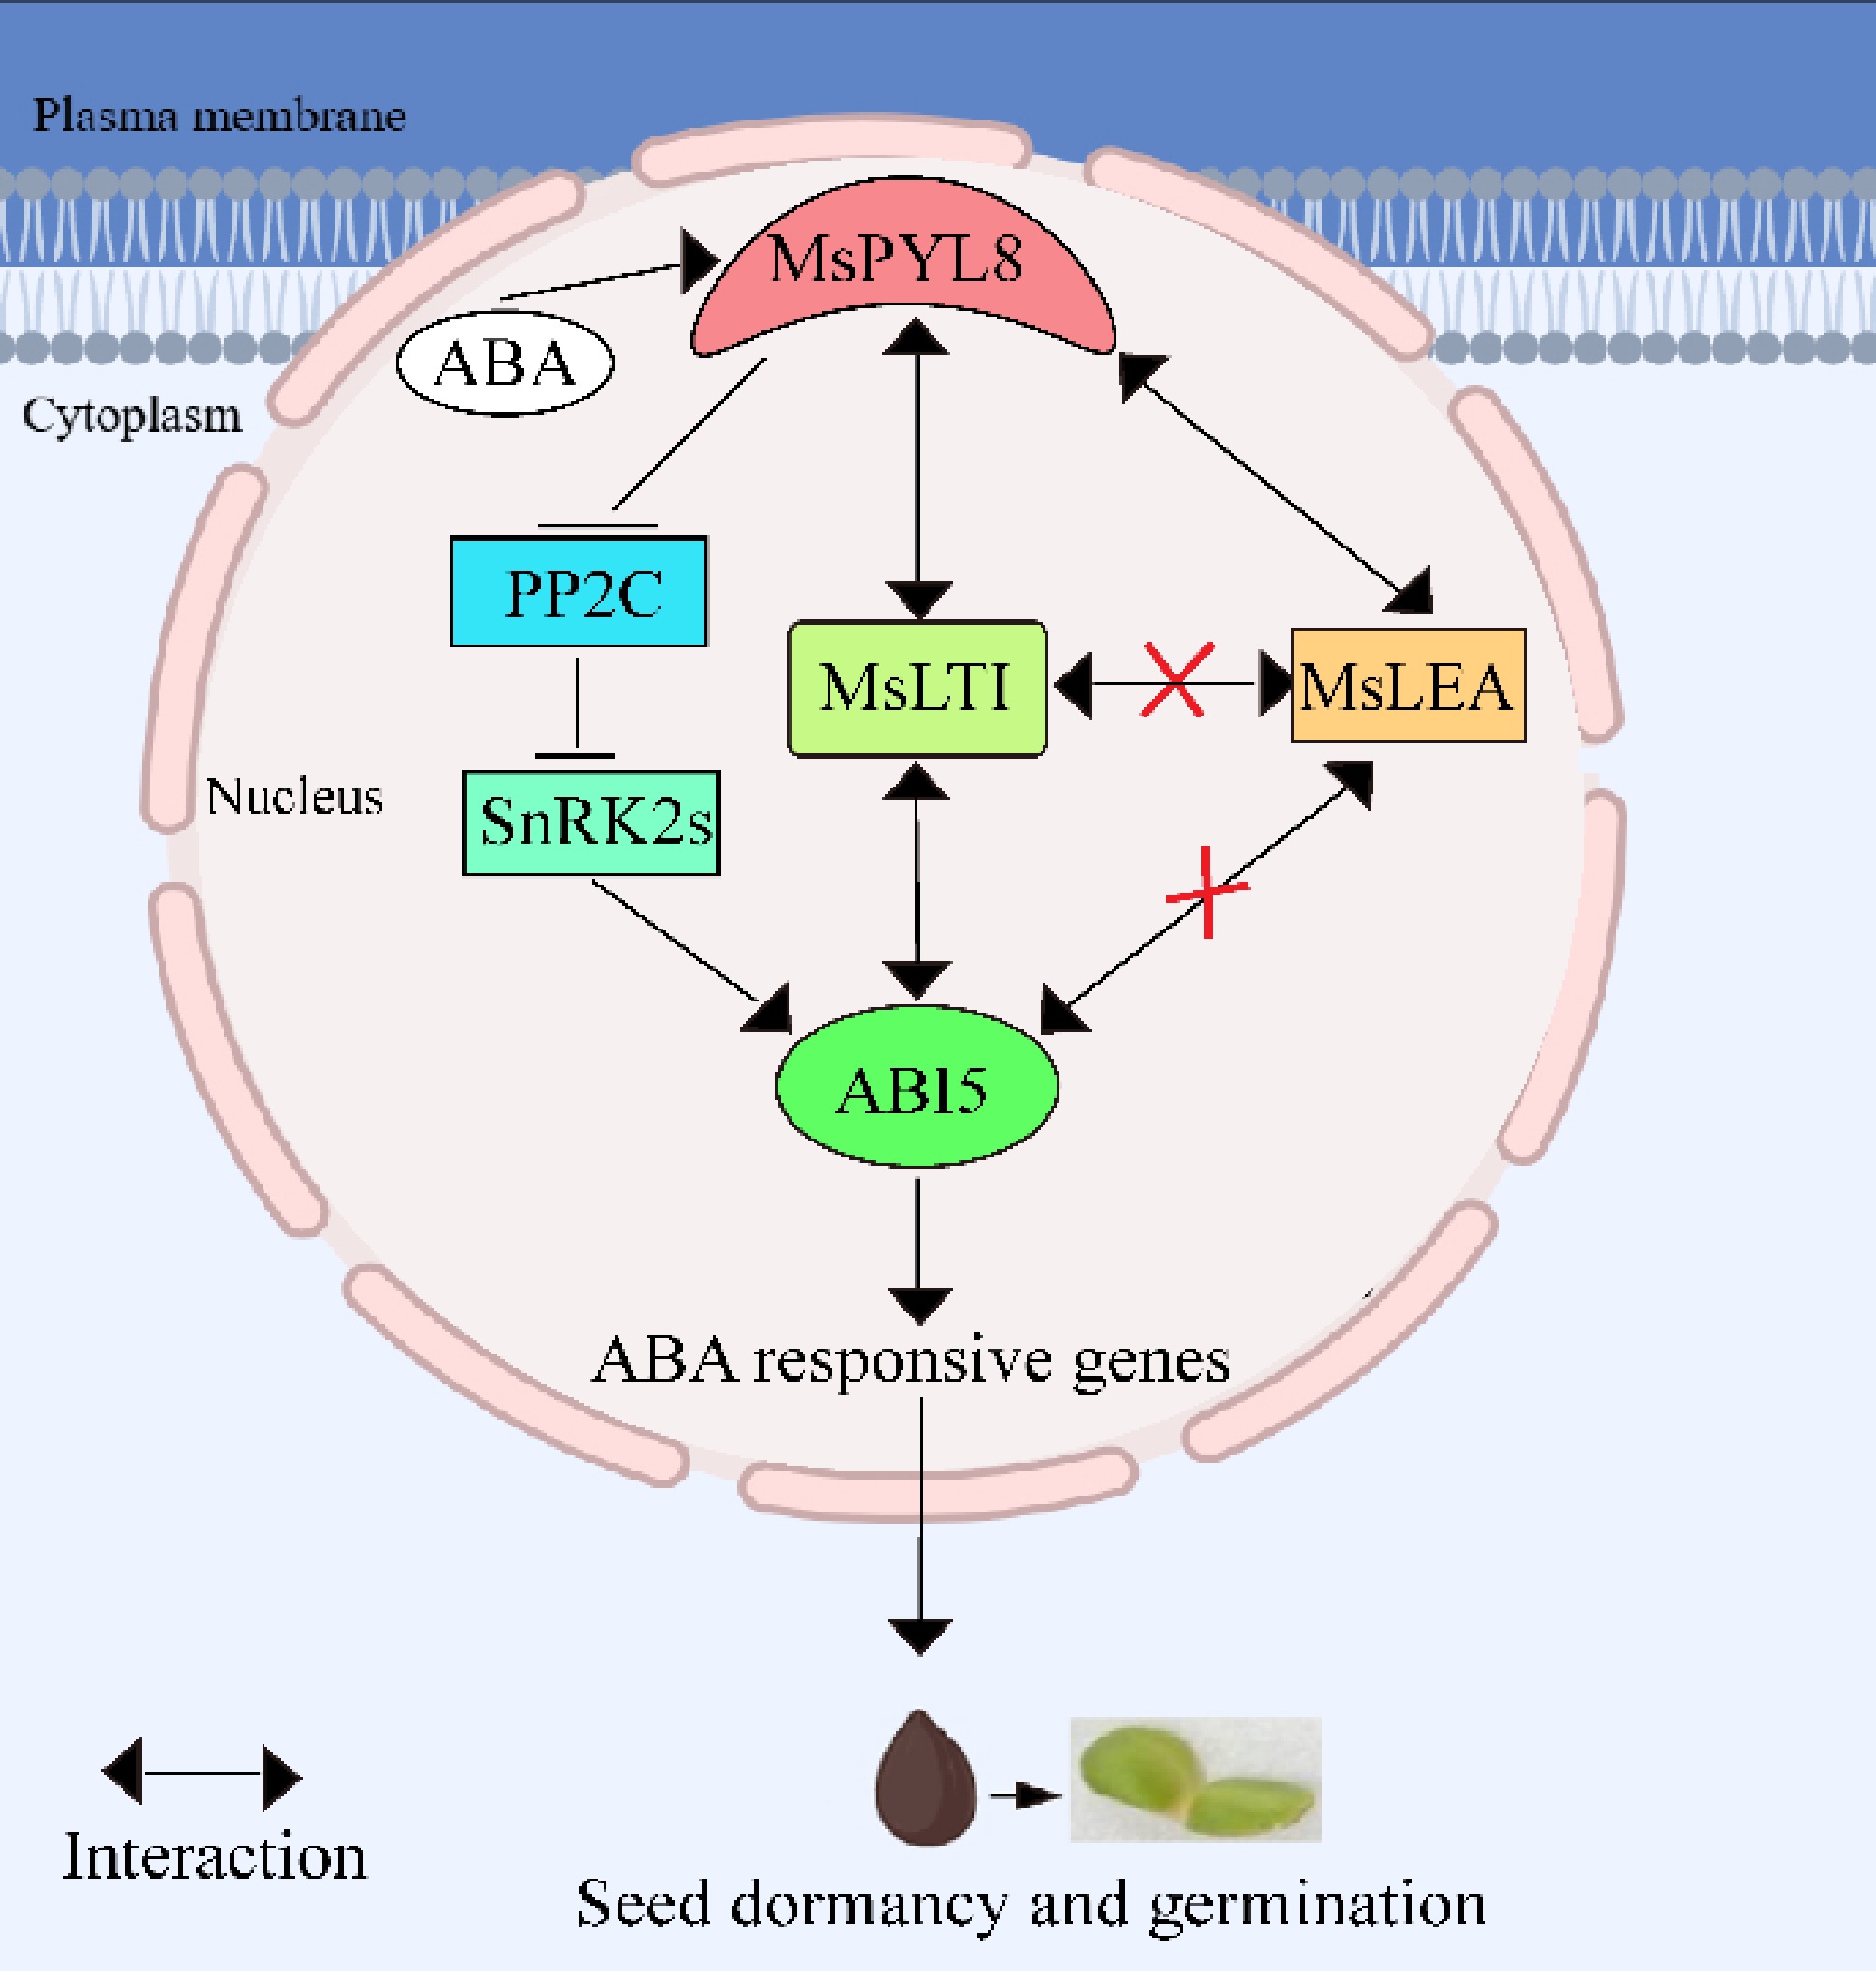
Figure 9.
The working model describes the ABA receptor MsPYL8 interaction with MsLTI and MsLEA, MsLTI interacts with MsABI5, and the inhibition of MsPYL8 expression under low-temperature sand stratification to coordinate seed dormancy and germination. MsPYL8 binds to ABA and inhibits the dephosphorylation activity of PP2C, which activates SnRK2s to transmit signals to ABI5, thereby activating the expression of ABA-responsive genes to regulate ABA signal transduction. Arrows, positive regulation; bars, negative regulation.
-
Gene name Genome ID Protein (aa) MW (Da) pI Instability index Aliphatic index GRAVY Sucellular localization MsPYL1 Msi_01g007840 184 20,798.62 6.45 51.47 90.98 −0.421 Nucleus MsPYL2 Msi_01g019270 198 21,804.57 5.97 48.86 94.39 −0.363 Nucleus MsPYL3 Msi_02g005520 168 18,791.41 4.76 24.23 81.19 −0.245 Cytoplasm MsPYL4 Msi_02g005570 116 12,843.54 5.15 24.1 70.52 −0.459 Cytoplasm MsPYL5 Msi_02g005590 160 17,906.48 6.72 38.6 82.81 −0.256 Chloroplast MsPYL6 Msi_04g014910 250 26,913.81 6.37 47.15 75.2 −0.383 Chloroplast MsPYL7 Msi_05g028700 185 20,125.74 5.68 49 84.22 −0.223 Nucleus MsPYL8 Msi_06g003270 206 22,911.59 5.26 42.23 76.55 −0.433 Nucleus MsPYL9 Msi_08g003790 201 22,120.78 5.02 42.73 80.9 −0.345 Nucleus MsPYL10 Msi_08g010820 419 47,701.29 6.43 30.5 78.57 −0.342 Nucleus MsPYL11 Msi_08g010830 194 21,812.06 4.92 30.59 86.86 −0.166 Nucleus MsPYL12 Msi_08g010850 166 18,336.71 4.62 43.25 74.7 −0.337 Nucleus MsPYL13 Msi_15g006040 202 22,038.77 5.2 33.84 82.43 −0.309 Nucleus MsPYL14 Msi_15g009000 294 33,320.02 9.79 71.72 74.69 −0.686 Nucleus Table 1.
Sequence characteristics of 14 MsPYLs in Malus sieversii.
-
Motif Width Motif sequences 1 41 PANTSTERLELJDDEKHILSYSIIGGNHRLNNYRSTTTVVP 2 23 VWPLVRDFDNPHKYKPFLKSCHV 3 41 GTVVIESYVVDIPEGNTKEDTCLFVDTVJQLNLKSLAAVAE 4 29 YIDRYHKHEPSPNQCTSLLVQKIEAPVHL 5 15 GGVGSIREVAVVSGL 6 21 ZKQLKWEGKASAELKGTAAEQ 7 11 DPKSDQNQDQE 8 15 DFFGFHKWFPTLAPC 9 19 MDAGHAPPYGLTLAEFSEL 10 11 FVNCDGEEGDN 11 10 HGNTGGGHDQ 12 11 RLAVQDRTEPI 13 6 MEQHWD 14 14 CVIEWFIEVEPVEG 15 13 GVPSQPCVIRYCA 16 6 GCRIEW 17 7 MPLIPVN 18 6 QDQNQK 19 12 PGCIRQCPFFKI 20 6 HPTNQN Table 2.
The sequences of MsPYL genes identified by the MEME.
-
No. Gene ID Annotation 1 LOC103438579 Cysteine proteinase inhibitor 6-like isoform X2 3 LOC103430899 60S ribosomal protein L21-1 4 LOC103449145 Stress-related protein-like 8 LOC103453156 40S ribosomal protein s3a-2-like 14 LOC103427451 60S ribosomal protein L22-2-like 17 LOC103409643 60S ribosomal protein l7a-1-like 23 LOC114819509 Outer envelope pore protein 16, chloroplastic-like isoform X1 24 LOC103435311 Protein SUPPRESSOR OF FRI 4-like 25 LOC103445100 Late embryogenesis abundant protein 40 LOC126599572 60S acidic ribosomal protein P2-1-like 41 LOC103419916 40S ribosomal protein S4-3 42 LOC103443916 Probable F-actin-capping protein subunit beta 44 LOC114822900 Phytochrome-interacting ankyrin-repeat protein 2-like isoform X1 45 LOC103448729 Transcription elongation factor 1 homolog 48 LOC103450718 60S ribosomal protein L36-3-like 49 LOC103418974 40S ribosomal protein S8 51 LOC103438259 Uncharacterized protein LOC103438259 55 LOC103446105 Obg-like atpase 1 56 LOC103444213 Embryonic protein DC-8-like isoform X1 57 LOC103433780 Uncharacterized protein LOC103433780 69 LOC103432335 60S ribosomal protein L14-1-like 74 LOC103452893 Late embryogenesis abundant protein 41 75 LOC103406509 Low-temperature-induced 65 kDa
protein-like77 LOC103450479 7-methyl-GTP pyrophosphatase 80 LOC126608056 T-complex protein 1 subunit epsilon-like 85 LOC103423984 Translationally-controlled tumor protein homolog 88 LOC126591089 Protein SENESCENCE-ASSOCIATED GENE 21, mitochondrial-like 89 LOC103445970 40S ribosomal protein S4 91 LOC103453729 Uncharacterized LOC103453729 92 LOC103433881 Probable protein disulfide-isomerase A6 Table 3.
The annotation of the proteins interacting with MsPYL8 by Y2H-seq assay.
Figures
(9)
Tables
(3)