-
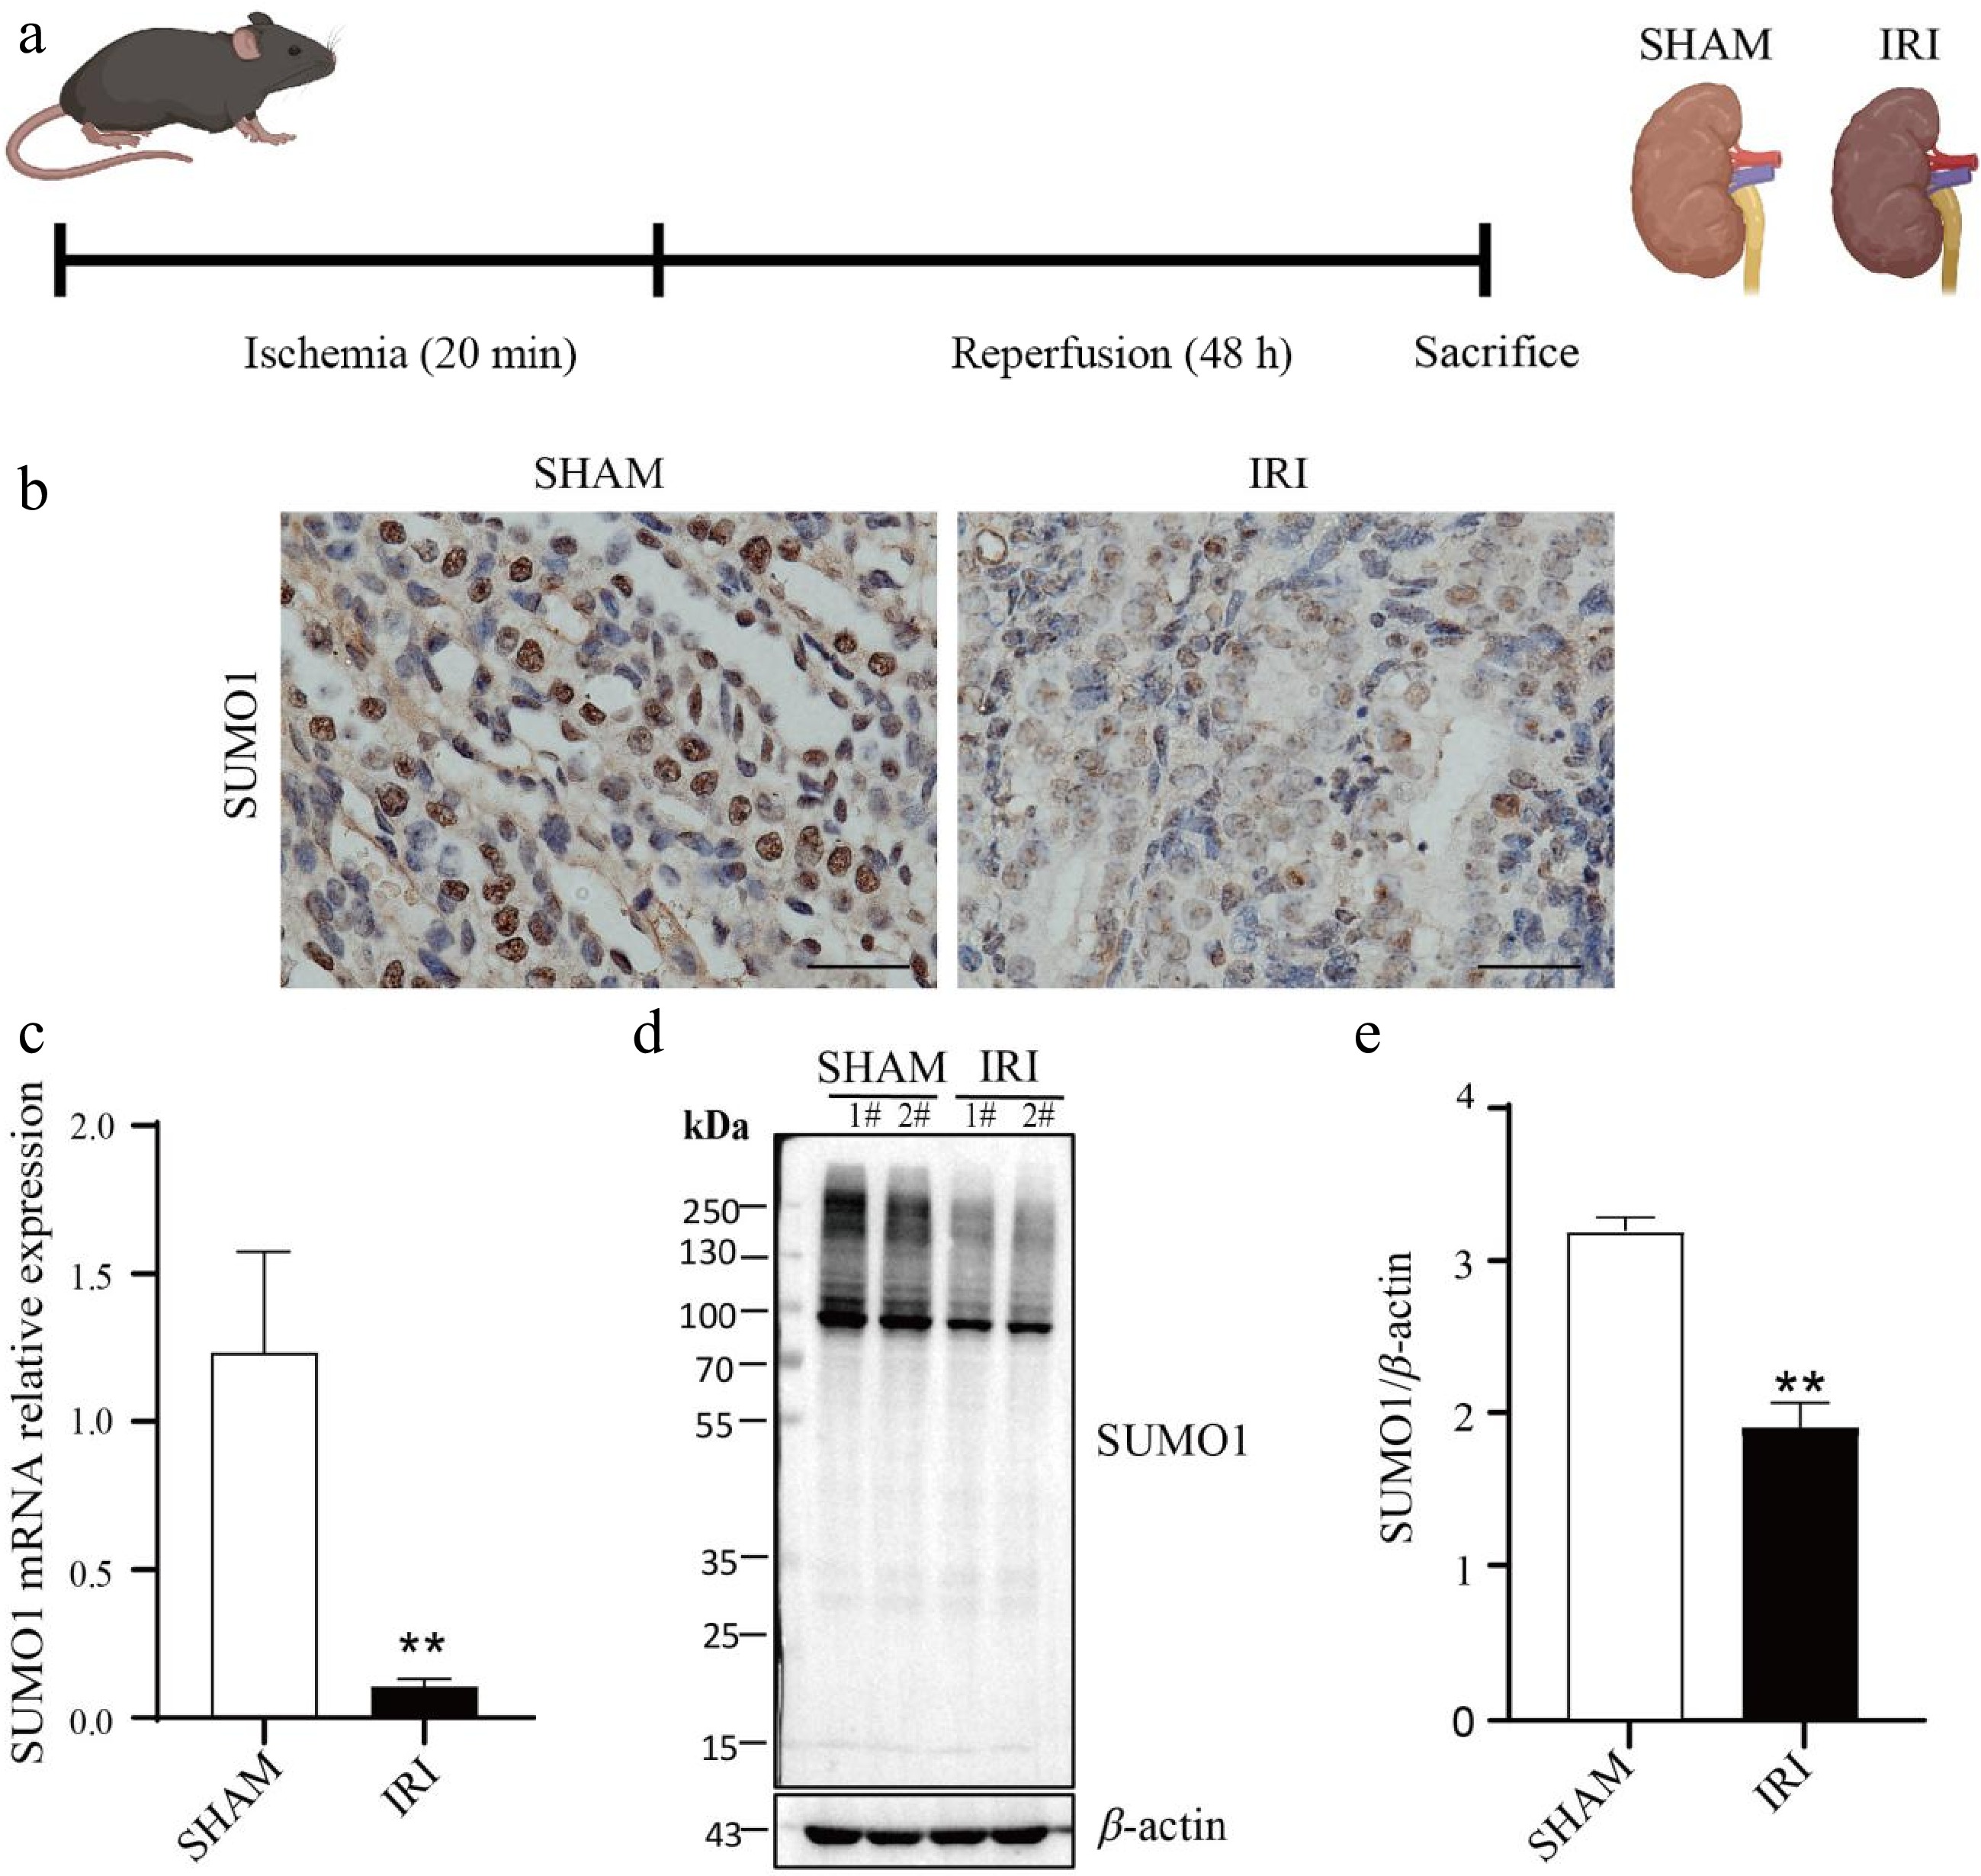
Figure 1.
Downregulation of SUMO1 expression in a renal IRI model. (a) Schema for the animal experiment. (b) IHC staining showing the expression and distribution of SUMO1. Bar = 25 μm. (c) Real-time PCR was used to detect the expression of SUMO1 in the kidney tissue of mice, with N = 6. (d), (e) Western blotting was used to detect the expression of SUMO1 in the kidney tissue of mice, with N = 4. Data are presented as the means ± SEM. Statistical significance compared to the control group is indicated by **, where p < 0.01.
-
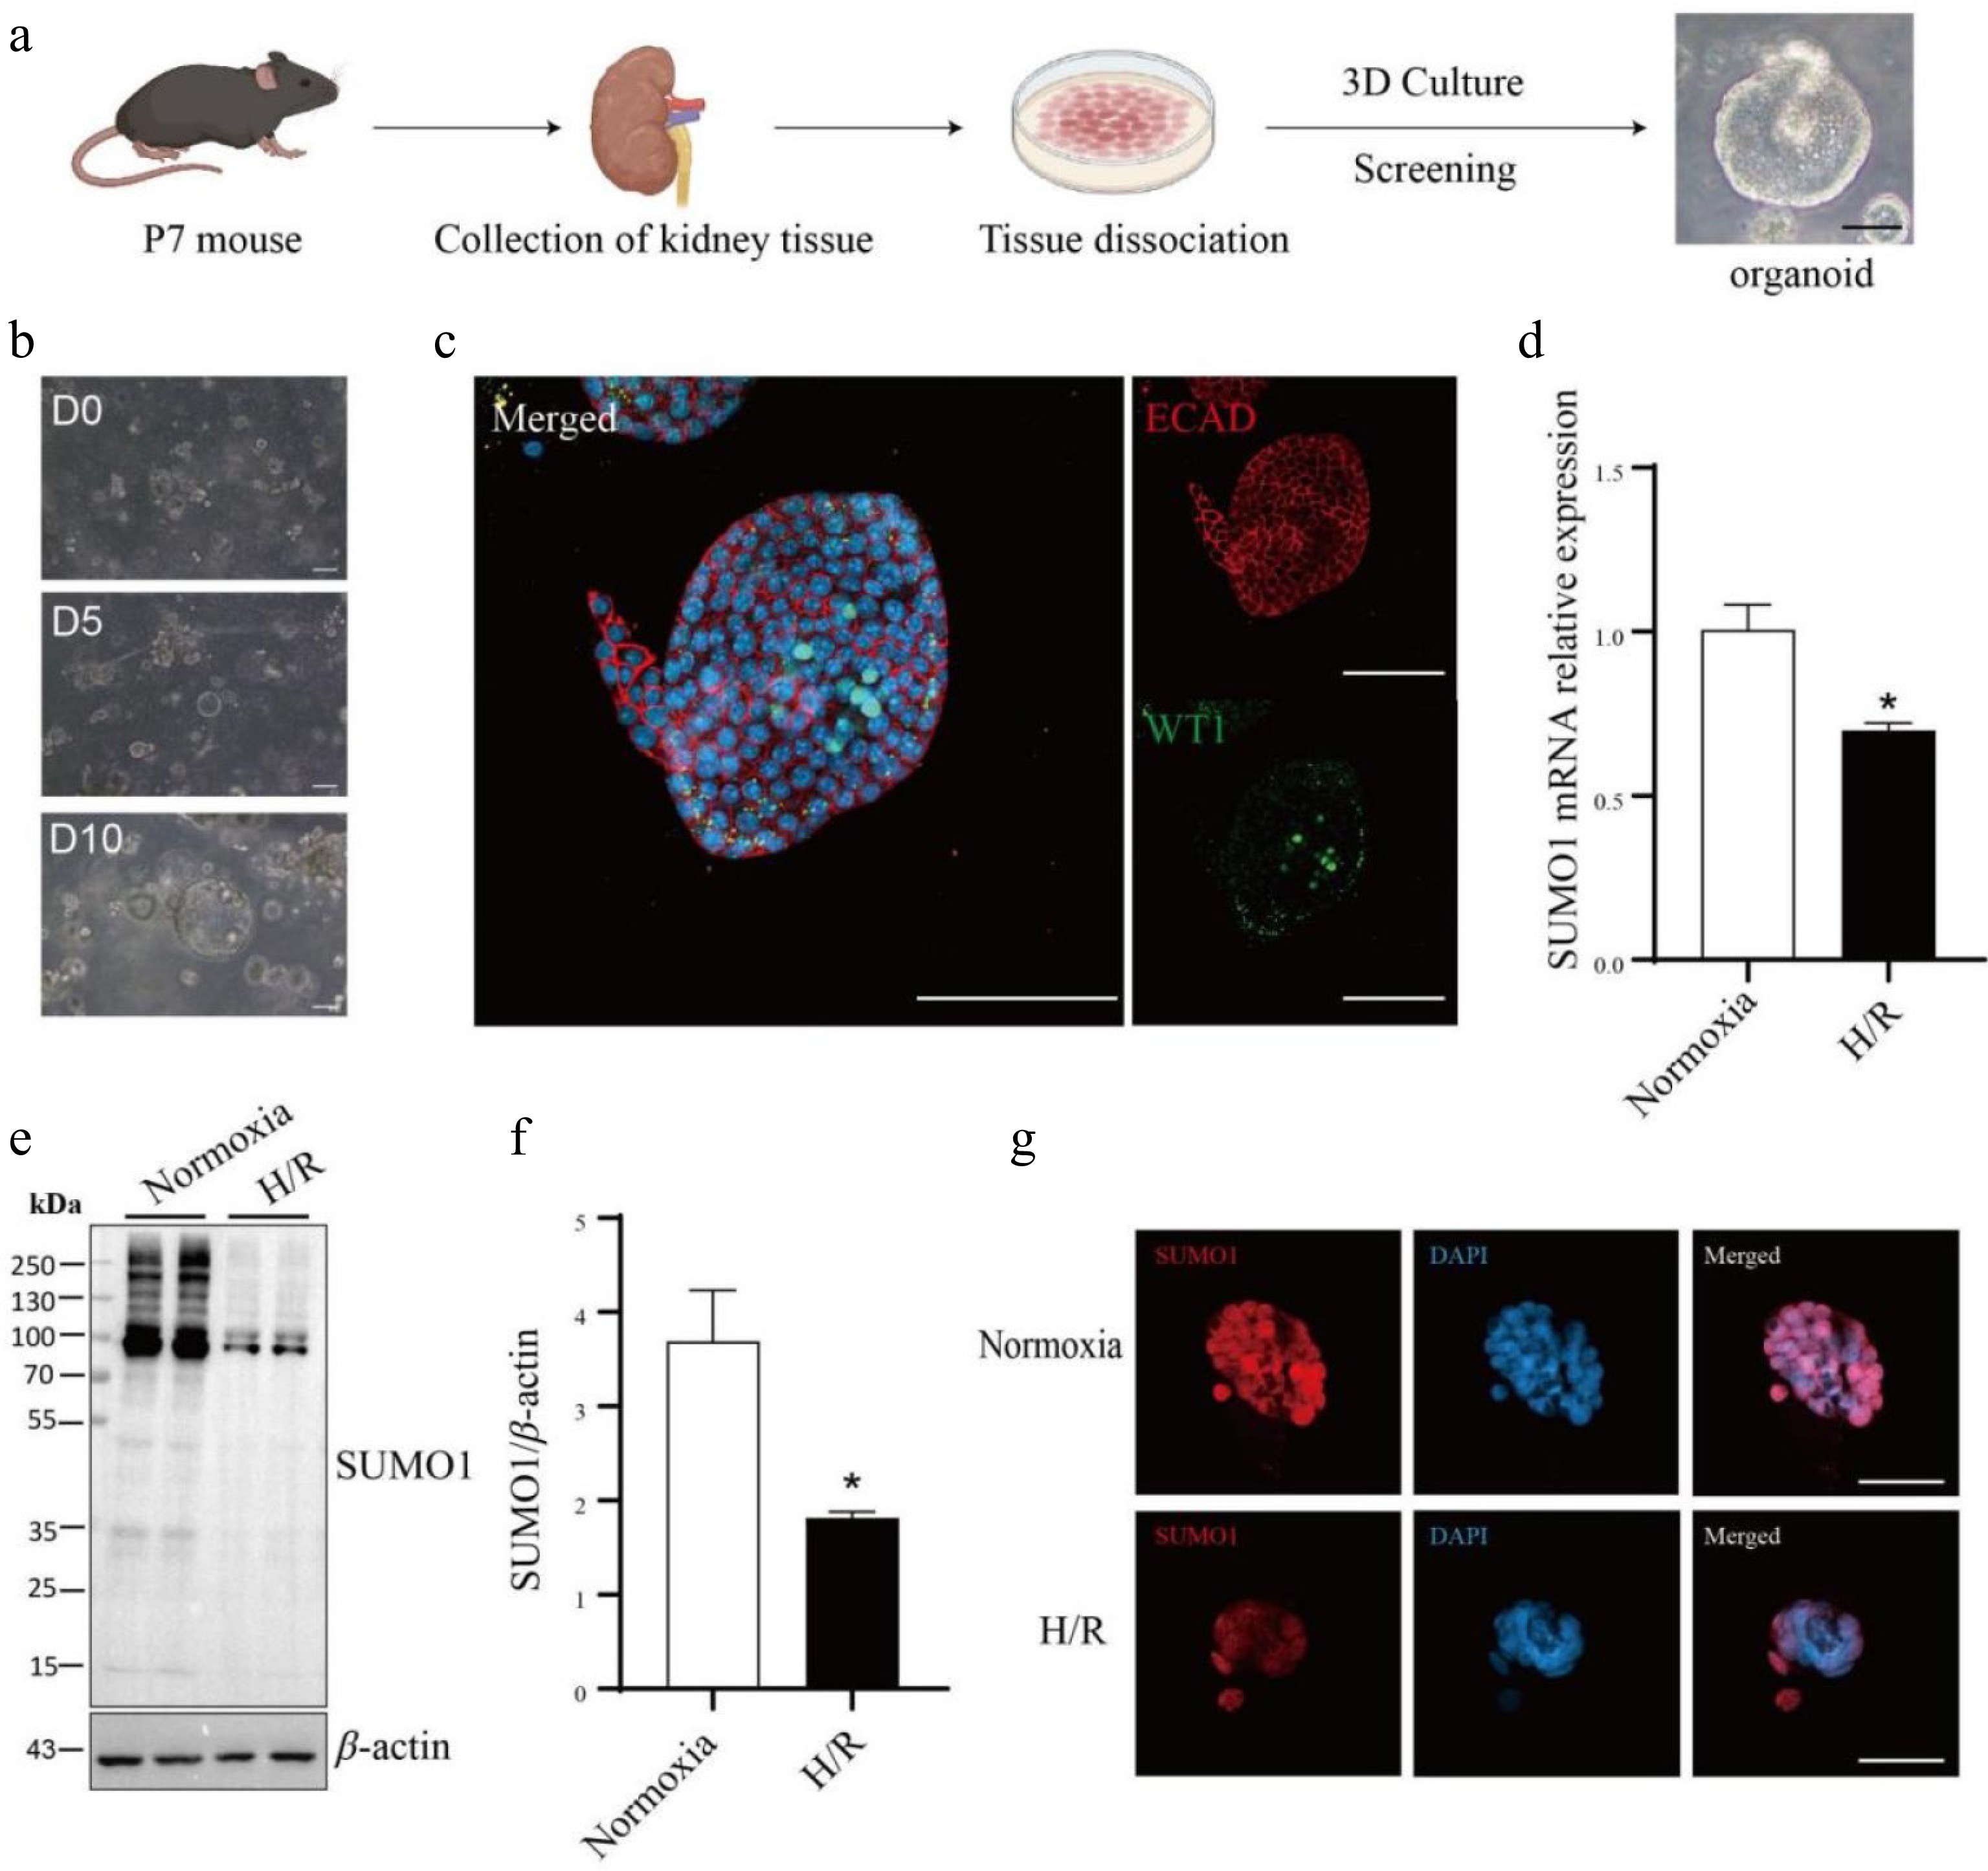
Figure 2.
The SUMO1 levels in the kidney organoids are decreased by hypoxia/reoxygenation model. (a) Schematic representation of the culture of primary kidney organoids in mice. Bar = 50 μm. (b) Time-course images of the developed organoids. Bar = 100 μm. (c) Immunofluorescence staining of the kidney organoids for podocytes marker WT1 and E-cadherin (distal tubule). Bar = 100 µm. (d) Expressions of SUMO1 in organoids subjected to normoxia group or H/R group were measured by real-time PCR. N = 3. (e), (f) Expressions of SUMO1 in organoids subjected to normoxia group or H/R group were measured by western blotting. N = 4. (g) Representative microphotographs of SUMO1-positive cells in normoxia and H/R groups. Bar = 50 µm. The data were presented as the mean ± SEM, and statistical significance relative to the control group was indicated by * p < 0.05.
-
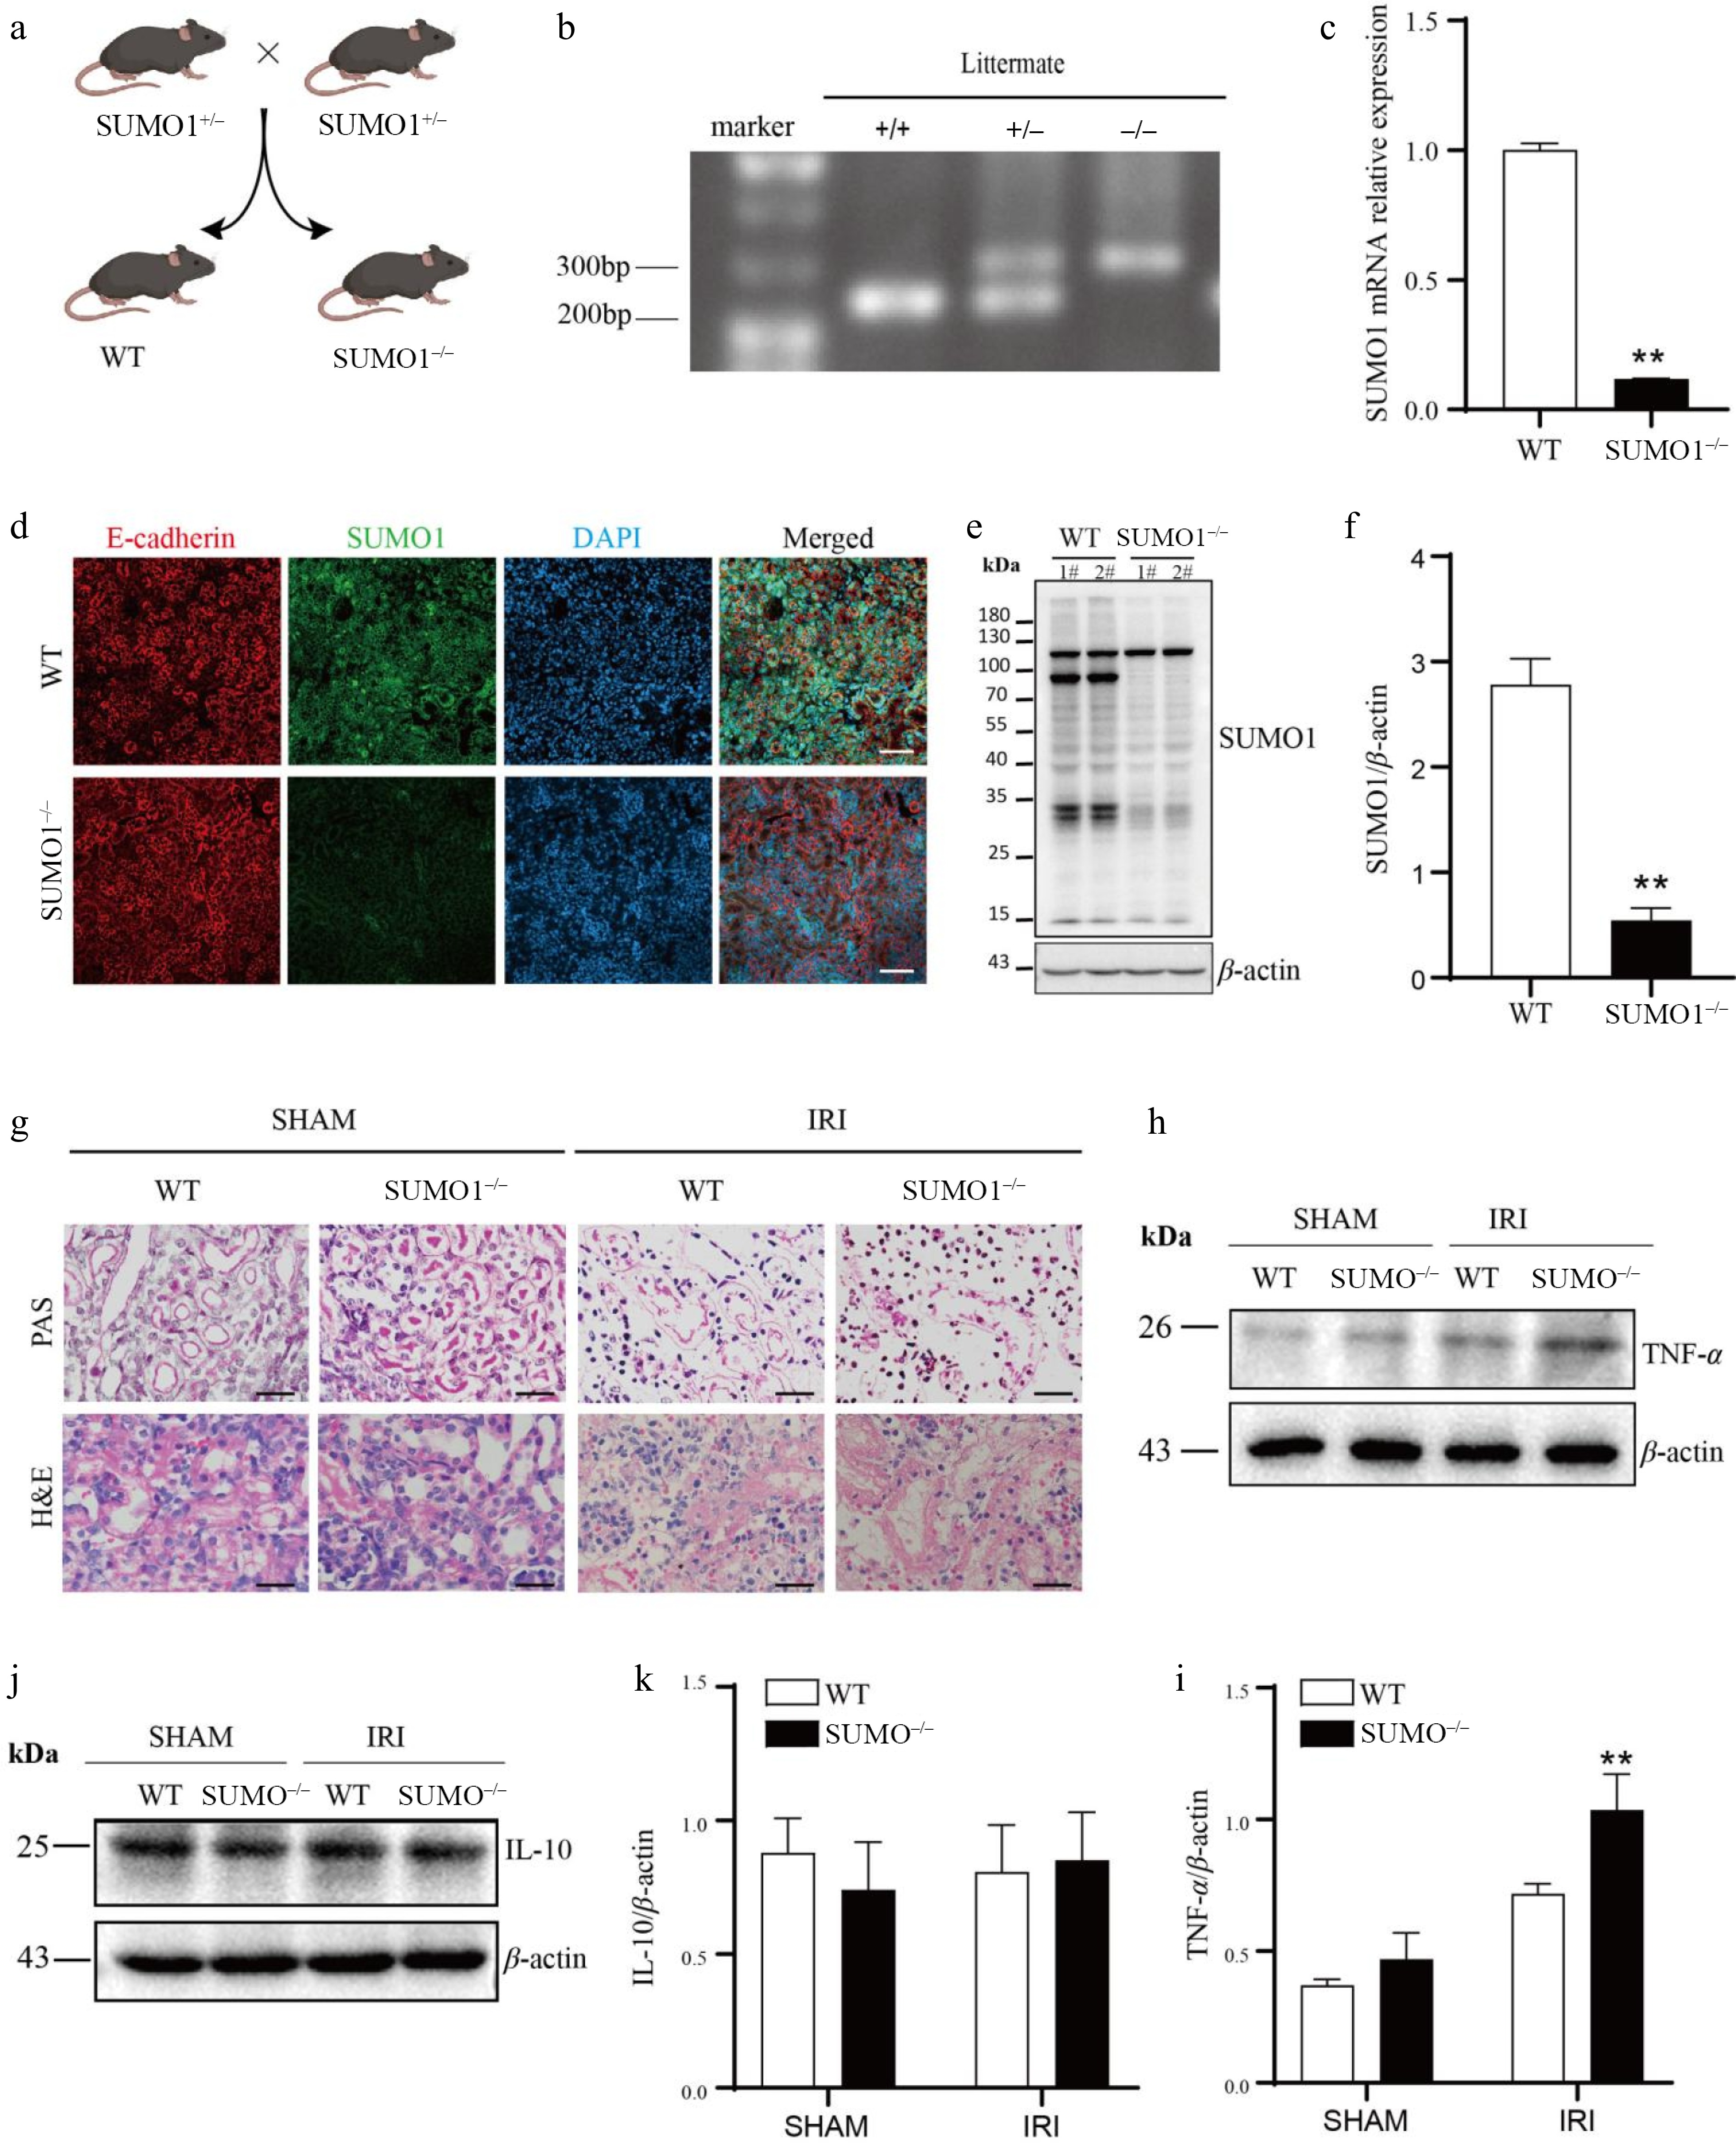
Figure 3.
Knocking out SUMO1 worsened IRI-induced AKI. (a) Schematic outline for generating SUMO1 knockout mice. (b) Representative plot of genotyping results. (c) Levels of SUMO1 in kidney were detected by real-time PCR. N = 6. (d) Immunofluorescence analysis of the SUMO1 expression in kidney tissues. Bar = 50 μm. (e), (f) Gray value of SUMO1 signals, normalized to β-actin, to compare the WT and KO group. N = 4. (g) Representative PAS and H&E staining of mouse kidney tissue. Bar = 25 µm. (h), (i) The protein levels of TNF-α in the kidney tissue, with N = 3. (j), (k) The protein levels of IL-10 in the kidney tissue, with N = 3. Data were presented as the means ± SEM. * p < 0.05, ** p < 0.01 when compared to isogenic mice that underwent a sham procedure.
-
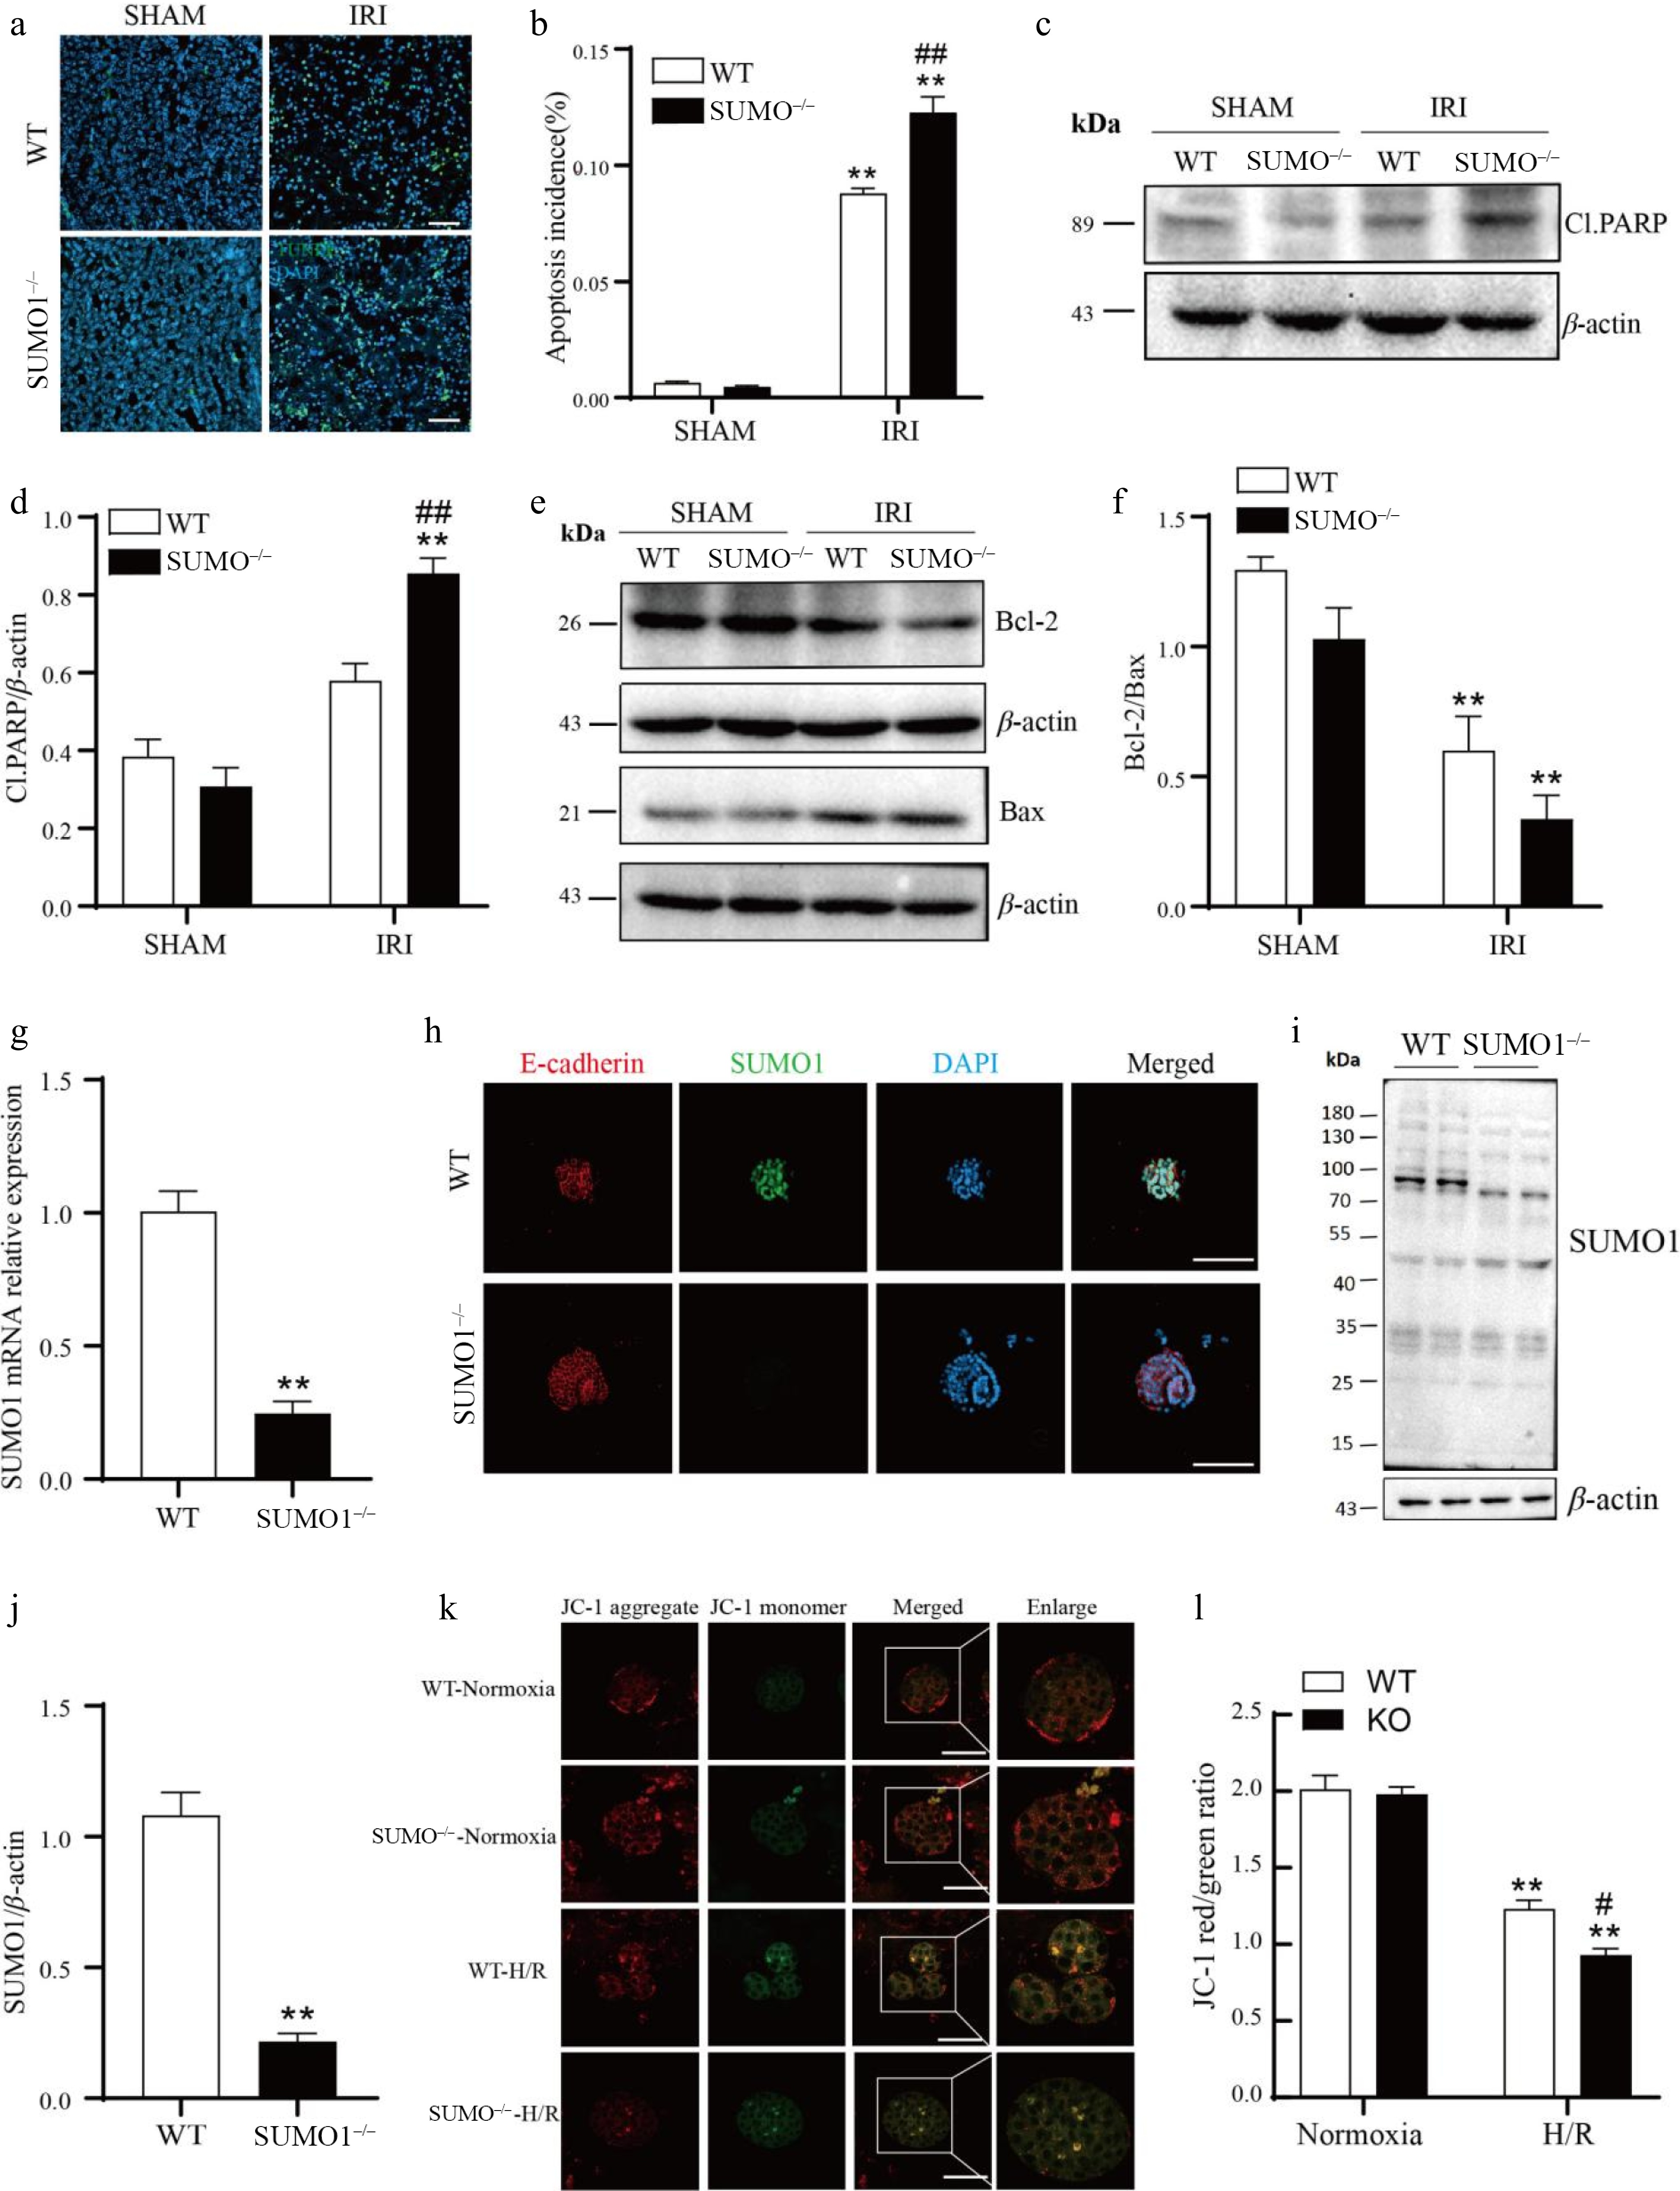
Figure 4.
Knockout of SUMO1 increases IRI-induced apoptosis. (a), (b) The TUNEL fluorescence assay was employed to detect apoptosis. Bar = 50 μm. N = 4. Quantitative analysis of positive TUNEL staining was shown. (c) - (f) WB was performed to analyze the levels of Cl.PARP, Bcl-2, and Bax. N = 3. (g) SUMO1 in organoids were detected by real-time PCR. N = 3. (h) Immunofluorescence analysis of the expression of SUMO1 in organoids. Bar = 100 μm. (i), (j) Densitometry of SUMO1 signals to compare WT and KO group. N = 4. (k), (l) The mitochondrial potential was observed via JC-1 staining. N = 3. Bar = 50 μm. The data were presented as the mean ± SEM. * p < 0.05, ** p < 0.01 compared to isogenic mice that underwent the sham procedure; ## p < 0.01 compared to WT mice with renal IRI.
-
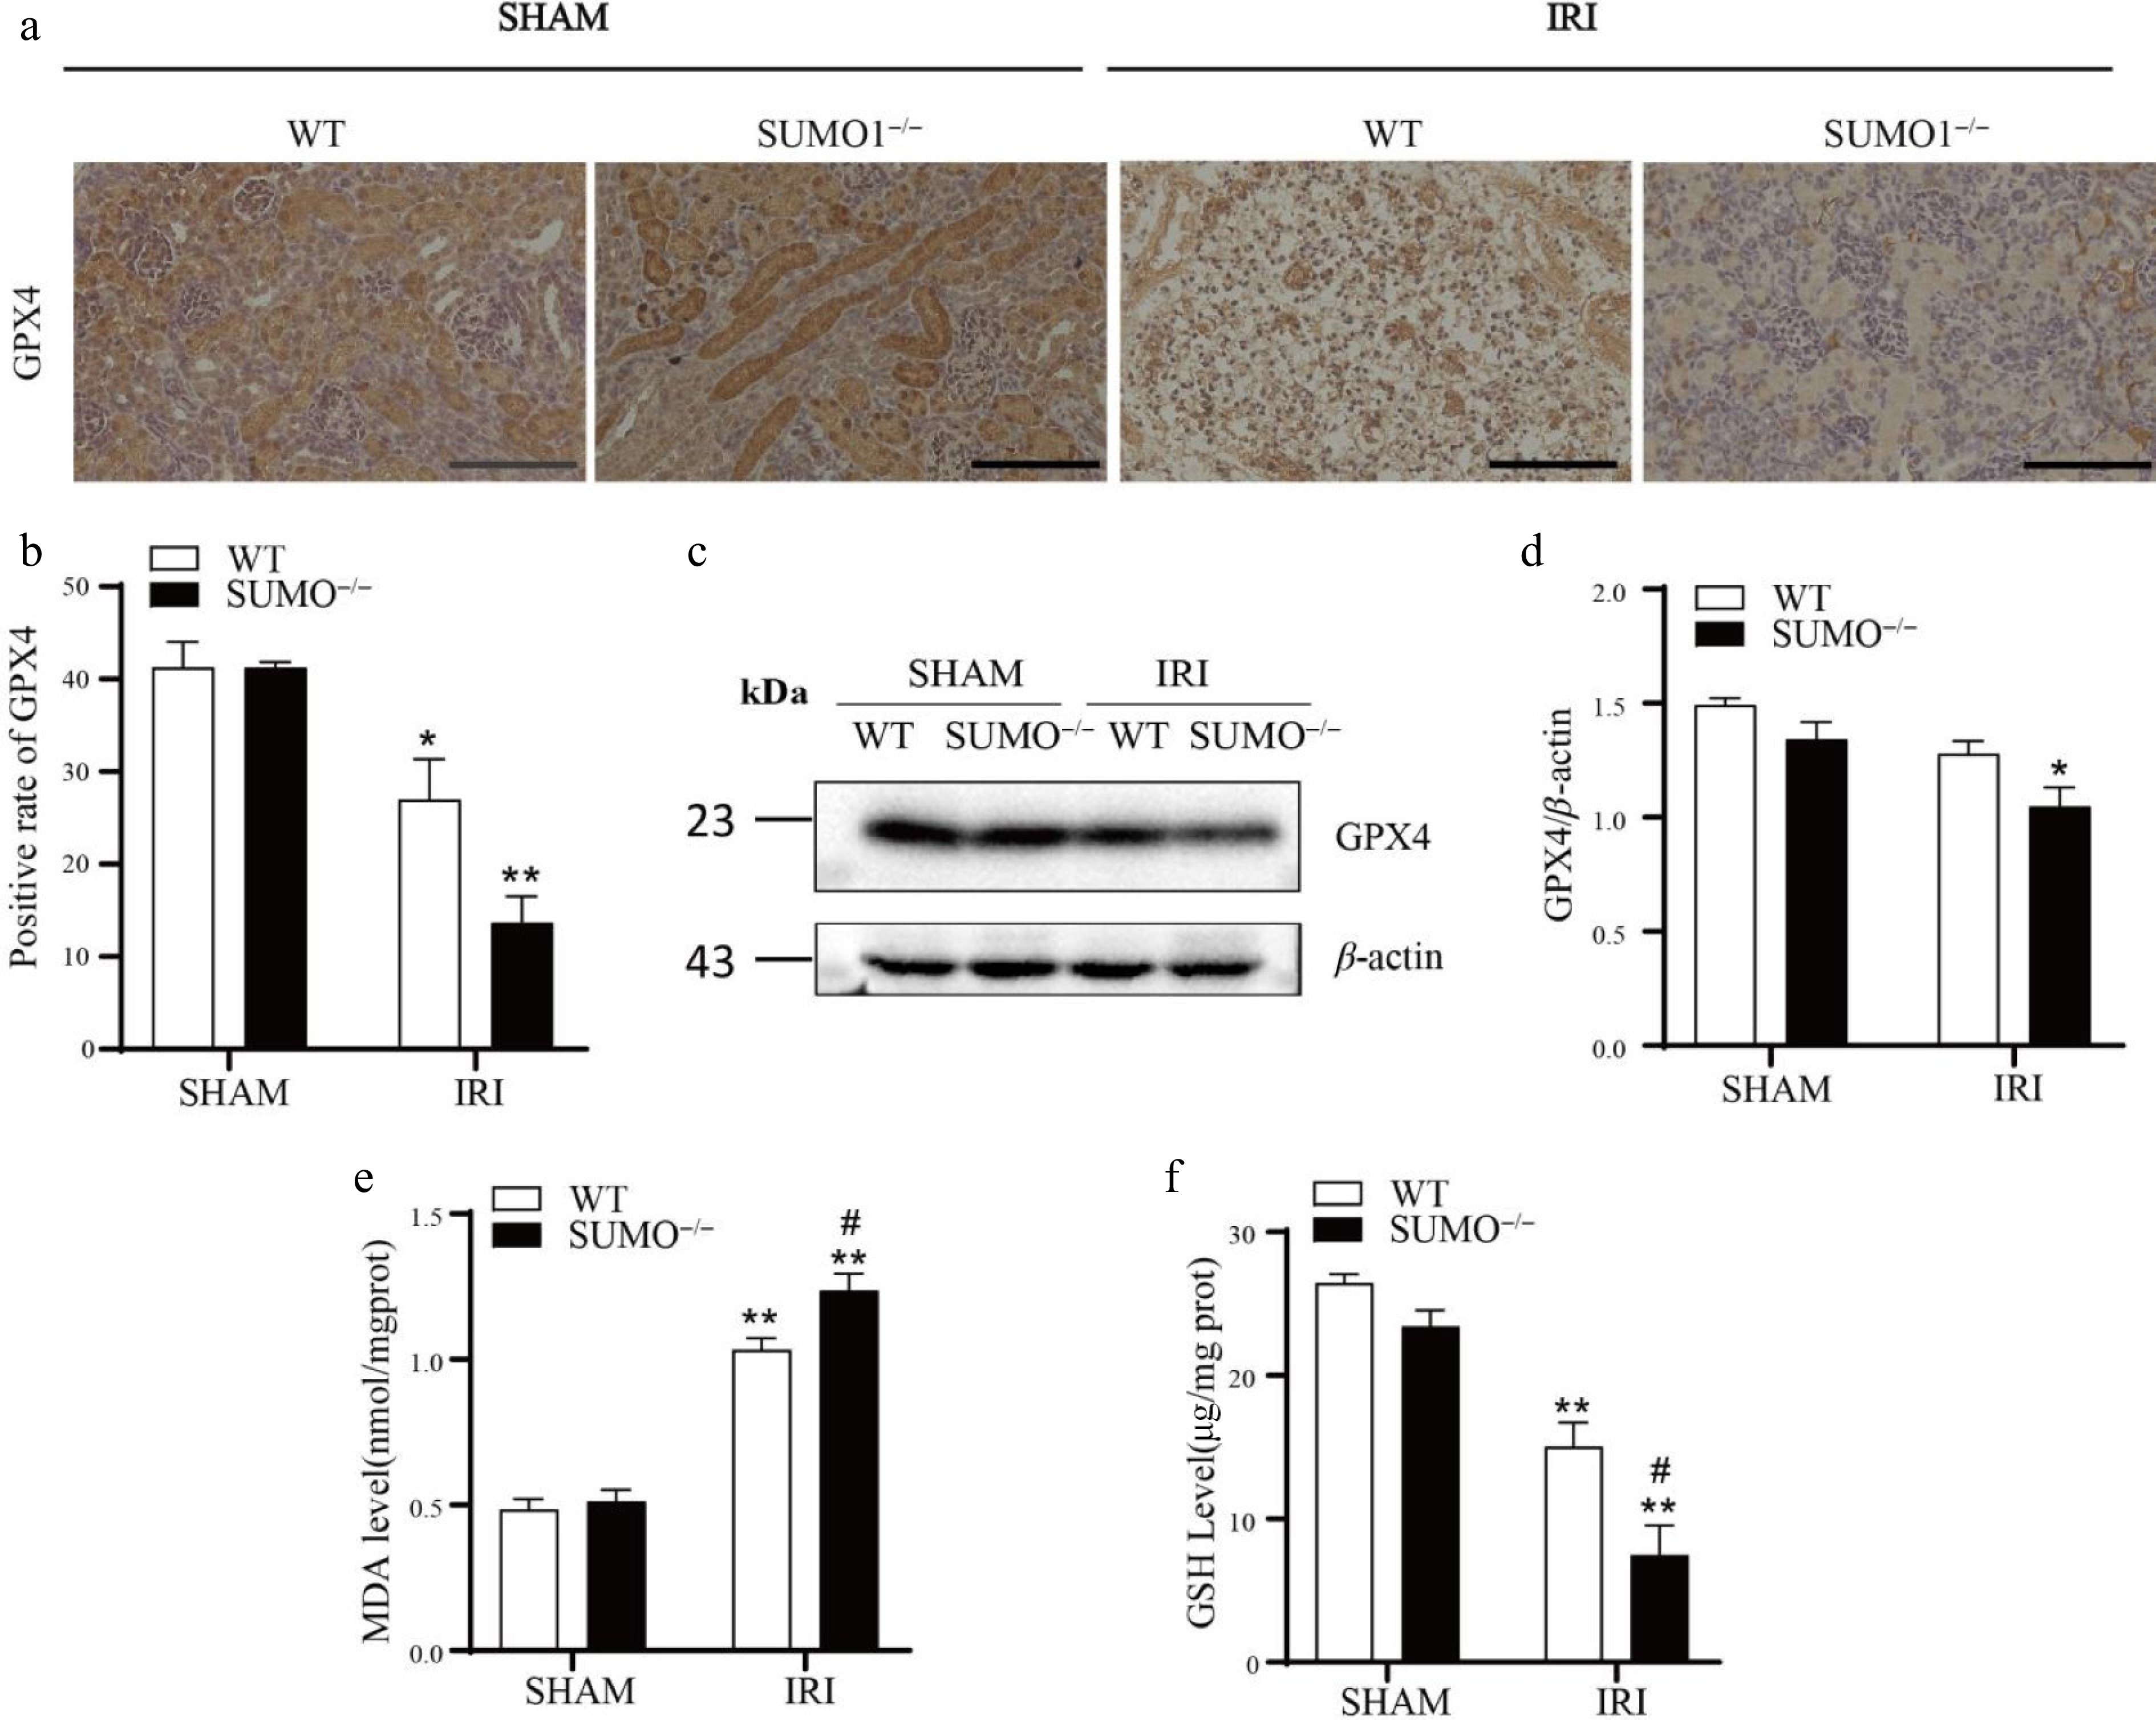
Figure 5.
Knockout of SUMO1 increases IRI-induced ferroptosis. (a) IHC analysis of GPX4 expression in kidney tissue. Bar = 100 μm. (b) Quantitative analysis of GPX4-positive staining. N = 3. (c), (d) WB analysis of GPX4 protein levels in kidney tissue. N = 3. (e) Determination of MDA in renal tissue. N = 4. (f) Determination of GSH in renal tissue. N = 3. Data were presented as the means ± SEM. * p < 0.05, ** p < 0.01 vs isogenic mice received sham procedure; # p < 0.05 vs WT mice with renal IRI.
Figures
(5)
Tables
(0)