-
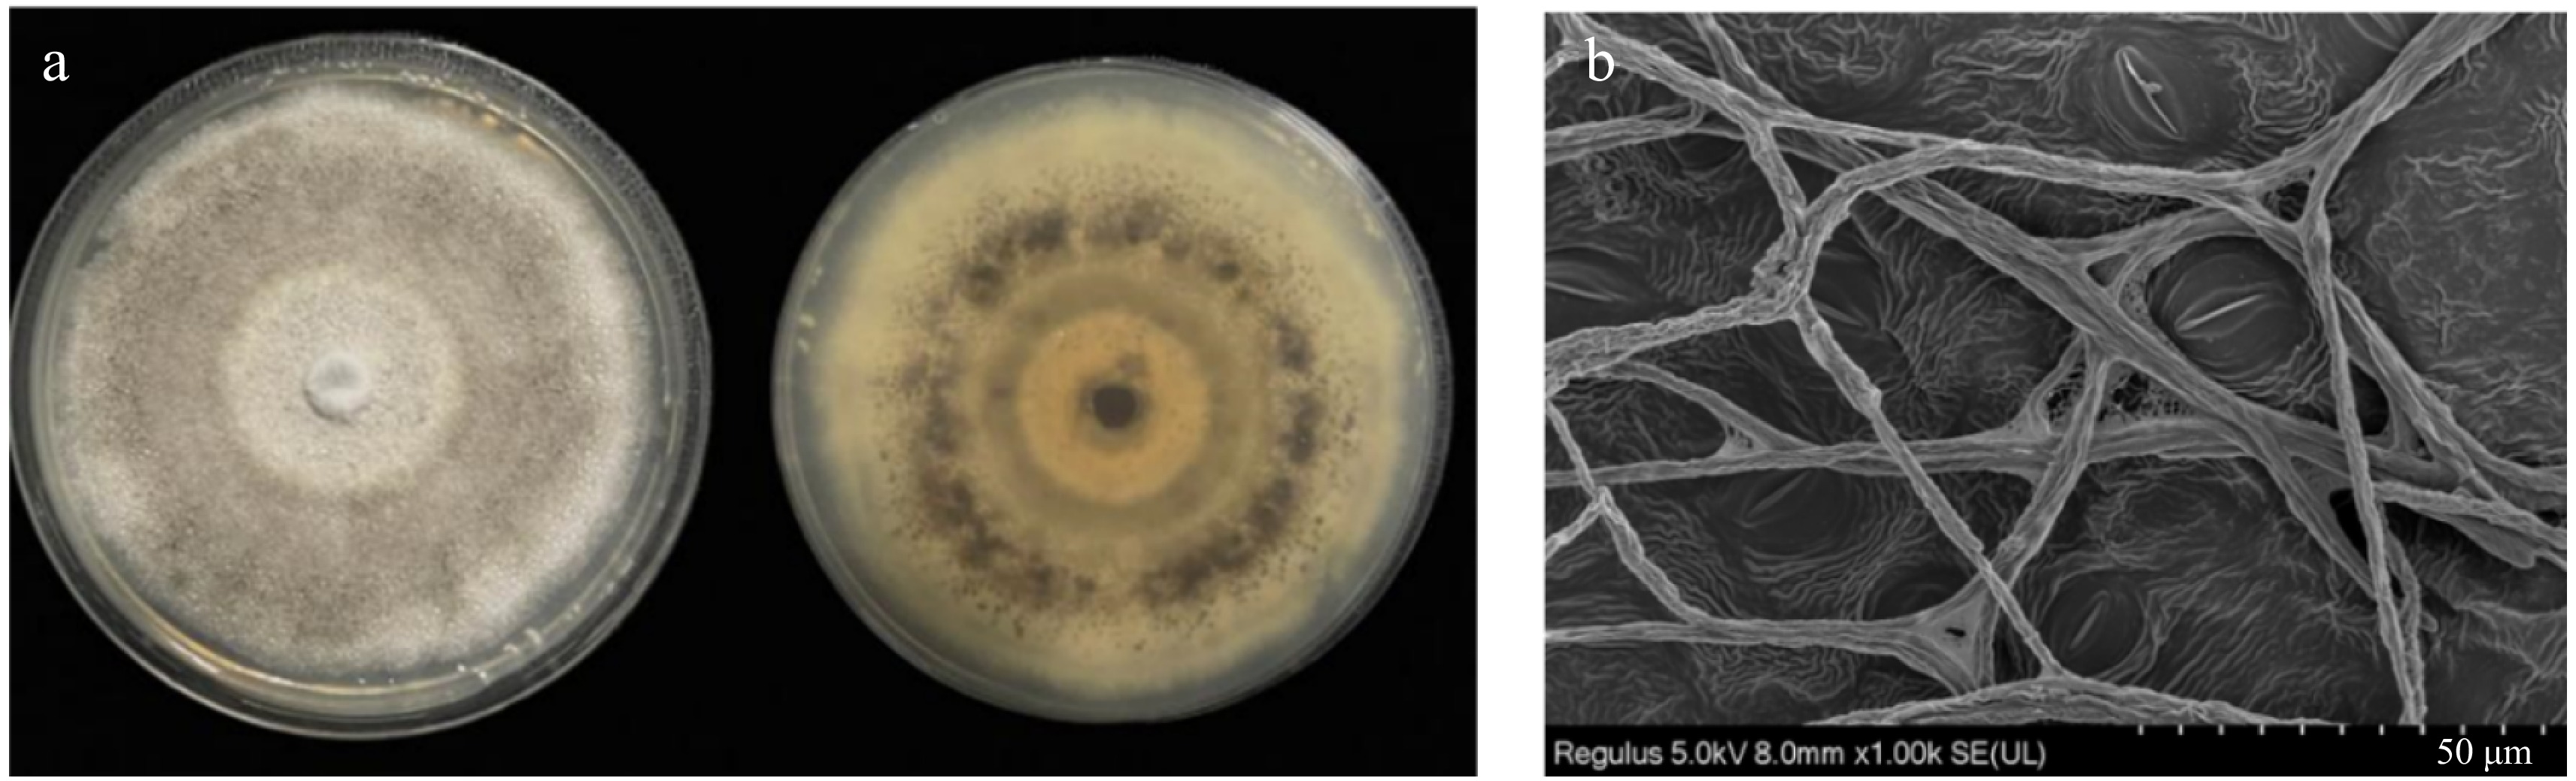
Figure 1.
Morphology of isolated strains. (a) Morphology of aerial hyphae; (b) Morphology of mycelia.
-
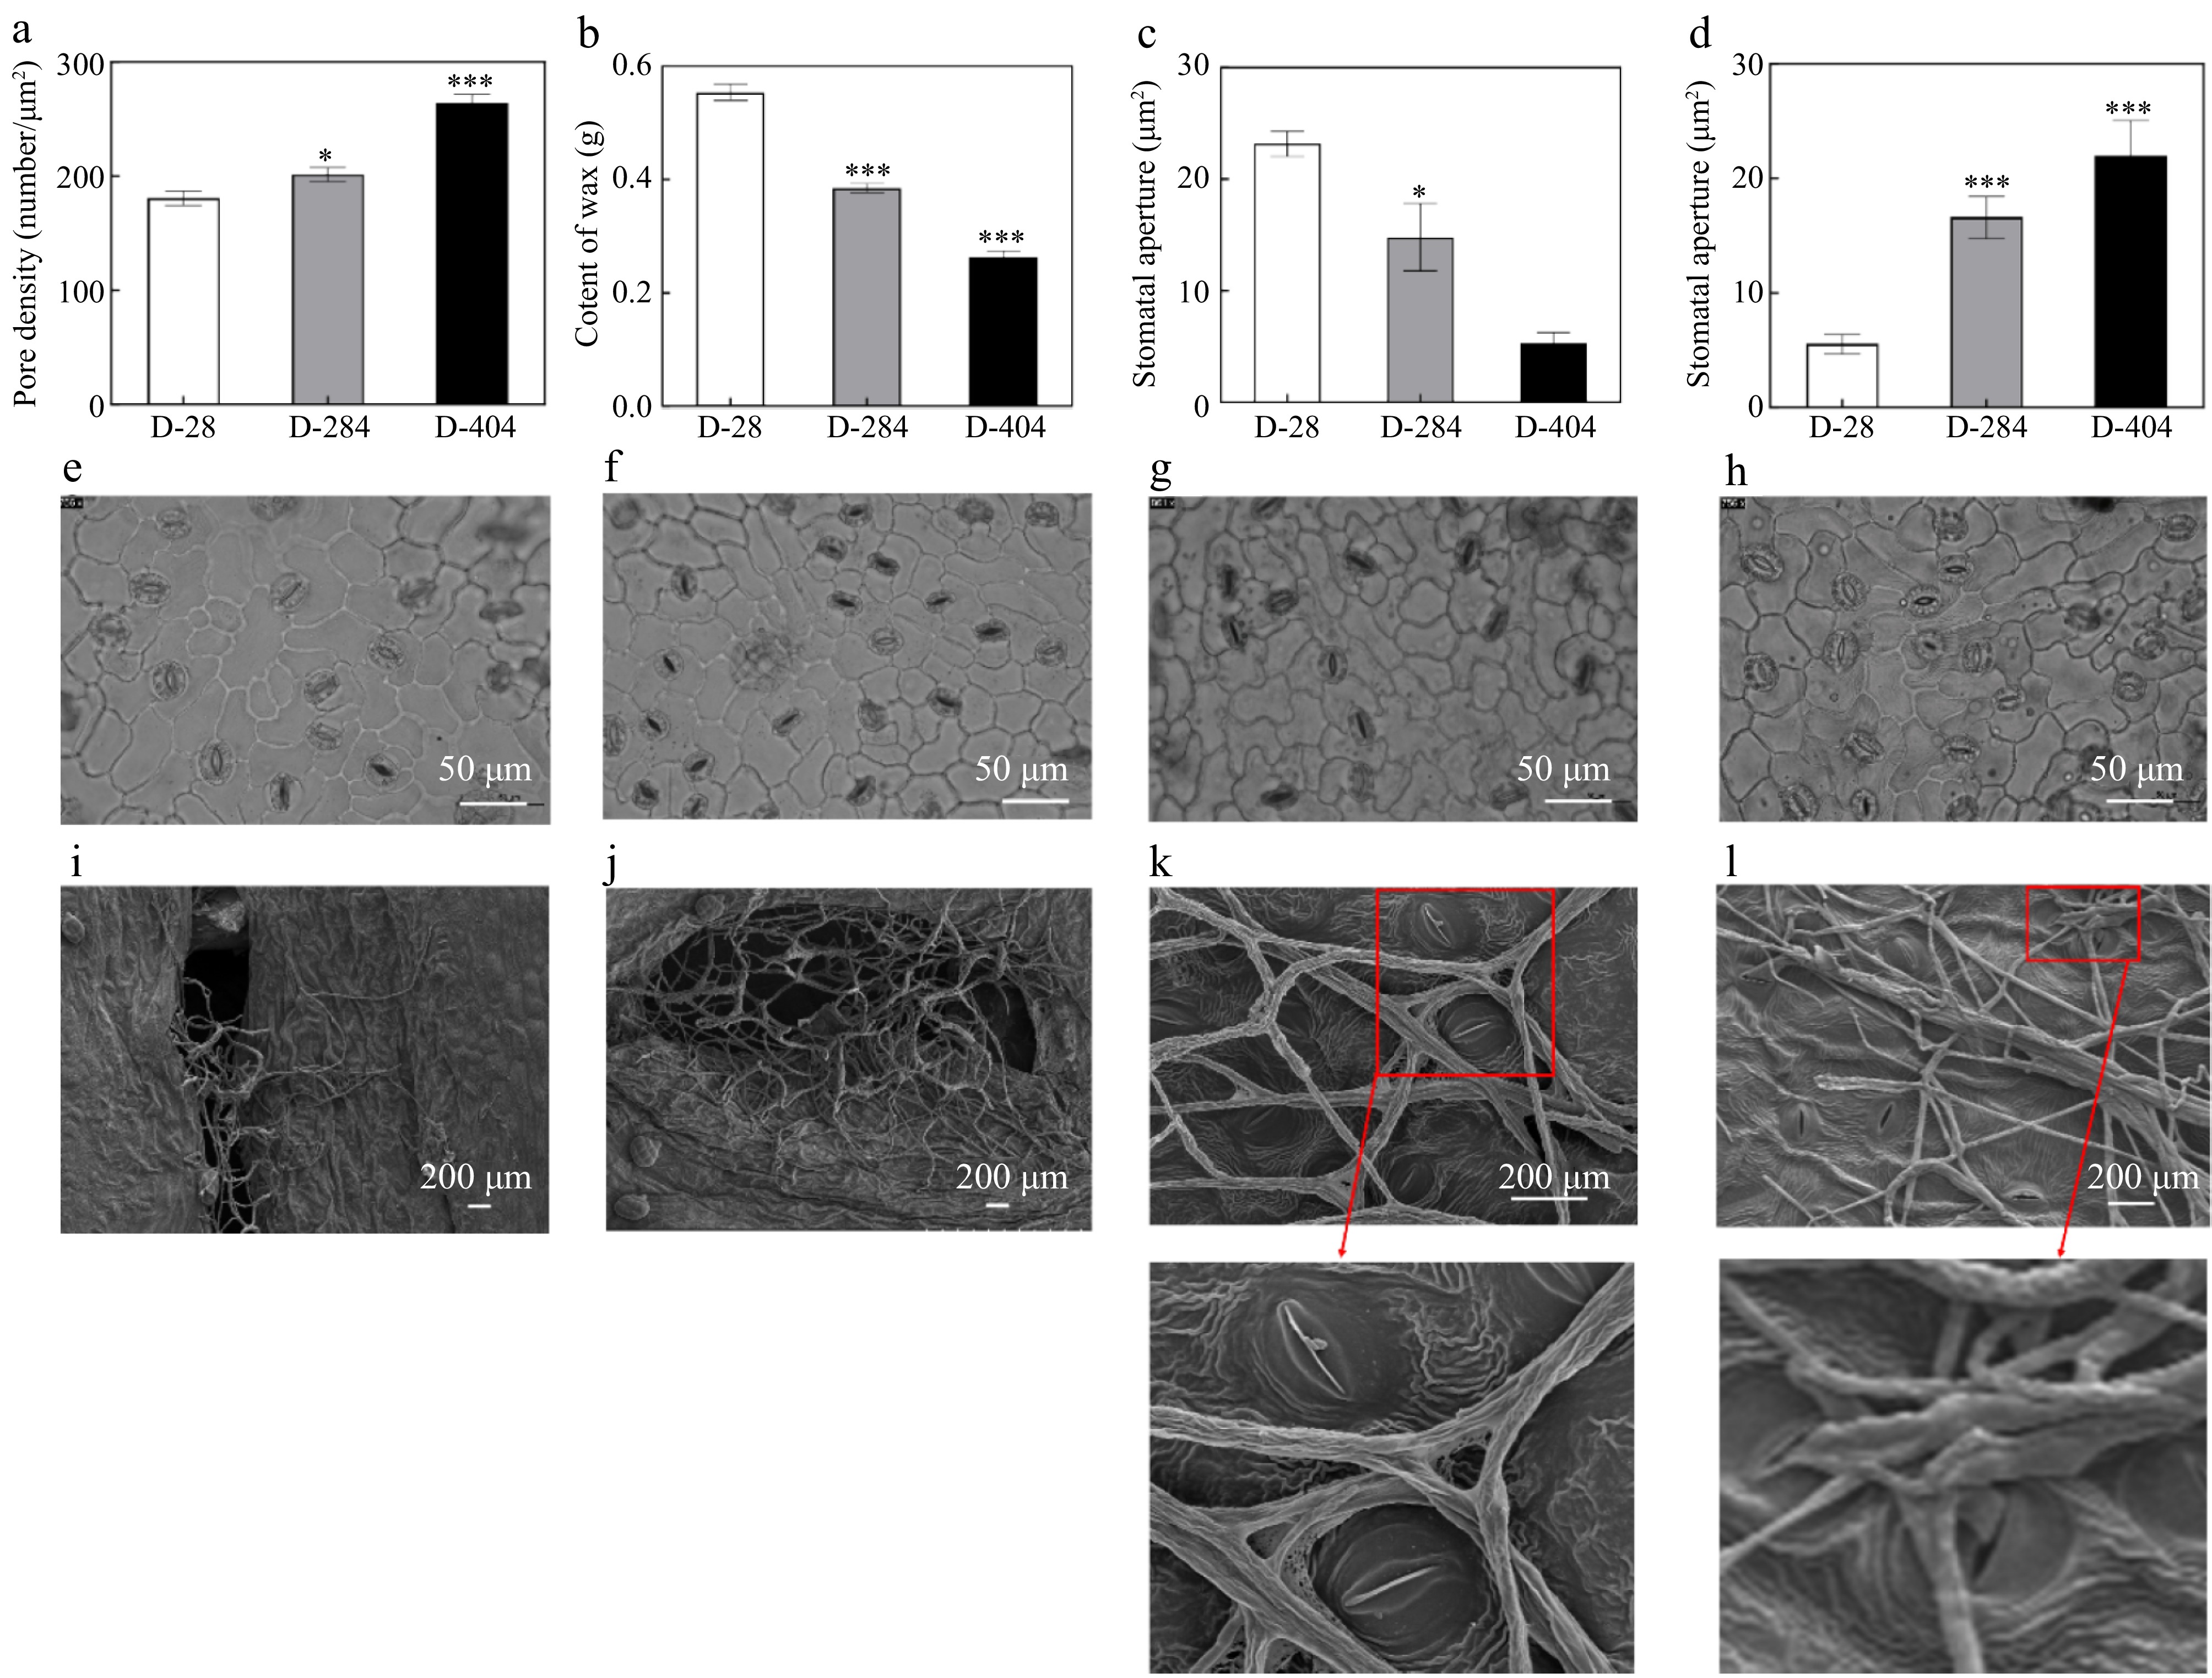
Figure 2.
Comparative analysis of wax contents and stomatal in leaves of different resistant varieties of Dioscorea alata L. (a) Comparison of stomatal density in leaves of different resistant varieties. (b) Comparison of wax content in leaves of different resistant varieties. (c) Comparison of stomatal opening in leaves of different resistant varieties before inoculation. (d) Comparison of stomatal opening of different resistant varieties after inoculation. (e) Microscopic image of stomata before inoculation of resistant variety. (f) Microscopic image of stomata before inoculation of susceptible variety. (g) Microscopic image of stomata after inoculation of resistant variety. (h) Microscopic image of stomata after inoculation of susceptible variety. (i) The mycelia in the inoculation holes of the resistant variety leaves at 1 dpi. (j) The mycelia in the inoculation holes of the susceptible variety leaves at 1 dpi. (k) Stomatal development of resistant variety leaves at 3 dpi. (l) Stomatal development of susceptible variety leaves at 3 dpi. The data are expressed as the mean ± SD. TBP groups vs 1 dpi, * p < 0.05, *** p < 0.001.
-
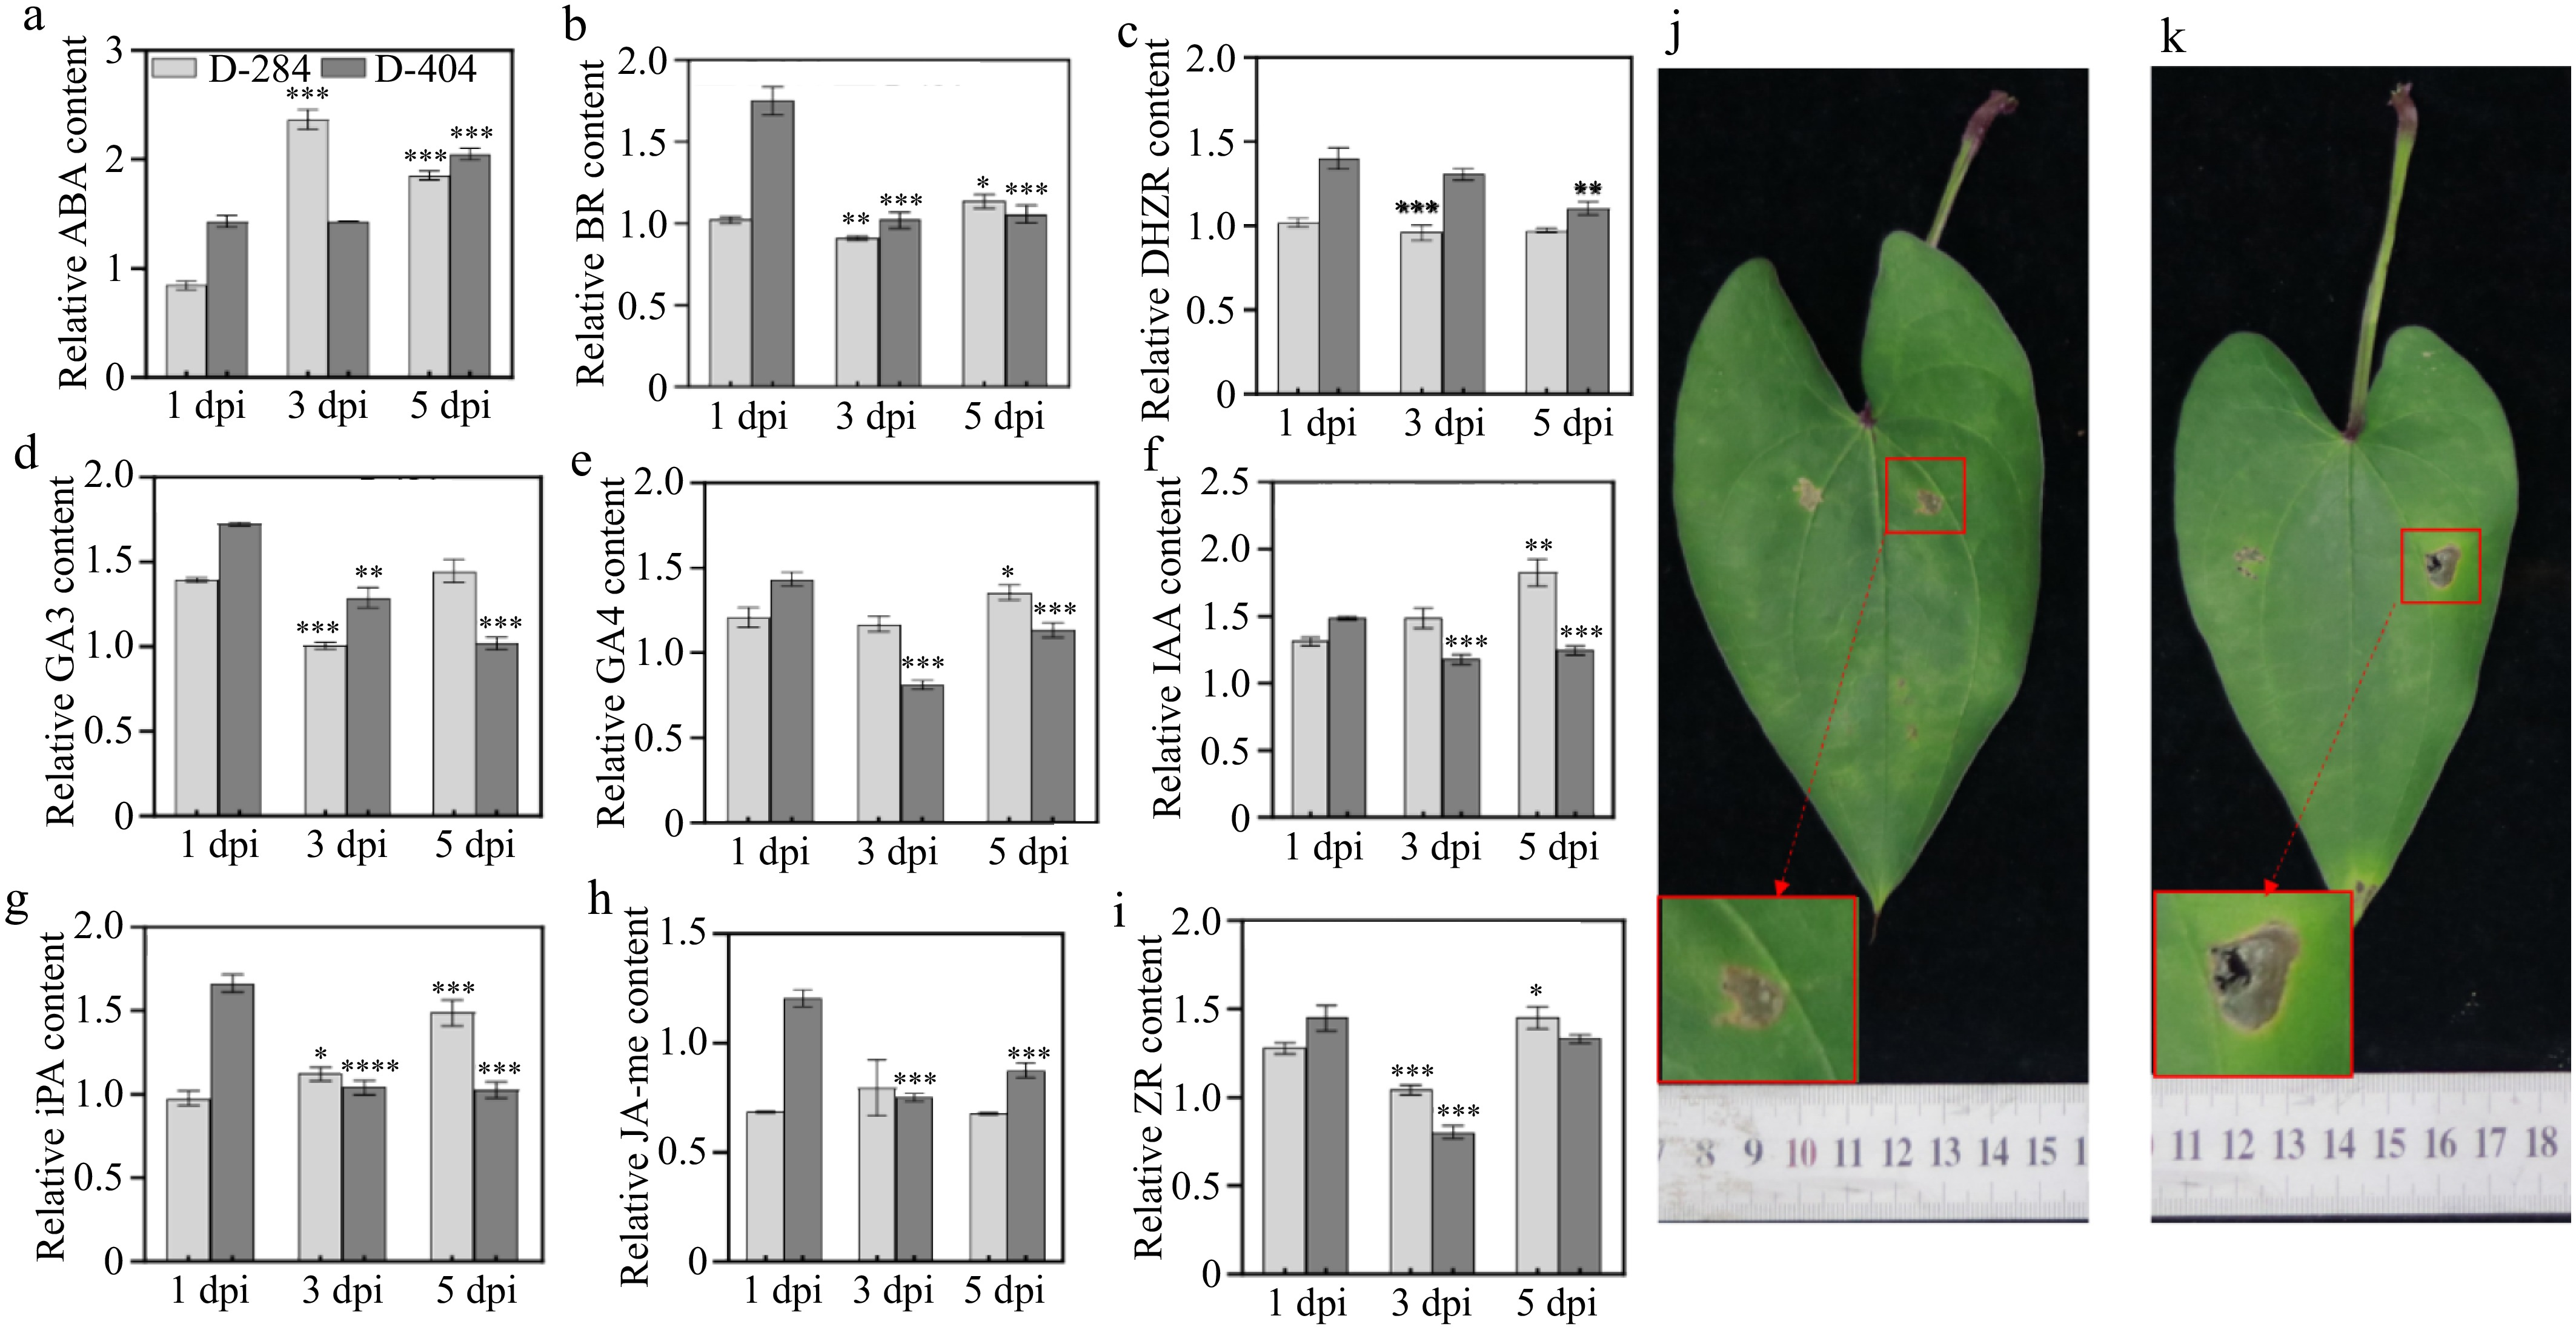
Figure 3.
Comparison of hormones content after anthracnose invasion and disease resistance after exogenous spraying of ABA. (a)−(i) Comparison of hormones content after anthracnose invasion. (j) Phenotype of anthracnose pathogen inoculation after exogenous spraying of ABA in susceptible variety (left of leaf vein: control; right side of leaf vein: inoculation of anthracnose pathogen). (k) Phenotype of anthracnose pathogen inoculation in susceptible variety (left of leaf vein: control; right side of leaf vein: inoculation of anthracnose pathogen). The data are expressed as the mean ± SD. TBP groups vs 1 dpi, *p < 0.05, **p < 0.01, ***p < 0.001, **** p < 0.0001.
-
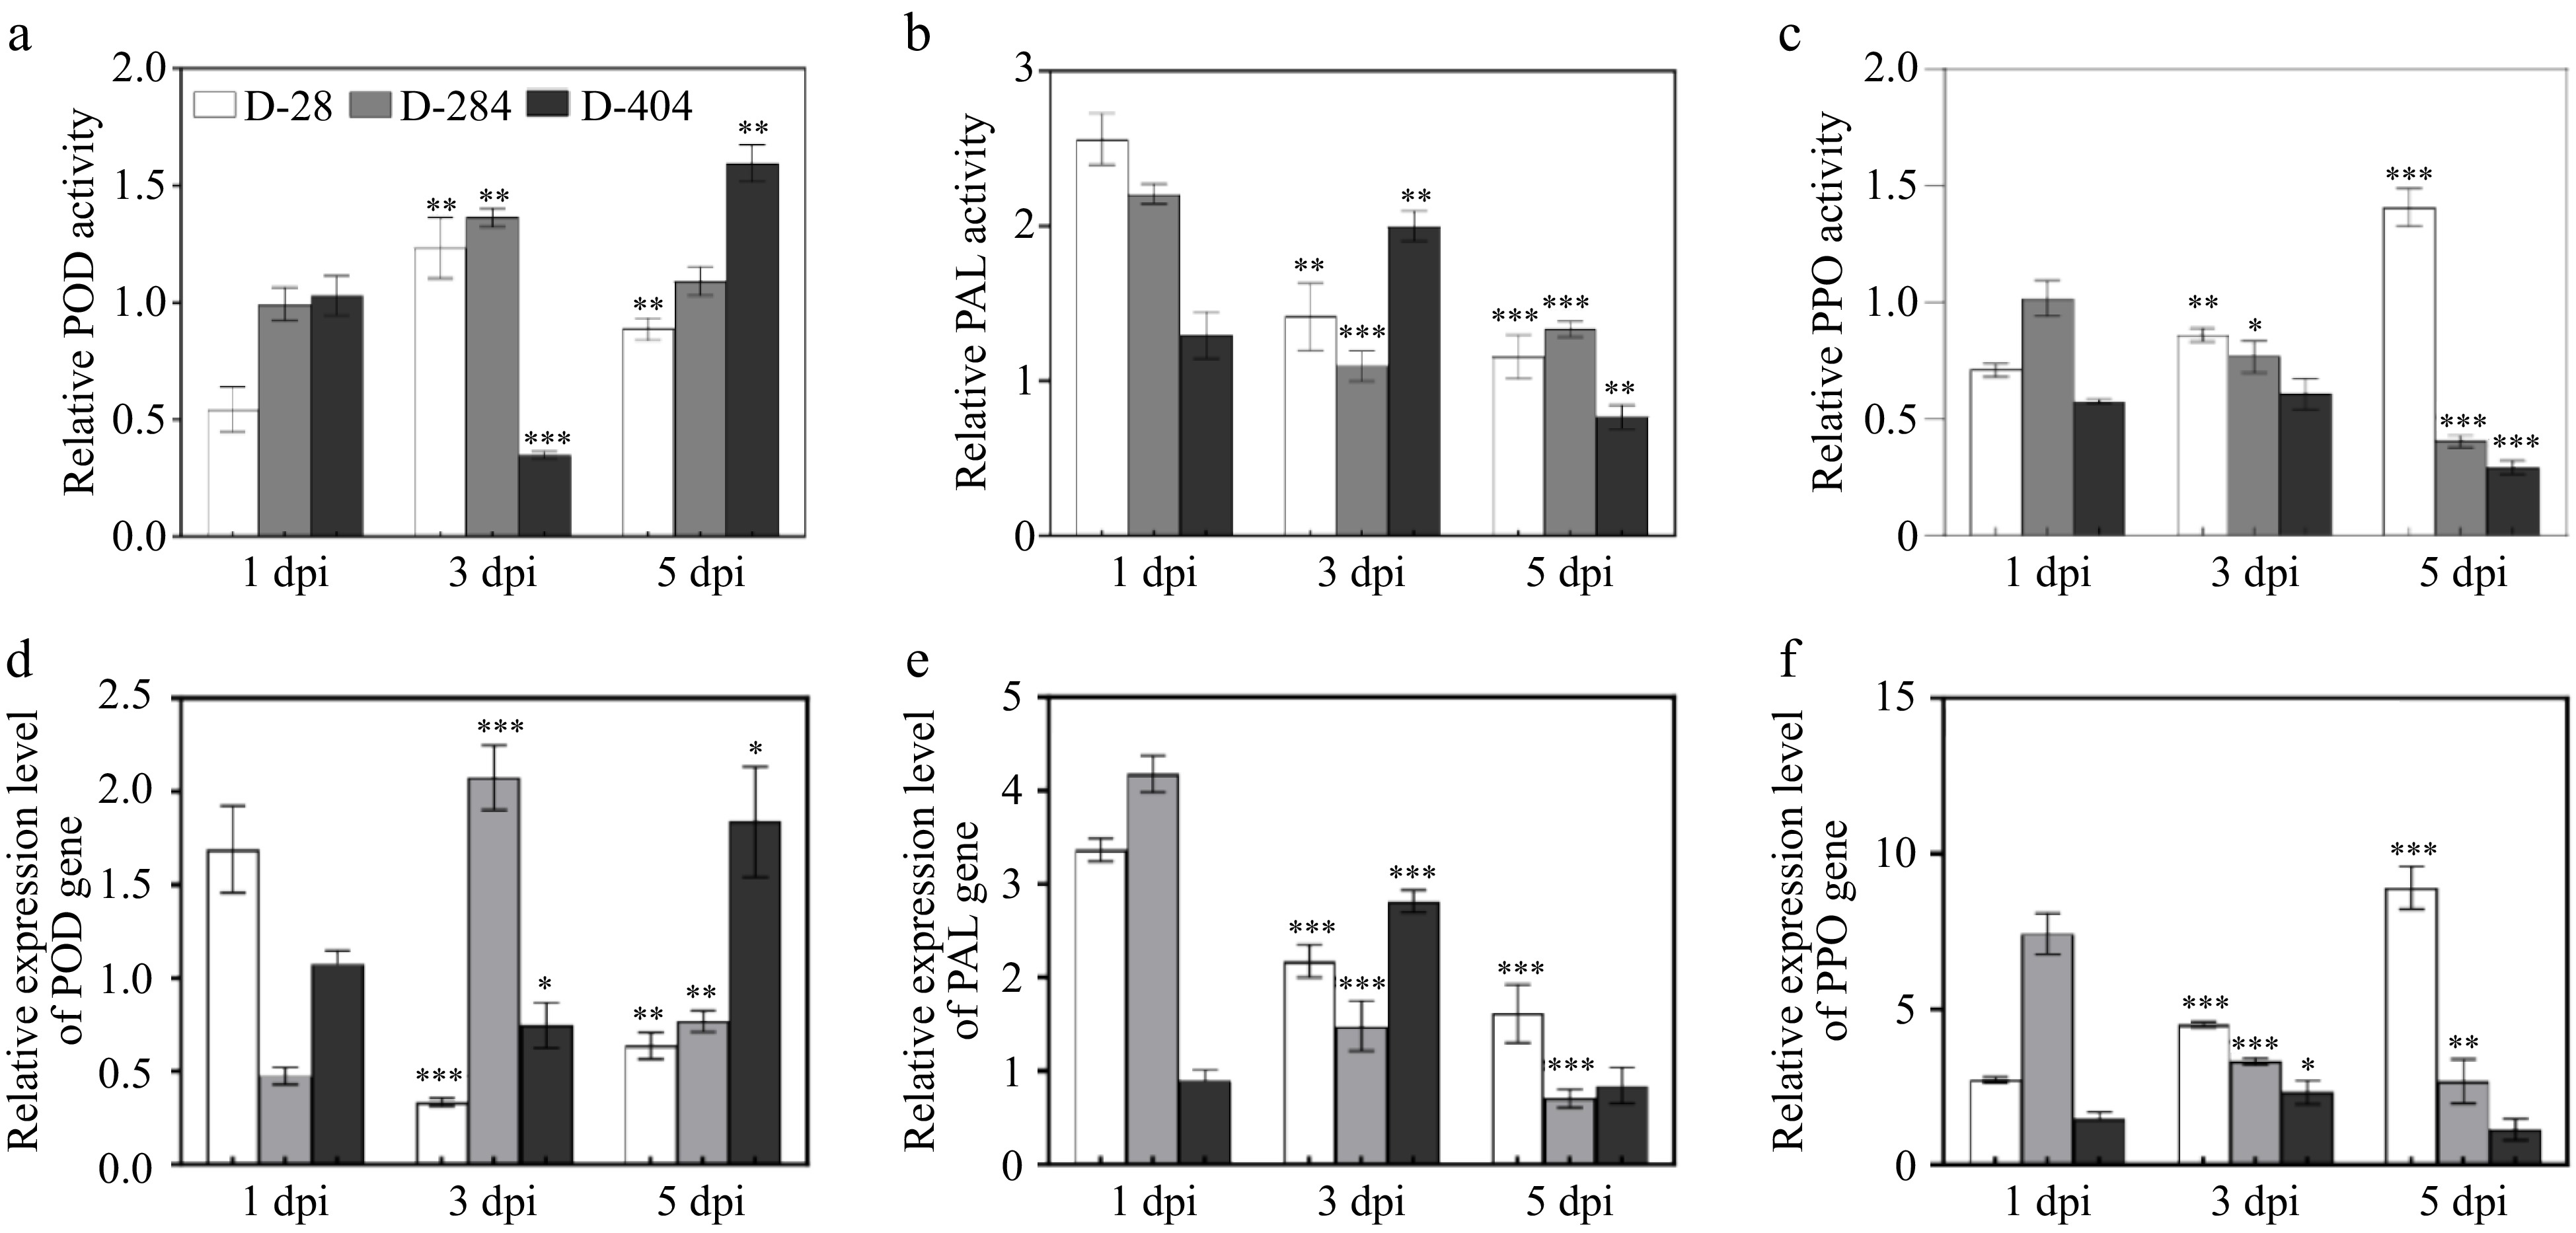
Figure 4.
Comparative analysis of defense enzymes post anthracnose infection of different resistant varieties of Dioscorea alata L. (a) Relative POD activity of immune variety D-28, resistant variety D-284, and susceptible variety D-404. (b) Relative PAL activity of immune variety D-28, resistant variety D-284, and susceptible variety D-404. (c) Relative PPO activity of immune variety D-28, resistant variety D-284, and susceptible variety D-404. (d) Relative expression level of POD gene of immune variety D-28, resistant variety D-284, and susceptible variety D-404. (e) Relative expression level of PAL gene of immune variety D-28, resistant variety D-284, and susceptible variety D-404. (f) Relative expression level of PPO gene of immune variety D-28, resistant variety D-284, and susceptible variety D-404. The data are expressed as the mean ± SD. TBP groups vs 1 dpi, * p < 0.05, ** p < 0.01, *** p < 0.001.
-
Grading criteria for resistance Percentage of lesions (%) 1 0.1 < Percentage of lesions ≤ 5 2 5.1 < Percentage of lesions ≤ 15 3 15.1 < Percentage of lesions ≤ 30 4 30.1 < Percentage of lesions ≤ 45 5 45.1 < Percentage of lesions ≤ 65 6 65.1 < Percentage of lesions ≤ 85 7 85.1 < Percentage of lesions ≤ 100 Table 1.
Classification criteria for the identification of resistance to anthracnose in Dioscorea alata L.
-
Severity index (SI) Resistance evaluation SI = 0 Immunity (I) 0 < SI ≤ 3 Highly resistant (HR) 3 < SI ≤ 10 Resistant (R) 10 < SI ≤ 30 Susceptible (S) SI > 30 Highly susceptible (HS) Table 2.
Evaluation criteria for the resistance of Dioscorea alata L. to anthracnose disease.
-
Varieties Disease index Relative disease
resistance indexResistance evaluation Varieties Disease index Relative disease
resistance indexResistance
evaluationD-28 0.00 1.00 I D-279 14.29 ± 1.19 0.80 S D-31 0.00 1.00 I D-13 14.29 ± 0.15 0.80 S D-18 0.00 1.00 I D-14 14.29 ± 0.35 0.80 S D-33 0.00 1.00 I D-15 14.29 ± 0.76 0.80 S D-8 0.00 1.00 I D-41 14.30 ± 0.22 0.80 S D-406 0.00 1.00 I D-401 17.14 ± 5.08 0.76 S D-303 0.00 1.00 I D-419 19.05 ± 1.92 0.73 S D-284 2.38 ± 0.44 0.97 HR D-7 21.43 ± 1.92 0.70 S D-288 2.38 ± 0.06 0.97 HR D-6 23.80 ± 2.86 0.67 S D-29 3.57 ± 0.45 0.95 R D-400 23.81 ± 2.76 0.67 S D-403 4.76 ± 0.75 0.93 R D-36 23.81 ± 1.40 0.67 S D-402 4.76 ± 0.72 0.93 R D-304 28.57 ± 3.17 0.60 S D-297 4.76 ± 1.35 0.93 R D-20 28.57 ± 7.53 0.60 S D-11 4.76 ± 0.18 0.93 R D-264 28.57 ± 6.49 0.60 S D-24 4.76 ± 0.26 0.93 R D-34 28.57 ± 4.74 0.60 S D-5 4.80 ± 1.30 0.93 R D-9 28.57 ± 7.53 0.60 S D-405 5.71 ± 0.52 0.92 R D-4 28.60 ± 2.57 0.60 S D-38 9.52 ± 1.10 0.87 R D-10 35.70 ± 2.04 0.50 HS D-294 9.52 ± 0.43 0.87 R D-274 45.70 ± 2.57 0.36 HS D-1 11.40 ± 0.73 0.84 S D-32 45.70 ± 4.20 0.36 HS D-407 14.29 ± 0.76 0.80 S D-3 57.14 ± 2.64 0.20 HS D-23 14.29 ± 0.15 0.80 S D-306 57.14 ± 2.64 0.20 HS D-2 14.29 ± 0.28 0.80 S D-404 71.43 ± 4.20 0.00 HS Table 3.
Evaluation of anthracnose resistance in different varieties of Dioscorea alata L.
Figures
(4)
Tables
(3)