-
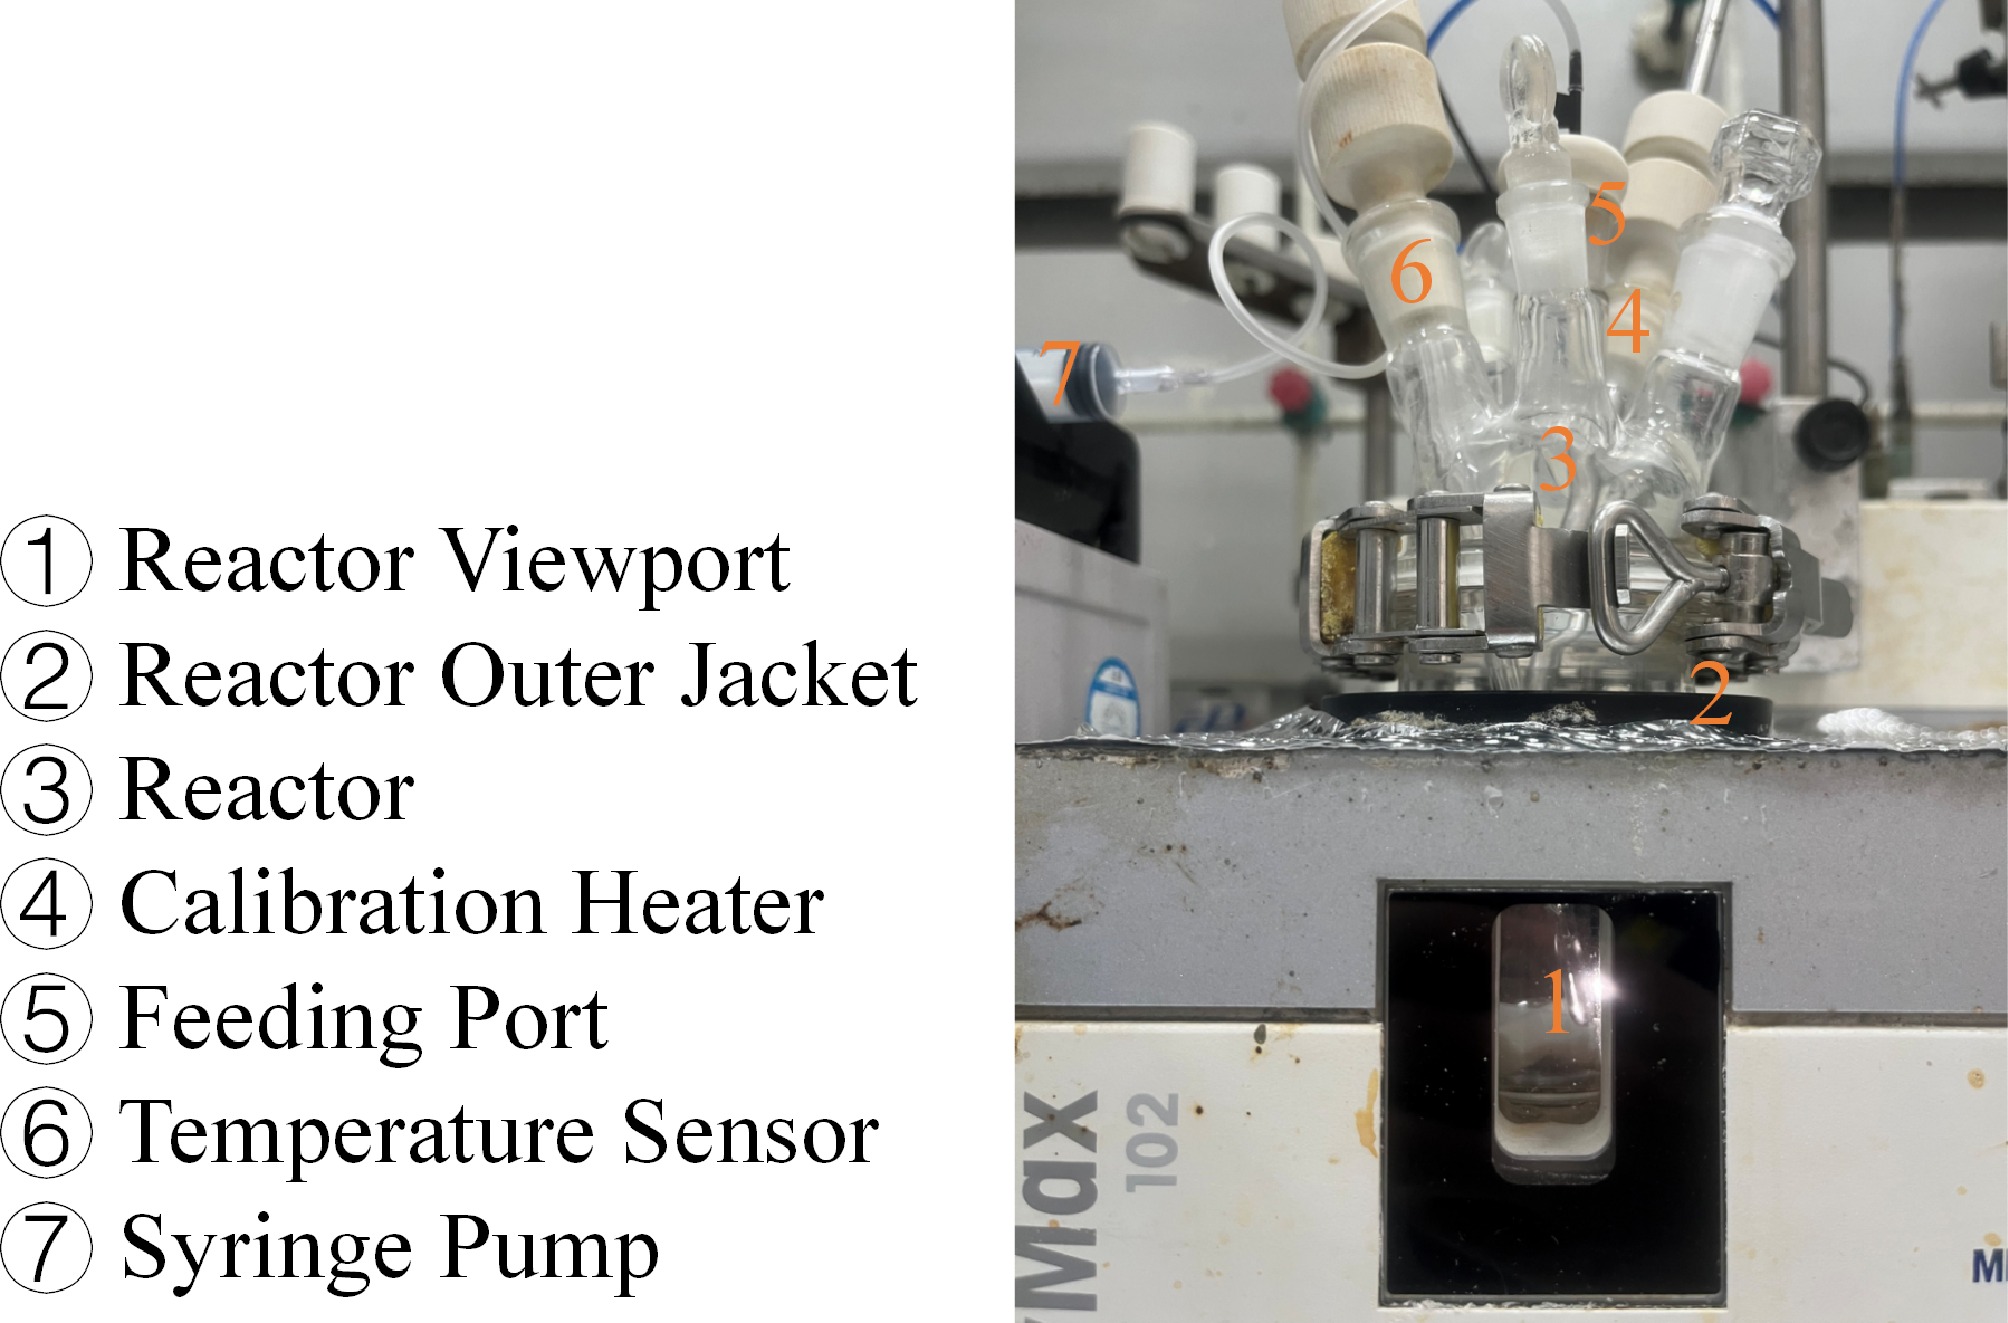
Figure 1.
Schematic diagram of the reaction calorimeter.
-
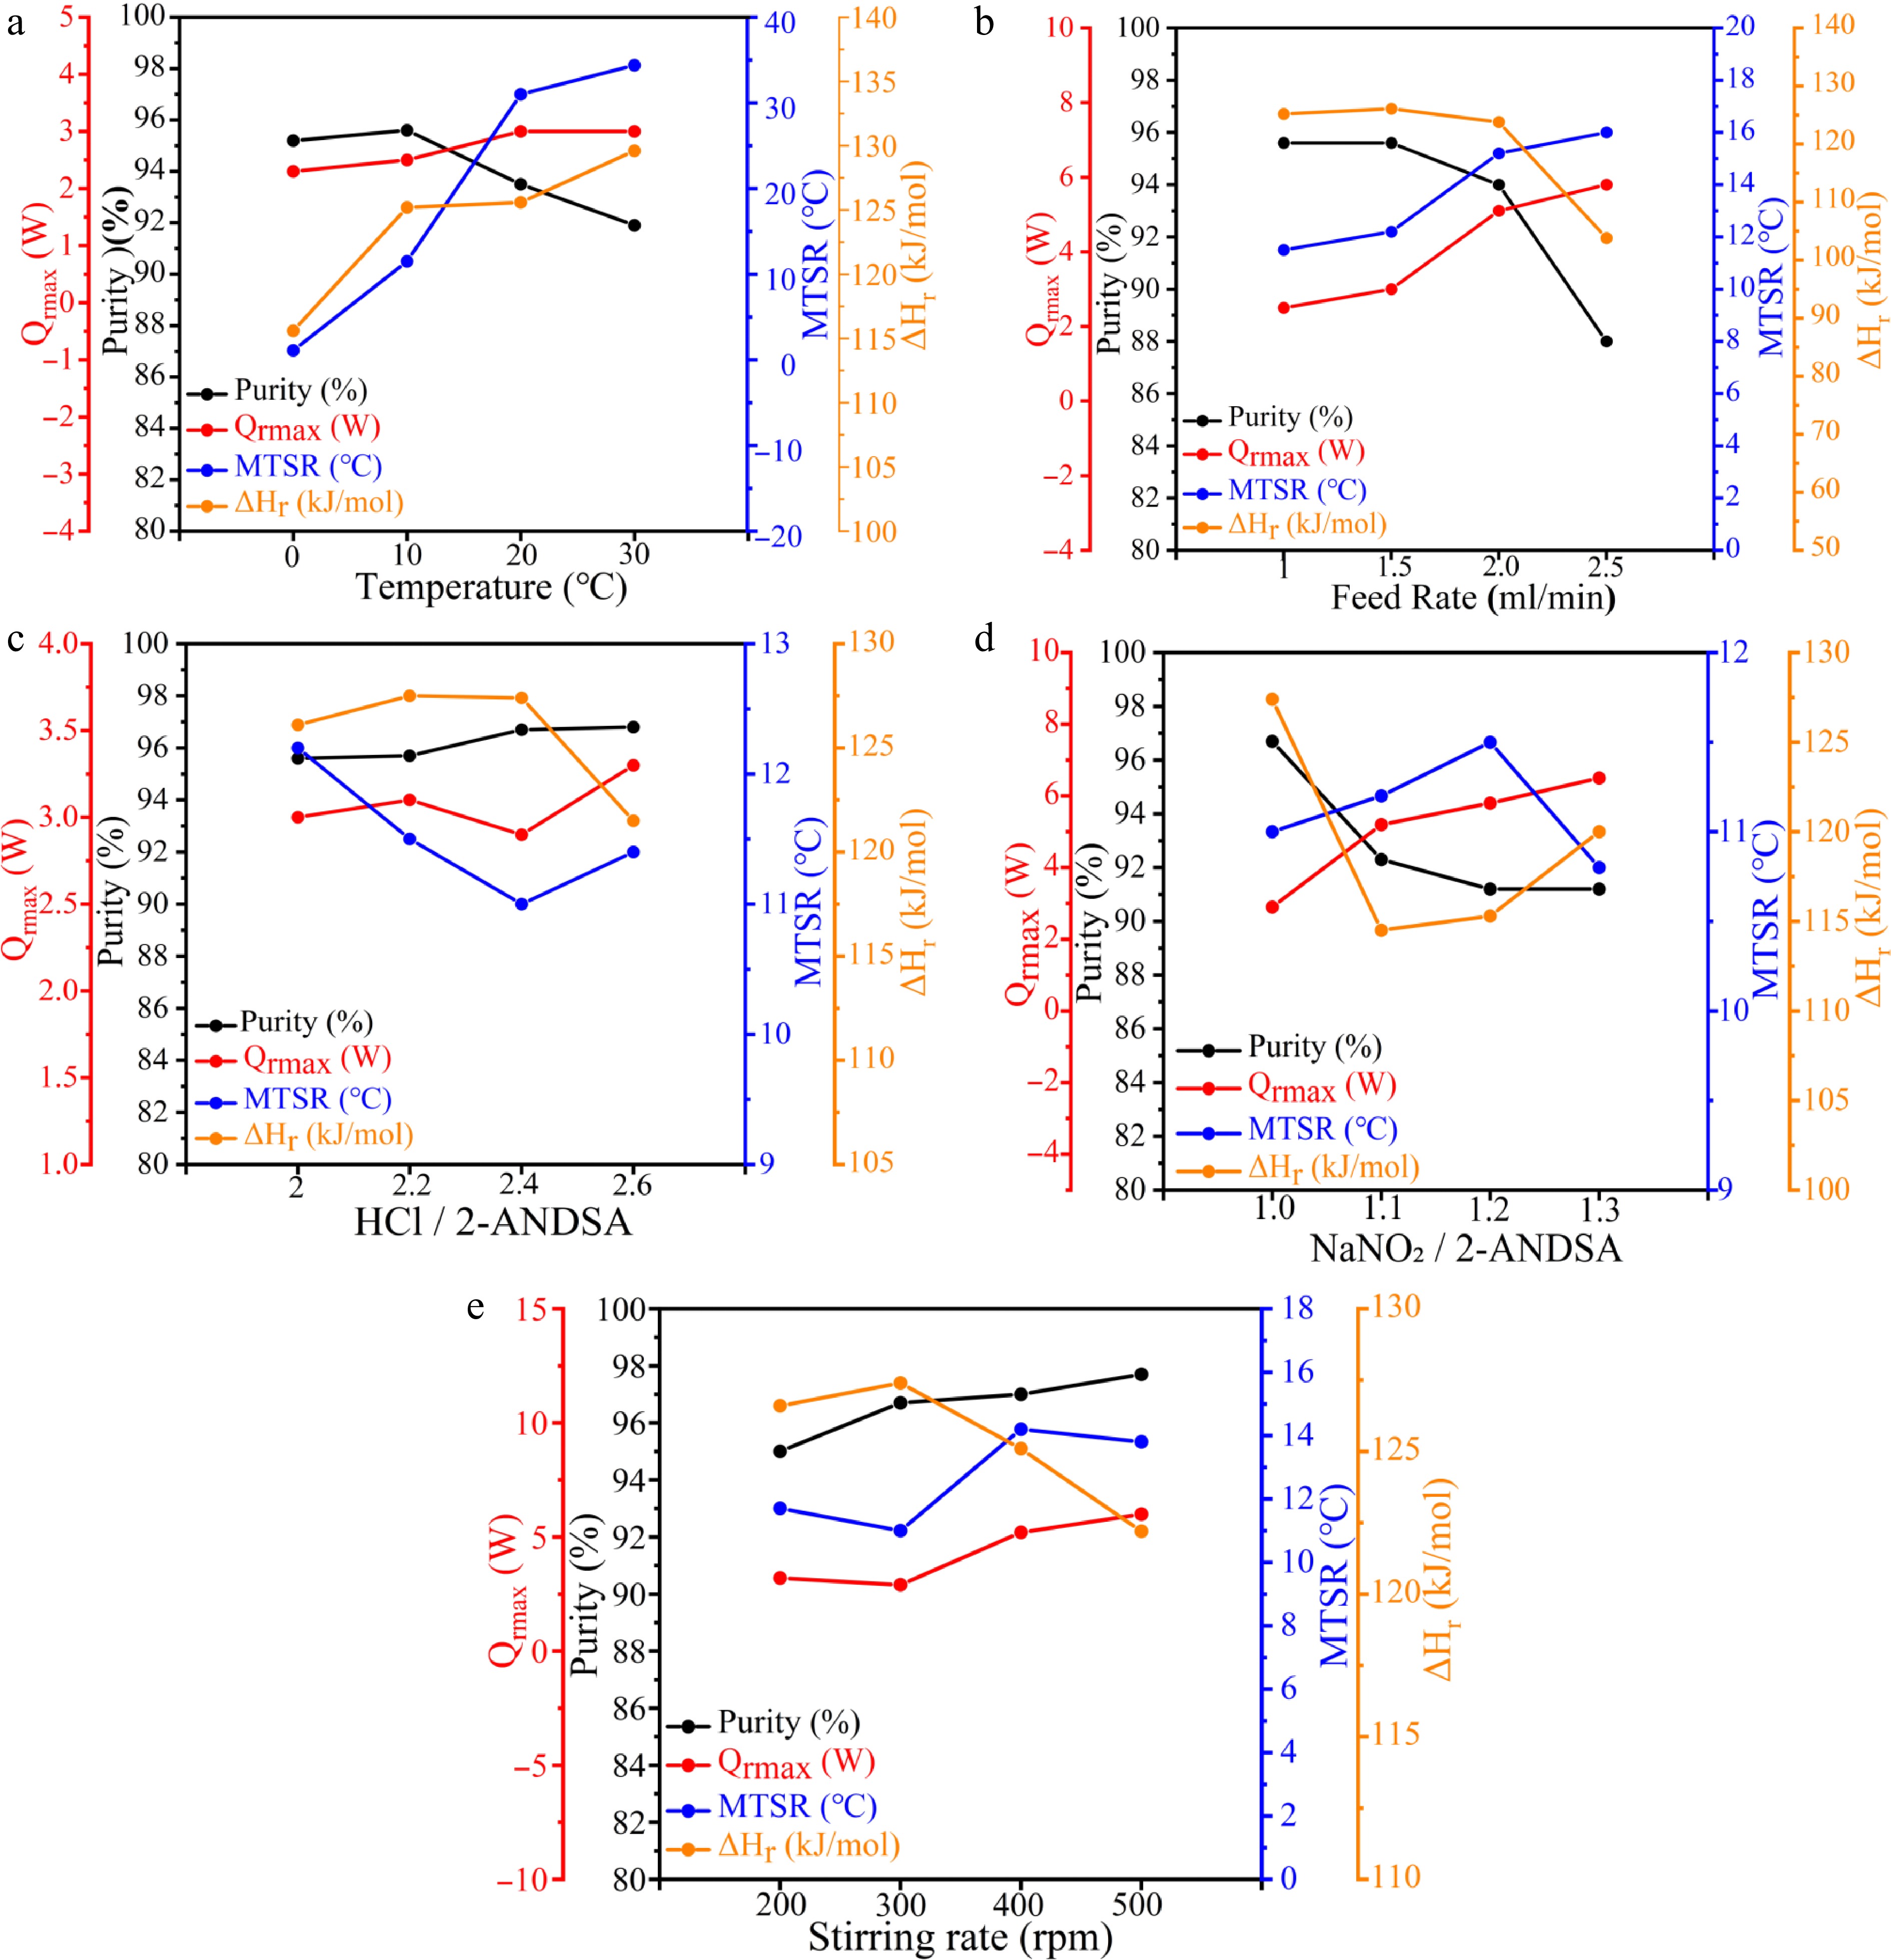
Figure 2.
Quantitative characterization of purity and thermal risk parameters for 2-ANDSA diazotization (a) Temperature, (b) feed rate, (c) HCl/2-ANDSA, (d) NaNO2/2-ANDSA, (e) stirring rate.
-
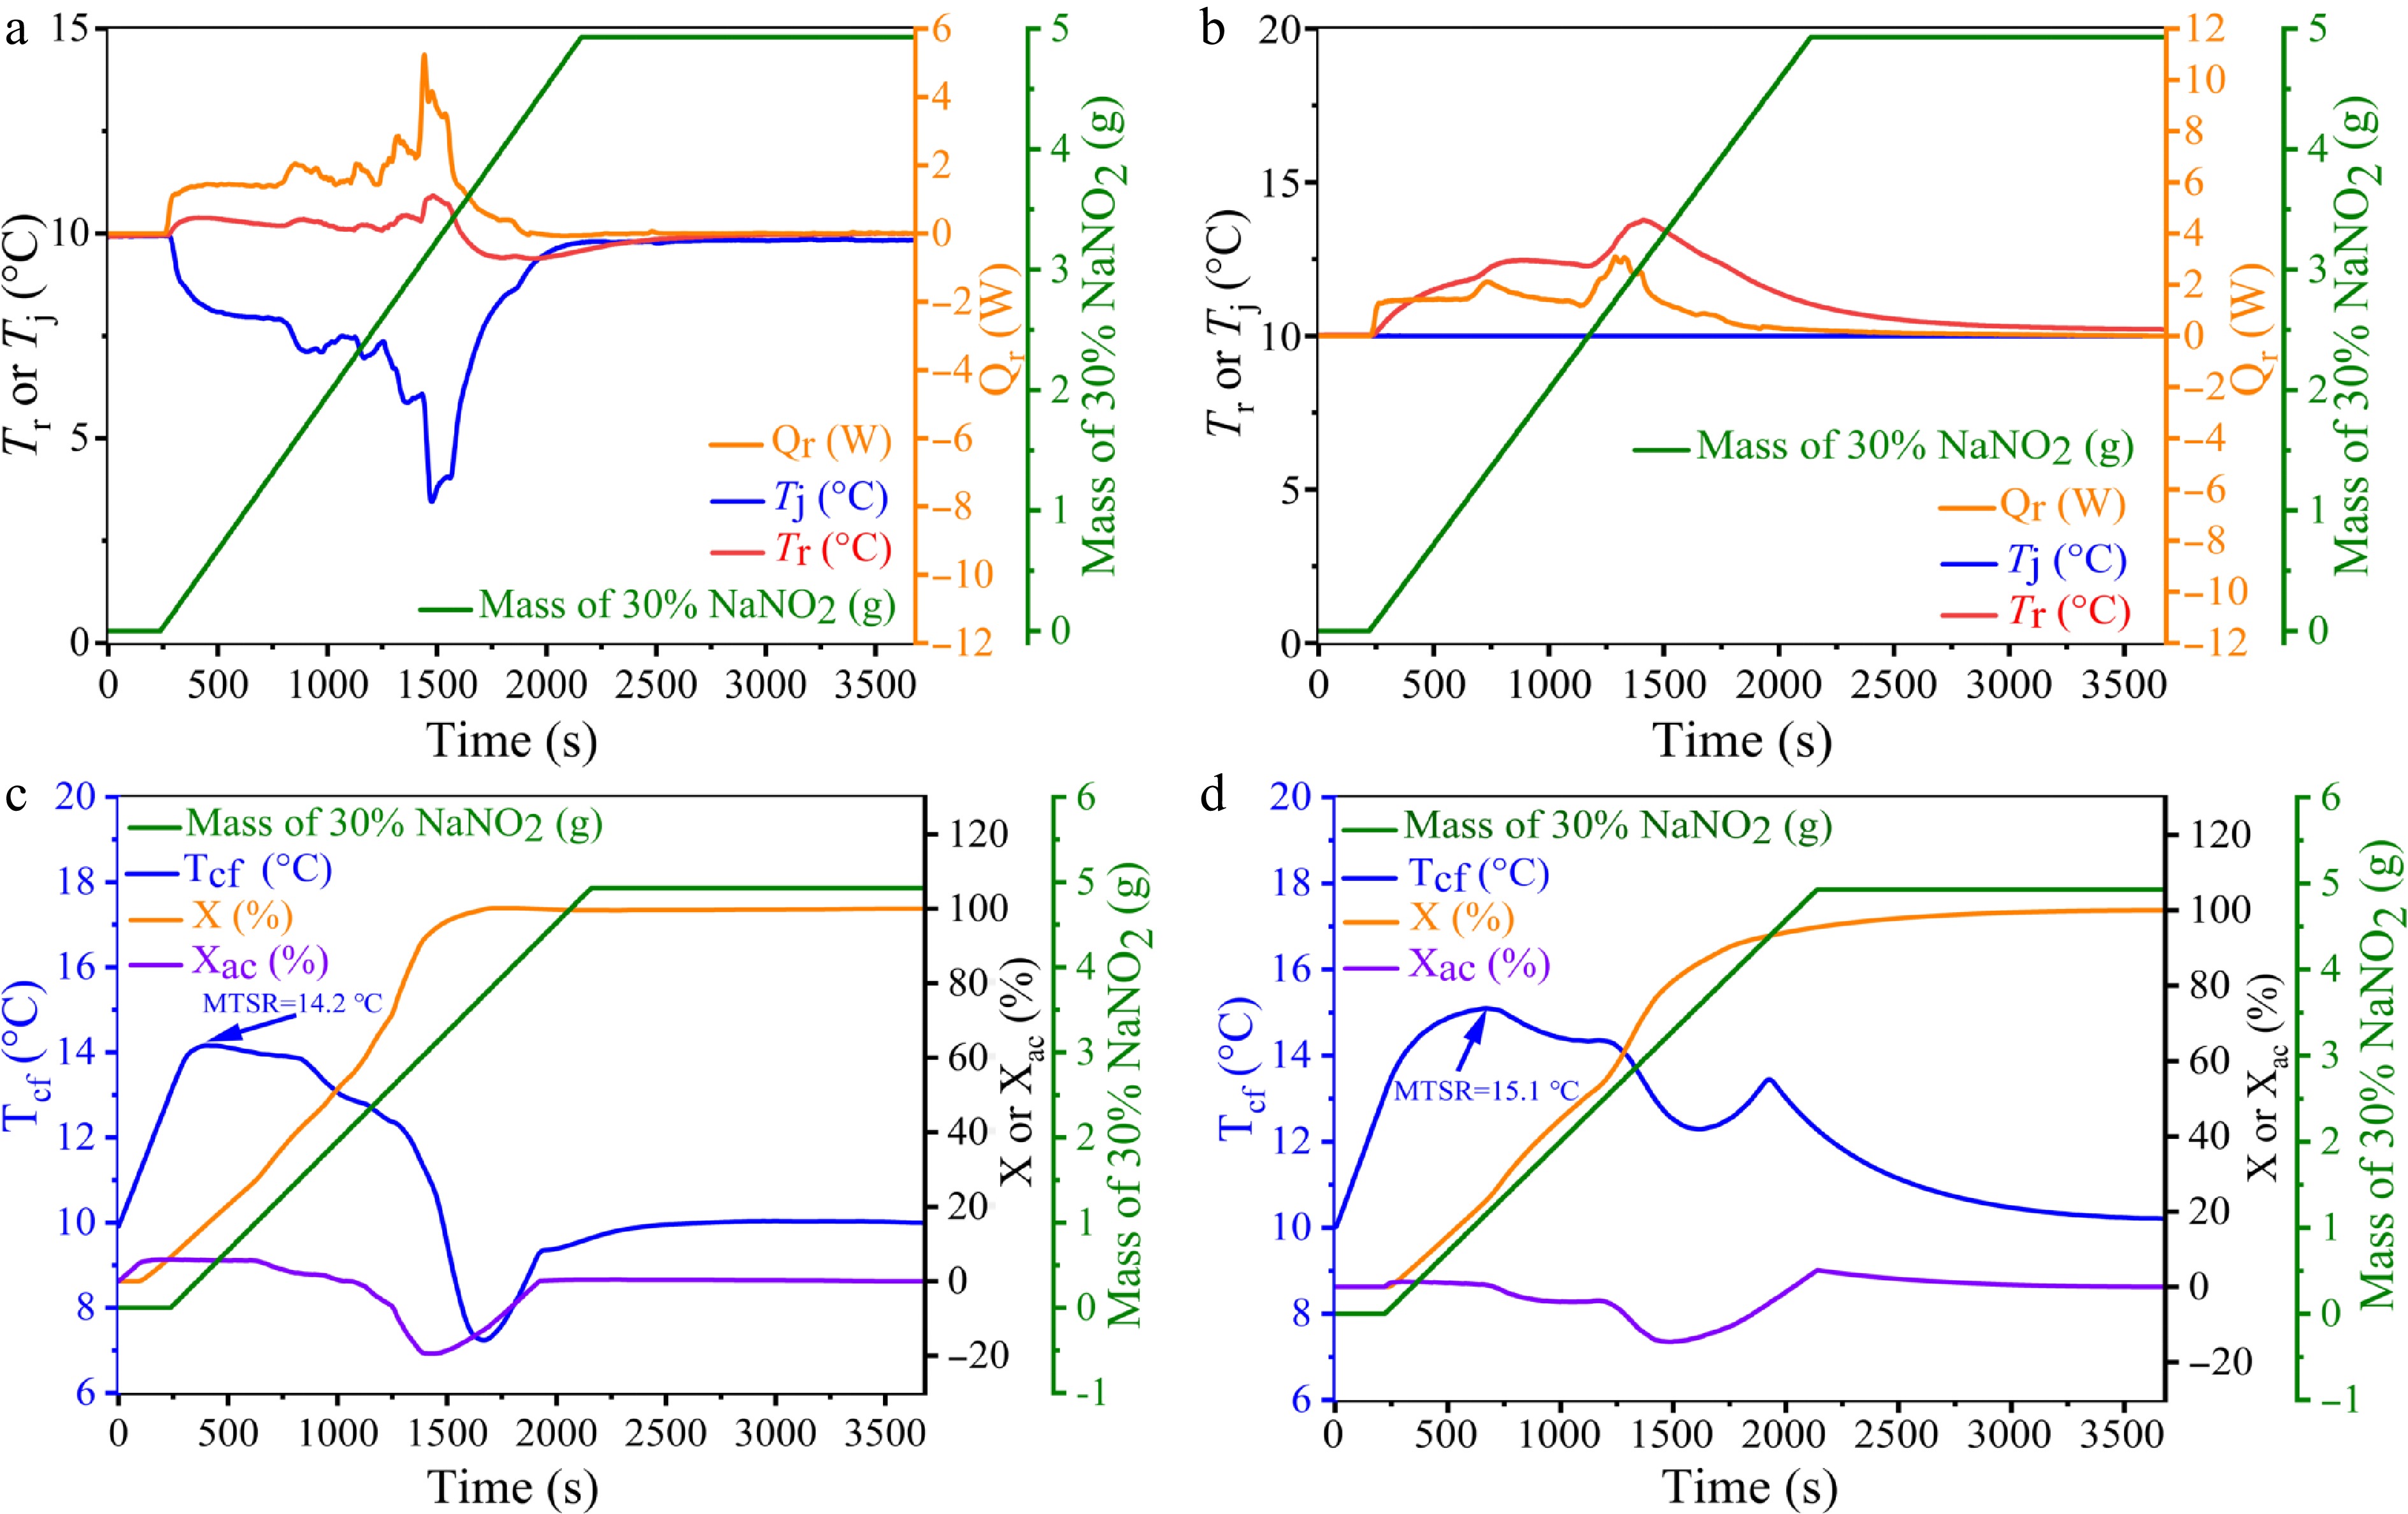
Figure 3.
Curves showing the changes in Tr, Tj, Qr, and the amount of 30% NaNO2 solution added under the Tr and Tj modes during the 2-ANDSA diazotization reaction. (c), (d) Trend graphs of Tcf, X, Xac, and the amount of 30% NaNO2 solution added under the Tr and Tj modes during the 2-ANDSA diazotization reaction.
-
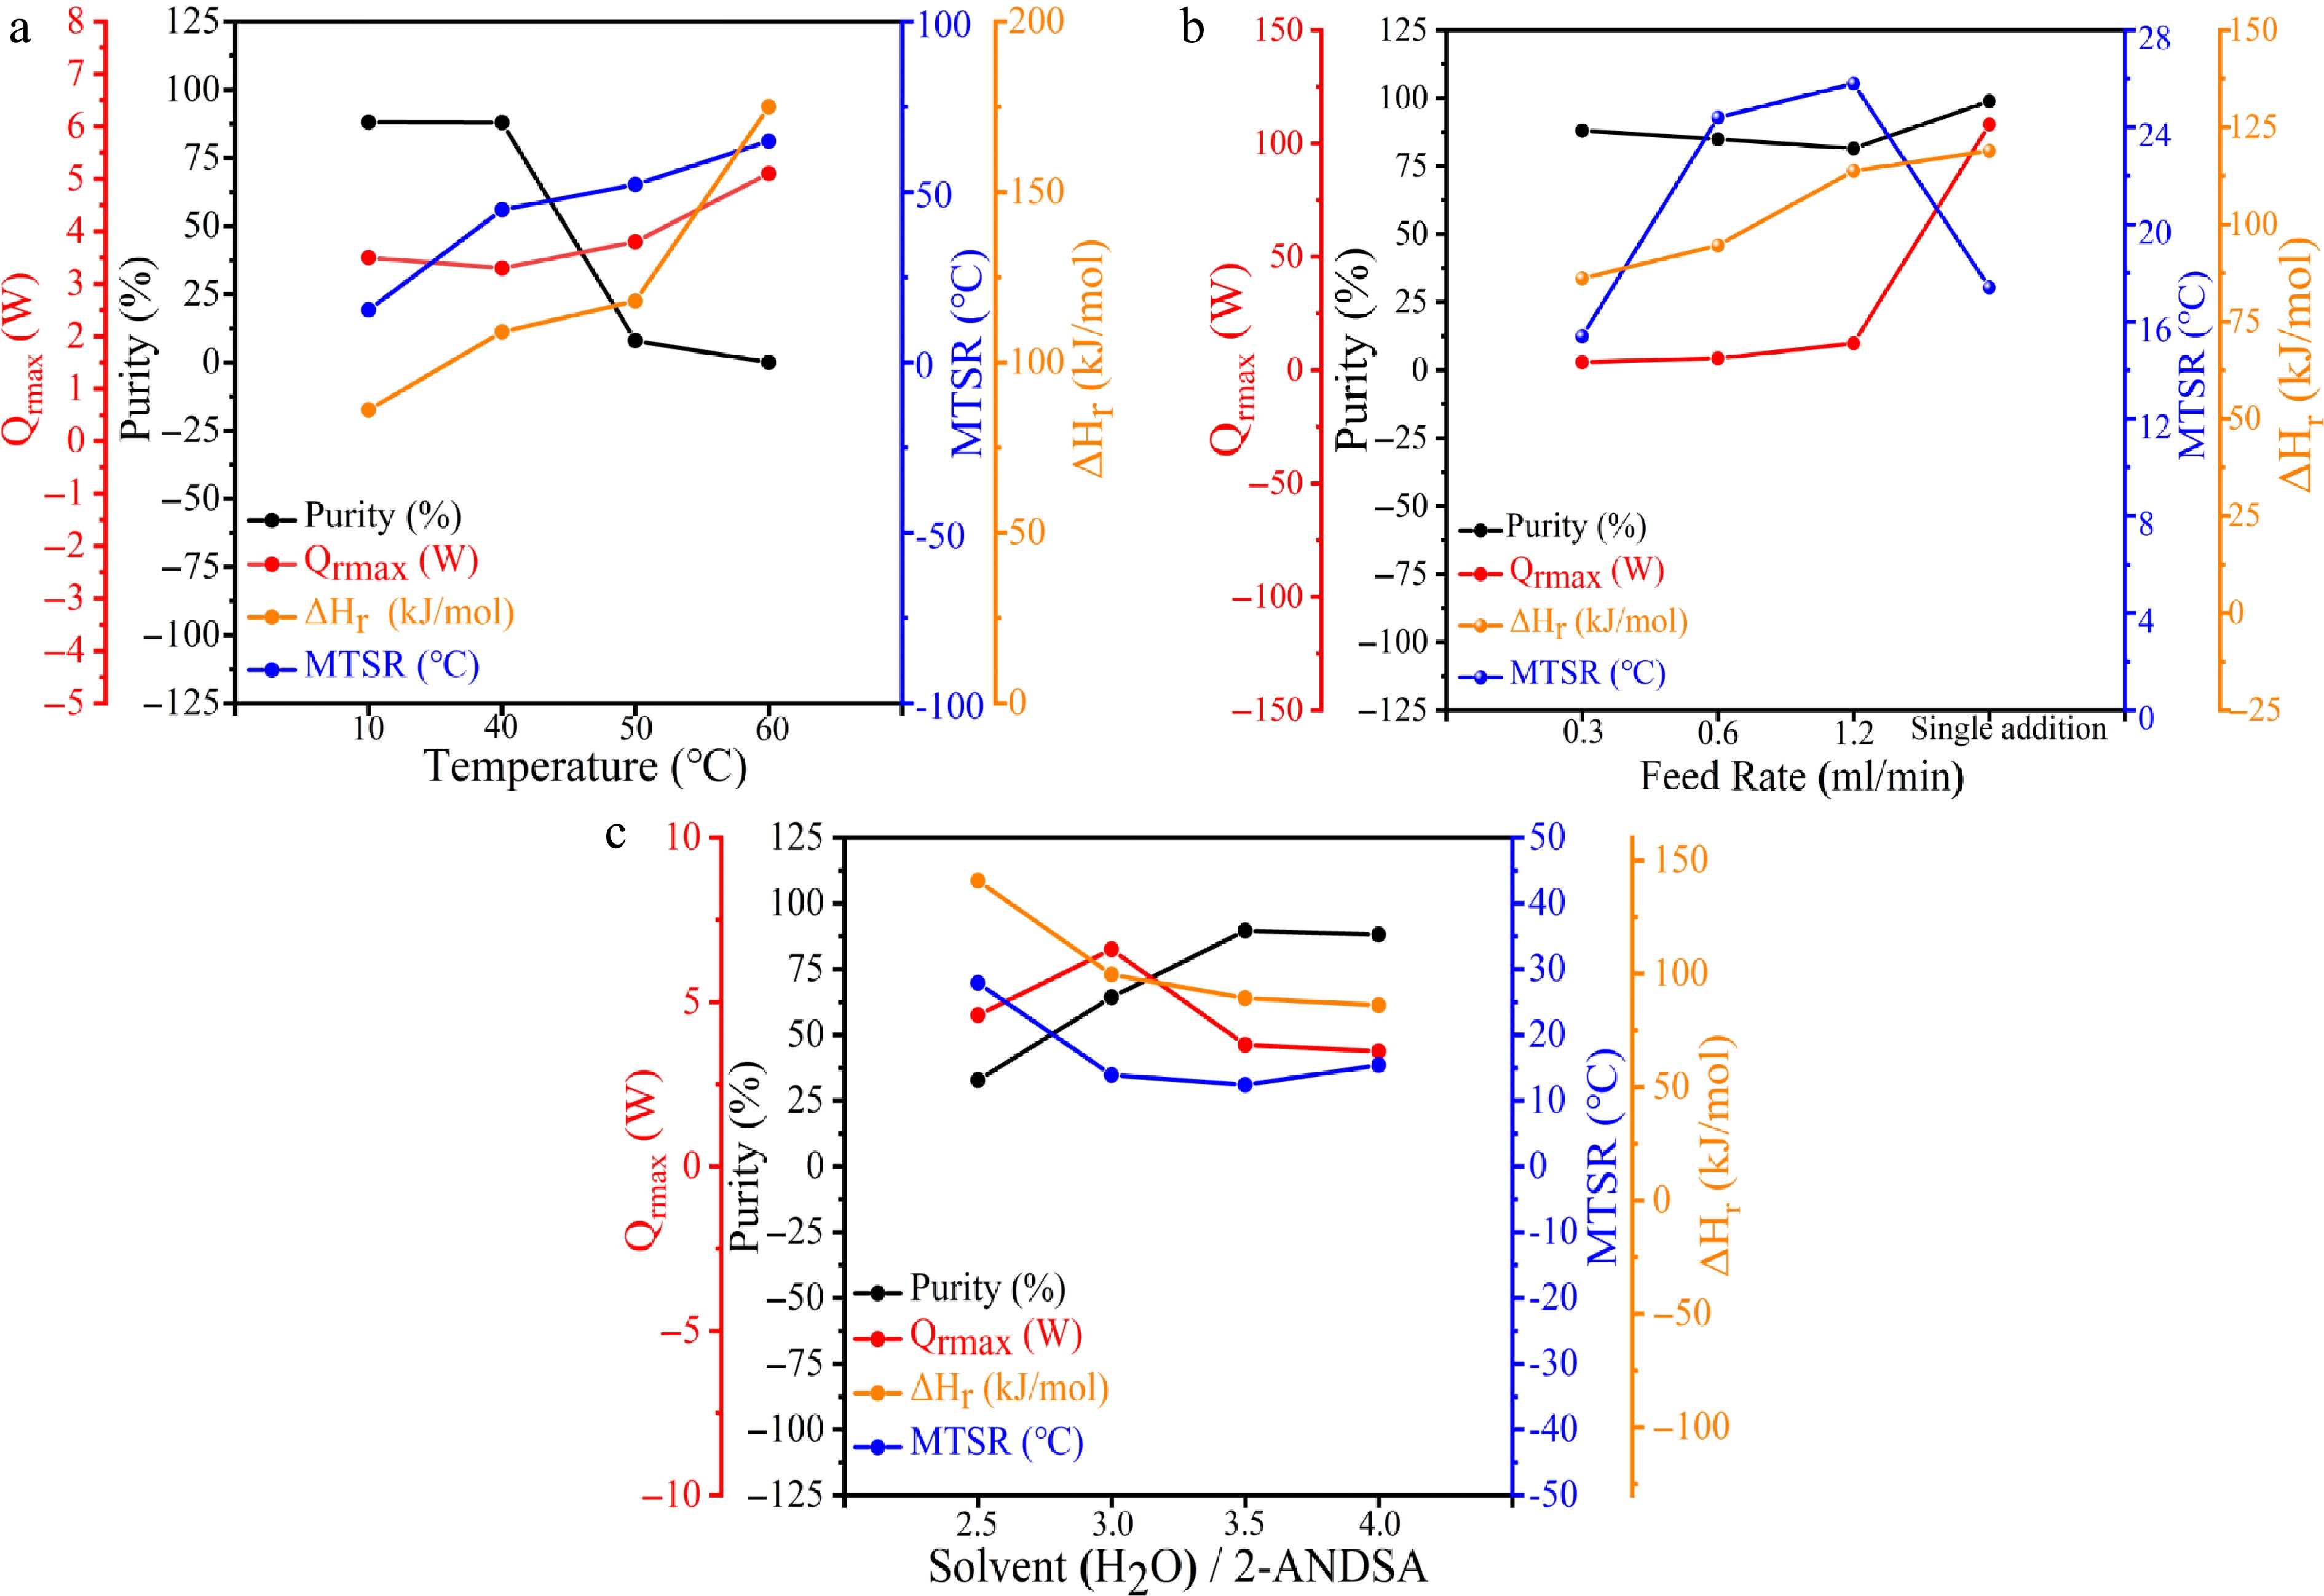
Figure 4.
Quantitative representation of purity and thermal risk parameters in the 2-ANDSA diazotization reaction under abnormal conditions. (a) High temperature, (b) high feeding rate, (c) low solvent (H2O)/2-ANDSA ratio.
-
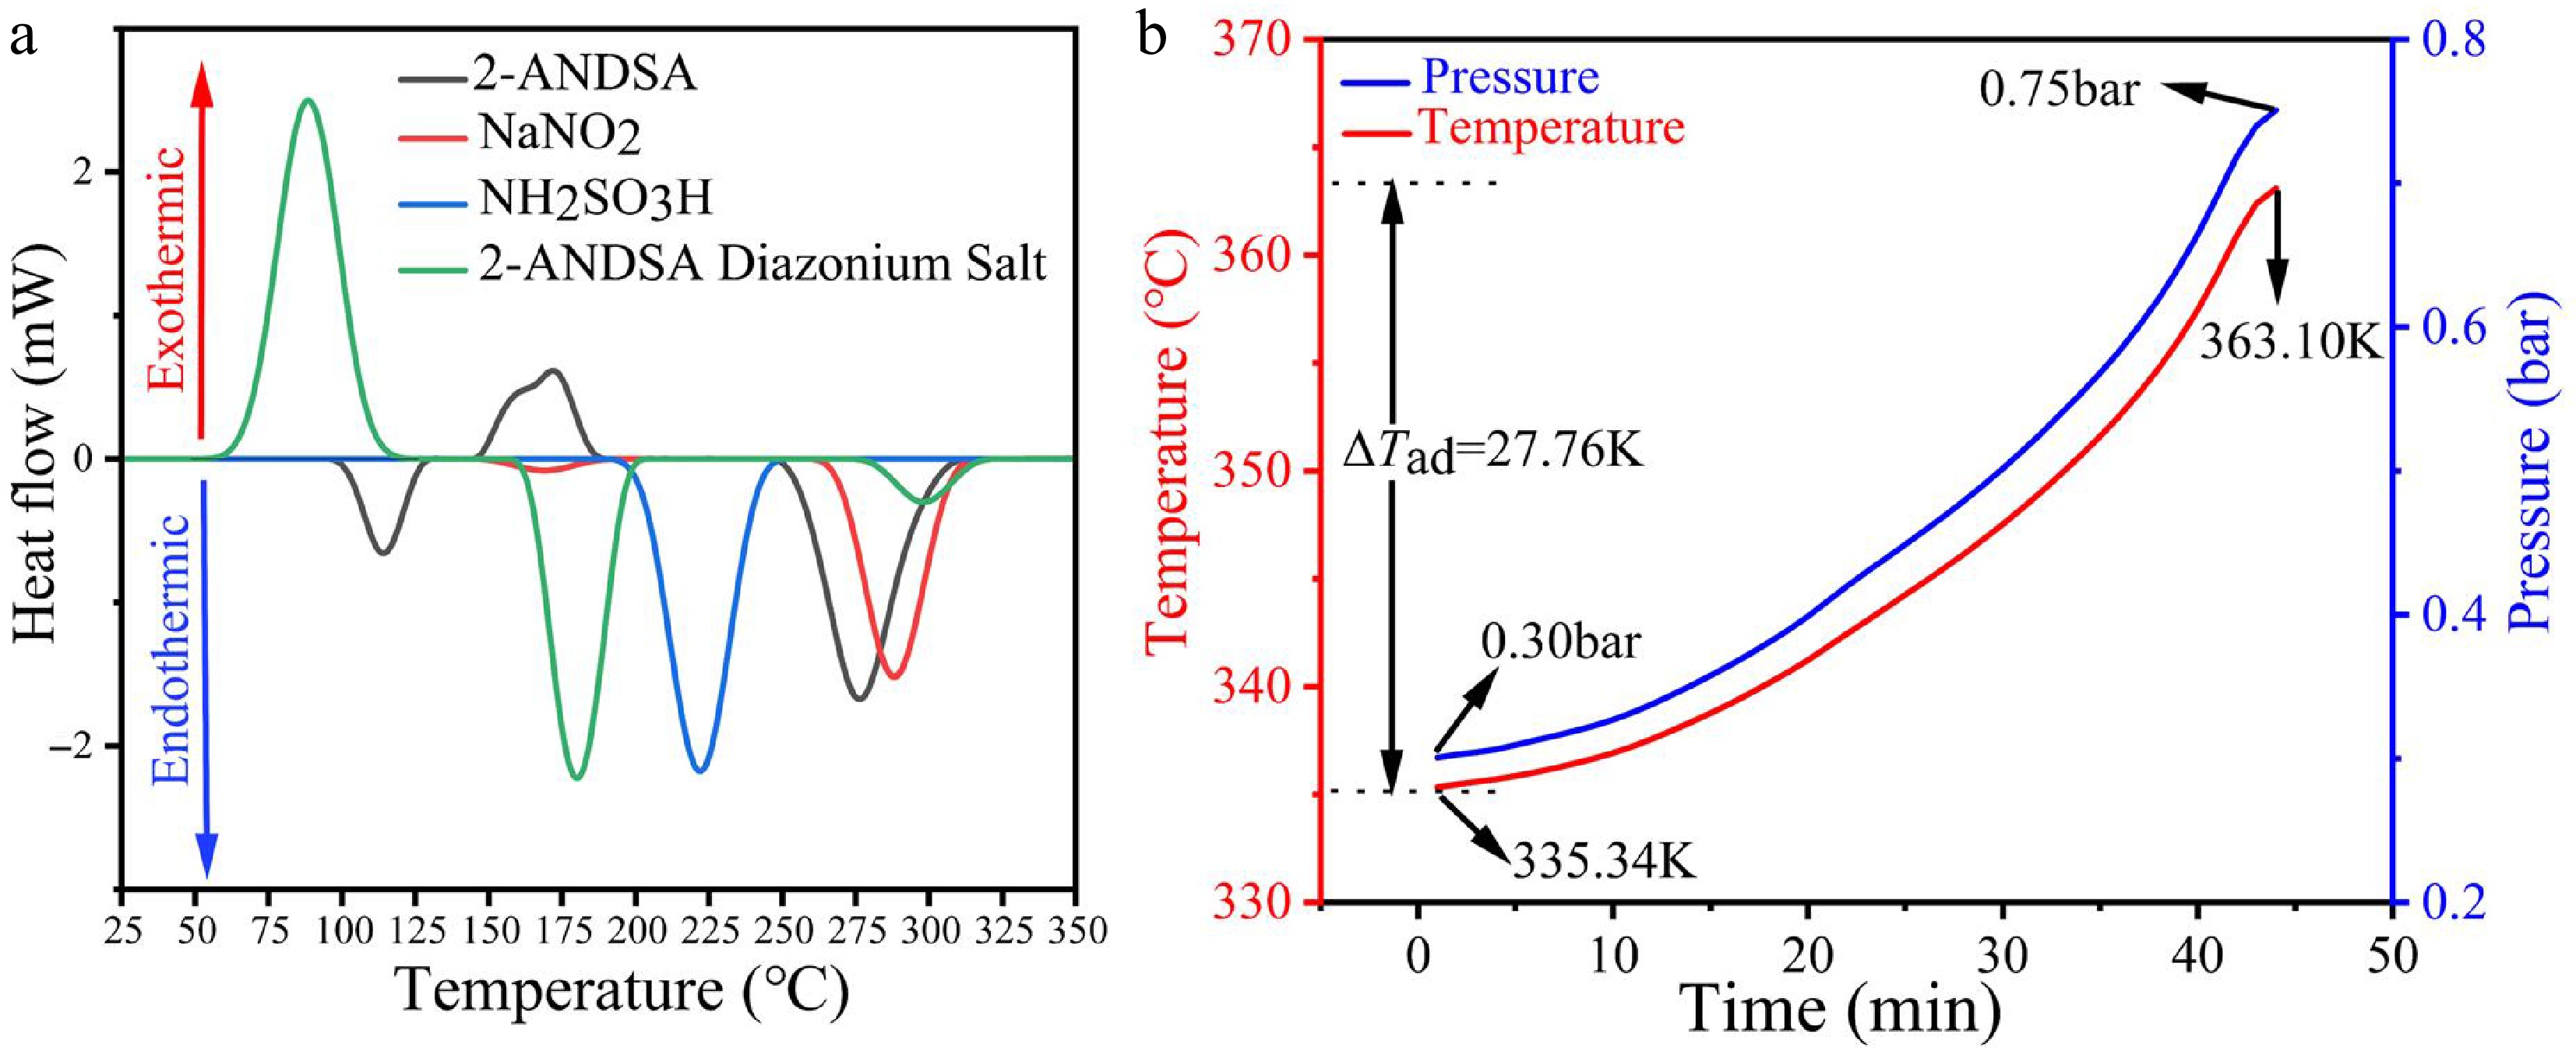
Figure 5.
Thermal behavior and hazard assessment of 2-ANDSA diazonium salt. (a) DSC thermograms of 2-ANDSA, NaNO2, NH2SO3H, and 2-ANDSA diazonium salt. (b) Adiabatic temperature and pressure profiles of 2-ANDSA diazonium salt in ARC.
-
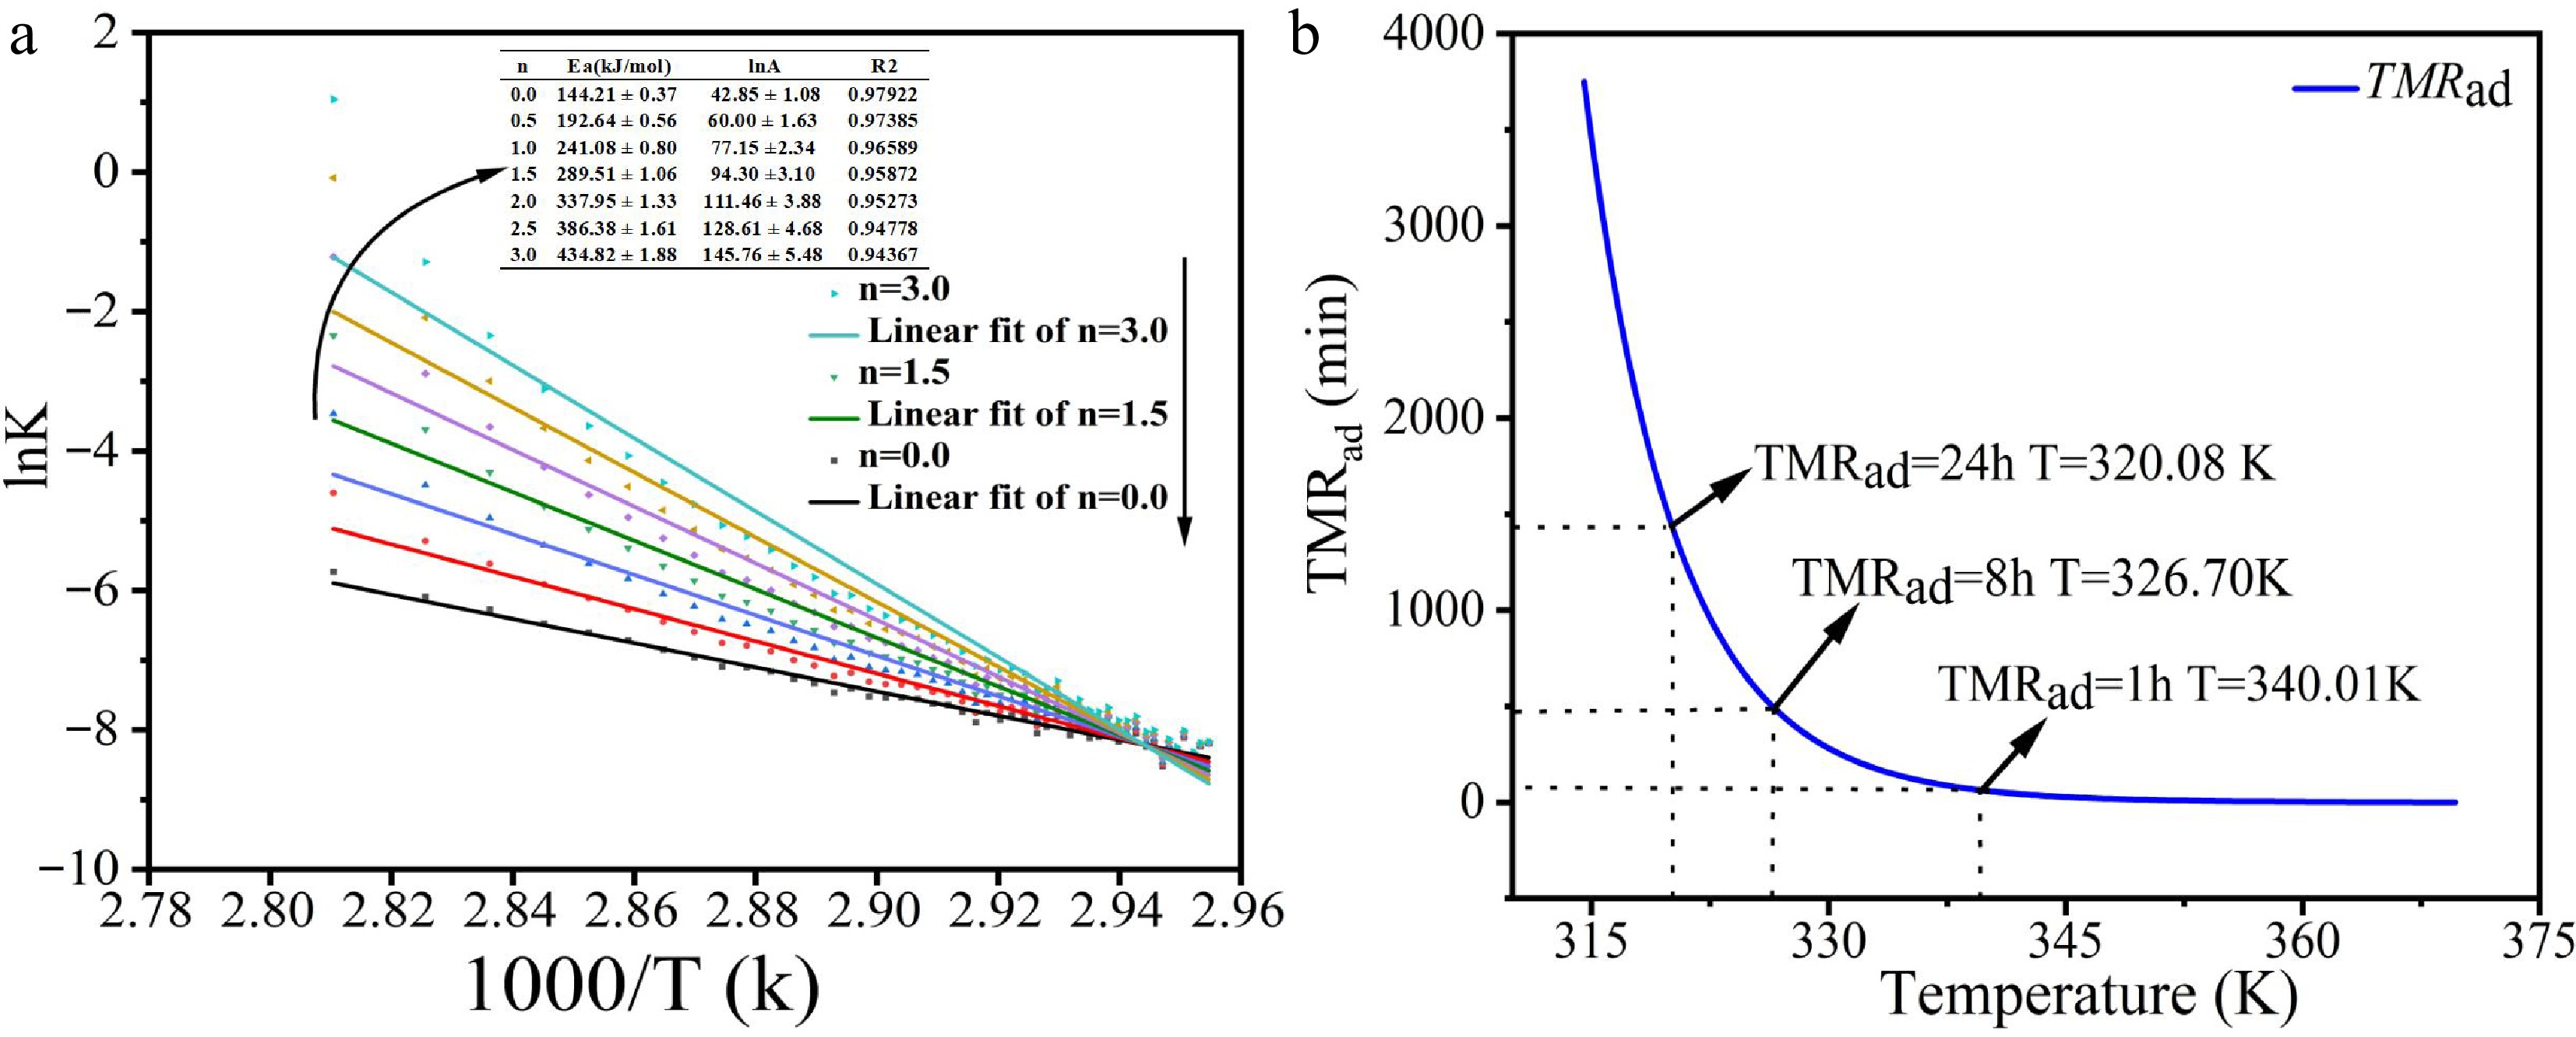
Figure 6.
(a) Arrhenius plots (lnk vs 1/T) for various reaction orders. (b) TMRad vs temperature curves under adiabatic conditions.
-
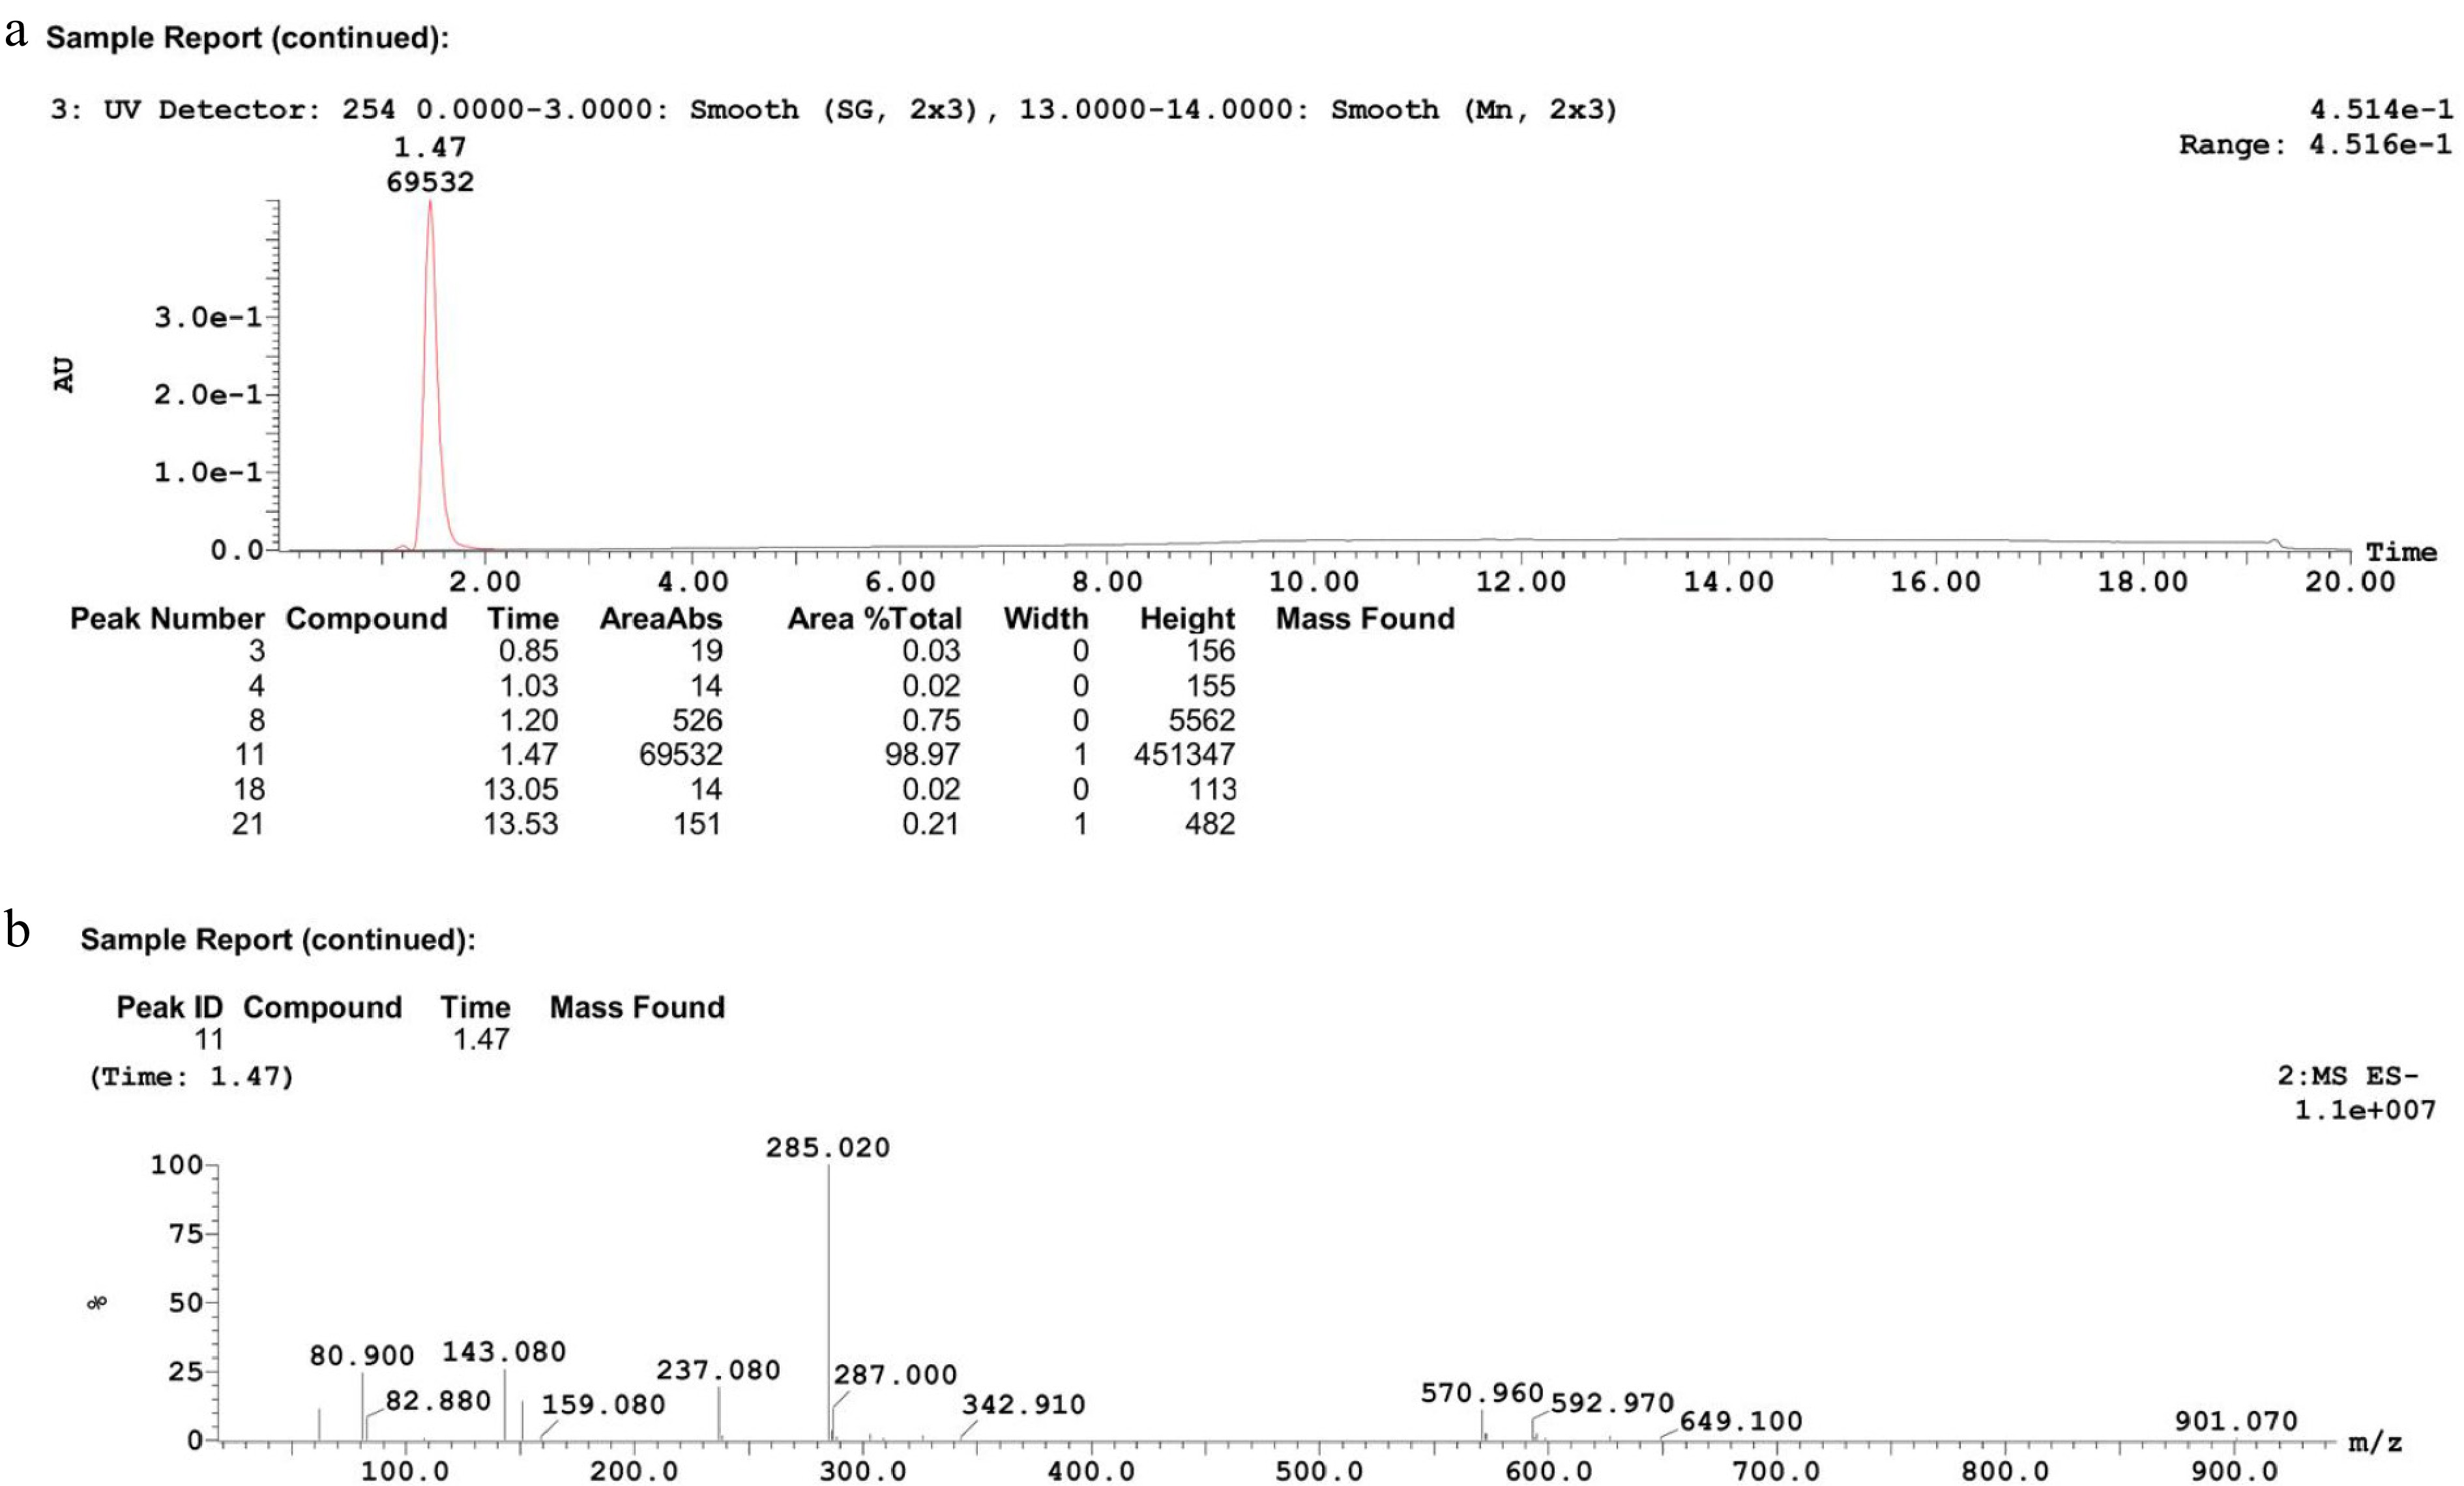
Figure 7.
Characterization of product after centrifugation. (a) HPLC chromatogram, (b) mass spectrum.
-
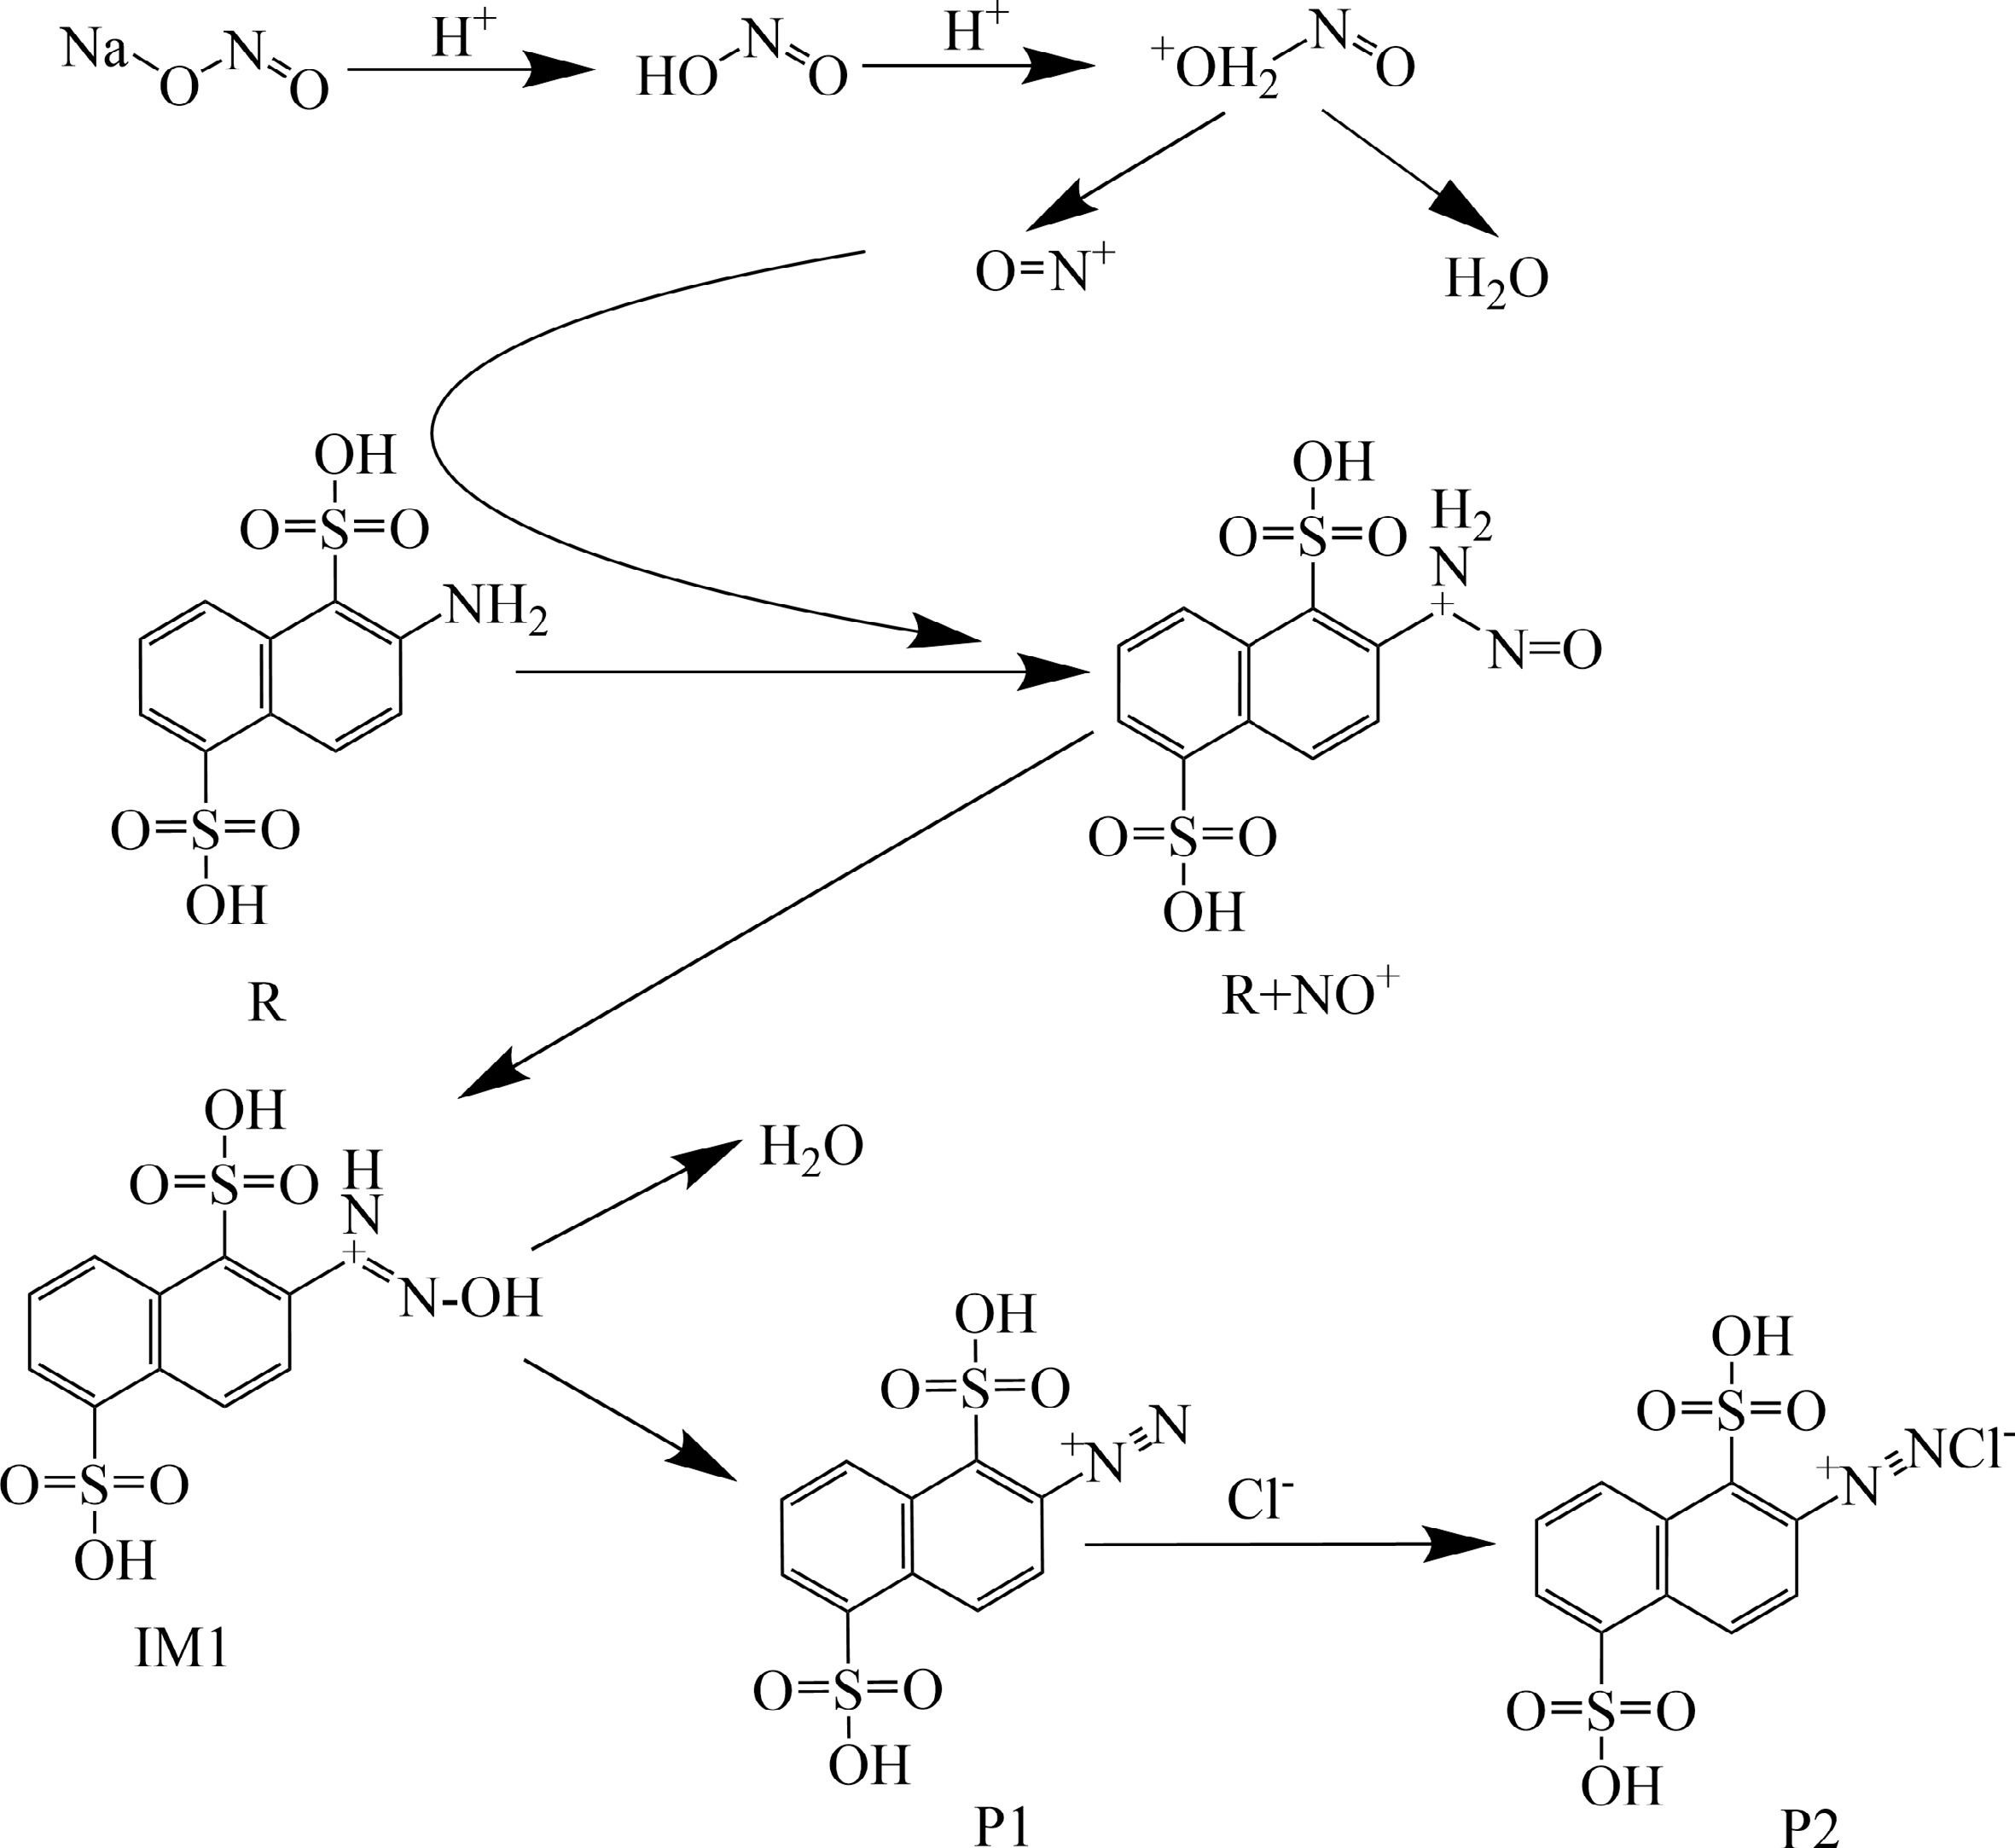
Figure 1.
Proposed reaction mechanism for the diazotization of 2-ANDSA.
-
Figure 8.
Energy profile for reaction steps 4–5.
-
Figure 9.
ESP surface potential distribution of 2-ANDSA molecule.
-
Figure 10.
(a) Transition states (TS1 and TS2) in diazotization. (b) Linear relationship of ink vs 1/T for each elementary reaction.
-
Exp no. T (°C) Feed rate (mL/min) HCl/2-ANDSA NaNO2/
2-ANDSASR (rpm) Mode 1 0 0.1 2 1 300 Tr 2 10 0.1 2 1 300 Tr 3 20 0.1 2 1 300 Tr 4 30 0.1 2 1 300 Tr 5 10 0.15 2 1 300 Tr 6 10 0.2 2 1 300 Tr 7 10 0.25 2 1 300 Tr 8 10 0.15 2.2 1 300 Tr 9 10 0.15 2.4 1 300 Tr 10 10 0.15 2.6 1 300 Tr 11 10 0.15 2.4 1.1 300 Tr 12 10 0.15 2.4 1.2 300 Tr 13 10 0.15 2.4 1.3 300 Tr 14 10 0.15 2.4 1 200 Tr 15 10 0.15 2.4 1 400 Tr 16 10 0.15 2.4 1 500 Tr 17 10 0.15 2.4 1 400 Tj Table 1.
Single-factor optimization of 2-ANDSA diazotization.
-
Exp no. Purity (%) Qrmax (W) MTSR (°C) ∆Hr (kJ/mol) 1 95.2 2.3 1.1 115.6 2 95.6 2.5 11.5 125.2 3 93.5 3.0 31.0 125.6 4 91.9 3.0 34.4 129.6 5 95.6 3.0 12.2 126.1 6 94.0 5.1 15.2 123.8 7 88.0 5.8 16.0 103.8 8 95.7 3.1 11.5 127.5 9 96.7 2.9 11.0 127.4 10 96.8 3.3 11.4 121.5 11 92.3 5.2 11.2 114.5 12 91.2 5.8 11.5 115.3 13 91.2 6.5 10.8 120.0 14 95.0 3.2 11.7 126.6 15 97.0 5.2 14.2 125.1 16 97.7 6.0 13.8 122.2 17 97.1 3.1 15.1 122.2 Table 2.
Purity and key thermal risk parameters.
-
Exp no. T (°C) Feed rate (mL/min) Solvent (H2O)/2-ANDSA 1 10 0.3 4 2 40 0.3 4 3 50 0.3 4 4 60 0.3 4 5 10 0.6 4 6 10 1.2 4 7 10 Single addition (—) 4 8 10 0.3 2.5 9 10 0.3 3.0 10 10 0.3 3.5 Table 3.
Single-factor conditions for abnormal diazotization of 2-ANDSA.
-
Exp no. Purity (%) Qrmax (W) MTSR ( °C) ΔHr (kJ/mol) 1 88.1 3.5 15.4 86.1 2 88.0 3.3 44.8 109.0 3 8.0 3.8 52.2 118.0 4 0 5.1 64.9 175.0 5 84.9 5.2 24.4 94.6 6 81.5 11.8 25.8 113.8 7 98.9 108.4 17.4 118.9 8 32.8 4.6 27.9 141.0 9 64.3 6.6 13.9 99.6 10 89.6 3.7 12.4 89.2 Table 4.
Key thermal risk parameters.
-
Chemical Mass (mg) β (°C/min) Range ( °C) 2-ANDSA 5.90 5 20−350 NaNO2 6.00 5 20−350 H3NO3S 5.93 5 20−350 2-ANDSA Diazonium Salt 6.10 5 20−350 Table 5.
DSC experimental conditions.
-
Reaction step ΔH (kJ/mol) ΔG (kJ/mol) (1) $ {\mathit{N}\mathit{a}\mathit{N}\mathit{O}}_{2}+\mathit{H}\mathit{C}\mathit{l}\to \mathit{N}\mathit{a}\mathit{C}\mathit{l}+{\mathit{H}\mathit{N}\mathit{O}}_{2} $ −35.74 −0.01 (2) $ {\mathit{H}\mathit{N}\mathit{O}}_{2}+\mathit{H}\mathit{C}\mathit{l}\to \mathit{N}\mathit{O}\mathit{C}\mathit{l}+{\mathit{H}}_{2}\mathit{O} $ −27.23 −32.55 (3) $ \mathit{N}\mathit{O}\mathit{C}\mathit{l}+{\mathit{C}}_{10}{\mathit{H}}_{9}\mathit{N}{\mathit{O}}_{6}{\mathit{S}}_{2}\to {\mathit{C}}_{10}{\mathit{H}}_{9}{\mathit{O}}_{7}{\mathit{S}}_{2}{\mathit{N}}_{2}^{+}+{\mathit{C}\mathit{l}}^{-} $ 147.79 154.82 (4) $ {\mathit{C}}_{10}{\mathit{H}}_{9}{\mathit{O}}_{7}{\mathit{S}}_{2}{\mathit{N}}_{2}^{+}\to {\mathit{C}}_{10}{\mathit{H}}_{9}{\mathit{O}}_{7}{\mathit{S}}_{2}{\mathit{N}}_{2}^{+} $
(structural rearrangement)79.28 88.78 (5) $ {\mathit{C}}_{10}{\mathit{H}}_{9}{\mathit{O}}_{7}{\mathit{S}}_{2}{\mathit{N}}_{2}^{+}\to {\mathit{C}}_{10}{\mathit{H}}_{7}{{\mathit{O}}_{6}\mathit{S}}_{2}{\mathit{N}}_{2}^{+}+{\mathit{H}}_{2}\mathit{O} $ −108.41 −152.66 (6) $ {\mathit{C}}_{10}{\mathit{H}}_{7}{\mathit{O}}_{6}{\mathit{S}}_{2}{\mathit{N}}_{2}^{+}+{\mathit{C}\mathit{l}}^{-}\to {\mathit{C}}_{10}{\mathit{H}}_{7}{\mathit{C}\mathit{l}\mathit{N}}_{2}{\mathit{O}}_{6}{\mathit{S}}_{2} $ −168.99 −137.27 Table 6.
Enthalpy and Gibbs free energy changes for each reaction step.
-
ΔTad (K) Severity TMRad (h) Possibility Class Thermal hazard
assessment25.22 1 > 24 Seldom 1 acceptable risk Table 7.
Risk matrix for 2-ANDSA diazotization.
-
Tp (°C) MTSR MTT (°C) TD24 (°C) Class 10 14.18 100 46.93 2 Table 8.
Stoessel diagram for 2-ANDSA diazotization.
Figures
(11)
Tables
(8)