-
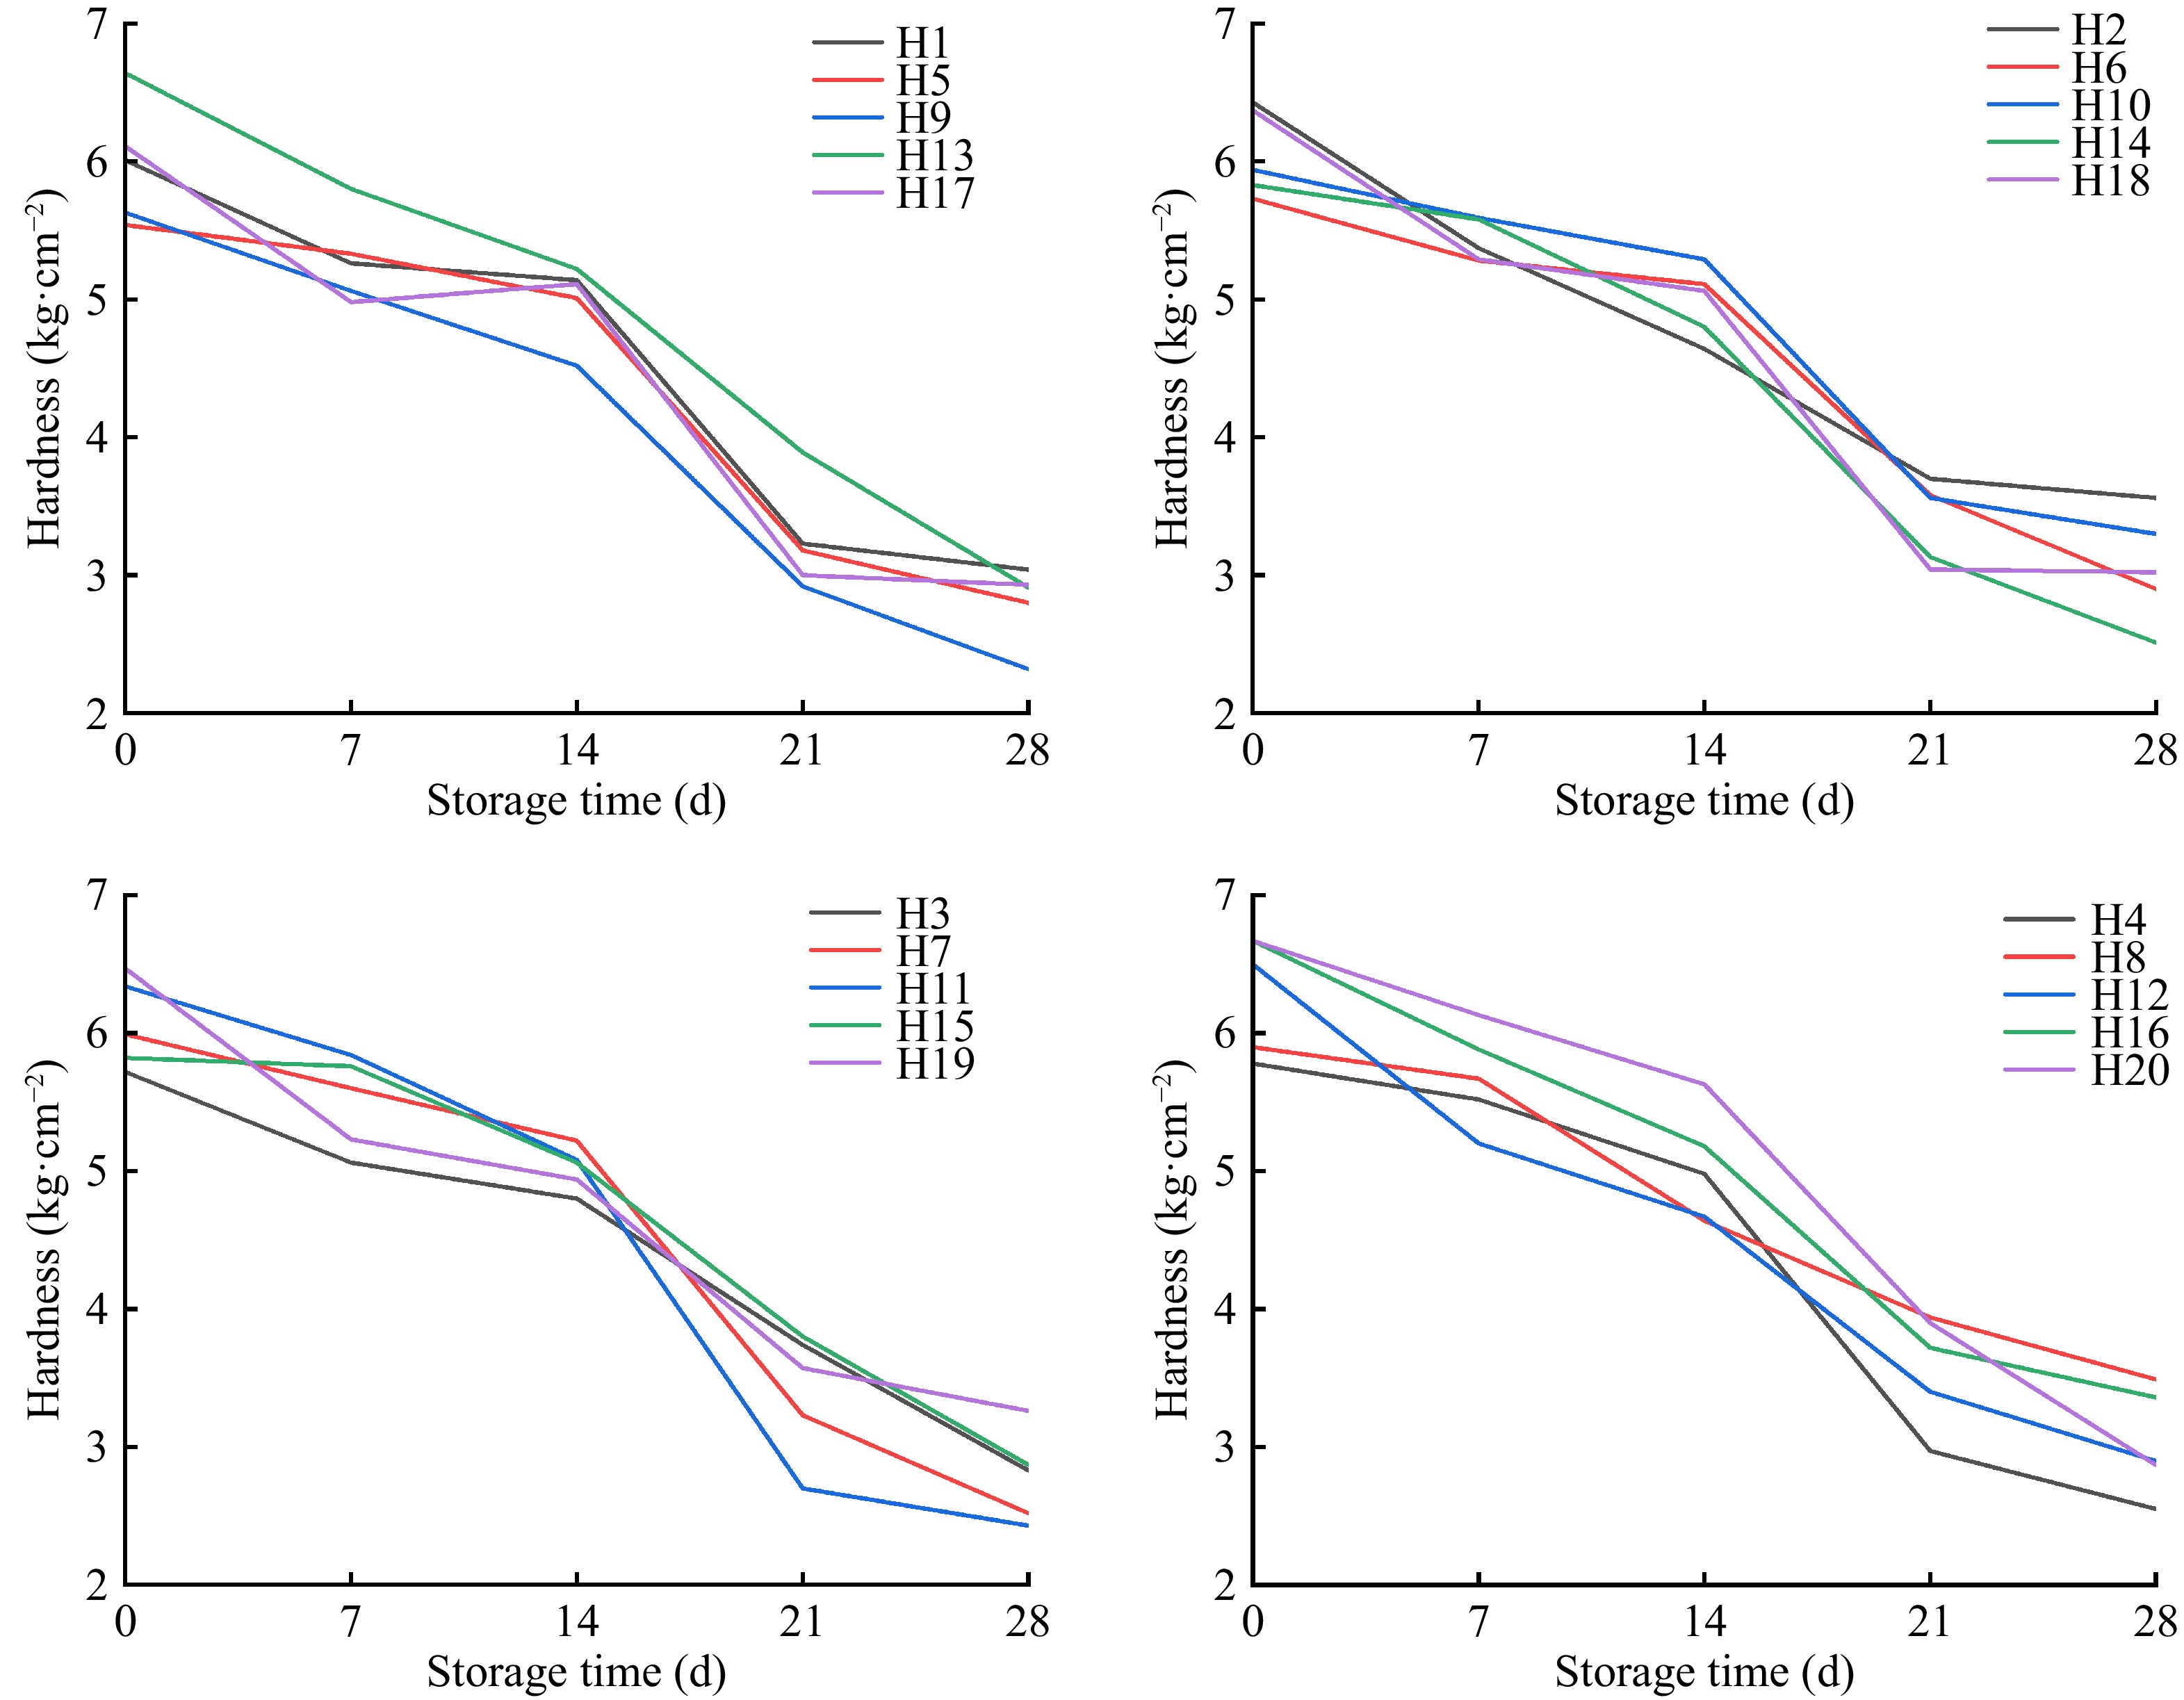
Figure 1.
Changes in hardness and storage time under different water-to-fertilizer ratios.
-
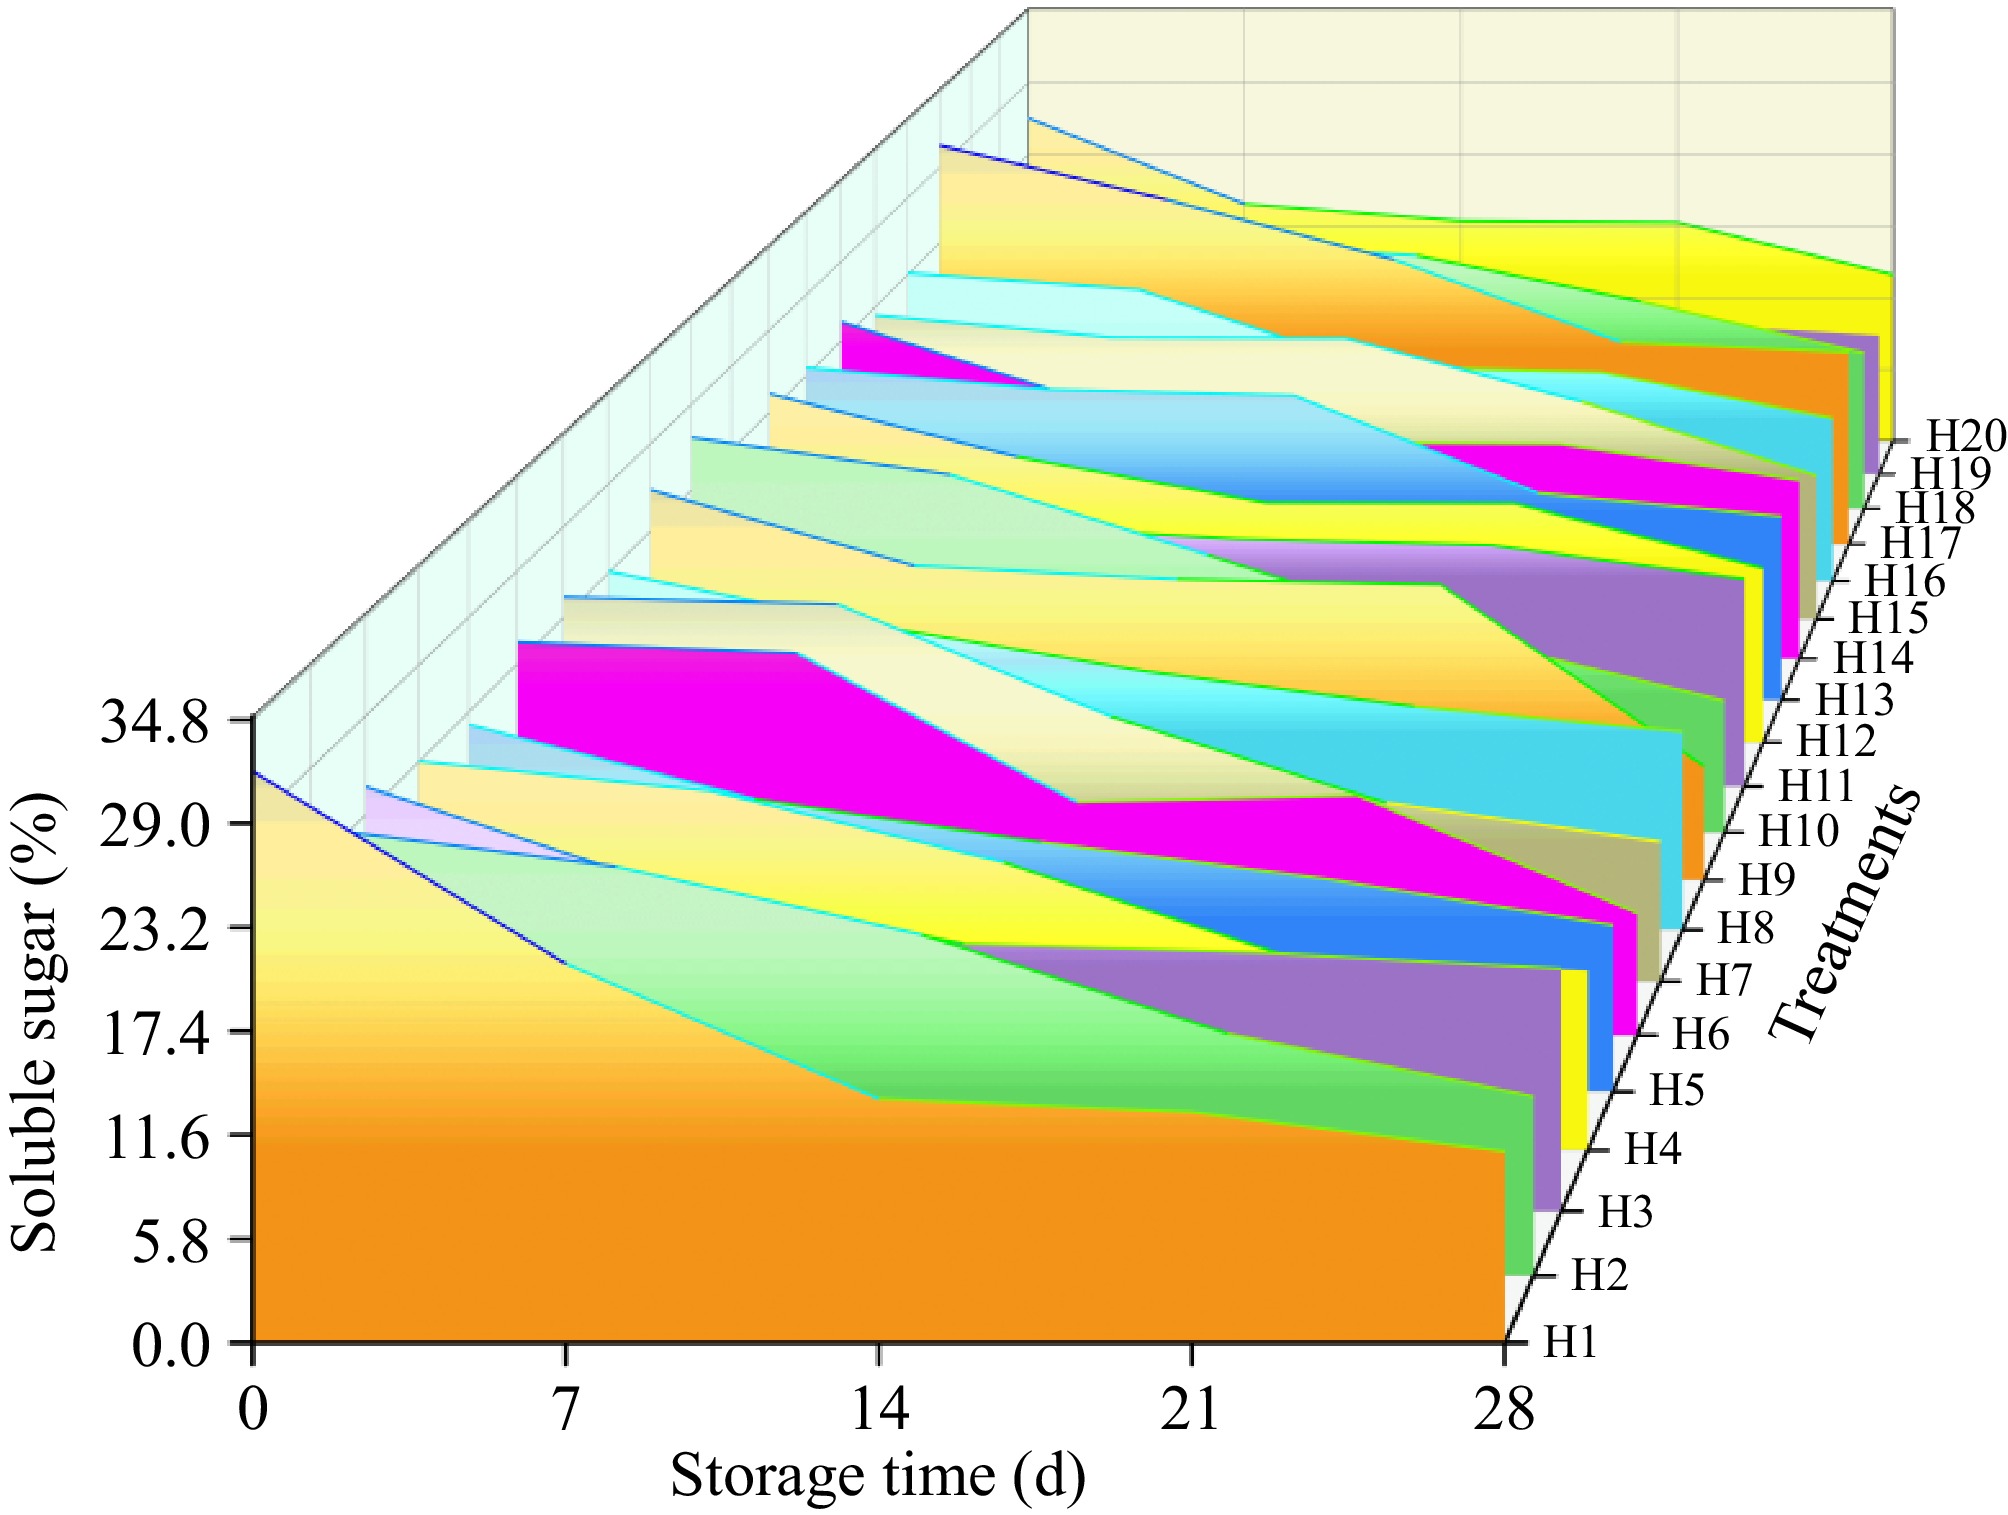
Figure 2.
Changes in soluble sugar and storage time under different water and fertilizer ratios.
-
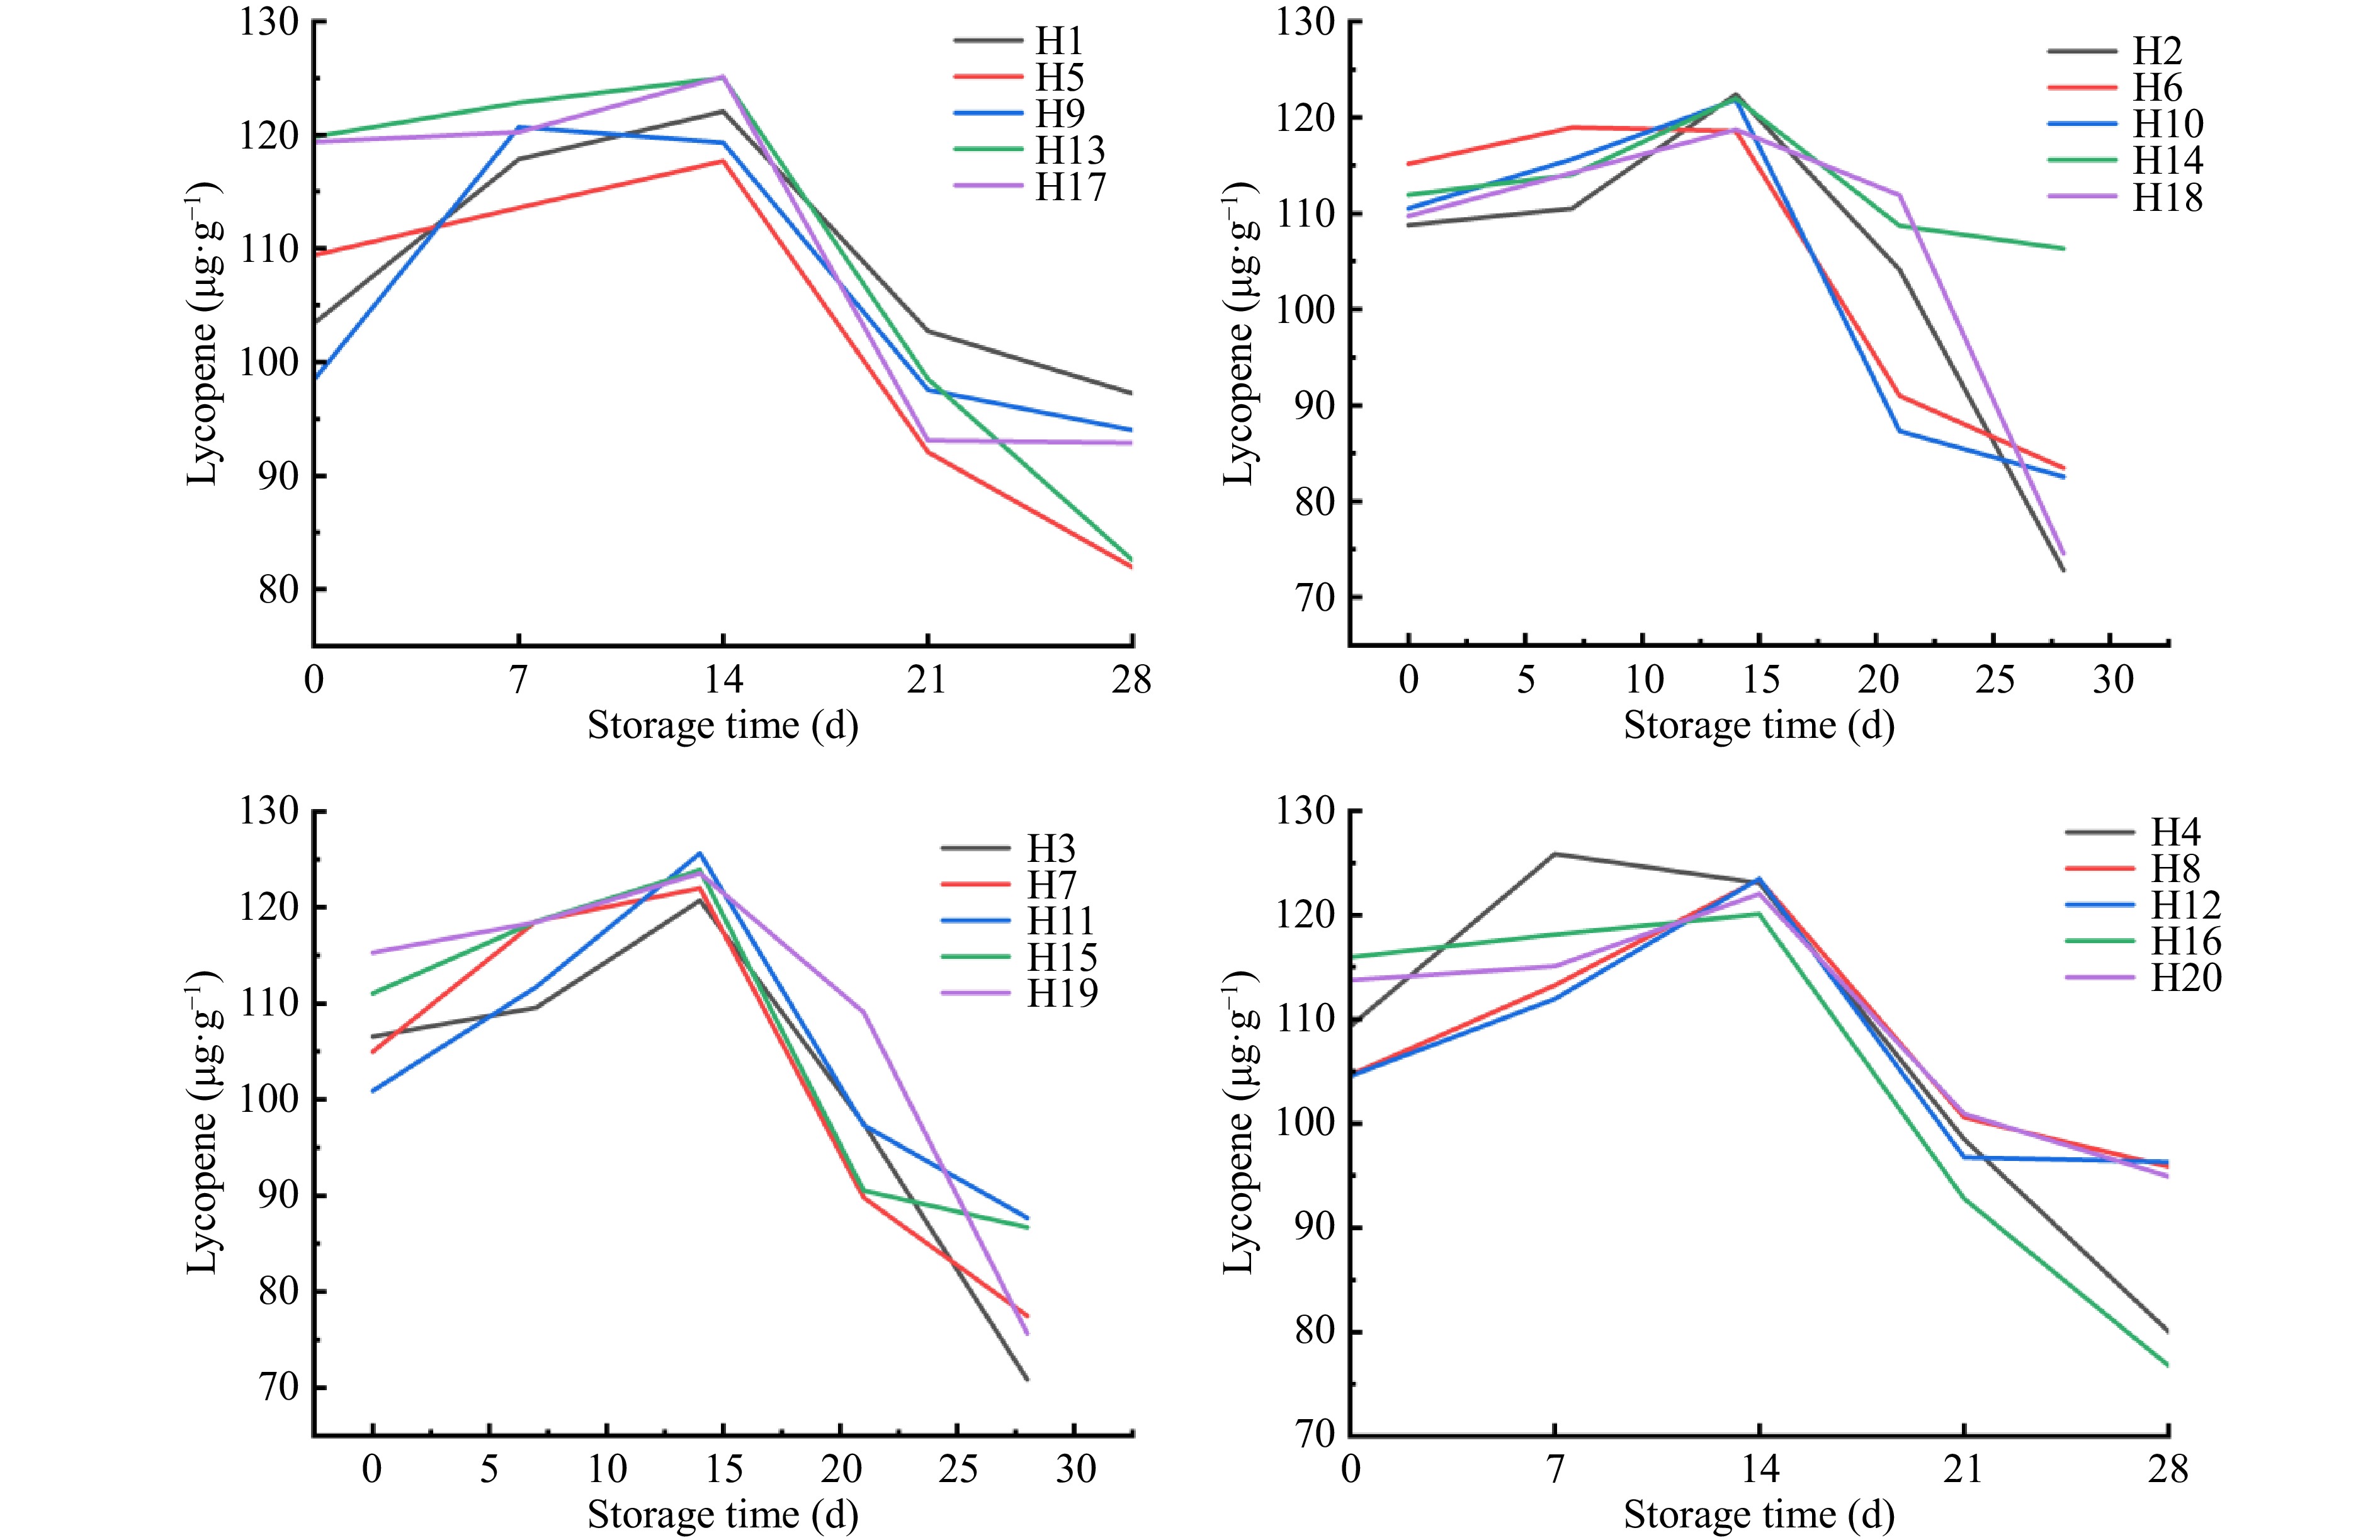
Figure 3.
Effects of storage time on lycopene under different water and fertilizer ratios.
-
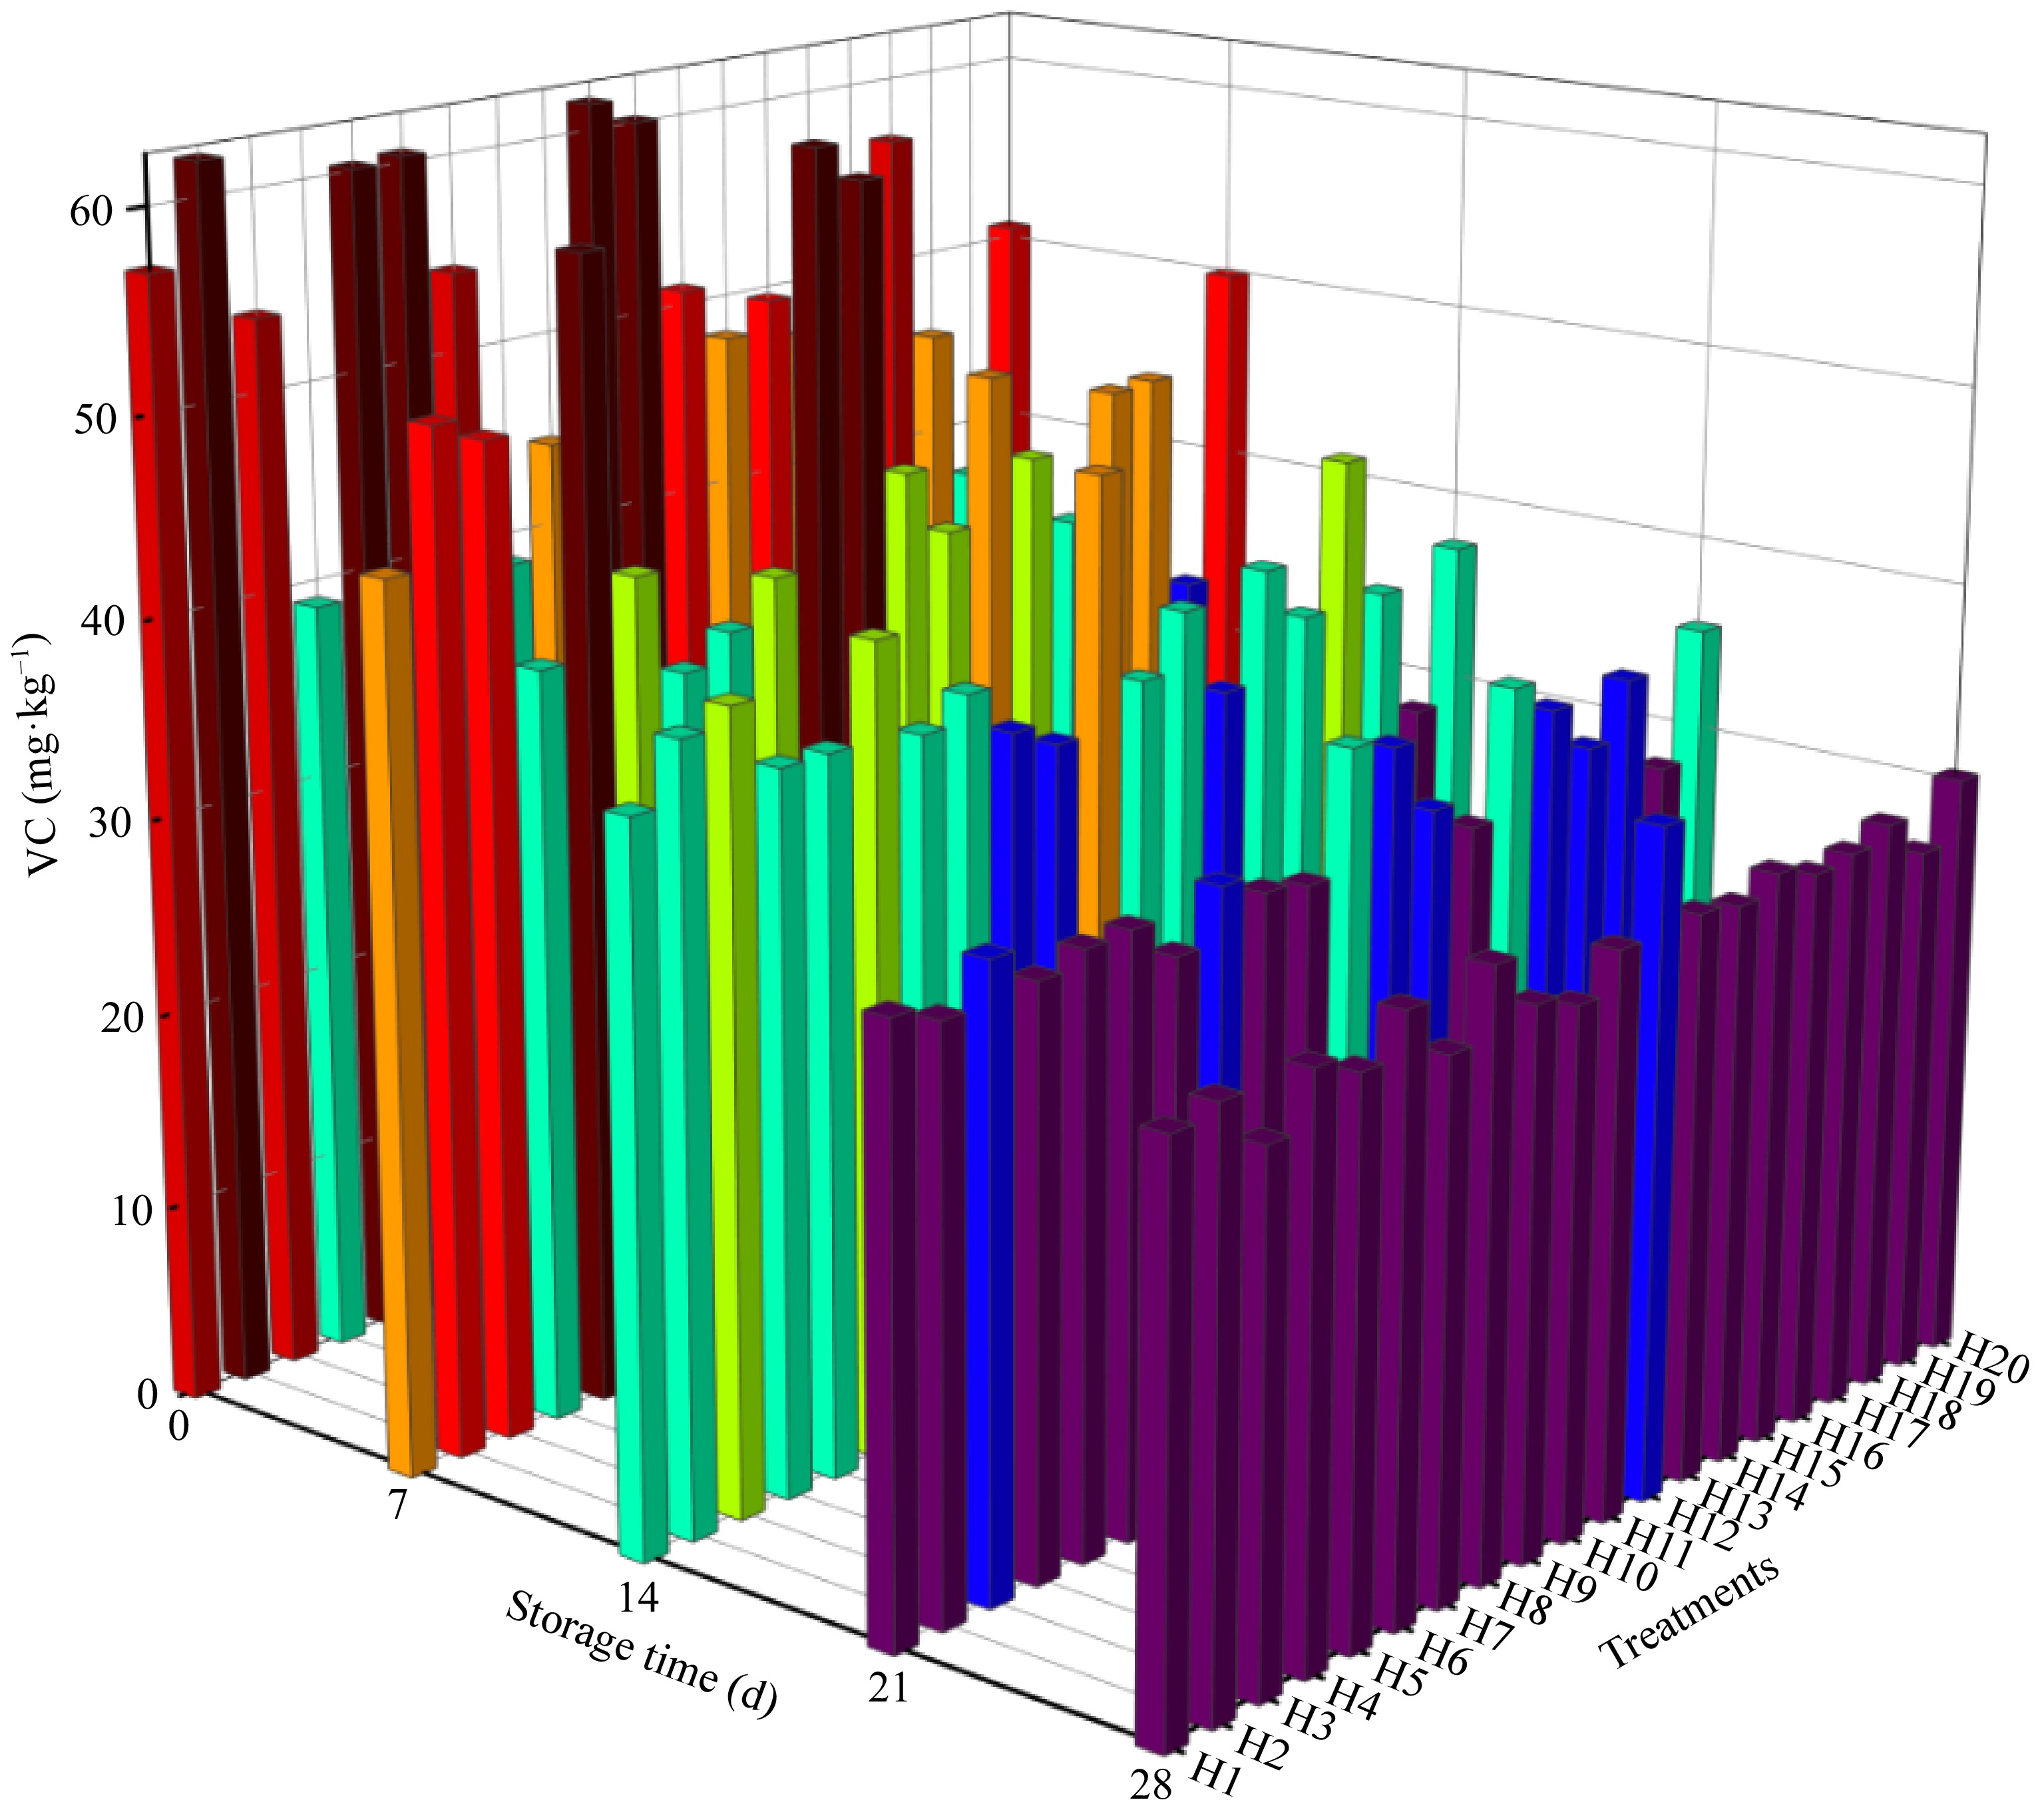
Figure 4.
Changes in vitamin C and storage time under different water and fertilizer ratios.
-
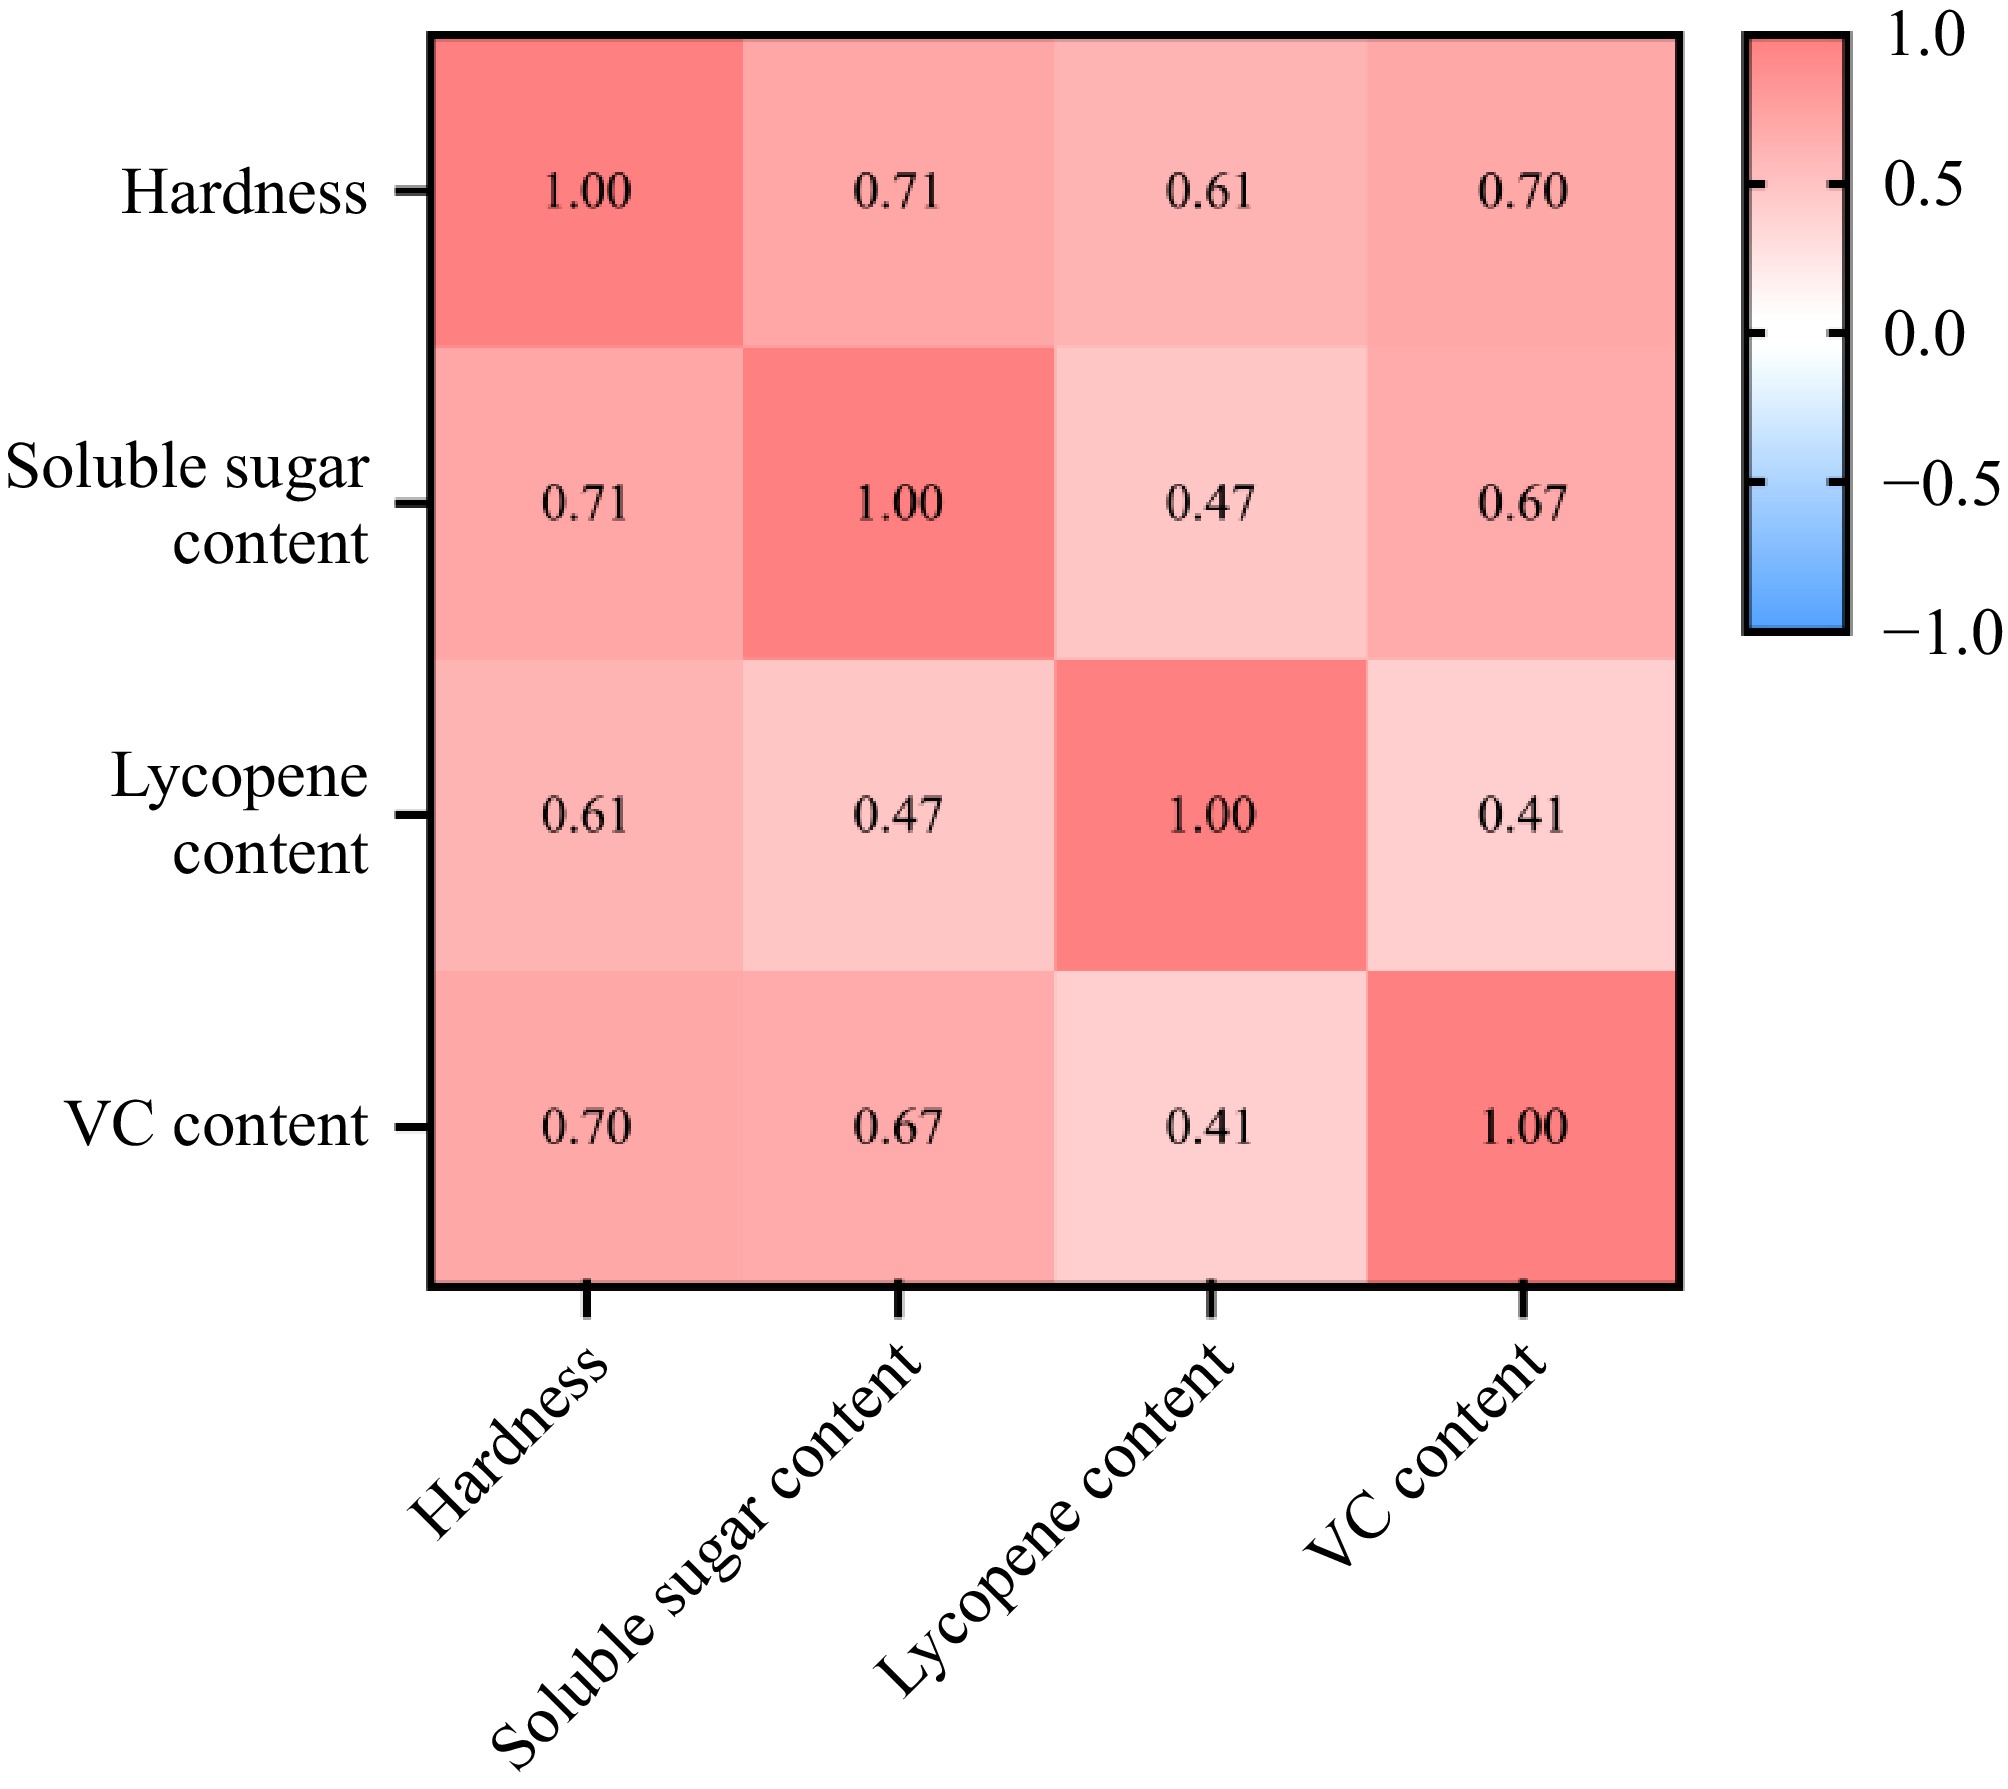
Figure 5.
Correlation of quality indices under different water and fertilizer ratios.
-
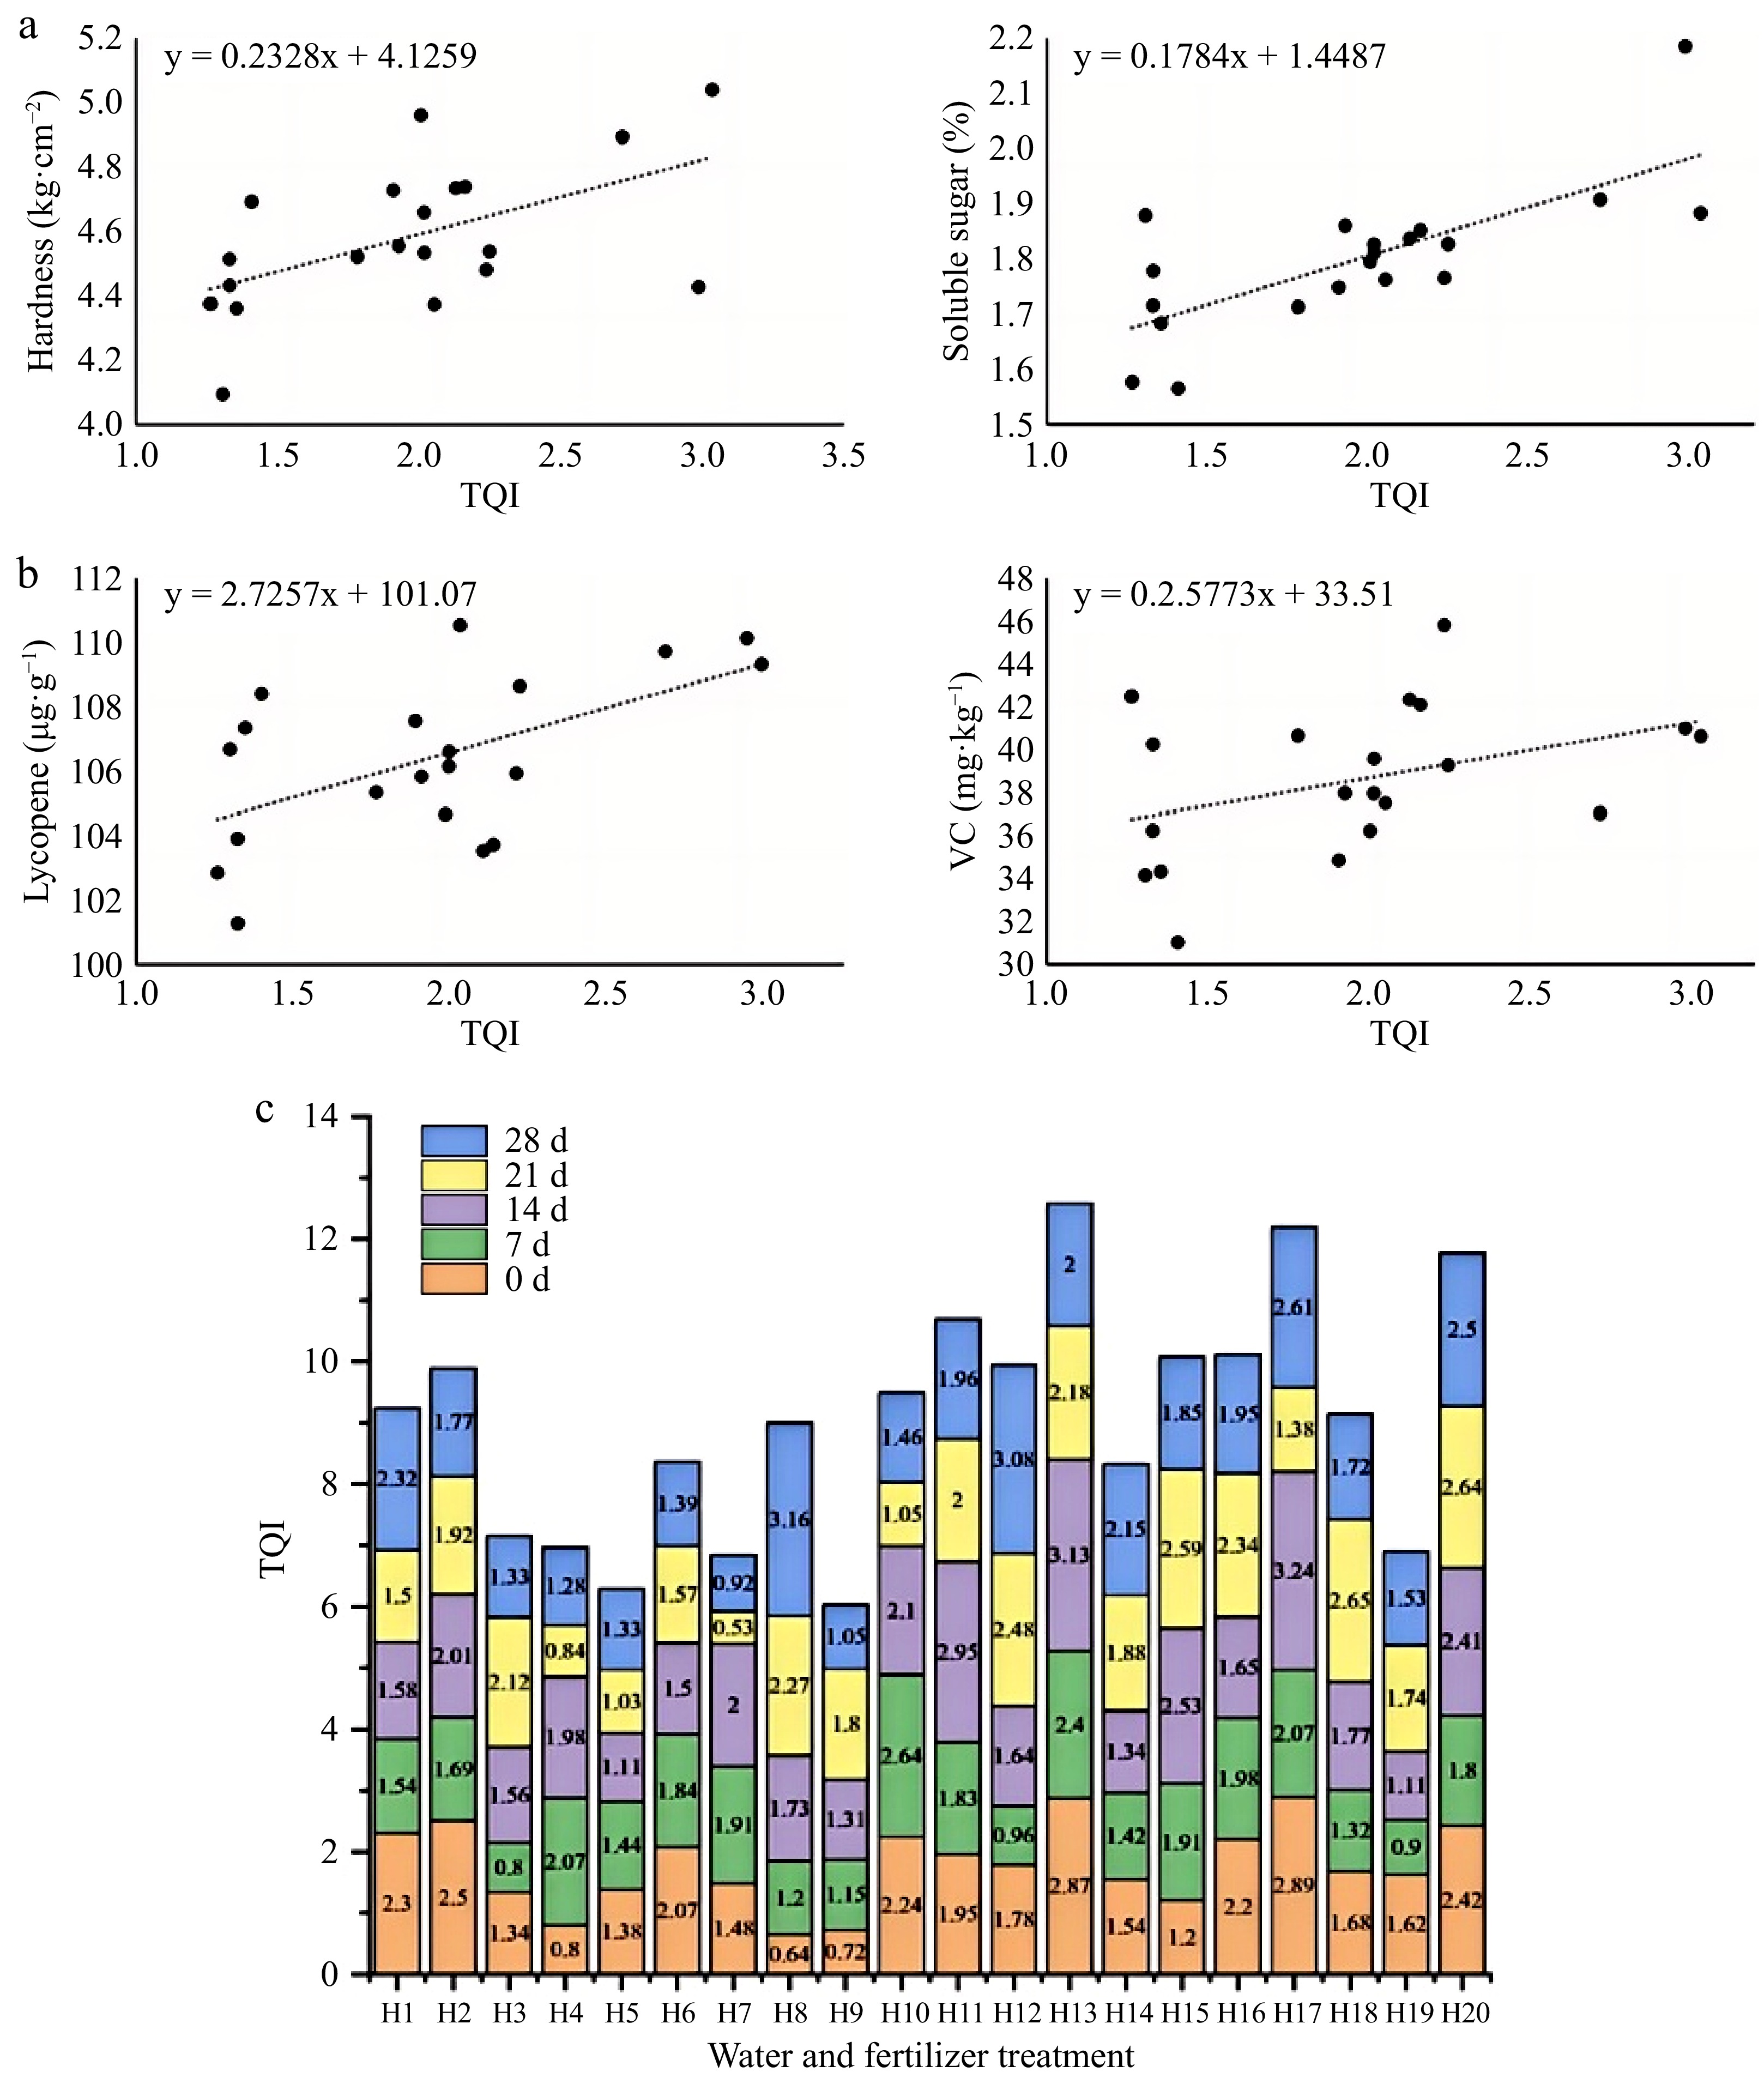
Figure 6.
Correlation between tomato fruit quality index and TQI and comparison of TQI of tomato fruits stored under different water and fertilizer treatments.
-
Treatment Code value scheme Actual value Irrigation level Amount
of nitrogenPhosphate Amount of
potassium appliedIrrigation level (mm·hm−2) Amount of
nitrogen (kg·hm−2)Phosphate (kg·hm−2) Amount of potassium
applied (kg·hm−2)H1 1 1 1 1 543 855 657 1107 H2 1 1 −1 −1 543 855 219 369 H3 1 1 1 −1 543 285 657 369 H4 1 −1 −1 1 543 285 219 1107 H5 −1 1 1 −1 369 855 657 369 H6 −1 1 −1 1 369 855 219 1107 H7 −1 −1 1 1 369 285 657 1107 H8 −1 −1 −1 −1 369 285 219 369 H9 −1.6818 0 0 0 310 570 438 738 H10 1.6818 0 0 0 602 570 438 738 H11 0 −1.6818 0 0 456 90 438 738 H12 0 1.6818 0 0 456 1049 438 738 H13 0 0 −1.6818 0 456 570 70 738 H14 0 0 1.6818 0 456 570 806 738 H15 0 0 0 −1.6818 456 570 438 117 H16 0 0 0 1.6818 456 570 438 1359 H17 0 0 0 0 456 570 438 738 H18 0 0 0 0 456 570 438 738 H19 0 0 0 0 456 570 438 738 H20 0 0 0 0 456 570 438 738 To enhance interpretability, the original coded values (−1.682, −1, 0, 1, and 1.682) representing fertilizer parameters were replaced with five qualitative levels: low, relatively low, medium, relatively high, and high, respectively, throughout this study. Table 1.
The level coding and treatment combination of each treatment factor.
-
Water and fertilizer treatment Zero-order reaction First-order reaction Regression equation Reaction rate constant Correlation coefficient Regression equation Reaction rate constant Correlation coefficient H1 X2 = 0.613556 − 0.011341X1 0.011341 0.9056 X2 = 0.715972/(1 + EXP(−1.6637 + 0.074204X1)) 0.074204 0.9157 H2 X2 = 0.622444 − 0.010603X1 0.010603 0.9575 X2 = 831.5989/(1 + EXP(7.1735 + 0.023001X1)) 0.023001 0.9818 H3 X2 = 0.584889 − 0.009968X1 0.009968 0.9595 X2 = 0.605382/(1 + EXP(−2.5640 + 0.095588X1)) 0.095588 0.9866 H4 X2 = 0.609889 − 0.012873X1 0.012873 0.9385 X2 = 0.666221/(1 + EXP(−2.0774 + 0.096845X1)) 0.096845 0.9613 H5 X2 = 0.590222 − 0.010921X1 0.010921 0.8848 X2 = 0.606894/(1 + EXP(−2.6517 + 0.105617X1)) 0.105617 0.9296 H6 X2 = 0.599333 − 0.010524X1 0.010524 0.9185 X2 = 0.610340/(1 + EXP(−2.7643 + 0.105018X1)) 0.105018 0.9622 H7 X2 = 0.636444 − 0.013159X1 0.013159 0.9135 X2 = 0.643247/(1 + EXP(−2.7932 + 0.119279X1)) 0.119279 0.9588 H8 X2 = 0.603889 − 0.009365X1 0.009365 0.9712 X2 = 0.835779/(1 + EXP(−0.939008 + 0.047201X1)) 0.047201 0.9744 H9 X2 = 0.584778 − 0.012540X1 0.012540 0.9594 X2 = 0.634521/(1 + EXP(−2.1096 + 0.098699X1)) 0.098699 0.9778 H10 X2 = 0.620000 − 0.010460X1 0.010460 0.9012 X2 = 0.673096/(1 + EXP(−2.1559 + 0.082881X1)) 0.082881 0.9258 H11 X2 = 0.666889 − 0.015651X1 0.015651 0.9217 X2 = 0.720430/(1 + EXP(−2.1611 + 0.109661X1)) 0.109661 0.9450 H12 X2 = 0.633311 − 0.012857X1 0.012857 0.9780 X2 = 1.9470/(1 + EXP(0.700469 + 0.037786X1)) 0.037786 0.9844 H13 X2 = 0.676444 − 0.013333X1 0.013333 0.9846 X2 = 0.769768/(1 + EXP(−1.7915 + 0.081801X1)) 0.081801 0.9929 H14 X2 = 0.618444 − 0.012921X1 0.012921 0.9416 X2 = 0.652681/(1 + EXP(−2.3483 + 0.104762X1)) 0.104762 0.9718 H15 X2 = 0.623333 − 0.011238X1 0.011238 0.9288 X2 = 0.625679/(1 + EXP(−2.9466 + 0.113388X1)) 0.113388 0.9867 H16 X2 = 0.662889 − 0.012206X1 0.012206 0.9705 X2 = 1.1094/(1 + EXP(−0.404949 + 0.045979X1)) 0.045979 0.9726 H17 X2 = 0.602444 − 0.011905X1 0.011905 0.9261 X2 = 1.1123/(1 + EXP(−0.187209 + 0.046426X1)) 0.046426 0.9302 H18 X2 = 0.634333 − 0.012778X1 0.012778 0.9175 X2 = 0.943992/(1 + EXP(−0.720706 + 0.056926X1)) 0.056926 0.9212 H19 X2 = 0.631111 − 0.011556X1 0.011556 0.9571 X2 = 2.3789/(1 + EXP(0.995675 + 0.031162X1)) 0.031162 0.9630 H20 X2 = 0.700667 − 0.014048X1 0.014048 0.9465 X2 = 0.711344/(1 + EXP(−2.7299 + 0.113821X1)) 0.113821 0.9858 X1 in the table is the number of days of tomato storage; X2 is the predicted value of tomato hardness. Table 2.
Zero order and first-order reaction rate constants and determination coefficients of hardness changes in sand cultivated tomatoes under different water and fertilizer ratios.
-
Water and fertilizer treatment Zero-order reaction First-order reaction Regression equation Reaction rate constant Correlation coefficient Regression equation Reaction rate constant Correlation coefficient H1 X2 = 28.8470 − 0.755354X1 0.755354 0.8395 X2 = 8,481.9293/(1 + EXP(5.5899 + 0.047548X1)) 0.047548 0.9457 H2 X2 = 26.5926 − 0.576422X1 0.576422 0.9819 X2 = 29.6266/(1 + EXP(−1.9231 + 0.093496X1)) 0.093496 0.9953 H3 X2 = 22.8185 − 0.359867X1 0.359867 0.8379 X2 = 72,541.1600/(1 + EXP(8.0340 + 0.021706X1)) 0.021706 0.8952 H4 X2 = 22.8185 − 0.359867X1 0.359867 0.8379 X2 = 72,541.1600/(1 + EXP(8.0340 + 0.021706X1)) 0.021706 0.8952 H5 X2 = 21.6233 − 0.419661X1 0.419661 0.9807 X2 = 128,163.0305/(1 + EXP(8.6605 + 0.027113X1)) 0.027113 0.9940 H6 X2 = 25.6608 − 0.610153X1 0.610153 0.9039 X2 = 30.3448/(1 + EXP(−1.5767 + 0.090557X1)) 0.090557 0.9067 H7 X2 = 25.9195 − 0.626635X1 0.626635 0.9481 X2 = 29.8062/(1 + EXP(−1.7588 + 0.099337X1)) 0.099337 0.9646 H8 X2 = 22.6970 − 0.372647X1 0.372647 0.9793 X2 = 171,521.3241/(1 + EXP(8.9101 + 0.021750X1)) 0.021750 0.9969 H9 X2 = 26.3834 − 0.542267X1 0.542267 0.7864 X2 = 22.5843/(1 + EXP(−8.5787 + 0.329461X1)) 0.329461 0.8951 H10 X2 = 27.7176 − 0.667503X1 0.667503 0.9872 X2 = 31.4207/(1 + EXP(−1.8166 + 0.099736X1)) 0.099736 0.9970 H11 X2 = 21.0315 − 0.241560X1 0.241560 0.8912 X2 = 36,342.2462/(1 + EXP(7.4434 + 0.013990X1)) 0.013990 0.9092 H12 X2 = 23.6797 − 0.397745X1 0.397745 0.9364 X2 = 3,479.2203/(1 + EXP(4.9641 + 0.022361X1)) 0.022361 0.9455 H13 X2 = 24.9081 − 0.409861X1 0.409861 0.8881 X2 = 25.8104/(1 + EXP(−2.6009 + 0.095383X1)) 0.095383 0.9278 H14 X2 = 22.8886 − 0.376458X1 0.376458 0.8863 X2 = 136,036.4153/(1 + EXP(8.6627 + 0.022460X1)) 0.022460 0.9279 H15 X2 = 23.9872 − 0.408938X1 0.408938 0.8627 X2 = 22.5429/(1 + EXP(−4.4227 + 0.162398X1)) 0.162398 0.9858 H16 X2 = 23.6017 − 0.403839X1 0.403839 0.9399 X2 = 41.4151/(1 + EXP(−0.290605 + 0.040683X1)) 0.040683 0.9414 H17 X2 = 30.3753 − 0.608310X1 0.608310 0.9655 X2 = 77.5410/(1 + EXP(0.410452 + 0.039907X1)) 0.039907 0.9754 H18 X2 = 24.2516 − 0.403246X1 0.403246 0.9675 X2 = 26.1364/(1 + EXP(−2.1926 + 0.082239X1)) 0.082239 0.9827 H19 X2 = 21.6041 − 0.426556X1 0.426556 0.8993 X2 = 196,525.7721/(1 + EXP(9.0774 + 0.028822X1)) 0.028822 0.9462 H20 X2 = 24.1891 − 0.382369X1 0.382369 0.8506 X2 = 27,980.1398/(1 + EXP(7.0305 + 0.021042X1)) 0.021042 0.8777 X1 in the table is the number of days of tomato storage; X2 is the predicted value of tomato soluble sugar. Table 3.
Zero-order and first-order reaction rate constants and correlation coefficients of soluble sugar content of tomato in sand culture under different water and fertilizer ratios.
-
Water and fertilizer treatment Zero-order reaction First-order reaction Regression equation Reaction rate constant Correlation coefficient Regression equation Reaction rate constant Correlation coefficient H1 X2 = 114.1535 − 0.393447X1 0.393447 0.1656 X2 = 113.4065/(1 + EXP(−7.1691 + 0.194381X1)) 0.194381 0.4448 H2 X2 = 119.4587 − 1.1284X1 1.1284 0.4470 X2 = 113.5233/(1 + EXP(−9.1896 + 0.308270X1)) 0.308270 0.9064 H3 X2 = 117.7443 − 1.1929X1 1.1929 0.4926 X2 = 111.9576/(1 + EXP(−7.5344 + 0.250599X1)) 0.250599 0.8835 H4 X2 = 124.5365 − 1.2282X1 1.2282 0.5204 X2 = 119.9351/(1 + EXP(−5.7911 + 0.184073X1)) 0.184073 0.8175 H5 X2 = 118.2350 − 1.0929X1 1.0929 0.6272 X2 = 114.9281/(1 + EXP(−4.8839 + 0.144766X1)) 0.144766 0.8295 H6 X2 = 123.7006 − 1.3048X1 1.3048 0.7312 X2 = 121.9513/(1 + EXP(−3.8997 + 0.115155X1)) 0.115155 0.8570 H7 X2 = 119.3229 − 1.1968X1 1.1968 0.4900 X2 = 115.4133/(1 + EXP(−5.3785 + 0.169974X1)) 0.169974 0.7476 H8 X2 = 112.4134 − 0.432594X1 0.432594 0.2893 X2 = 111.1648/(1 + EXP(−6.5740 + 0.171748X1)) 0.171748 0.5649 H9 X2 = 112.3896 − 0.456737X1 0.456737 0.1536 X2 = 111.7282/(1 + EXP(−6.3736 + 0.171521X1)) 0.171521 0.3733 H10 X2 = 120.4036 − 1.2031X1 1.2031 0.5755 X2 = 117.8957/(1 + EXP(−4.3473 + 0.129540X1)) 0.129540 0.7307 H11 X2 = 110.8261 − 0.583811X1 0.583811 0.3297 X2 = 108.8337/(1 + EXP(−6.8557 + 0.195863X1)) 0.195863 0.6644 H12 X2 = 112.9478 − 0.453232X1 0.453232 0.1929 X2 = 112.0050/(1 + EXP(−6.1305 + 0.158566X1)) 0.158566 0.3849 H13 X2 = 129.5200 − 1.4121X1 1.4121 0.7124 X2 = 124.9003/(1 + EXP(−4.8056 + 0.150013X1)) 0.150013 0.9097 H14 X2 = 115.8803 − 0.235104X1 0.235104 0.1875 X2 = 115.2472/(1 + EXP(−7.5697 + 0.184149X1)) 0.184149 0.4308 H15 X2 = 121.4842 − 1.0956X1 1.0956 0.5273 X2 = 119.2548/(1 + EXP(−4.4706 + 0.129254X1)) 0.129254 0.6924 H16 X2 = 125.5049 − 1.4829X1 1.4829 0.7338 X2 = 120.8531/(1 + EXP(−4.6363 + 0.148194X1)) 0.148194 0.9169 H17 X2 = 126.1745 − 1.1455X1 1.1455 0.6422 X2 = 126.5790/(1 + EXP(−3.5452 + 0.095305X1)) 0.095305 0.7266 H18 X2 = 120.3463 − 1.0373X1 1.0373 0.4169 X2 = 114.1383/(1 + EXP(−14.3382 + 0.489449X1)) 0.489449 0.9675 H19 X2 = 126.1550 − 1.2678X1 0.741408 0.5463 X2 = 119.0906/(1 + EXP(−8.6740 + 0.290296X1)) 0.138877 0.7443 H20 X2 = 119.7115 − 0.741408X1 1.2678 0.5418 X2 = 117.4821/(1 + EXP(−5.2487 + 0.138877X1)) 0.290296 0.9663 X1 in the table is the number of days of tomato storage; X2 is the predicted value of tomato lycopene. Table 4.
Zero-order and first-order reaction rate constants and correlation coefficients of lycopene content in sand-cultured tomato under different water and fertilizer ratios.
-
Water and fertilizer treatment Zero-order reaction First-order reaction Regression equation Reaction rate constant Correlation coefficient Regression equation Reaction rate constant Correlation coefficient H1 X2 = 53.5885 − 1.0236X1 1.0236 0.9286 X2 = 529,115.8490/(1 + EXP(9.1620 + 0.027482X1)) 0.027482 0.9746 H2 X2 = 59.7146 − 1.2589X1 1.2589 0.9386 X2 = 45,397.7406/(1 + EXP(6.5941 + 0.031166X1)) 0.031166 0.9737 H3 X2 = 55.0959 − 1.0616X1 1.0616 0.9810 X2 = 72.8628/(1 + EXP(−1.1024 + 0.062426X1)) 0.062426 0.9855 H4 X2 = 40.1549 − 0.416704X1 0.416704 0.8833 X2 = 44.4078/(1 + EXP(−2.1000 + 0.056549X1)) 0.056549 0.9037 H5 X2 = 61.1113 − 1.3310X1 1.3310 0.8953 X2 = 135.6821/(1 + EXP(0.158561 + 0.047863X1)) 0.047863 0.9115 H6 X2 = 55.2497 − 1.0439X1 1.0439 0.8557 X2 = 60,188.3627/(1 + EXP(6.9555 + 0.027312X1)) 0.027312 0.9044 H7 X2 = 48.8088 − 0.898248X1 0.898248 0.8282 X2 = 474,666.5720/(1 + EXP(9.1442 + 0.026595X1)) 0.026595 0.8833 H8 X2 = 39.5776 − 0.337551X1 0.337551 0.8496 X2 = 42.2099/(1 + EXP(−2.4937 + 0.059221X1)) 0.059221 0.8781 H9 X2 = 41.9110 − 0.553822X1 0.553822 0.8916 X2 = 38,988.4215/(1 + EXP(6.8196 + 0.016680X1)) 0.016680 0.914 H10 X2 = 62.6289 − 1.4503X1 1.2419 0.9249 X2 = 134.6140/(1 + EXP(0.088131 + 0.053171X1)) 0.107880 0.9685 H11 X2 = 64.3055 − 1.2419X1 1.4503 0.8482 X2 = 66.1189/(1 + EXP(−2.6277 + 0.107880X1)) 0.053171 0.8689 H12 X2 = 48.1829 − 0.616155X1 0.616155 0.8447 X2 = 54,330.2959/(1 + EXP(7.0087 + 0.016392X1)) 0.016392 0.8868 H13 X2 = 46.5055 − 0.677012X1 0.677012 0.9548 X2 = 13,749.5348/(1 + EXP(5.6713 + 0.018571X1)) 0.018571 0.9656 H14 X2 = 49.5684 − 0.863020X1 0.863020 0.8889 X2 = 2,631.4967/(1 + EXP(3.9301 + 0.023881X1)) 0.023881 0.9076 H15 X2 = 47.1535 − 0.609021X1 0.609021 0.9857 X2 = 56.7154/(1 + EXP(−1.5218 + 0.051210X1)) 0.051210 0.9899 H16 X2 = 43.6986 − 0.533570X1 0.533570 0.9664 X2 = 2,786.0899/(1 + EXP(4.1306 + 0.014971X1)) 0.014971 0.9682 H17 X2 = 54.9882 − 1.0007X1 1.0007 0.9436 X2 = 630.6366/(1 + EXP(2.3259 + 0.026455X1)) 0.026455 0.9515 H18 X2 = 46.6184 − 0.619063X1 0.619063 0.9323 X2 = 64.3036/(1 + EXP(−0.950981 + 0.040834X1)) 0.040834 0.9348 H19 X2 = 34.2568 − 0.290852X1 0.290852 0.6709 X2 = 13,499.4987/(1 + EXP(5.9649 + 0.010089X1)) 0.010089 0.7002 H20 X2 = 51.6928 − 0.791803X1 0.791803 0.9180 X2 = 92.1464/(1 + EXP(−0.252515 + 0.035599X1)) 0.035599 0.9206 X1 in the table is the number of days of tomato storage; X2 is the predicted value of tomato vitamin C. Table 5.
The zero-order and first-order reaction rate constants and correlation coefficients of vitamin C content in sand-cultured tomato under different water and fertilizer ratios.
Figures
(6)
Tables
(5)