-
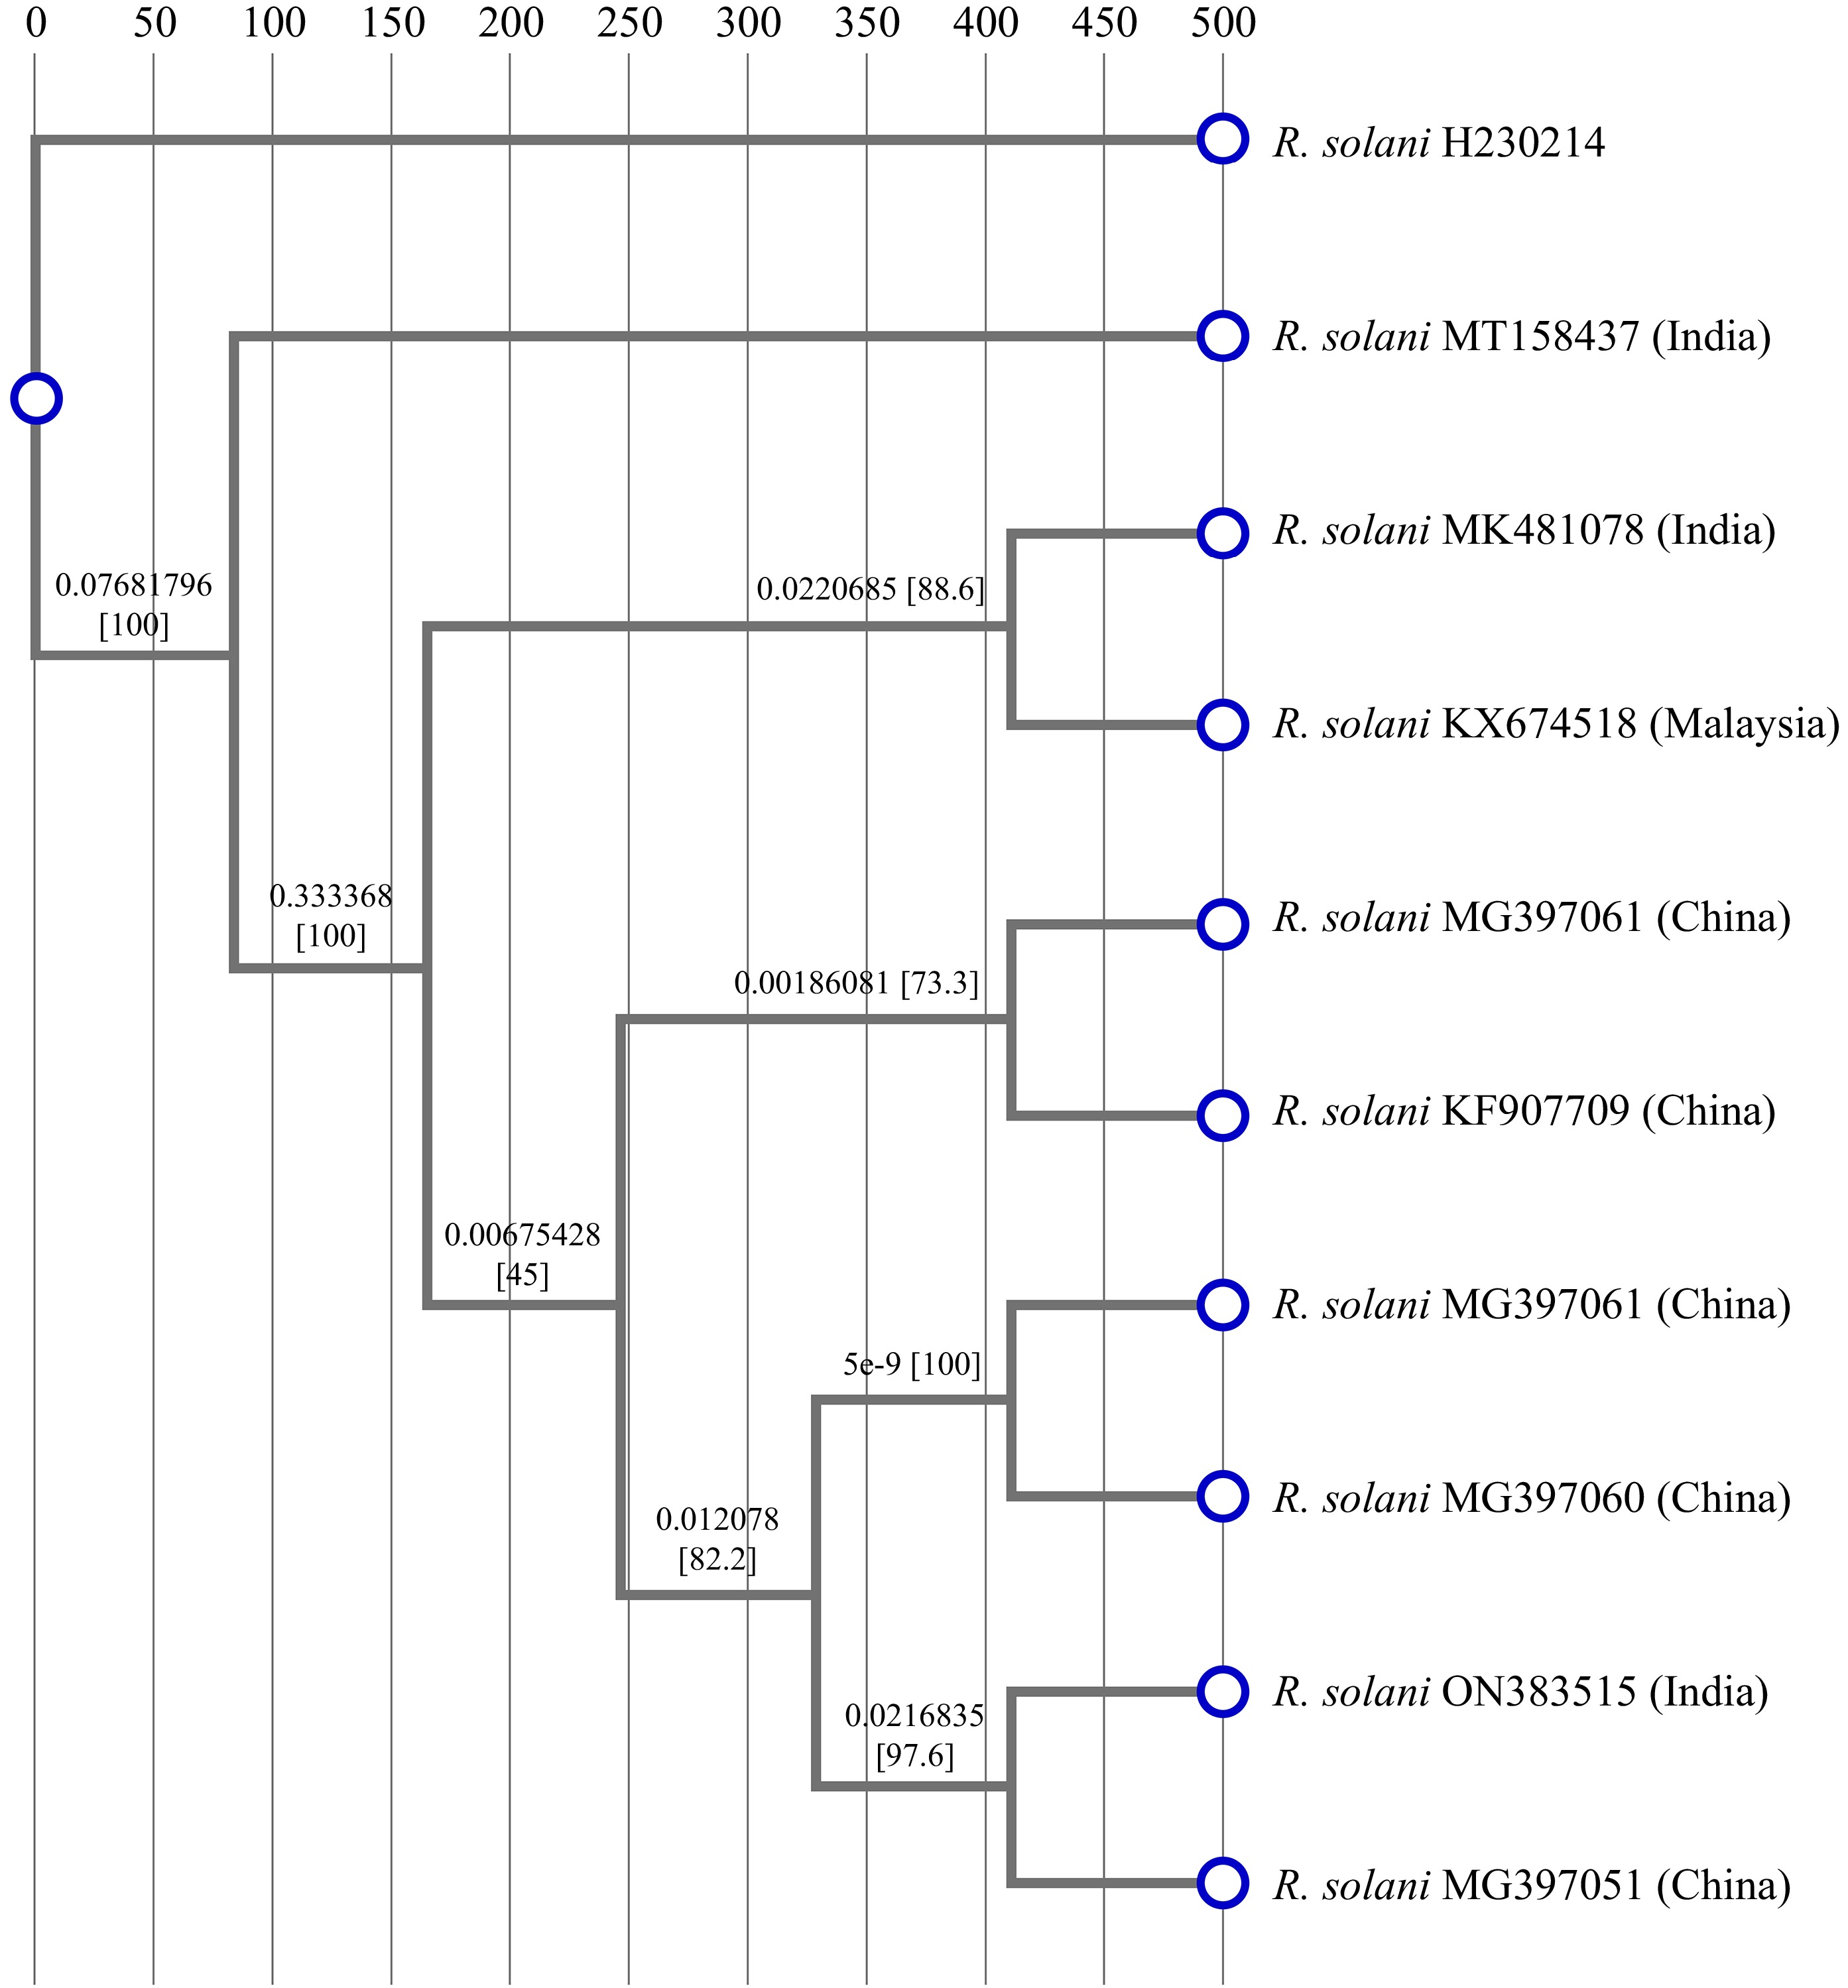
Figure 1.
Phylogenetic relationship of R. solani H230214 deposited in NCBI. The optimal tree is shown. The percentage of replicate trees in which the associated taxa clustered together in the bootstrap test (10,000 replicates) are shown next to the branches.
-
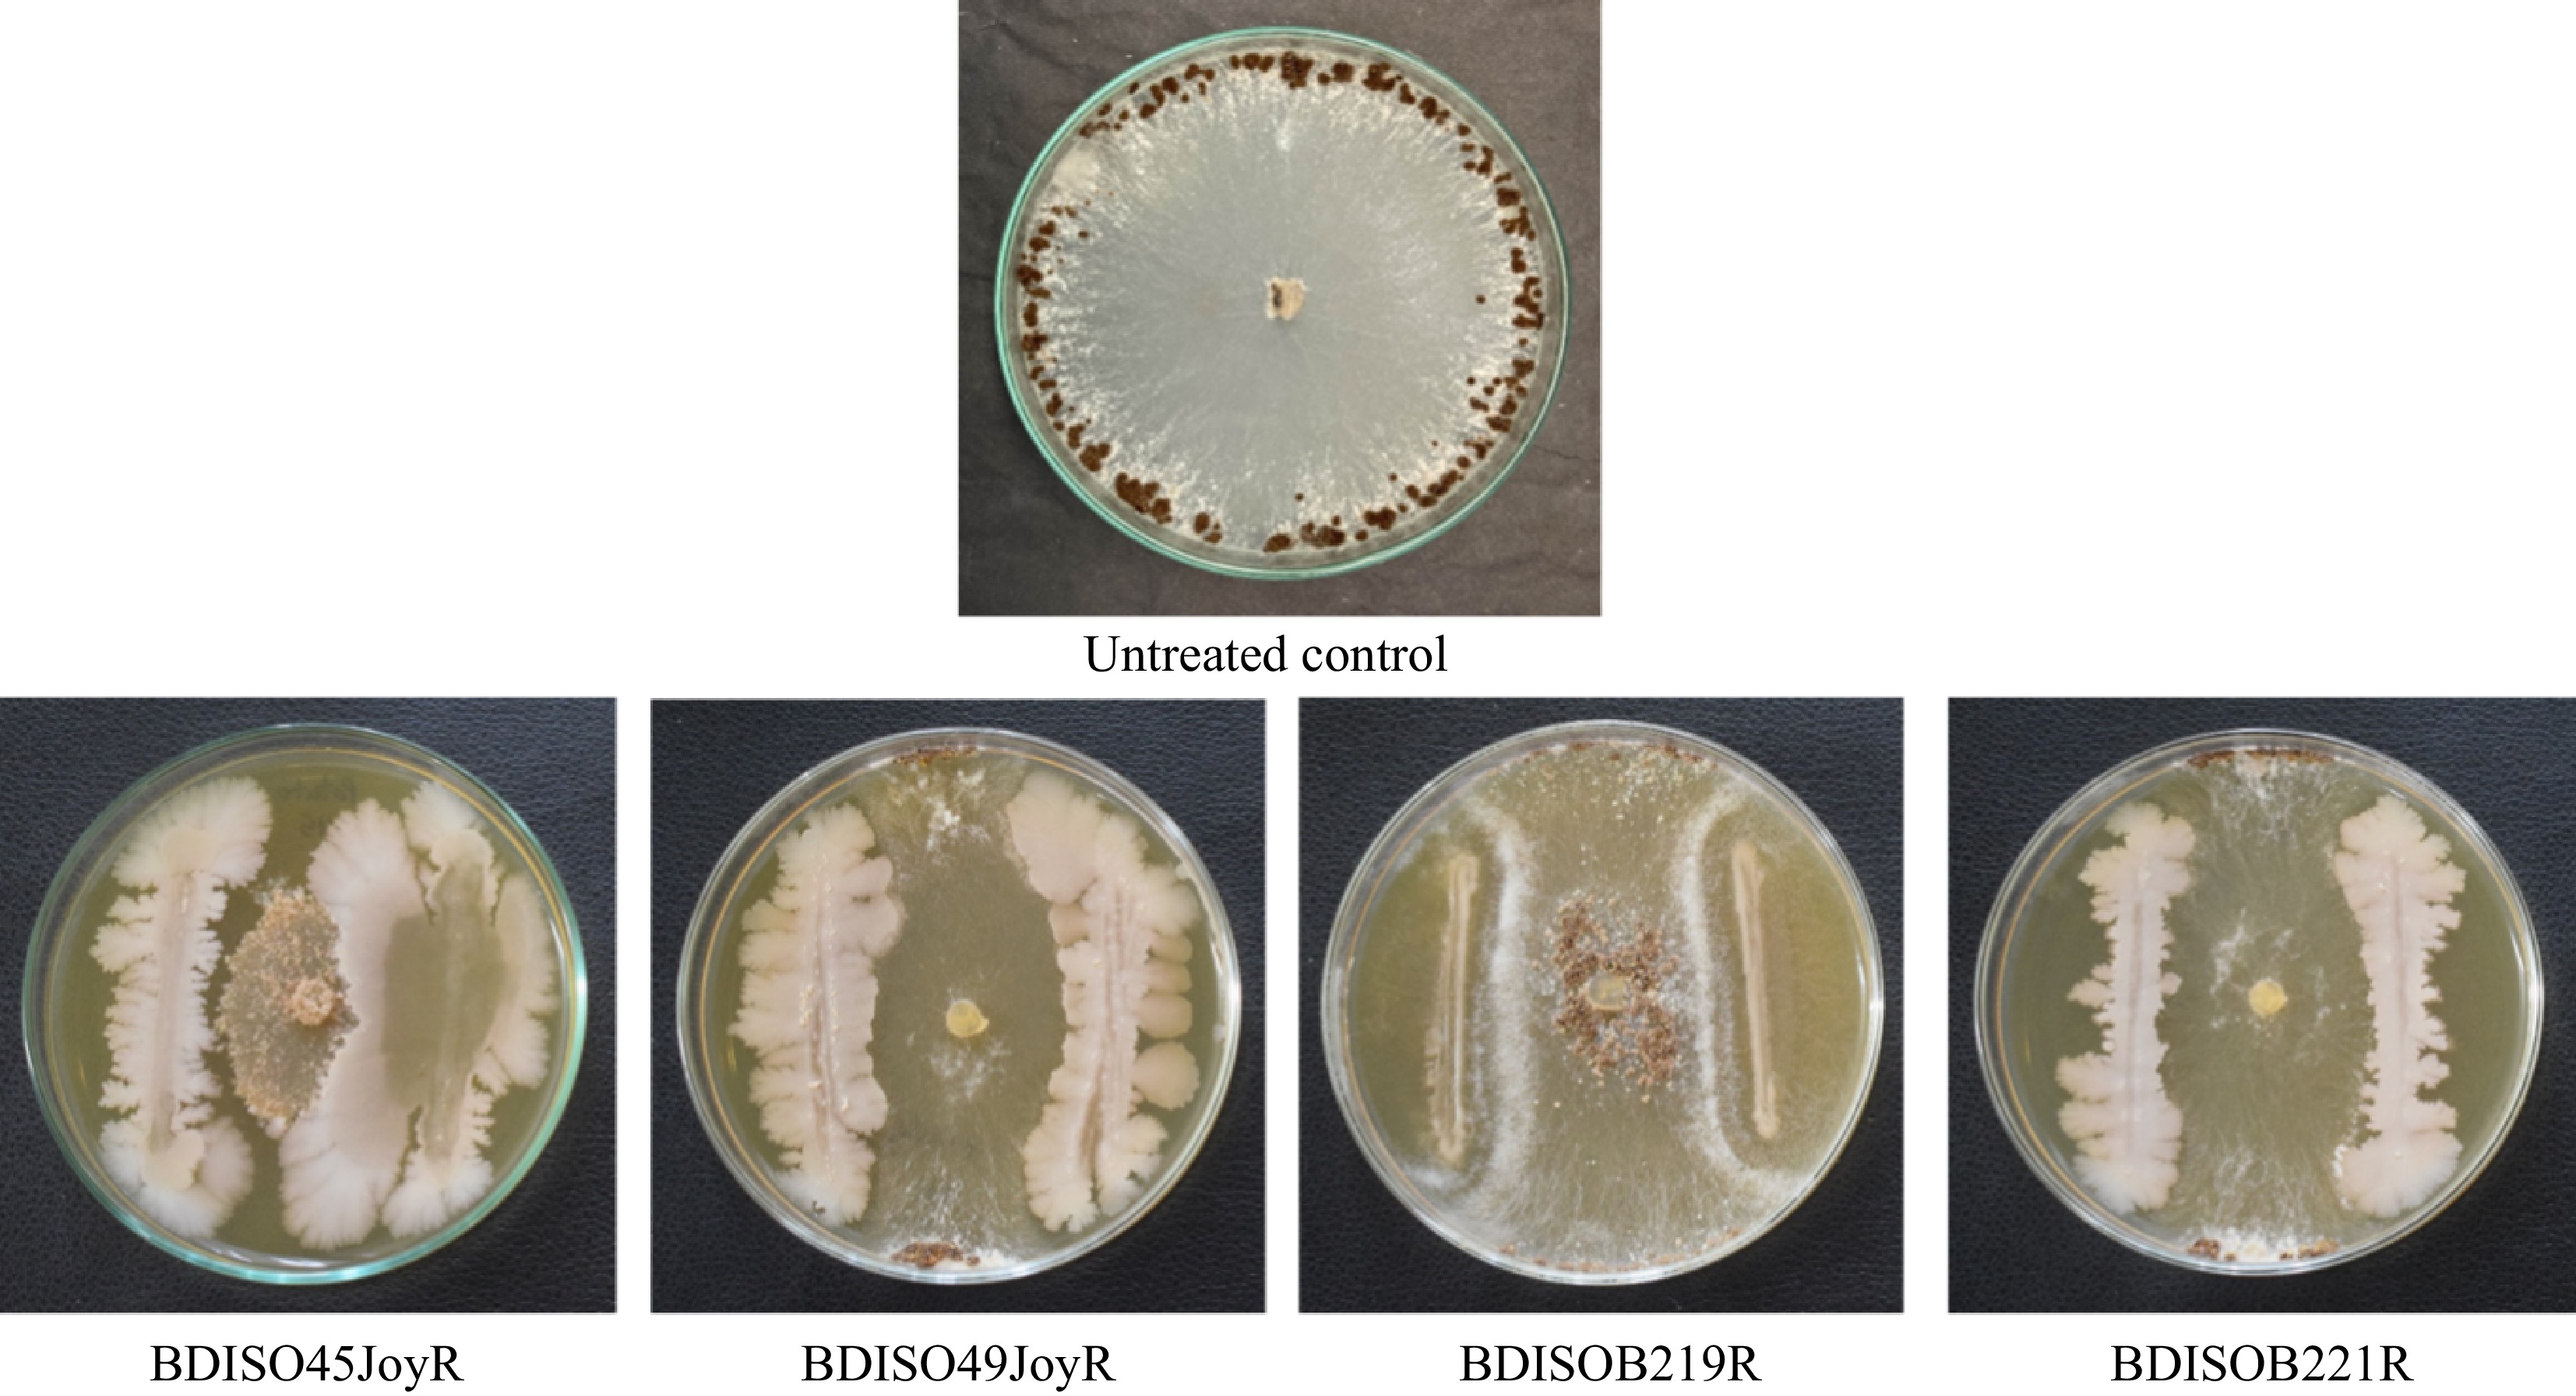
Figure 2.
In vitro growth inhibition of R. solani by bacterial bioagents. BDISO45JoyR = B. subtilis, BDISO49JoyR = B. subtilis, BDISOB219R = P. taiwanensis, and BDISOB221R = Pseudomonas sp.
-
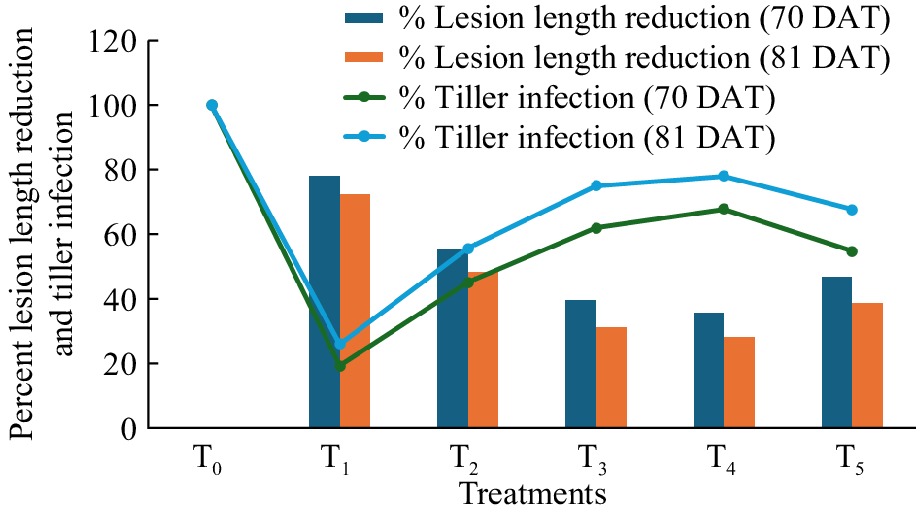
Figure 3.
Effect of formulated bacterial bioagents in percent lesion length reduction and tiller infection of rice sheath blight caused by R. solani under field conditions at 70 and 81 DAT. T0 = Control, T1 = Positive control, T2 = BDISO45JoyR (B. subtilis), T3 = BDISO49JoyR (B. subtilis), T4 = BDISOB219R (P. taiwanensis) and T5 = BDISOB221R (Pseudomonas sp.).
-
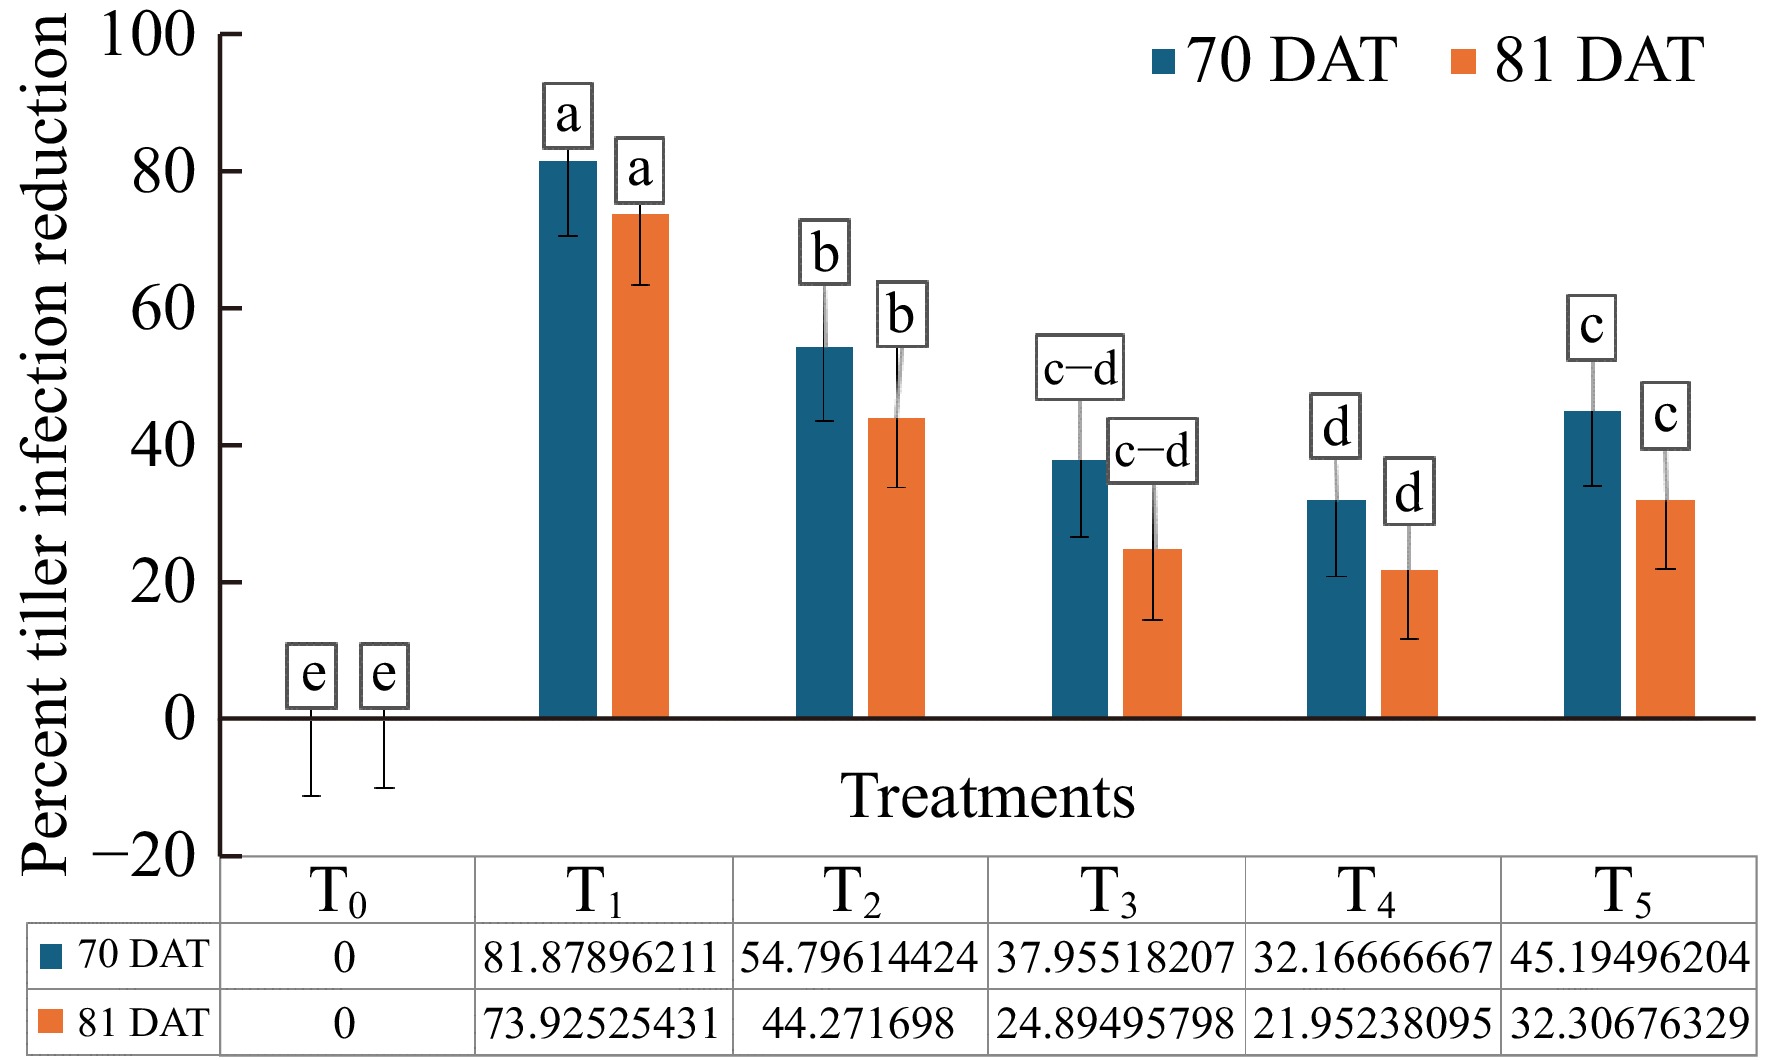
Figure 4.
Effect of formulated bacterial bioagents in percent tiller infection reduction of rice sheath blight caused by R. solani under field conditions at 70 and 81 DAT. T0 = Control, T1 = Positive control, T2 = BDISO45JoyR (B. subtilis), T3 = BDISO49JoyR (B. subtilis), T4 = BDISOB219R (P. taiwanensis), and T5 = BDISOB221R (Pseudomonas sp.)
-
Isolate ID Name of the bacteria Mean radial mycelial growth % Inhibition of radial mycelial growth BDISO02PanR Pseudomonas fluorescens 28.5 ± 0.14b 35.23 ± 0.3f BDISO04PanR Pseudomonas putida 44a 0.00g BDISO38ThaP Pseudomonas fluorescens 27.75 ± 0.75bc 36.93 ± 1.7ef BDISO56BogP Pseudomonas fluorescens 26.58 ± 0.61bc 39.58 ± 1.3ef BDISO64RanP Pseudomonas putida 26.92 ± 0.21bc 38.83 ± 0.46ef BDIS036ThaR Bacillus subtilis 44a 0.00g BDISO39ThaR Bacillus subtilis 44a 0g BDISO45JoyR Bacillus subtilis 10.17 ± 0.95g 76.89 ± 2.1a BDISO49JoyR Bacillus subtilis 16.33 ± 0.55f 62.84 ± 1.2b BDISO61JamR Bacillus subtilis 25 ± 1.08cd 43.18 ± 2.4de BDISOBO4P Pseudomonas putida 44a 0.00g BDISOBO5P Pseudomonas putida 26 ± 0.14bc 40.91 ± 0.31ef BDISOB219R Pseudomonas taiwanensis 22.67 ± 0.55de 48.48 ± 1.23cd BDISOB221R Pseudomonas sp. 21.42 ± 0.34e 51.33 ± 0.77c BDISOB275R Pseudomonas putida 44a 0.00g BDISOB283R Pseudomonas fluorescens 44a 0.00g BDISOB306R Pseudomonas putida 28.42 ± 0.07b 35.42 ± 0.15f BDlSO01R Bacillus amyloliquefaciens 44a 0.00g BDlSO04P Pseudomonas putida 26.17 ± 0.14bc 40.53 ± 0.31ef BDISO45P Bacillus paramycoides 28.42 ± 0.07b 35.42 ± 0.16f BDlSO154P Pseudomonas taiwanensis 44a 0.00g BDISO356P Pseudomonas hibiscicola 27.58 ± 0.61bc 37.31 ± 1.39ef BDISOB92R Pseudomonas fluorescens 44a 0g Level of significance 0.05 CV (%) 2.78 LSD 6.36 Mean values ± standard error. Values with similar letters are statistically similar. BD: Bangladesh, ISO: Isolate, B: Bacteria, First three letters of Location, R: Rhizosphere, and P: Phylloplane. Table 1.
The effect of different bacterial bioagents on inhibiting the radial mycelial growth of R. solani.
-
Treatment Percent lesion length reduction Percent tiller infection 70 DAT 81 DAT 70 DAT 81 DAT T0 0e 0e 100a 100a T1 78.17 ± 2.04a 72.45 ± 0.72a 19.31 ± 1.73e 26.08 ± 2.13e T2 55.25 ± 1.06b 48.30 ± 1.29b 45.20 ± 1.54d 55.73 ± 1.05d T3 39.78 ± 3.42cd 31.32 ± 0.98d 62.05 ± 1.74bc 75.11 ± 1.86b T4 35.91 ± 0.90d 28.30 ± 0.98d 67.83 ± 0.79b 78.05 ± 1.13b T5 46.96 ± 0.91c 38.87 ± 1.00c 54.81 ± 1.64c 67.69 ± 1.55c Level of significance 0.05 0.05 0.05 0.05 LSD 4.66 3.88 4.77 5.7 CV (%) 8.88 5.24 5.46 7.68 Mean values ± standard error. Values with similar letters are statistically similar. T0 = Control, T1 = Positive control, T2 = BDISO45JoyR (B. subtilis), T3 = BDISO49JoyR (B. subtilis), T4 = BDISOB219R (P. taiwanensis) and T5 = BDISOB221R (Pseudomonas sp.). Table 2.
Potential of different formulated bacterial bioagents in reducing percent lesion length and tiller infection of rice sheath blight under field conditions.
-
Treatment Plant height
(cm)Panicle length
(cm)No. of grains per panicle No. of chaffy grains per panicle Weight of 1,000 grains (g) Yield (t/ha) % Yield increase T0 106 ± 2.97c 19.3 ± 0.9d 138.5 ± 1.9e 54.3 ± 2.2a 21.7 ± 0.3b 3.34 ± 0.06e 0e T1 113.3 ± 1.7ab 23.2 ± 0.6a 240.3 ± 1.7a 9.8 ± 0.9d 22.7 ± 0.05a 5.87 ± 0.09a 76.29 ± 1.44a T2 115.3 ± 2.3ab 22.9 ± 0.6ab 234.8 ± 2.6ab 11.5 ± 1.3cd 22.4 ± 0.1ab 5.28 ± 0.06b 58.51 ± 0.9b T3 110.5 ± 1.9abc 21.5 ± 0.6bc 221.8 ± 2.6cd 16.3 ± 1.3b 22.3 ± 0.1ab 4.38 ± 0.09d 31.57 ± 1.39cd T4 109 ± 2.5bc 21.2 ± 0.3cd 215.7 ± 2.7de 17.2 ± 0.9b 22.2 ± 0.2ab 4.31 ± 0.11d 29.67 ± 1.65d T5 116.5 ± 1.1a 21.9 ± 0.2abc 228 ± 3.2bc 14.8 ± 1.1bc 22.4 ± 0.2ab 4.53 ± 0.09c 36.03 ± 1.49c Level of significance 0.05 0.05 0.05 0.05 0.05 0.05 0.05 LSD 6.3 2.42 7.66 4.28 1.58 0.21 5.08 CV (%) 3.74 4.63 8.69 13.79 2.32 2.39 8.50 Mean values ± standard error. Values with similar letters are statistically similar. T0 = Control, T1 = Positive control, T2 = BDISO45JoyR (B. subtilis), T3 = BDISO49JoyR (B. subtilis), T4 = BDISOB219R (P. taiwanensis), and T5 = BDISOB221R (Pseudomonas sp.). Table 3.
Effect of different formulated bacterial bioagents in enhancing growth and yield parameters of rice.
Figures
(4)
Tables
(3)