-
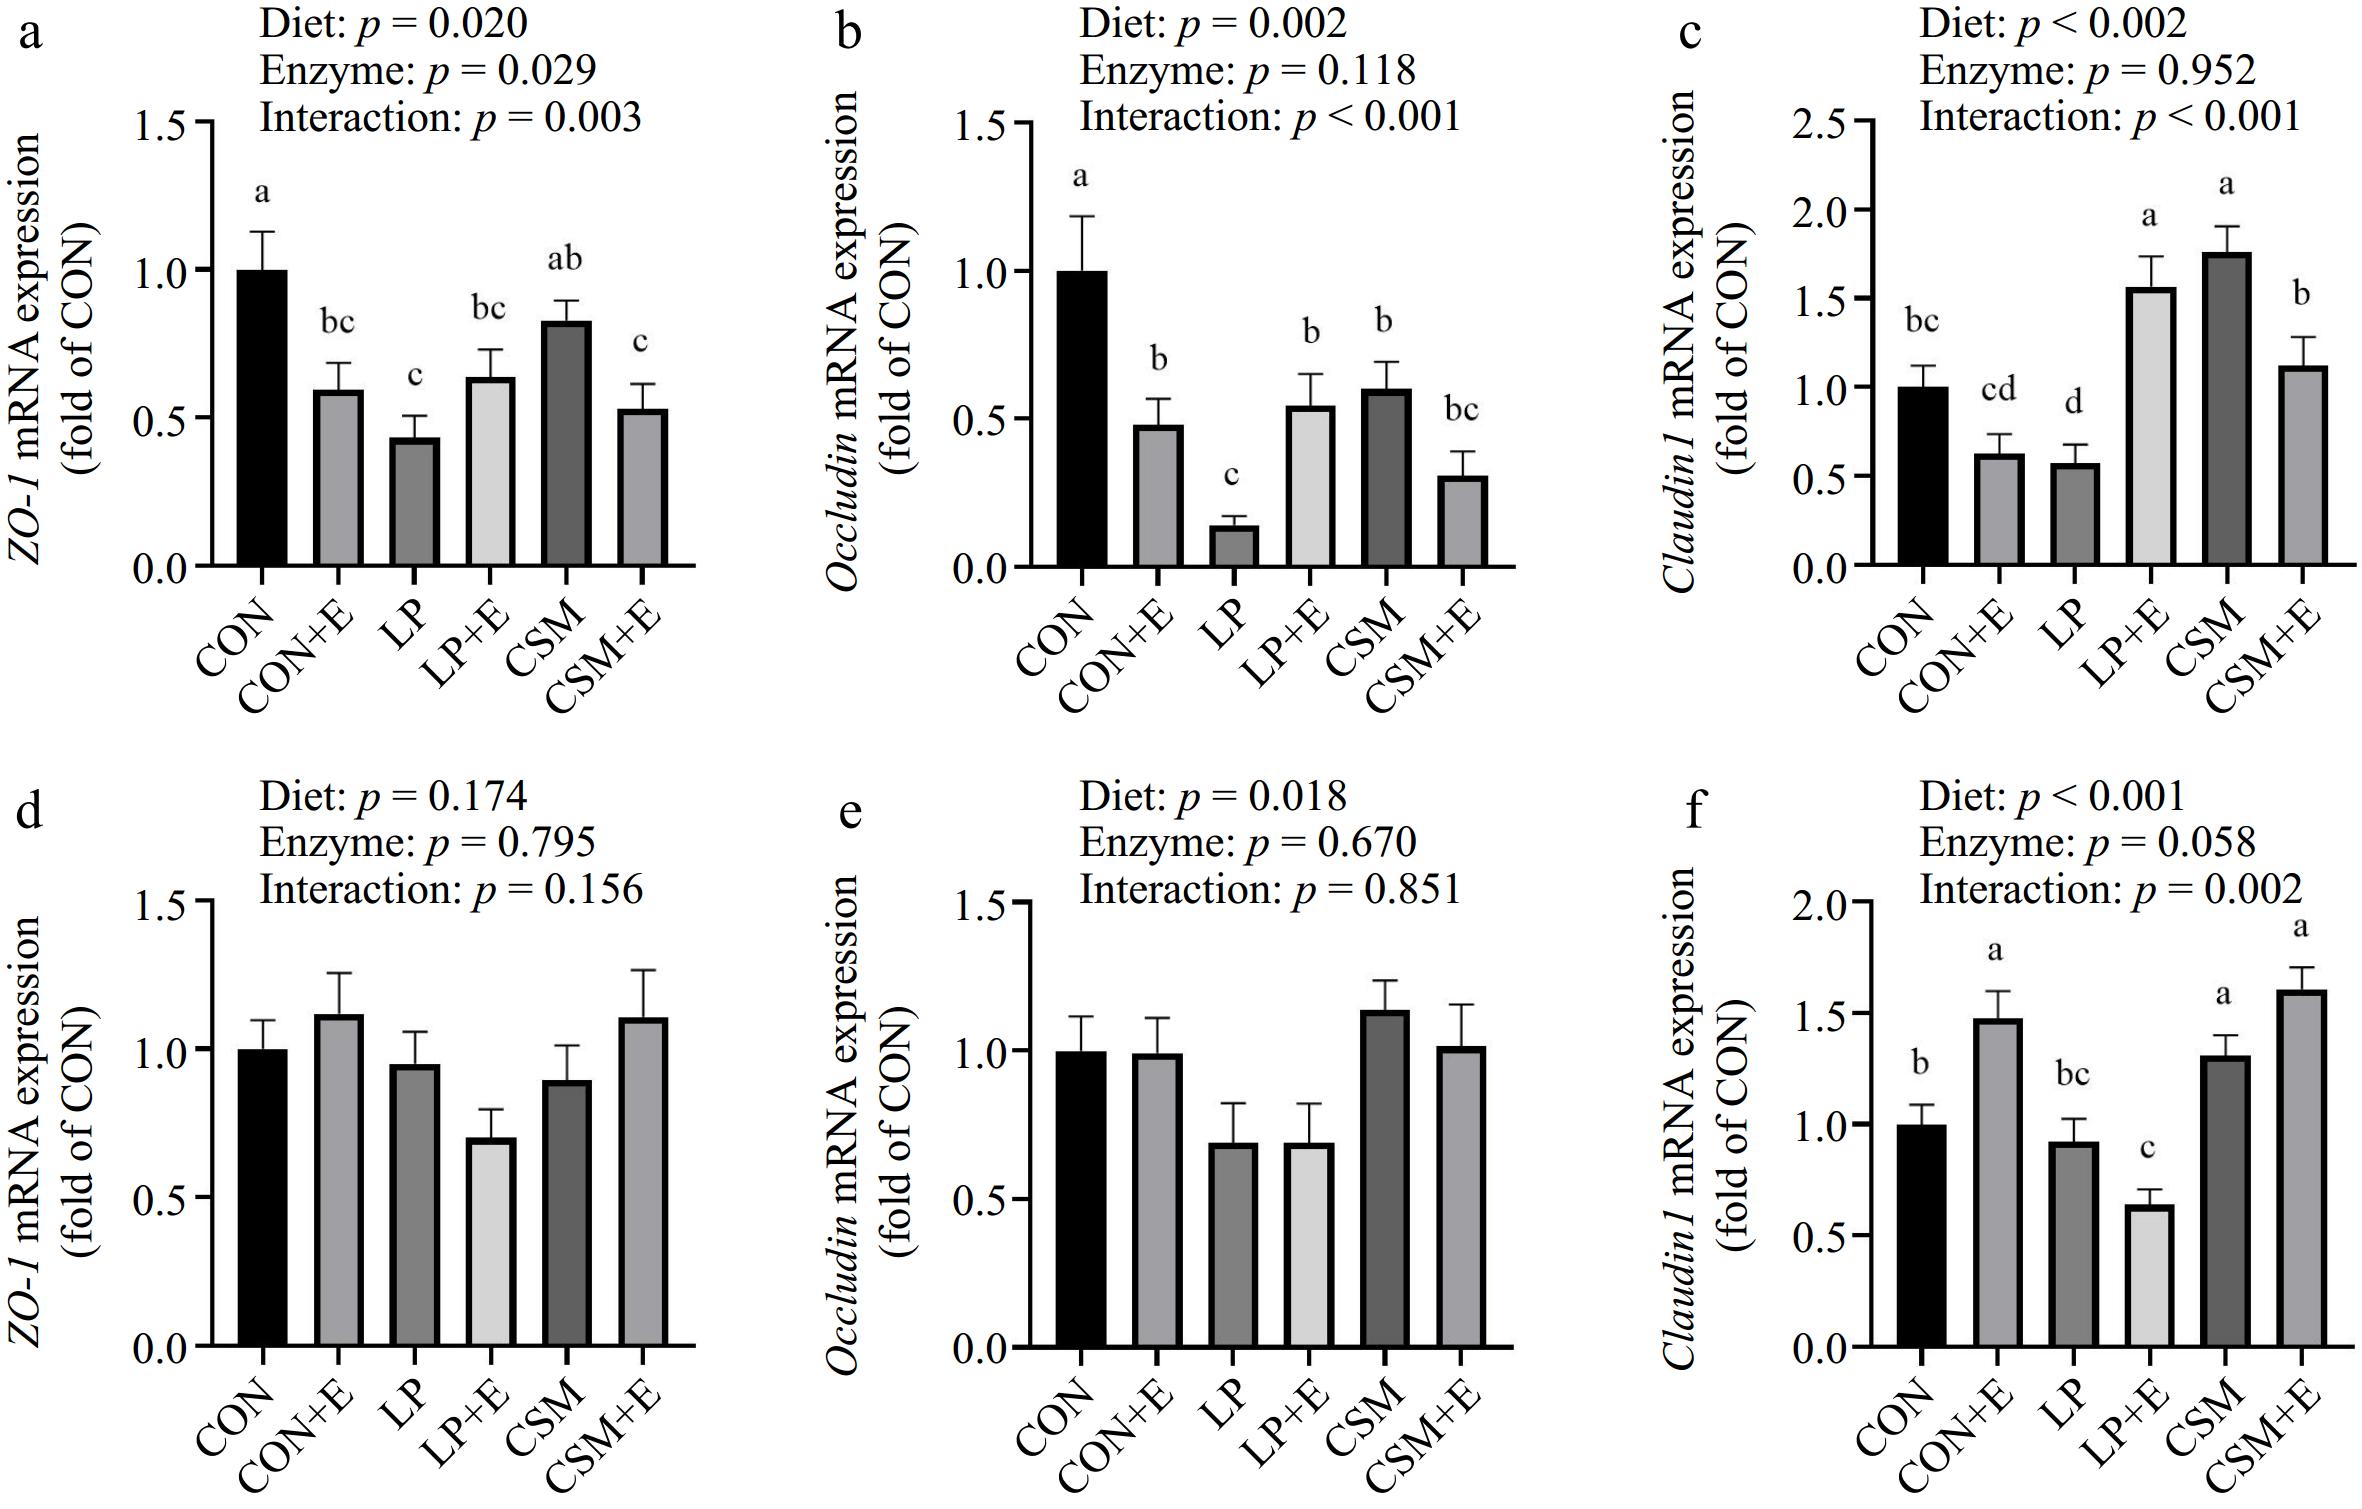
Figure 1.
Effects of low protein diet and miscellaneous meal diet and enzyme supplementation on jejunal barrier proteins gene expressions of Langshan chickens. (a)−(c) Are the expression levels of jejunum barrier proteins gene at 58 d, (d)−(f) are the expression levels of jejunum barrier proteins gene at 86 d. Data are represented as mean ± SE (n = 8). a−c Different letters indicate significant difference among the CON, CON + E, LP, LP + E, CSM, and CSM + E groups. CON, corn soybean meal; CON + E, corn soybean meal with enzyme; LP, low protein meal; LP + E, low protein meal with enzyme; CSM, corn soybean miscellaneous meal; CSM + E, corn soybean miscellaneous meal with enzyme.
-
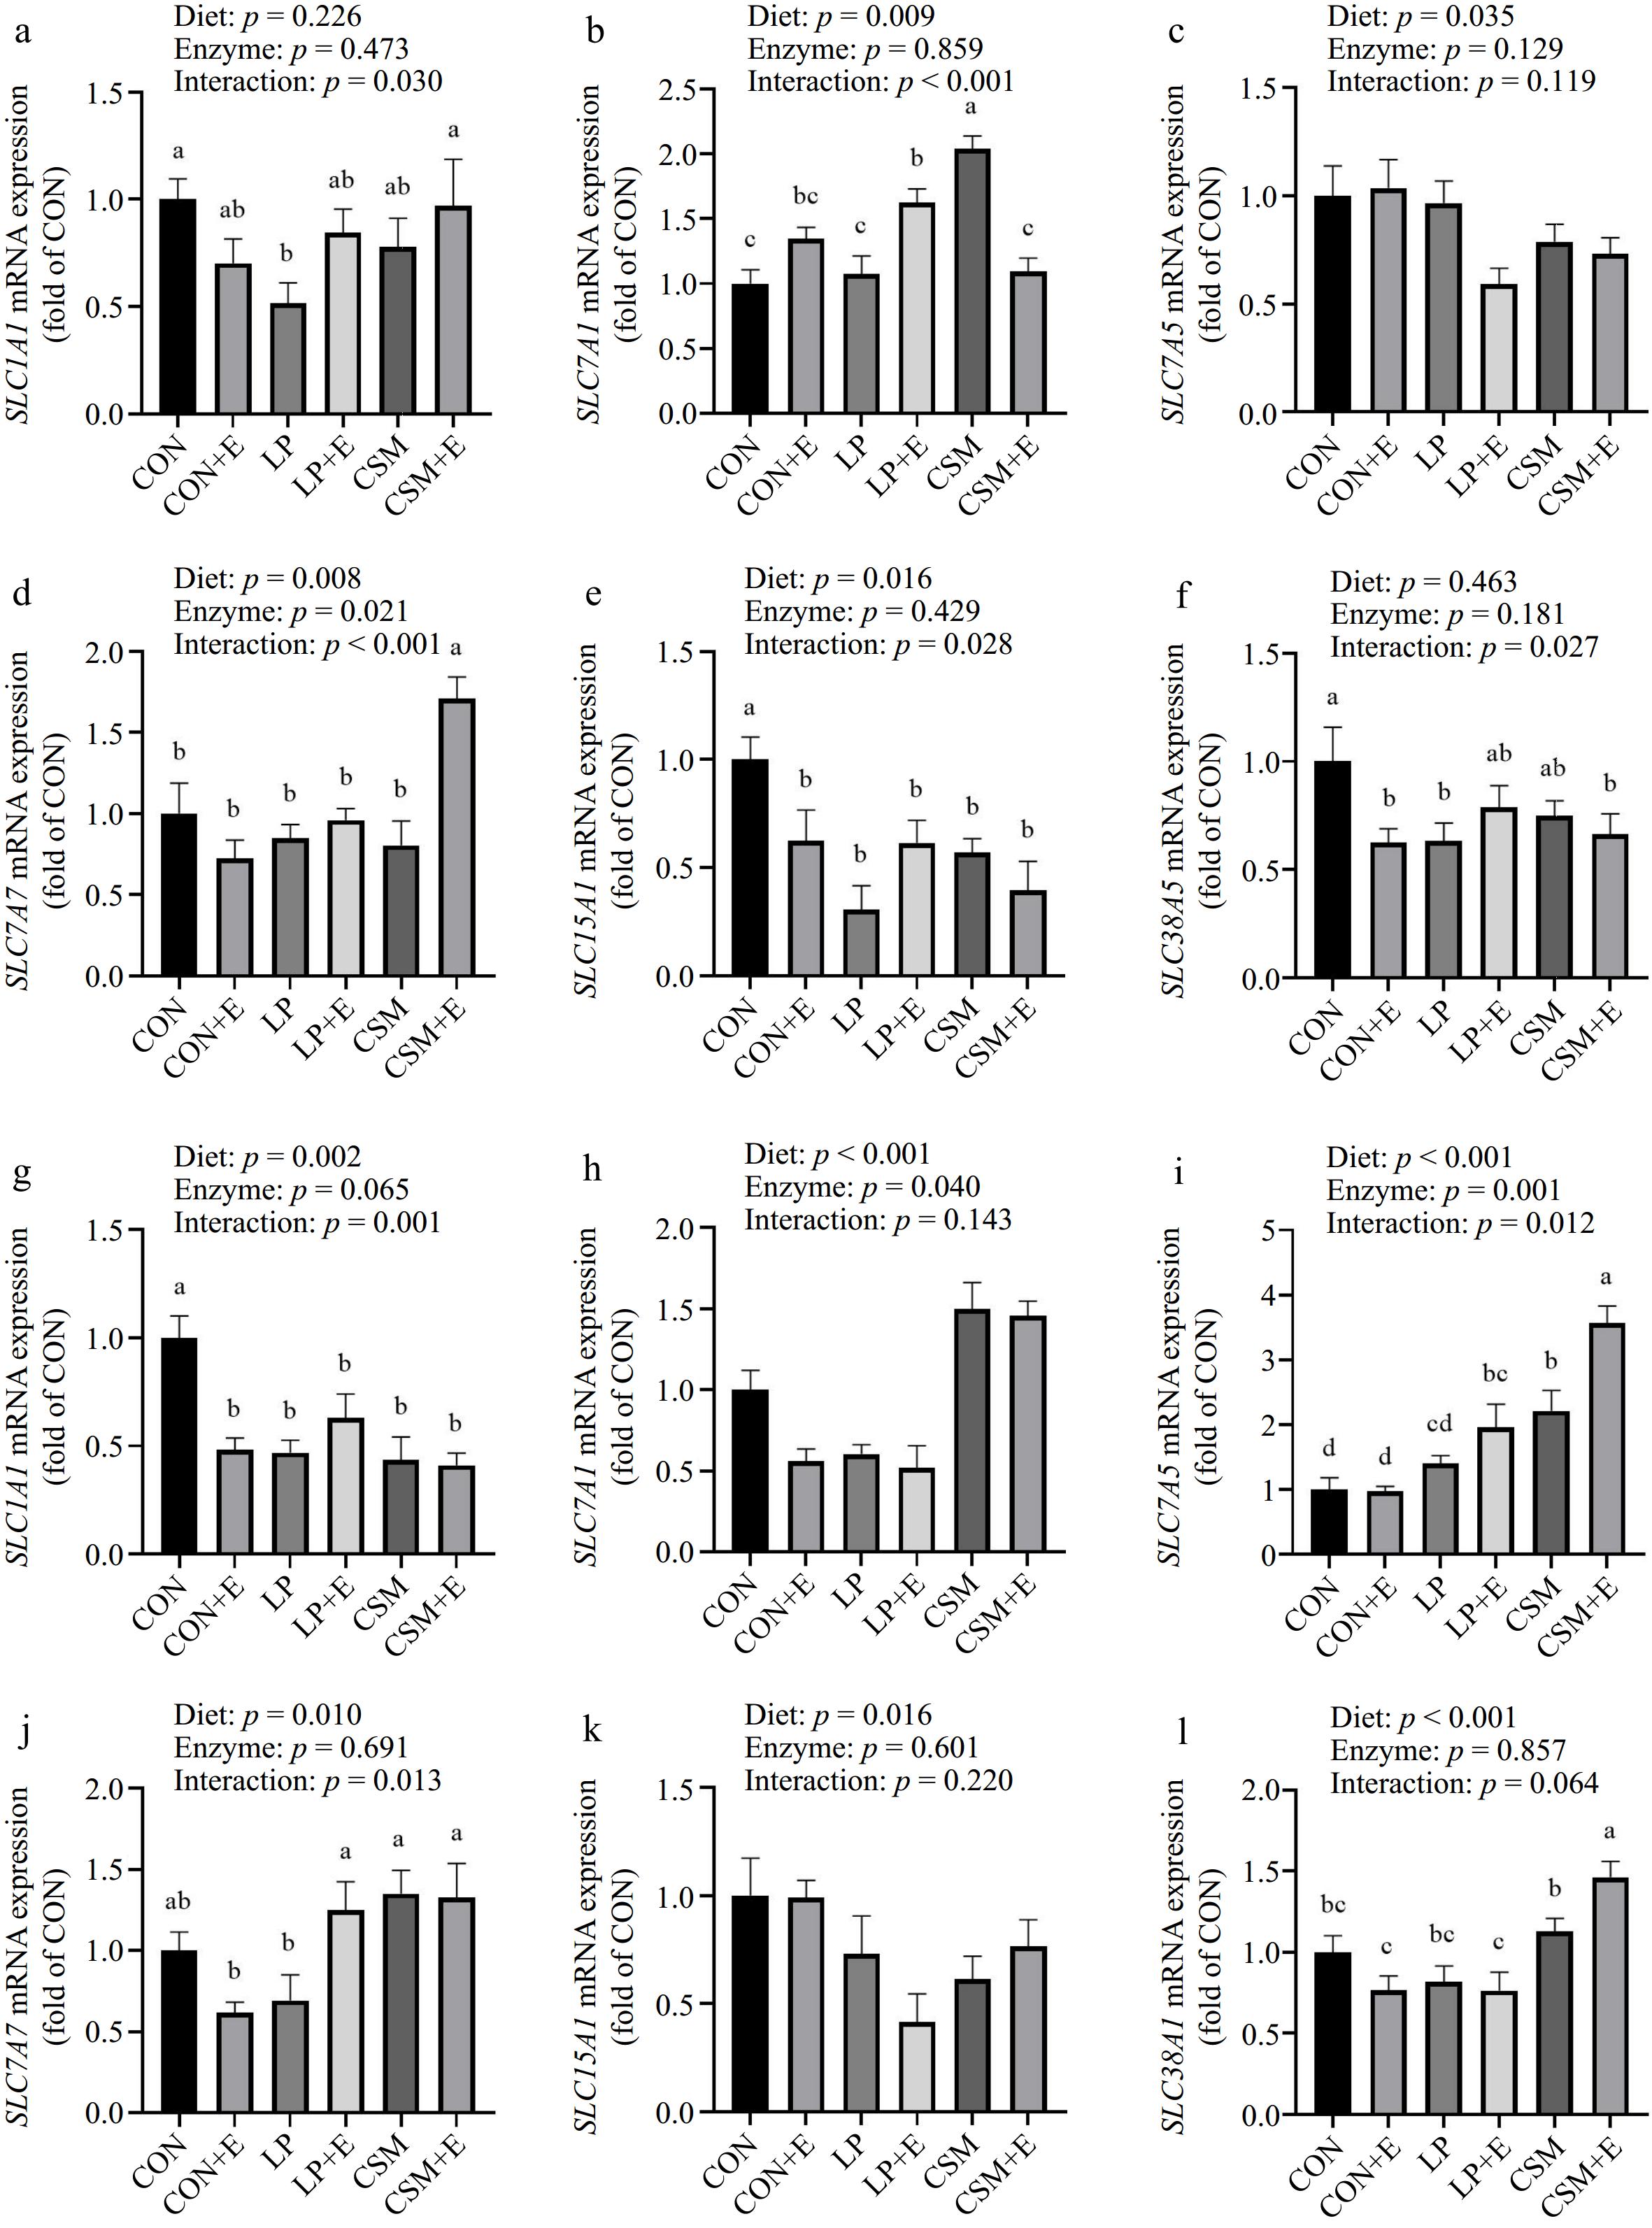
Figure 2.
Effects of low protein diet and miscellaneous meal diet and enzyme supplementation on jejunal amino acid transporters gene expressions of Langshan chickens. (a)−(f) Are the expression levels of jejunal amino acid transporters gene at 58 d, and (g)−(l) are the expression levels of jejunal amino acid transporters gene at 86 d. Data were represented as mean ± SE (n = 8). a−c Different letters indicate significant difference among the CON, CON + E, LP, LP + E, CSM, and CSM + E groups. CON, corn soybean meal; CON + E, corn soybean meal with enzyme; LP, low protein meal; LP + E, low protein meal with enzyme; CSM, corn soybean miscellaneous meal; CSM + E, corn soybean miscellaneous meal with enzyme.
-
Ingredients2 (%) 30−58 d 59−86 d1 CON CON + E LP LP + E CSM CSM + E CON CON + E LP LP + E CSM CSM + E Corn 69.68 69.63 76.51 76.46 69.09 69.04 77.80 77.75 79.99 79.94 76.6 76.55 Soybean meal 25.50 25.50 18.73 18.73 12.40 12.40 18.04 18.04 10.37 10.37 8.00 8.00 Rapeseed meal 0.00 0.00 0.00 0.00 4.30 4.30 0.00 0.00 0.00 0.00 5.00 5.00 Cottonseed meal 0.00 0.00 0.00 0.00 4.00 4.00 0.00 0.00 0.00 0.00 3.00 3.00 Peanut meal 0.00 0.00 0.00 0.00 4.00 4.00 0.00 0.00 0.00 0.00 2.00 2.00 Bran 0.00 0.00 0.00 0.00 0.00 0.00 0.00 0.00 5.00 5.00 0.00 0.00 Soybean oil 0.90 0.90 0.20 0.20 1.90 1.90 0.90 0.90 0.70 0.70 1.90 1.90 Dicalcium phosphate 2.00 2.00 2.00 2.00 1.90 1.90 0.91 0.91 0.90 0.90 0.85 0.85 Limestone 1.00 1.00 1.05 1.05 1.05 1.05 1.40 1.40 1.45 1.45 1.40 1.40 L-lysinežHCl 0.18 0.18 0.37 0.37 0.34 0.34 0.23 0.23 0.43 0.43 0.35 0.35 DL-methionine 0.11 0.11 0.14 0.14 0.13 0.13 0.09 0.09 0.13 0.13 0.10 0.10 Threonine 0.00 0.00 0.11 0.11 0.08 0.08 0.00 0.00 0.12 0.12 0.05 0.05 Tryptophan 0.00 0.00 0.03 0.03 0.02 0.02 0.00 0.00 0.03 0.03 0.01 0.01 Isoleucine 0.00 0.00 0.12 0.12 0.10 0.10 0.00 0.00 0.13 0.13 0.08 0.08 Valine 0.00 0.00 0.11 0.11 0.06 0.06 0.00 0.00 0.12 0.12 0.03 0.03 Salt 0.30 0.30 0.30 0.30 0.30 0.30 0.30 0.30 0.30 0.30 0.30 0.30 50% Choline chloride 0.10 0.10 0.10 0.10 0.10 0.10 0.10 0.10 0.10 0.10 0.10 0.10 Compound enzymes3 0.00 0.05 0.00 0.05 0.00 0.05 0.00 0.05 0.00 0.05 0.00 0.05 Vitamin premix4 0.03 0.03 0.03 0.03 0.03 0.03 0.03 0.03 0.03 0.03 0.03 0.03 Mineral premix5 0.20 0.20 0.20 0.20 0.20 0.20 0.20 0.20 0.20 0.20 0.20 0.20 Total 100 100 100 100 100 100 100 100 100 100 100 100 Calculated nutrients Metabolizable energy (MJ/kg) 12.31 12.31 12.31 12.31 12.33 12.33 12.67 12.67 12.68 12.68 12.67 12.67 Crude protein6 17.34 17.23 15.47 15.66 17.76 17.42 15.25 15.22 13.39 13.10 15.22 15.00 Lysine 0.93 0.93 0.93 0.93 0.93 0.93 0.81 0.81 0.81 0.81 0.81 0.81 Methionine 0.39 0.39 0.39 0.39 0.40 0.40 0.34 0.34 0.34 0.34 0.34 0.34 Threonine 0.69 0.69 0.69 0.69 0.69 0.69 0.57 0.57 0.57 0.57 0.57 0.57 Tryptophan 0.19 0.19 0.19 0.19 0.19 0.19 0.15 0.15 0.15 0.15 0.15 0.15 Leucine 1.50 1.50 1.33 1.33 1.36 1.36 1.32 1.32 1.13 1.13 1.23 1.23 Isoleucine 0.68 0.68 0.68 0.68 0.68 0.68 0.55 0.55 0.55 0.55 0.56 0.56 Valine 0.79 0.79 0.79 0.79 0.79 0.79 0.67 0.67 0.67 0.67 0.66 0.66 Phenylalanine 0.85 0.85 0.72 0.72 0.79 0.79 0.72 0.72 0.58 0.58 0.67 0.67 Calcium 0.90 0.90 0.90 0.90 0.90 0.90 0.77 0.77 0.77 0.77 0.77 0.77 Non-phytic acid phosphorus 0.40 0.40 0.40 0.40 0.40 0.40 0.22 0.22 0.22 0.22 0.22 0.22 1 CON, corn soybean meal; CON + E, corn soybean meal with enzyme; LP, low protein meal; LP + E, low protein meal with enzyme; CSM, corn soybean miscellaneous meal; CSM + E, corn soybean miscellaneous meal with enzyme. 2 Crude protein level of soybean meal: 44.2%; Crude protein level of rapeseed meal: 38.6%; Crude protein level of cottonseed meal: 47%; Crude protein level of peanut meal: 47.8%. 3 Compound enzymes per gram provide xylanase ≥ 25,000 U, β-mannanase ≥ 2,500 U, β-glucanase ≥ 5,000 U, cellulase ≥ 2,000 U, protease ≥ 12,000 U, α-amylase ≥ 1,250 U, phytase ≥ 5,000 U. 4 Vitamin premix provided per kilogram of diet: vitamin A, 12,000 IU; vitamin D3, 2,500 IU; vitamin E, 30 IU; menadione, 1.3 mg; thiamine, 2.2 mg; riboflavin, 6 mg; nicotinamide, 50 mg; D-pantothenic acid, 12 mg; pyidoxine·HCl, 4 mg; biotin, 0.04 mg; folic acid, 1.25 mg; vitamin B12, 0.02 mg. 5 Mineral premix provided per kilogram of diet: iron, 80 mg; copper, 10 mg; manganese, 80 mg; zinc, 75 mg; iodine, 0.35 mg; selenium, 0.15 mg. 6 Crude protein: The crude protein level was measured in each treatment group. Table 1.
Ingredients and nutrient composition of experimental diets.
-
Genes1 GenBank numbers Primer sequences (5'-3') Product lengths (bp) ZO-1 XM_015278981.2 F: CTTCAGGTGTTTCTCTTCCTCCTC R: CTGTCCTTTTCATGGCTGGATC 133 Occludin XM_025144248.1 F: TCATCGCCTCCATCGTCTAC R: TCTTACTGCGCGTCTTCTGG 240 Claudin1 NM_001013611.2 F: GACCAGGTGAAGAAGATGCGGATG R: CGAGCCACTCTGTTGCCATACC 107 SLC1A1 XM_046936555 F: CTCTACGAGGCAGTAGCAGC R: AGCGCTCAGAACAATCACCA 162 SLC7A1 XM_046908303 F: TCTATGTACTGGCTGGGGCT R: TTCCACCCCGTAATGAAGGC 199 SLC7A5 NM_001030579.3 F: GGTATGATGTGGCTGCGTTA R: AGAAACAAGCAAGCCAGGAT 98 SLC7A7 XM_040665181.2 F: CACAAGCGAAAAACTGCGGA R: ACATTCCACCAAGAGCCCAG 167 SLC15A1 NM_204365.2 F: GCCCCATGGCTGCAAAAAG R: GCTCGCATGCCATAGTAGGA 127 SLC38A1 NM_001199603.3 F: TGAGCAGGTTTTCGGTACCC R: TCCACGTACCATGCCGAAAA 165 18S XM_040648653.2 F: TAGAGGGACAAGTGGCGTTC R: GGCGTAGGGTAGACACAACC 121 1 ZO-1, zonula occludens-1; SLC1A1, solute carrier family 1 member 1; SLC7A1, solute carrier family 7 member 1; SLC7A5, solute carrier family 7 member 5; SLC7A7, solute carrier family 7 member 7; SLC15A1, solute carrier family 15 member 1; SLC38A1, solute carrier family 38 member 1. Table 2.
Primer sequences for real-time quantitative PCR analysis.
-
Items2 30−58 d 59−86 d 30−86 d1 ADG
(g/bird/d)ADFI
(g/bird/d)F/G
(g/g)ADG
(g/bird/d)ADFI
(g/bird/d)F/G
(g/g)30d BW
(g/bird)87d BW
(g/bird)ADG
(g/bird/d)ADFI
(g/bird/d)F/G
(g/g)CON 20.11 61.60 3.06 19.14 84.03 4.41 313.59 1398.05 19.63 72.82 3.72 CON + E 20.06 62.86 3.13 19.87 85.82 4.35 313.56 1412.08 19.97 74.32 3.73 LP 19.84 59.55 3.00 18.75 83.20 4.47 308.15 1385.38 19.29 72.17 3.75 LP + E 20.61 62.58 3.04 18.62 83.97 4.54 310.76 1396.55 19.62 73.28 3.74 CSM 20.45 59.04 2.89 20.28 85.13 4.22 301.03 1424.10 20.36 72.09 3.55 CSM + E 21.24 61.36 2.89 21.06 88.31 4.23 309.11 1489.56 21.14 74.96 3.56 SEM 0.41 1.22 0.02 0.79 1.90 0.13 4.00 30.94 0.52 1.28 0.06 Main effect Diet CON 20.09 62.21 3.10a 19.51 84.92 4.38 313.58 1405.06 19.80ab 73.57 3.72a LP 20.22 61.07 3.02b 18.68 83.59 4.50 309.46 1390.96 19.45b 72.73 3.75a CSM 20.85 60.20 2.89c 20.67 86.72 4.23 305.07 1456.83 20.75a 73.52 3.55b Enzyme − 20.13 60.06b 2.98 19.39 84.12 4.37 307.59 1402.51 19.76 72.36 3.67 + 20.64 62.26a 3.02 19.85 86.03 4.38 311.15 1432.73 20.24 74.19 3.68 p Value Diet 0.164 0.281 0.001 0.052 0.293 0.118 0.134 0.101 0.046 0.774 0.005 Enzyme 0.142 0.037 0.078 0.482 0.243 0.919 0.300 0.247 0.267 0.098 0.936 Diet × Enzyme 0.518 0.766 0.356 0.812 0.830 0.879 0.611 0.628 0.886 0.783 0.984 1 BW, Body weight; ADG, Average daily gain; ADFI, Average daily feed intake; F/G, feed to gain ratio. 2 CON, corn soybean meal; CON + E, corn soybean meal with enzyme; LP, low protein meal; LP + E, low protein meal with enzyme; CSM, corn soybean miscellaneous meal; CSM + E, corn soybean miscellaneous meal with enzyme. Table 3.
Effects of low protein diet and miscellaneous meal diet and enzyme supplementation on the growth performance of Langshan chickens.
-
Items2 56−58 d1 84−86 d DM (%) CP (%) EE (%) CF (%) NFE (%) Ash (%) DM (%) CP (%) EE (%) CF (%) NFE (%) Ash (%) CON 67.54c 35.79 74.26 24.68 83.58bc 16.24 73.38 41.77 68.61 26.71 87.20 18.95b CON + E 70.76b 41.44 77.58 24.26 85.13b 23.33 75.57 43.62 71.44 27.48 89.37 24.16a LP 72.85a 39.23 70.72 28.66 87.08a 21.22 74.59 39.48 75.41 25.35 88.30 19.34b LP + E 71.29ab 41.13 71.47 28.53 84.40b 24.85 75.17 42.53 73.45 24.52 87.96 18.09b CSM 66.04c 31.59 77.80 26.11 82.13c 17.24 75.30 38.76 80.60 23.91 90.04 19.13b CSM + E 69.72b 35.72 83.52 28.31 85.33ab 21.36 76.65 41.59 78.39 28.03 90.97 19.65b SEM 0.55 1.32 1.42 0.86 0.60 0.93 0.54 1.19 1.38 1.04 0.60 0.81 Main effects Diet CON 69.15b 38.62a 75.92b 24.47c 84.35b 19.78b 74.48b 42.69 70.02c 27.10 88.29b 21.56a LP 72.07a 40.18a 71.10c 28.59a 85.74a 23.03a 74.88ab 41.01 74.43b 24.93 88.13b 18.71b CSM 67.88c 33.65b 80.66a 27.21b 83.73b 19.30b 75.98a 40.18 79.50a 25.97 90.51a 19.39b Enzyme − 68.81b 35.54b 74.26 26.48 84.26 18.23b 74.42b 40.00b 74.87 25.32 88.52 19.14 + 70.59a 39.43a 77.52 27.03 84.95 23.18a 75.80a 42.58a 74.43 26.68 89.44 20.63 p Value Diet < 0.001 < 0.001 < 0.001 < 0.001 0.009 0.001 0.030 0.146 < 0.001 0.144 < 0.001 0.004 Enzyme < 0.001 0.001 0.012 0.461 0.186 < 0.001 0.005 0.018 0.720 0.129 0.073 0.033 Diet × Enzyme < 0.001 0.397 0.275 0.293 < 0.001 0.172 0.366 0.884 0.184 0.074 0.135 0.001 1 CP, Crude protein; DM, Dry matter; CF, Coarse fibre; EE, Ether extract; NFE, Nitrogen free extract. 2 CON, corn soybean meal; CON + E, corn soybean meal with enzyme; LP, low protein meal; LP + E, low protein meal with enzyme; CSM, corn soybean miscellaneous meal; CSM + E, corn soybean miscellaneous meal with enzyme.The data are presented as Mean (n = 8). abc Means with no common superscript in the same column are significantly different (p < 0.05). Table 4.
Effects of low protein diet and miscellaneous diet and enzyme supplementation on the apparent metabolizablity of Langshan chickens.
-
Items2 58 d 86 d1 VH (μm) CD (μm) VH/CD VH (μm) CD (μm) VH/CD CON 946.47 239.91 4.50 977.67 222.11 4.16 CON + E 974.95 243.19 4.75 1228.90 250.10 4.89 LP 1081.78 219.15 4.78 1123.83 240.69 4.93 LP + E 1154.69 234.00 5.24 1208.70 220.65 5.43 CSM 1195.47 253.22 4.71 1027.88 227.86 4.35 CSM + E 1262.63 254.69 4.92 1139.02 251.47 4.50 SEM 57.49 12.65 0.33 52.58 12.71 0.27 Main effect Diet CON 960.71b 241.55 4.62 1103.29 236.11 4.52b LP 1118.23a 226.57 5.01 1166.27 230.67 5.18a CSM 1229.05a 253.96 4.82 1083.45 239.67 4.42b Enzyme − 1074.57 237.43 4.66 1043.13b 230.22 4.48 + 1130.75 243.96 4.97 1192.21a 240.74 4.94 p Value Diet 0.001 0.160 0.556 0.296 0.787 0.041 Enzyme 0.273 0.568 0.296 0.002 0.332 0.078 Diet × Enzyme 0.926 0.873 0.922 0.273 0.144 0.639 1 VH, Villus height CD, Crypt depth; VH:CD, Villus height to Crypt depth ratio. 2 CON, corn soybean meal; CON + E, corn soybean meal with enzyme; LP, low protein meal; LP + E, low protein meal with enzyme; CSM, corn soybean miscellaneous meal; CSM + E, corn soybean miscellaneous meal with enzyme. The data are presented as Mean (n = 8). ab Means with no common superscript in the same column are significantly different (p < 0.05). Table 5.
Effects of low protein diet and miscellaneous diet and enzyme supplementation on the intestinal morphology of jejunum in Langshan chickens.
-
Items1 58 d 86 d Amylase U/mg prot Lipase U/g prot Protease U/mg prot Amylase U/mg prot Lipase U/g prot Protease U/mg prot CON 44.78 724.48 17.89 76.88 634.86 15.04 CON + E 53.16 728.93 19.76 94.08 635.92 17.17 LP 45.59 684.26 13.65 92.20 572.46 15.47 LP + E 52.95 718.66 16.63 123.92 641.53 16.70 CSM 39.06 674.53 12.73 87.35 464.99 8.57 CSM + E 46.45 683.26 14.39 120.99 524.48 9.31 SEM 4.00 72.64 2.55 17.45 65.11 2.46 Main effect Diet CON 48.97 726.70 18.83 85.48 635.39 16.10a LP 49.27 701.46 15.14 108.06 607.00 16.09a CSM 42.76 678.89 13.56 104.17 494.73 8.94b Enzyme − 43.15b 694.42 14.76 85.48 557.44 13.03 + 50.85a 710.28 16.93 113.00 600.64 14.39 p Value Diet 0.221 0.836 0.201 0.447 0.102 0.022 Enzyme 0.029 0.806 0.373 0.085 0.431 0.546 Diet × Enzyme 0.991 0.978 0.969 0.893 0.864 0.968 1 CON, corn soybean meal; CON + E, corn soybean meal with enzyme; LP, low protein meal; LP + E, low protein meal with enzyme; CSM, corn soybean miscellaneous meal; CSM + E, corn soybean miscellaneous meal with enzyme. The data are presented as Mean (n = 8). ab Means with no common superscript in the same column are significantly different (p < 0.05). Table 6.
Effects of low protein diet and miscellaneous diet and enzyme supplementation on the digestive enzyme activities of jejunum digesta in Langshan chickens.
Figures
(2)
Tables
(6)