-
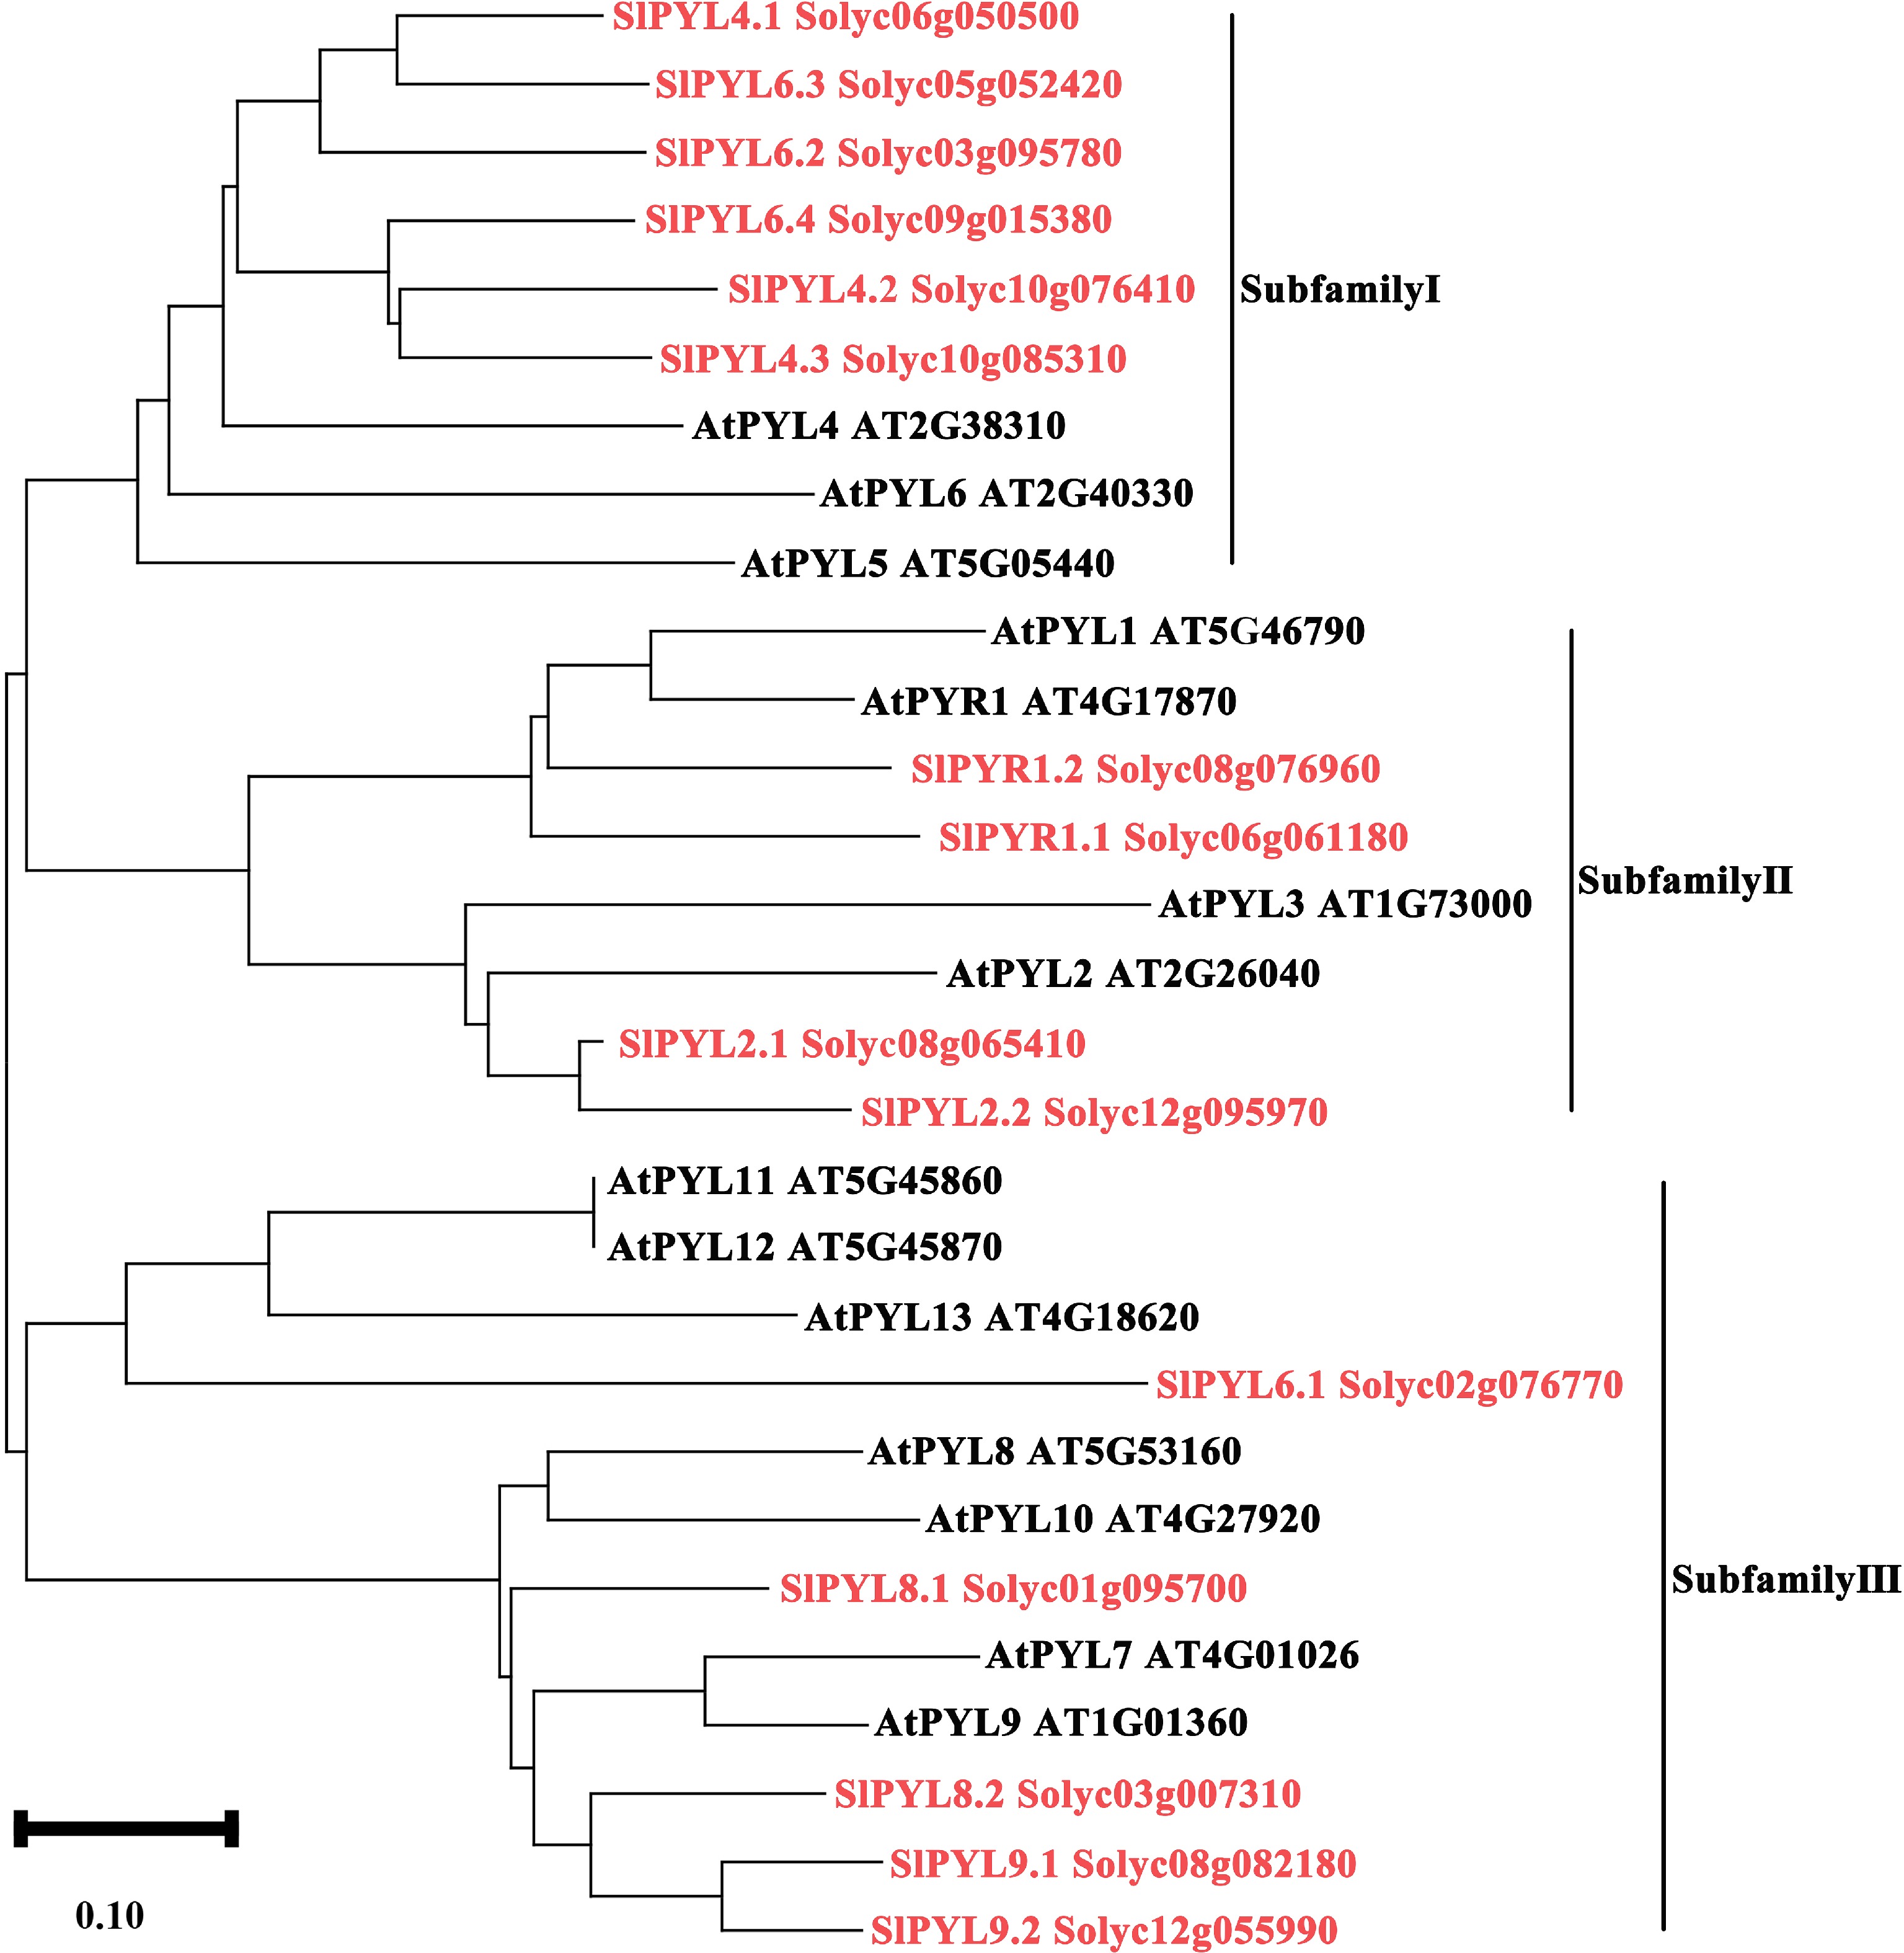
Figure 1.
Phylogenetic analysis of the PYR/PYL proteins from tomato and Arabidopsis. A phylogenetic tree of 29 PYR/PYL proteins from tomato (15) and Arabidopsis (14) was constructed by using MEGAX based on the neighbor-joining method. These proteins were classified into three subfamilies as marked in the figure. The sequences used are listed in Supplementary Table S2.
-
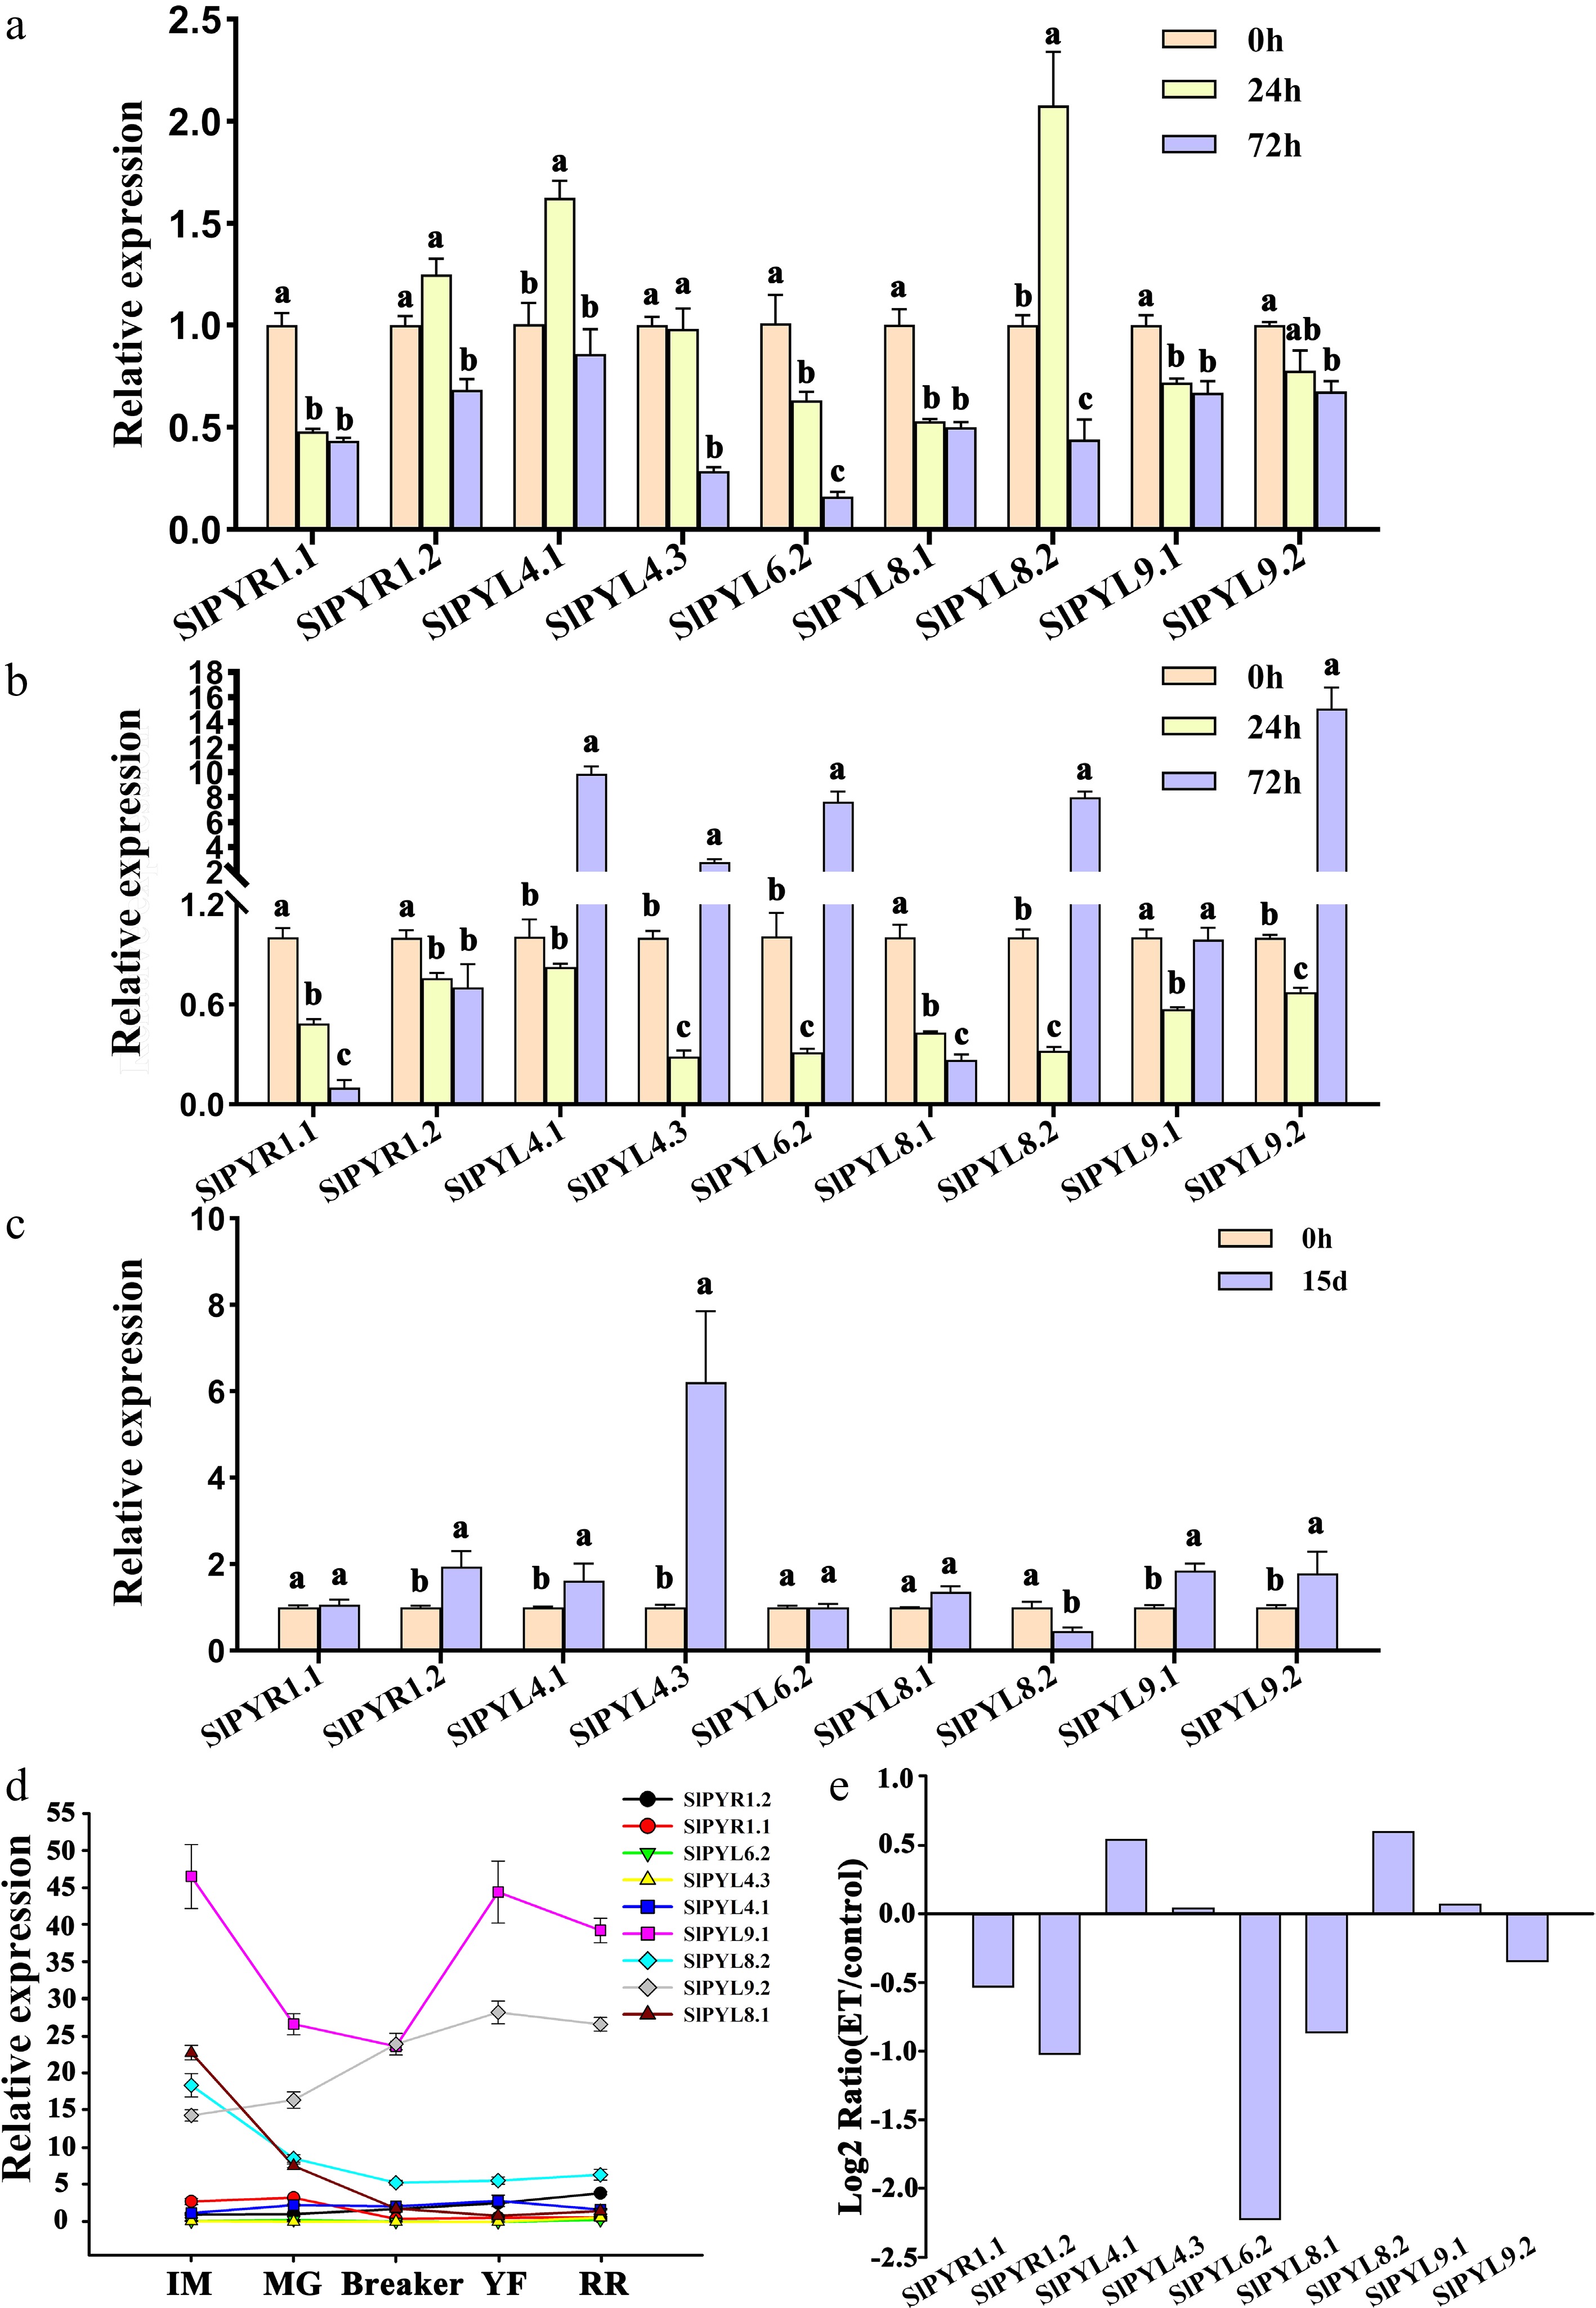
Figure 2.
Expression profiling of SlPYR/PYL genes responding to phytohormonal treatments and abiotic stresses in tomato determined by qRT-PCR. Expression patterns of SlPYR/PYLs at 0, 24, and 72 h after (a) ABA treatment, and (b) salt stress. (c) Expression of SlPYR/PYLs following 15-d progressive drought stress. (d) Expression of SlPYR/PYLs at different developmental stages during fruit maturation. IM, immature green (15 DPA). MG, mature green (35 DPA). BR, breaker (39 DPA). RR, red ripe (45 DPA). (e) Expression of SlPYR/PYLs in tomato fruit in response to exogenous ethylene (ET) application for 72 h. Data represents mean ± SEM of three biological replicates. Different lowercase letters indicate statistically significant differences (p < 0.05) between experimental groups.
-
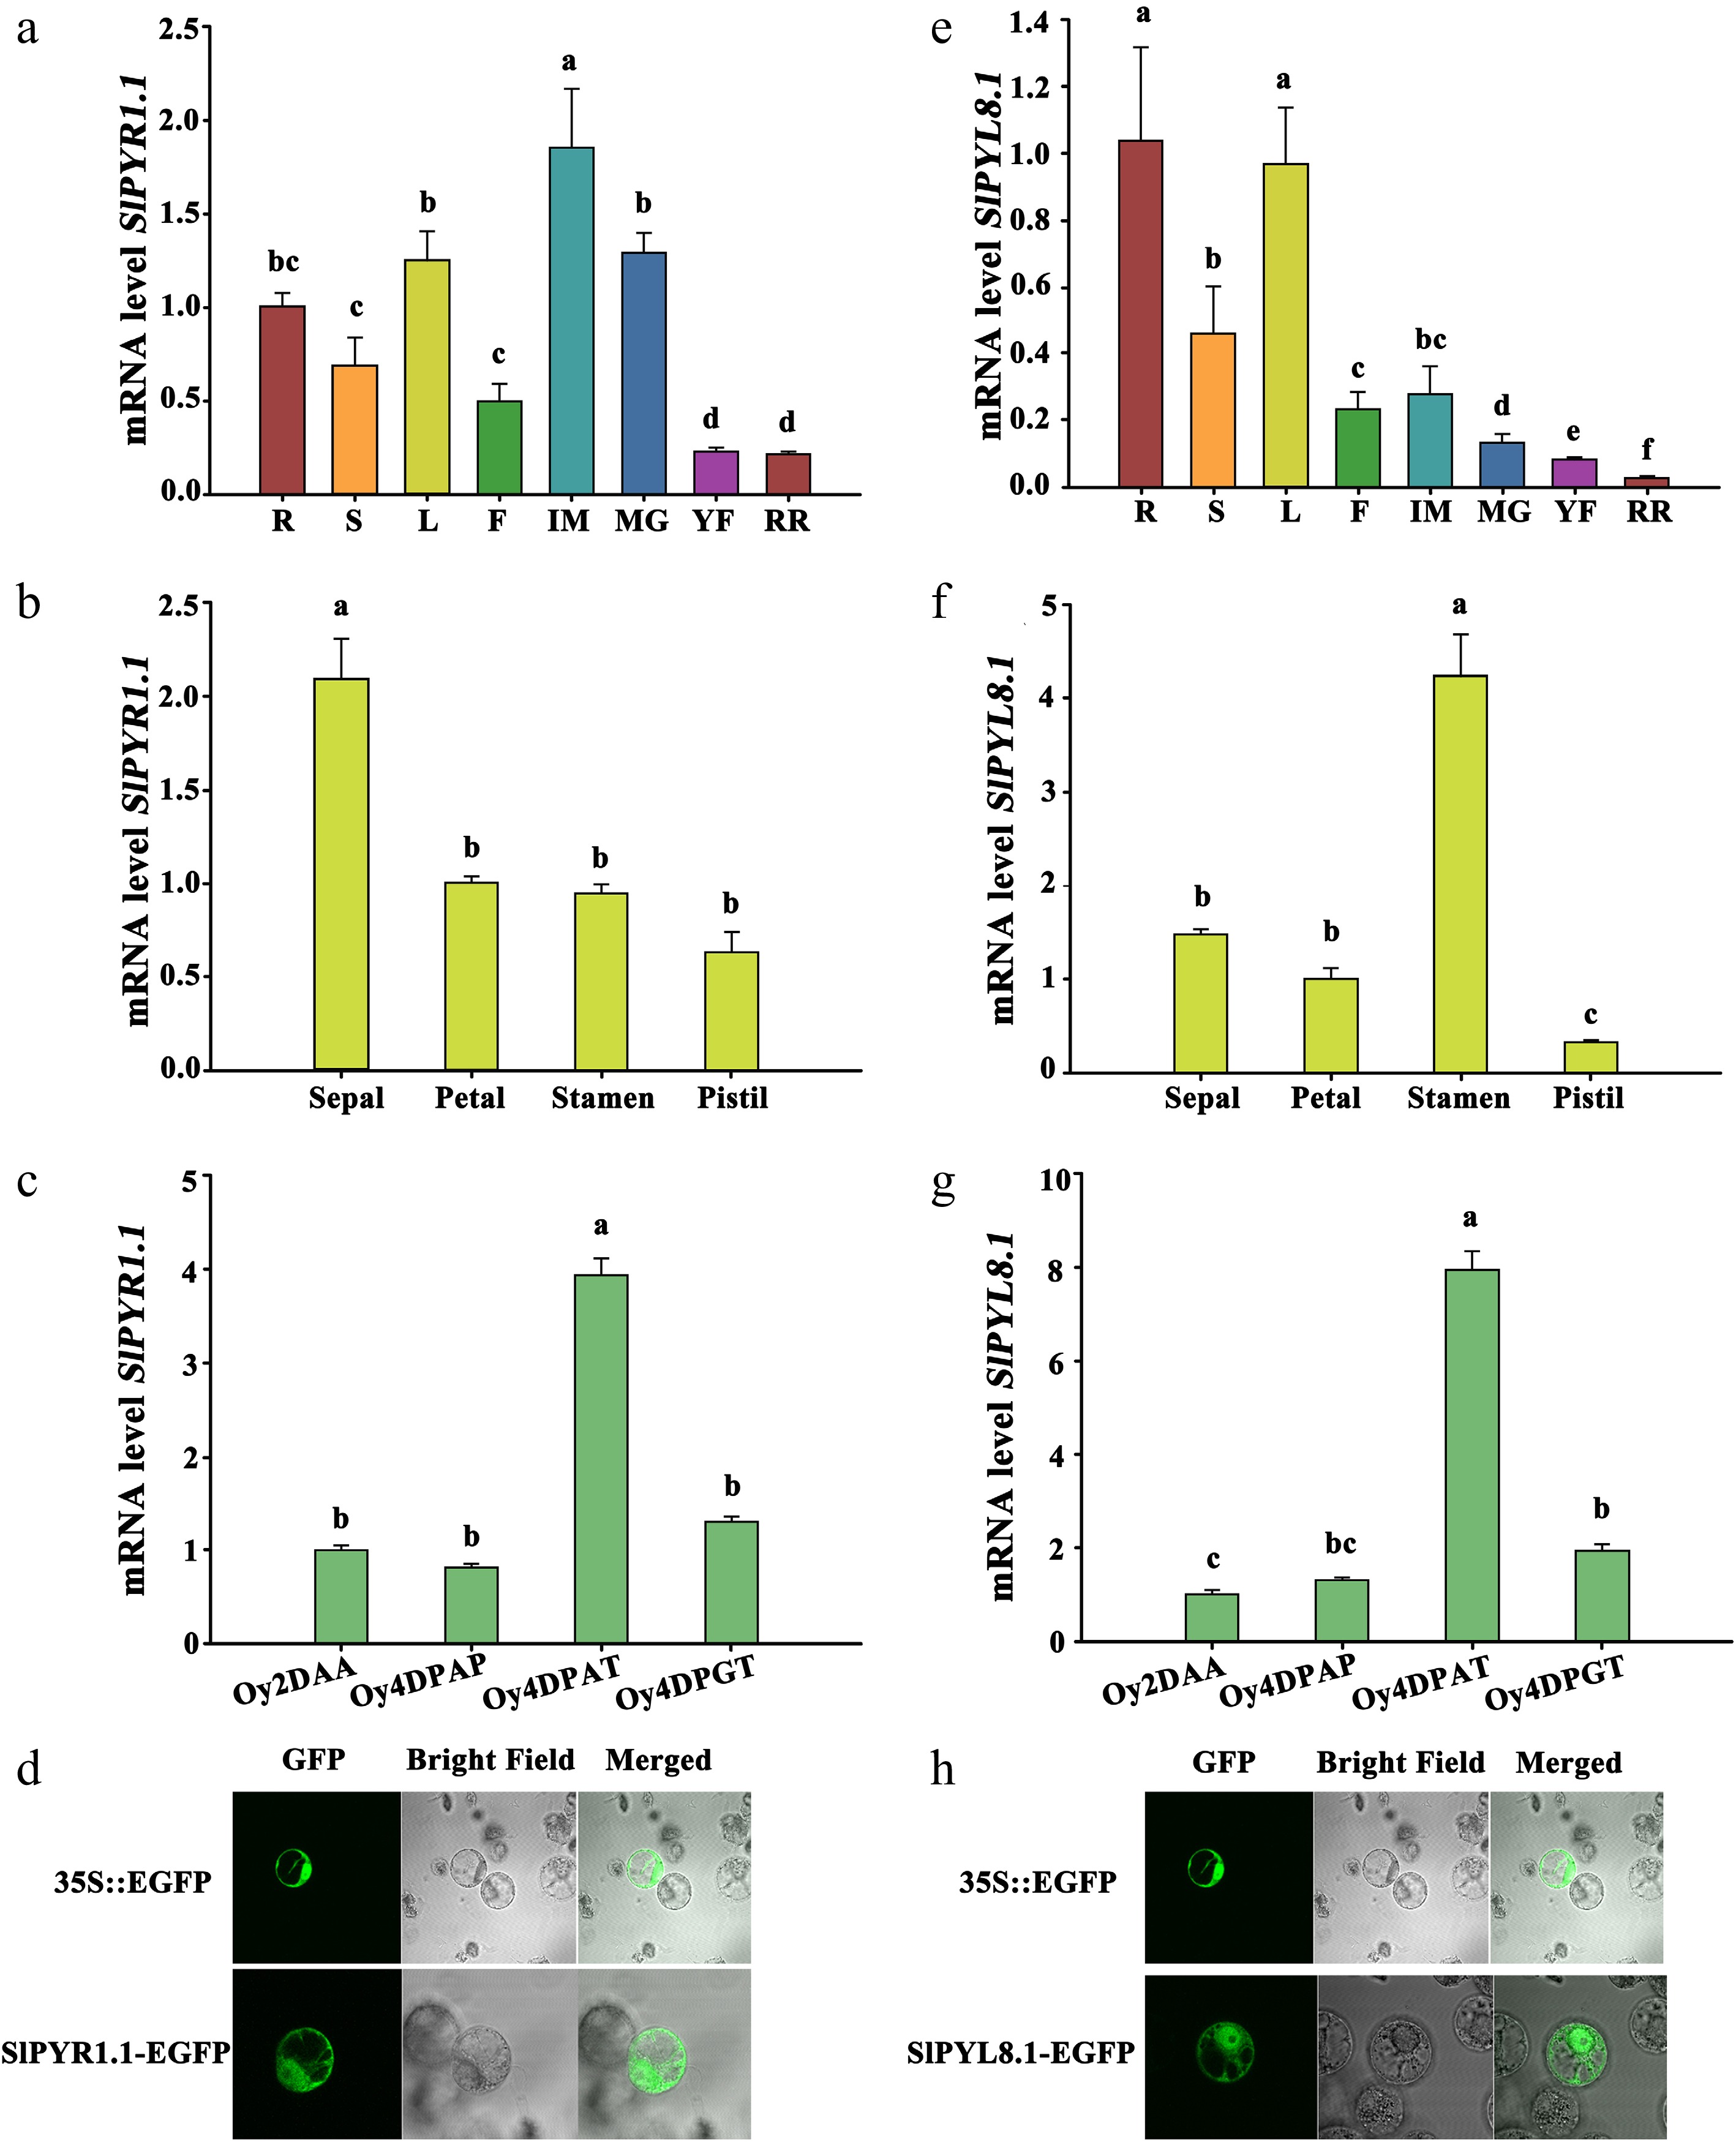
Figure 3.
Spatiotemporal expression and subcellular localization of SlPYR1.1 and SlPYL8.1. Expression patterns of (a) SlPYR1.1, and (e) SlPYL8.1 in various tissues/organs determined by qRT-PCR. R, S, L, F, IM, MG, YF, and RR indicate root, shoot, leaf, flower, and fruit at immature, mature green, yellow ripe, and red ripe stages, respectively. Expression profiles of (b) SlPYR1.1, and (f) SlPYL8.1 in four-whorled floral organs. Expressions of (c) SlPYR1.1, and (g) SlPYL8.1 in the ovaries at 2 d before anthesis (2 DAA), 4 d after pollination (4 DPAP), 2,4-dichlorophenoxyaceticacid (2,4-D) (4 DPAT), and GA3 application (4 DPGT). Data represents mean ± SEM of three biological replicates. Different lowercase letters indicate statistically significant differences (p < 0.05) between experimental groups. Subcellular localization of (d) SlPYR1.1, and (g) SlPYL8.1.
-
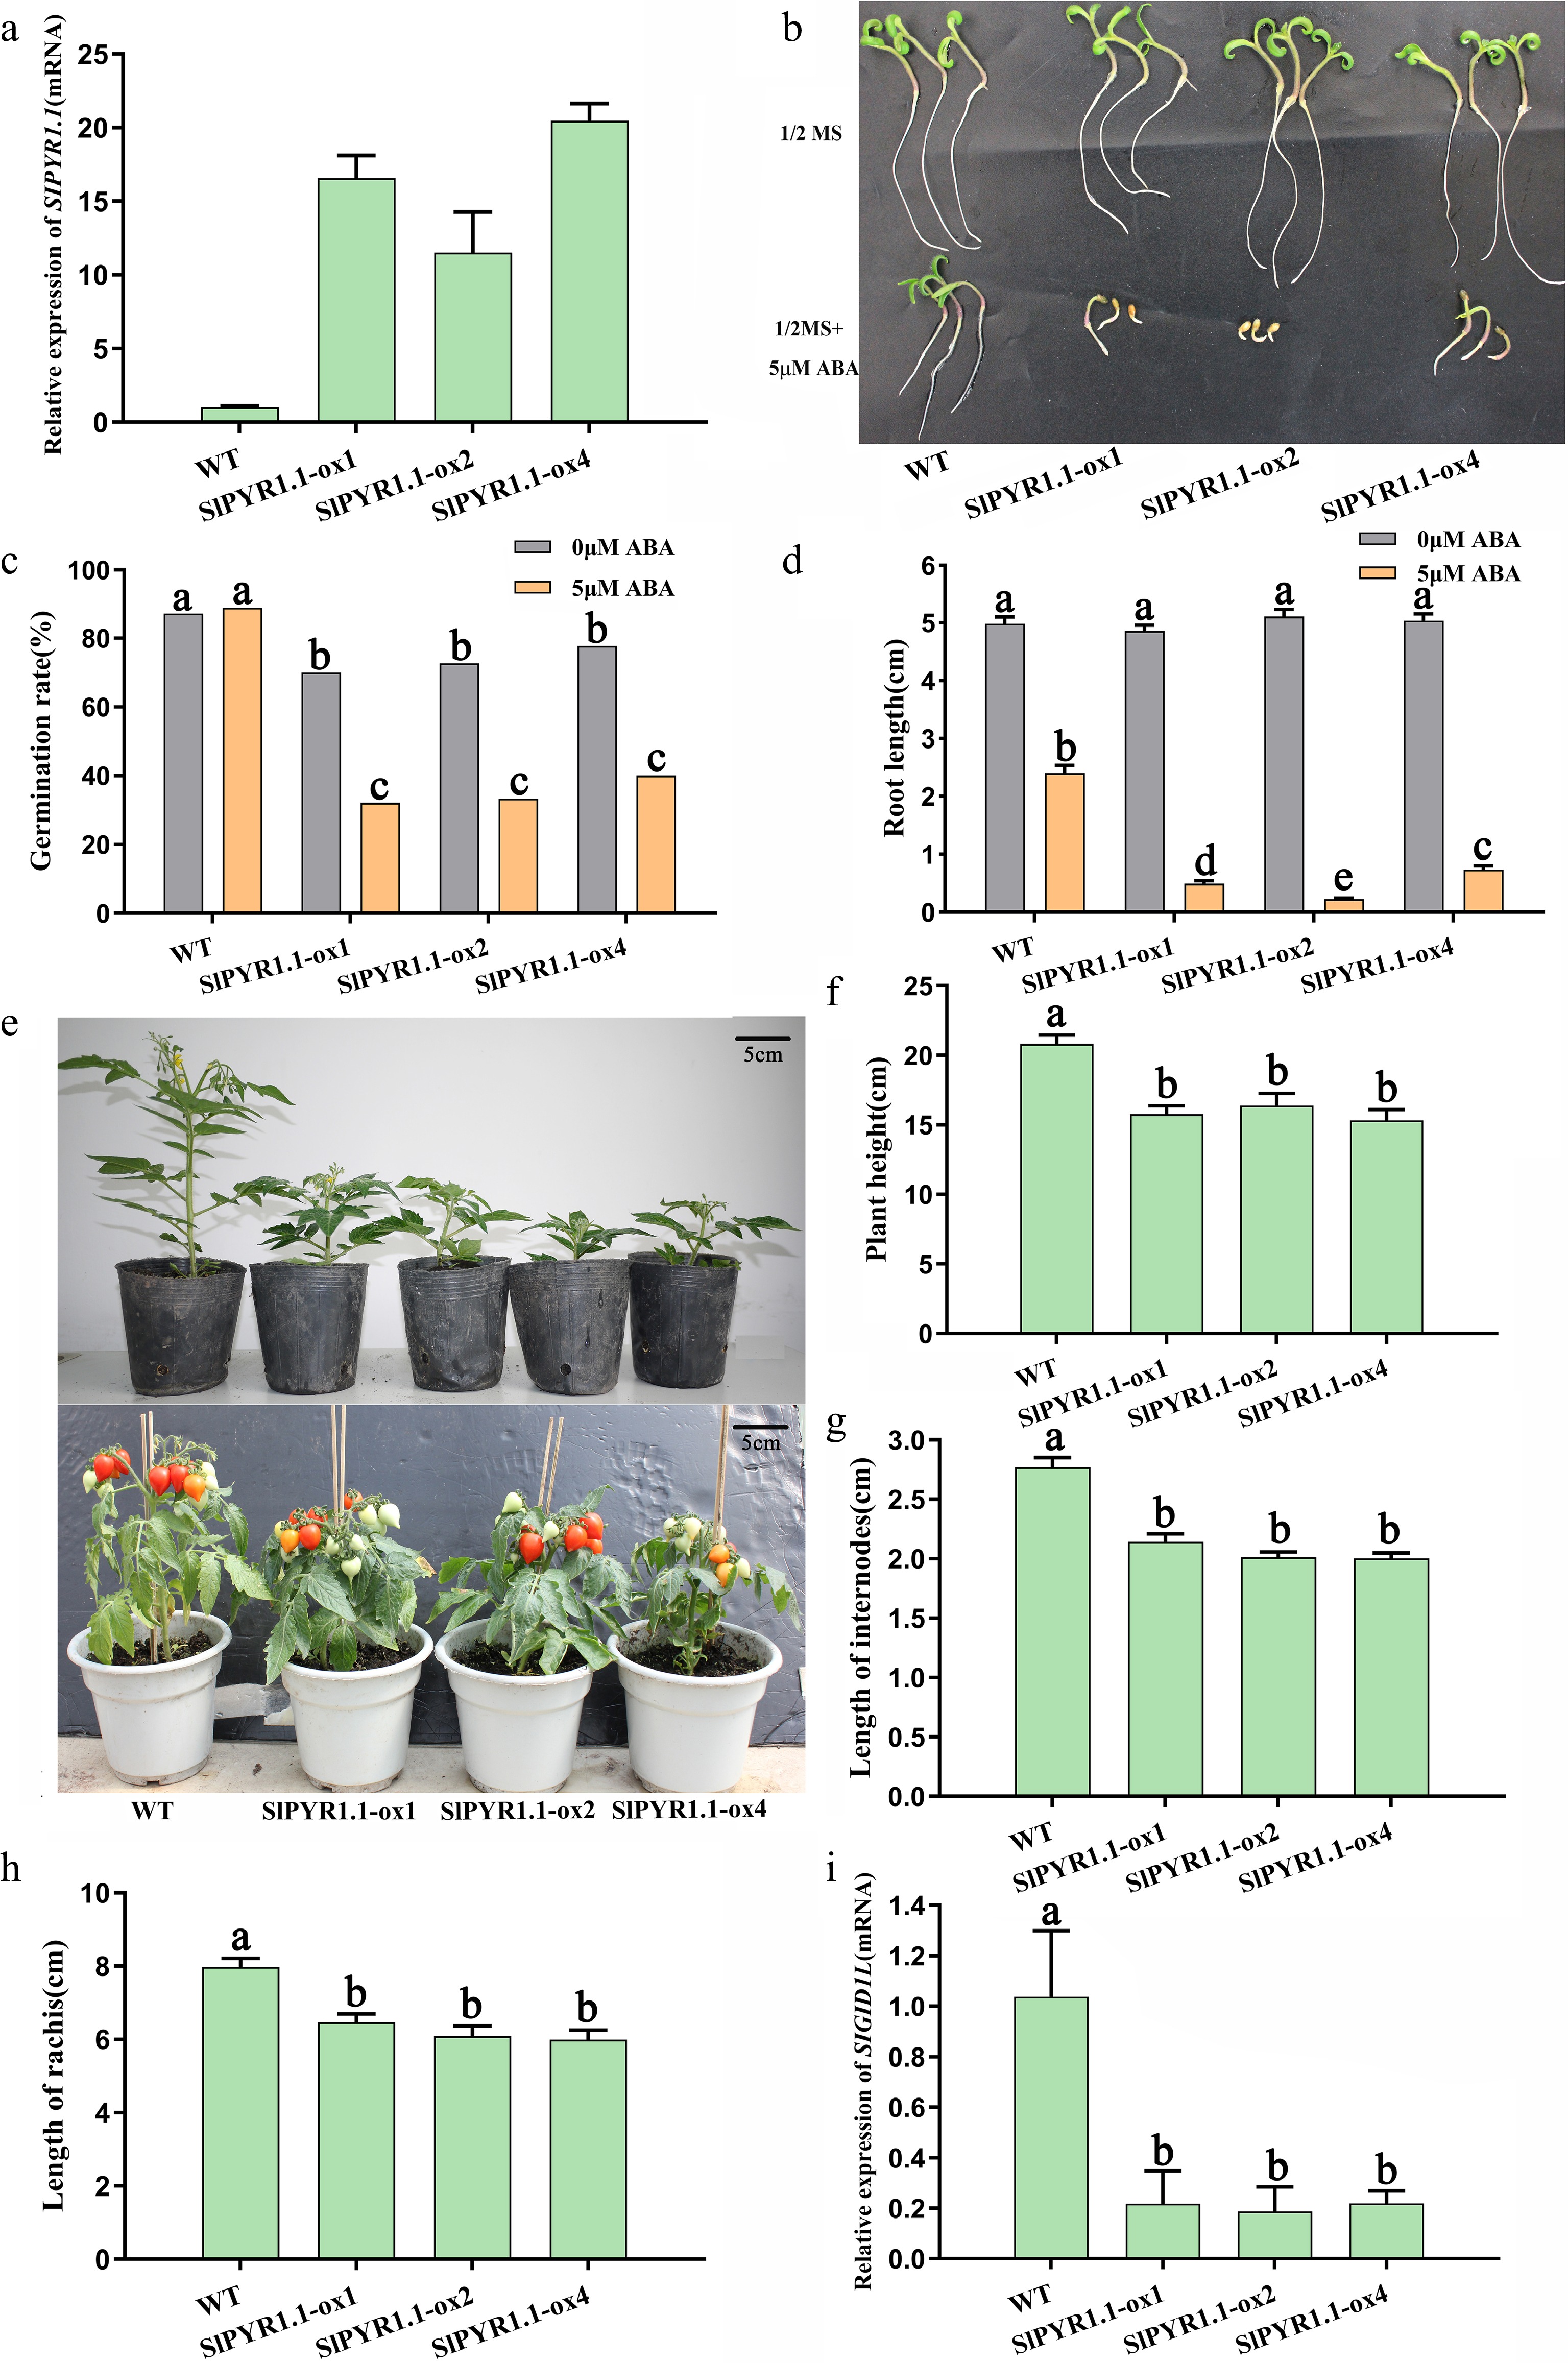
Figure 4.
Overexpression of SlPYR1.1 resulted in increased ABA sensitivity and plant dwarfism. (a) The relative mRNA level of SlPYR1.1 in three independent overexpression lines. (b) The seed germination and root growth of WT and transgenic plants on 1/2 MS medium supplemented with ABA. (c) Seed germination rate of WT and SlPYR1.1-OX plants under ABA treatment. (d) Root length of WT and SlPYR1.1-OX tomatoes under ABA treatment. (e) Phenotypic performance of transgenic plants across vegetative and reproductive phases. (f) Plant height, (g) length of internodes, and (h) rachis of WT and SlPYR1.1-OX tomatoes. (i) The relative mRNA level of SlGID1L in WT and SlPYR1.1-OX tomatoes. Data represents mean ± SEM of at least three biological replicates. Different lowercase letters indicate statistically significant differences (p < 0.05, one-way ANOVA with Tukey's HSD) among experimental groups.
-
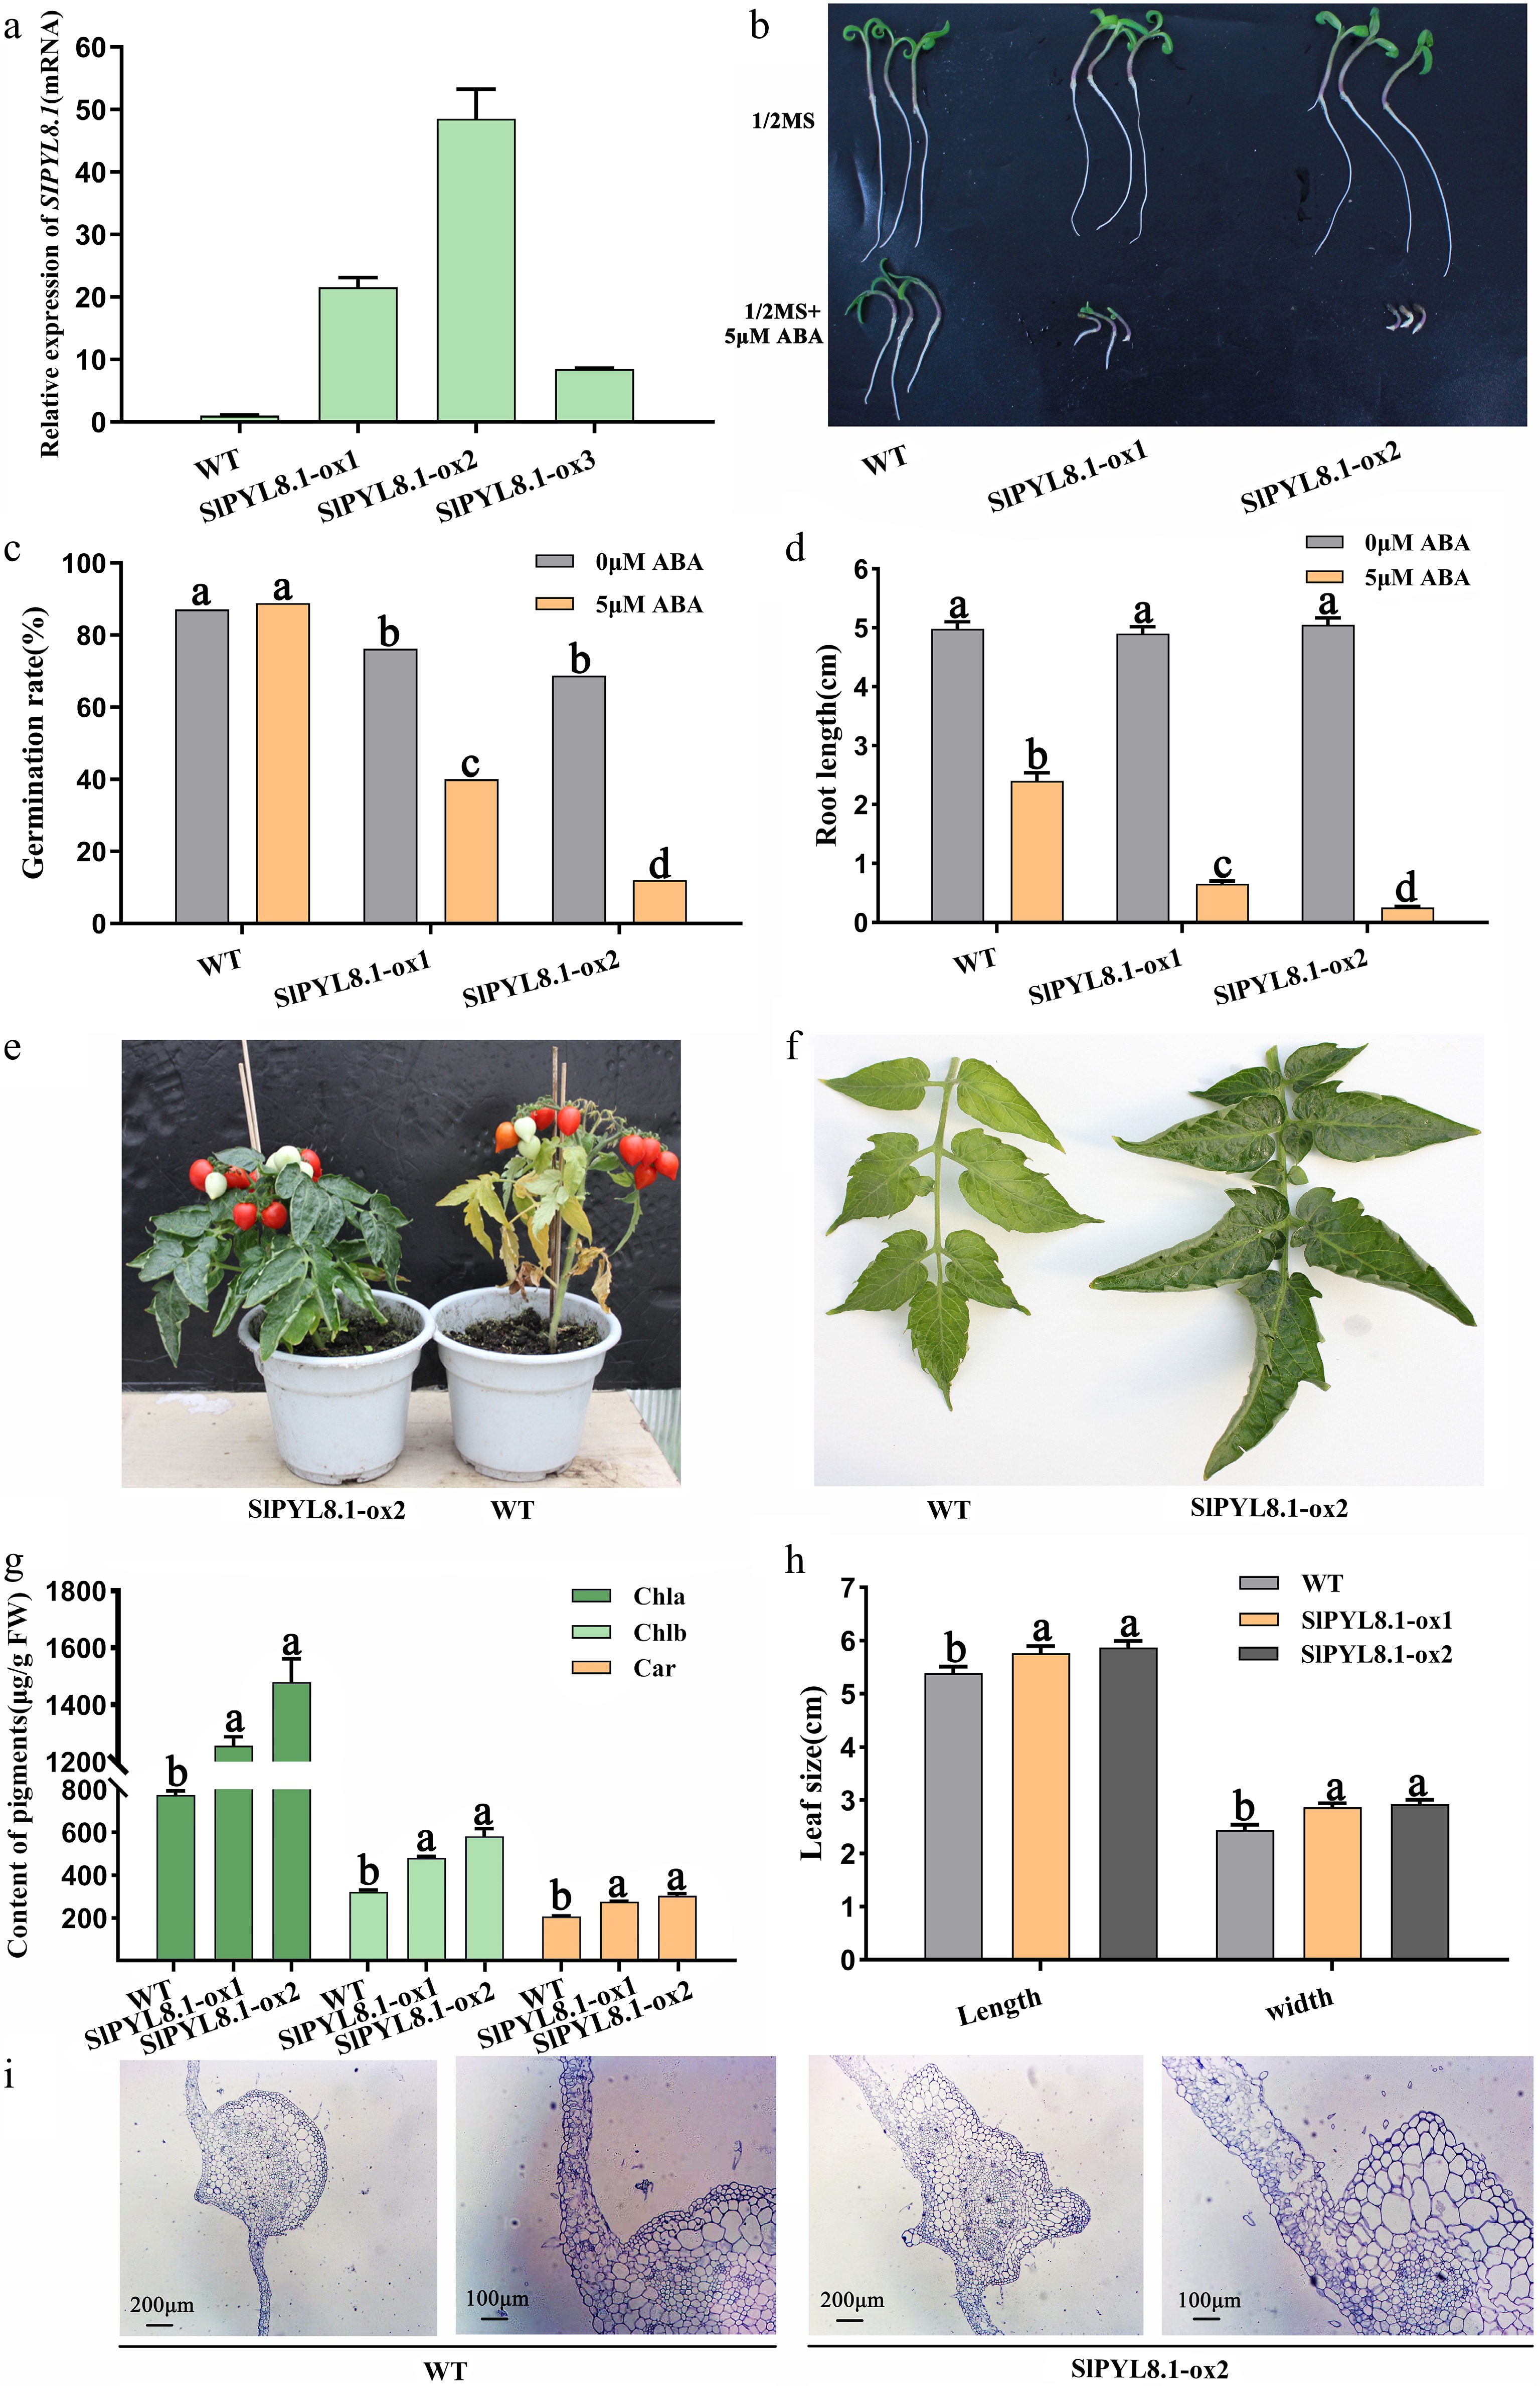
Figure 5.
Overexpression of SlPYL8.1 led to ABA hypersensitivity and delayed plant senescence. (a) The relative mRNA level of SlPYL8.1 in three independent overexpression lines. (b) The seed germination and root growth of WT and SlPYL8.1-OX tomatoes on medium supplemented with ABA. (c) Seed germination rate of WT and SlPYL8.1-OX tomatoes under ABA treatment. (d) Root length of WT and SlPYL8.1-OX lines under ABA treatment. (e) Overexpression of SlPYL8.1 led to delayed plant senescence. (f) Leaf architecture of WT and SlPYL8.1 overexpressing plants. (g) Pigment contents in WT and SlPYL8.1 overexpressing tomatoes. (h) Leaf size of WT and SlPYL8.1-OX plants. (i) Transverse leaf section showing the mesophyll cells and vascular bundle organization. Data represents mean ± SEM of at least three biological replicates. Different lowercase letters indicate statistically significant differences (p < 0.05, one-way ANOVA with Tukey's HSD) among experimental groups.
-
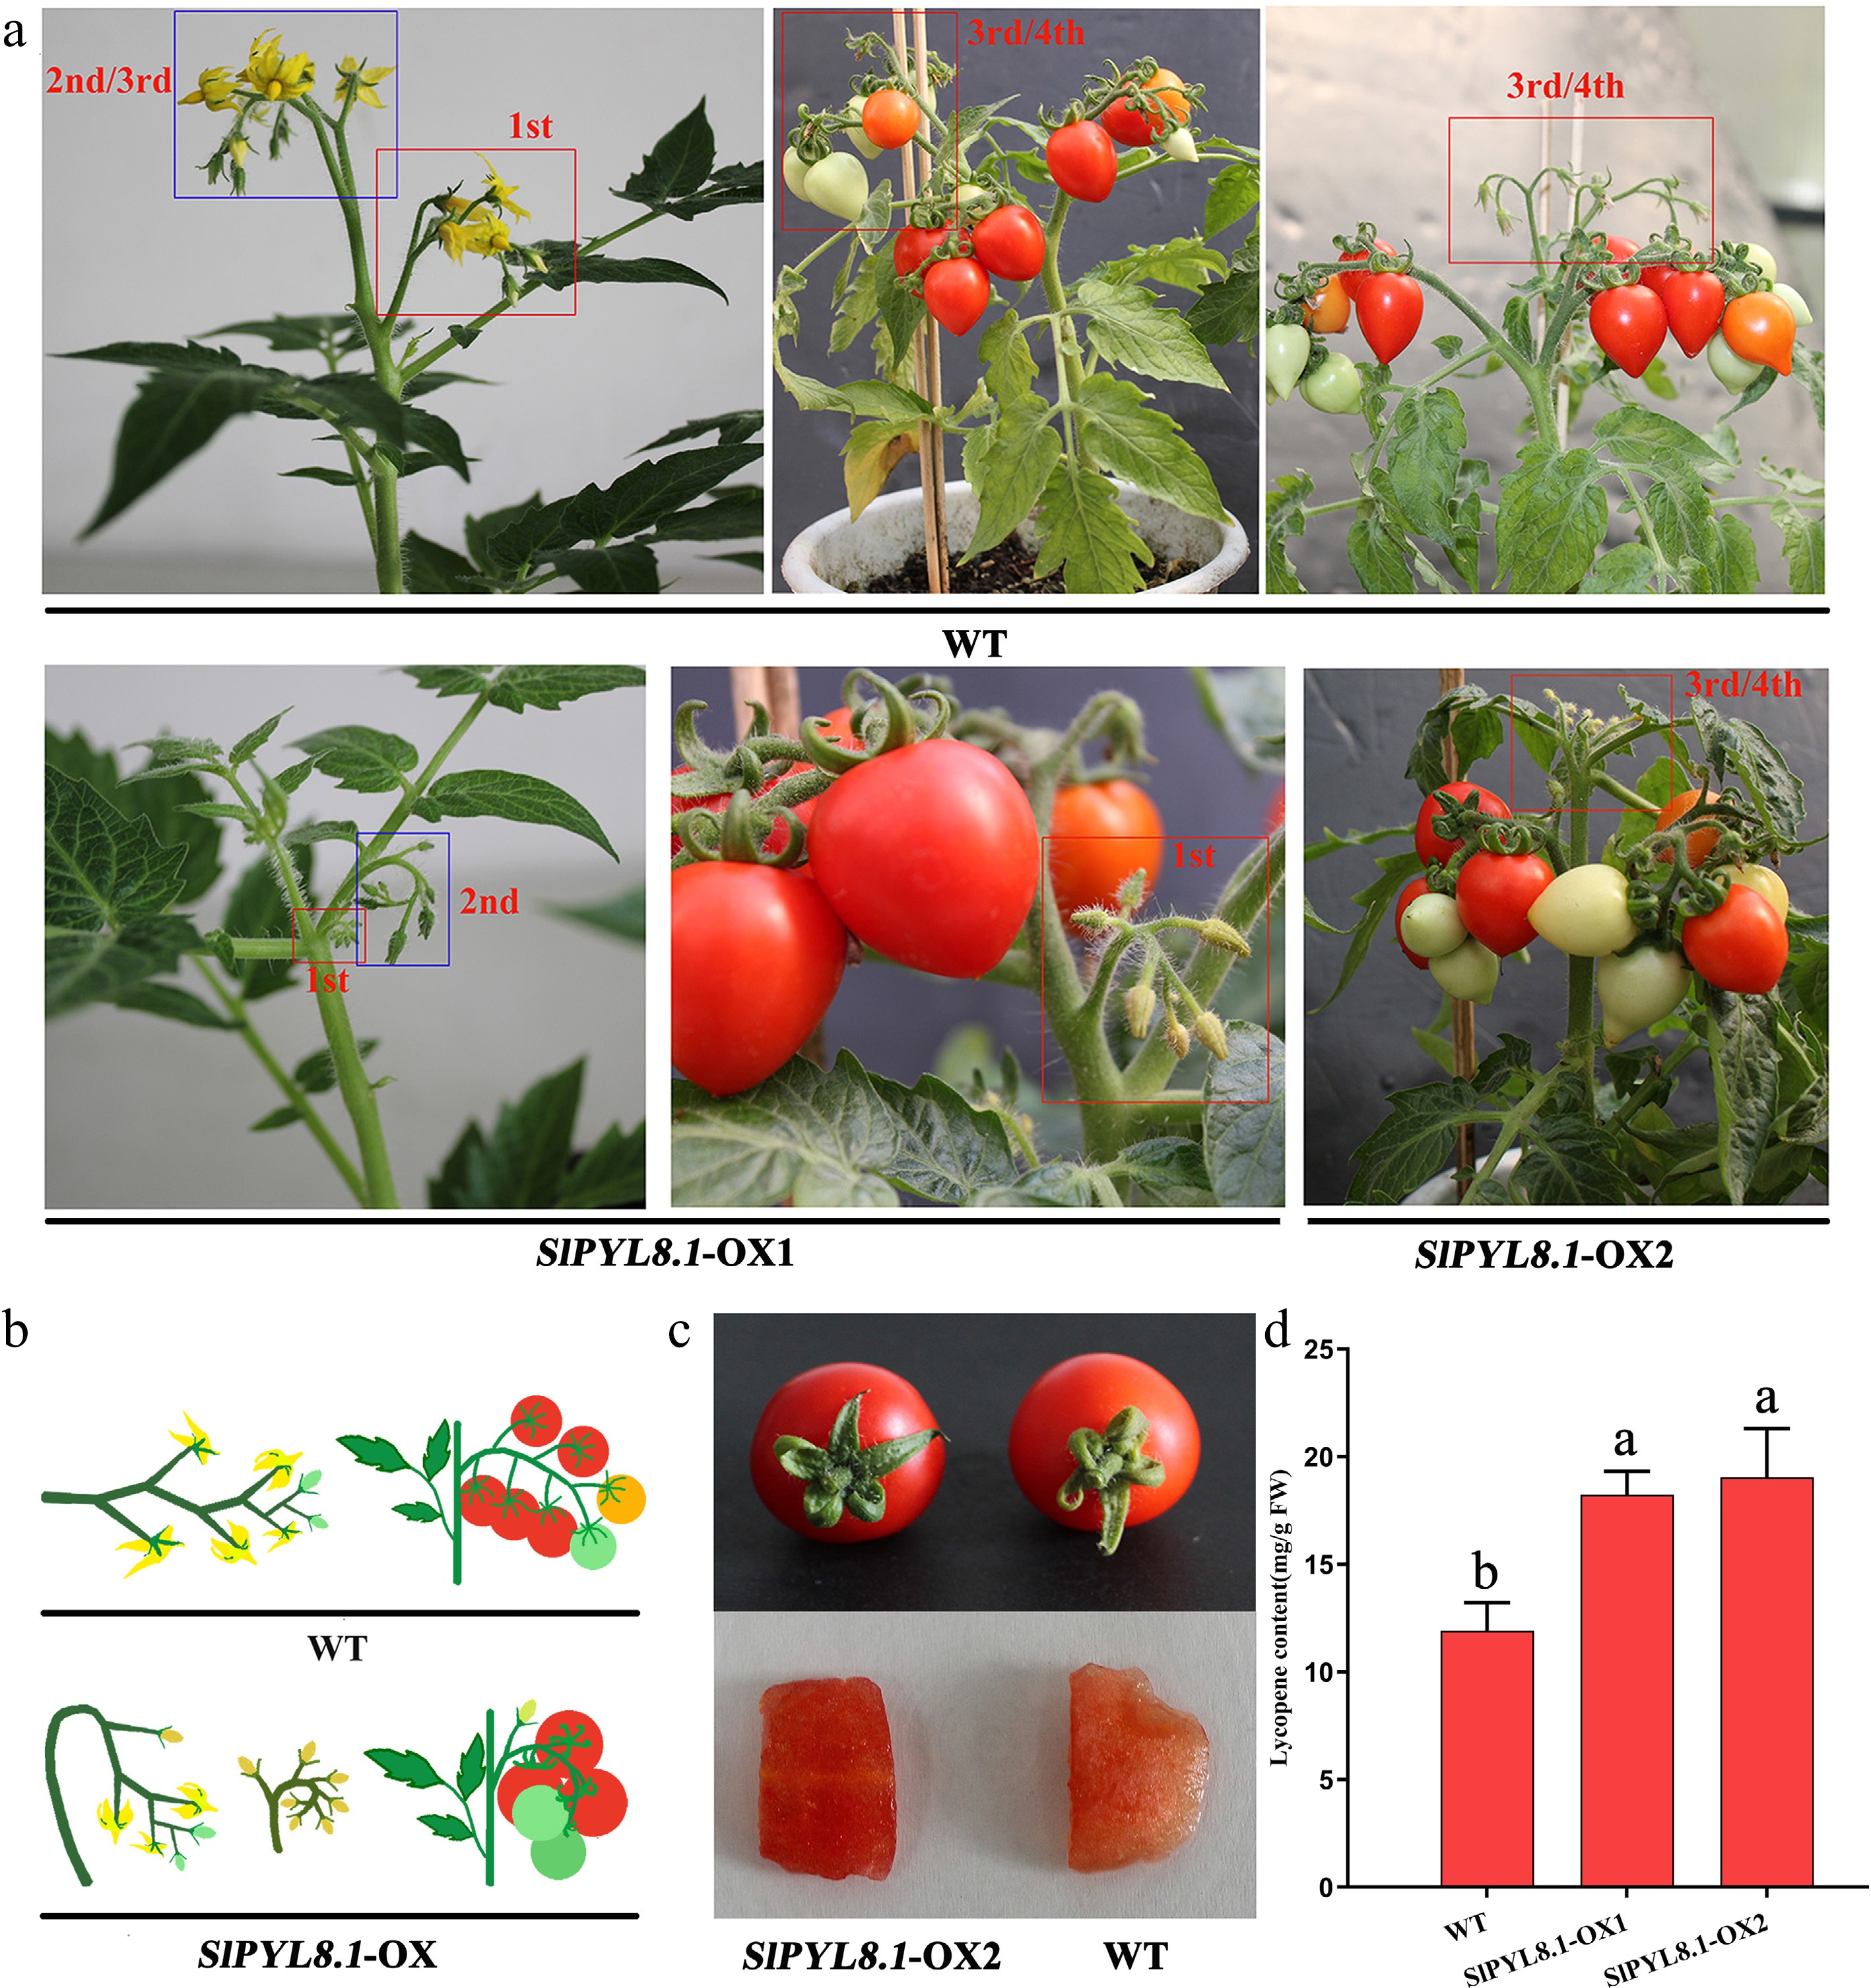
Figure 6.
SlPYL8.1 overexpression modified inflorescence architecture and altered fruit pigmentation. (a) SlPYL8.1 overexpression led to flower bud abortion. (b) Schematic diagram of inflorescence structures of WT and transgenic plants. (c) SlPYL8.1 overexpression resulted in alterations in fruit flesh color. (d) Lycopene content of WT and SlPYL8.1-OX plants. Data represents mean ± SEM of at least three biological replicates. Different lowercase letters indicate statistically significant differences (p < 0.05, one-way ANOVA with Tukey's HSD) among experimental groups.
Figures
(6)
Tables
(0)