-

Figure 1.
Comparison of measured and predicted YSI values.
-

Figure 2.
Averaged sensitivities of YSI of neat components and mixtures on different functional features.
-

Figure 3.
Averaged sensitivities of YSI of mixtures on functional features.
-
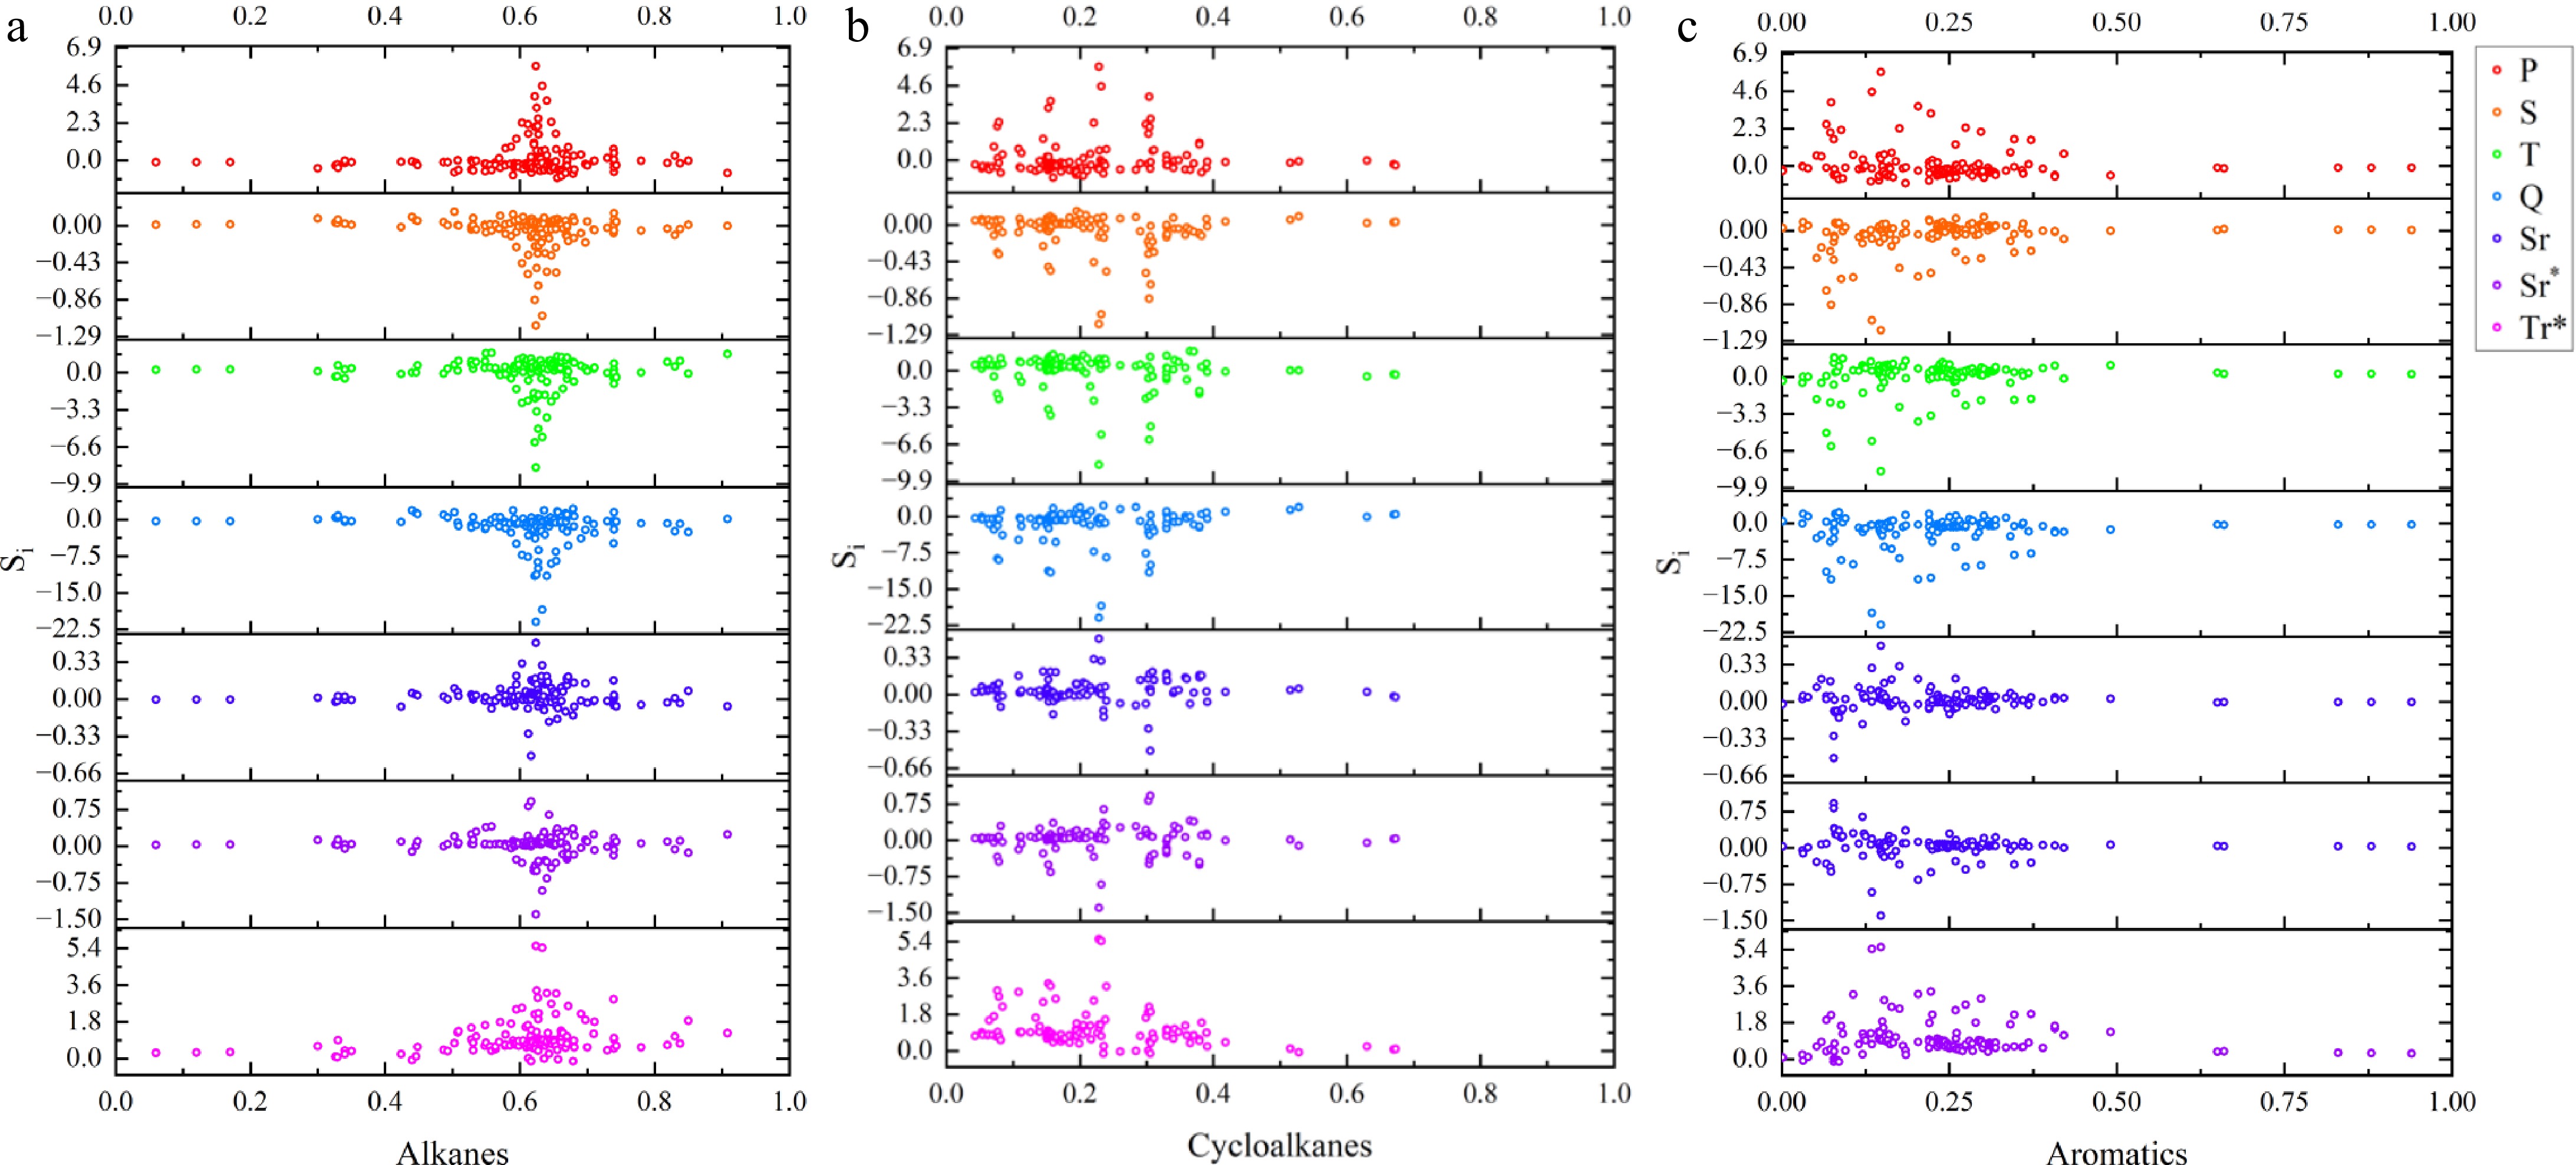
Figure 4.
Sensitivities of YSI on functional features over blending ratios of fuel classes.
-
Group Abbreviation Type –CH3 P Primary carbon (non-ring, saturated) –CH2– S Secondary carbon (non-ring, saturated) >CH– T Tertiary carbon (non-ring, saturated) >C< Q Quaternary carbon (non-ring, saturated) –CH2–(ring) Sr Secondary carbon (ring, saturated) >CH–(ring) Tr Tertiary carbon (ring, saturated) =CH–ring) Sr* Secondary carbon (ring, unsaturated) =C<(ring) Tr* Tertiary carbon (ring, unsaturated) Table 1.
Eight molecular groups initially considered as input features.
-
Table 2.
Prediction performance of the ANN model developed in the present work compared with literature models.
Figures
(4)
Tables
(2)