-
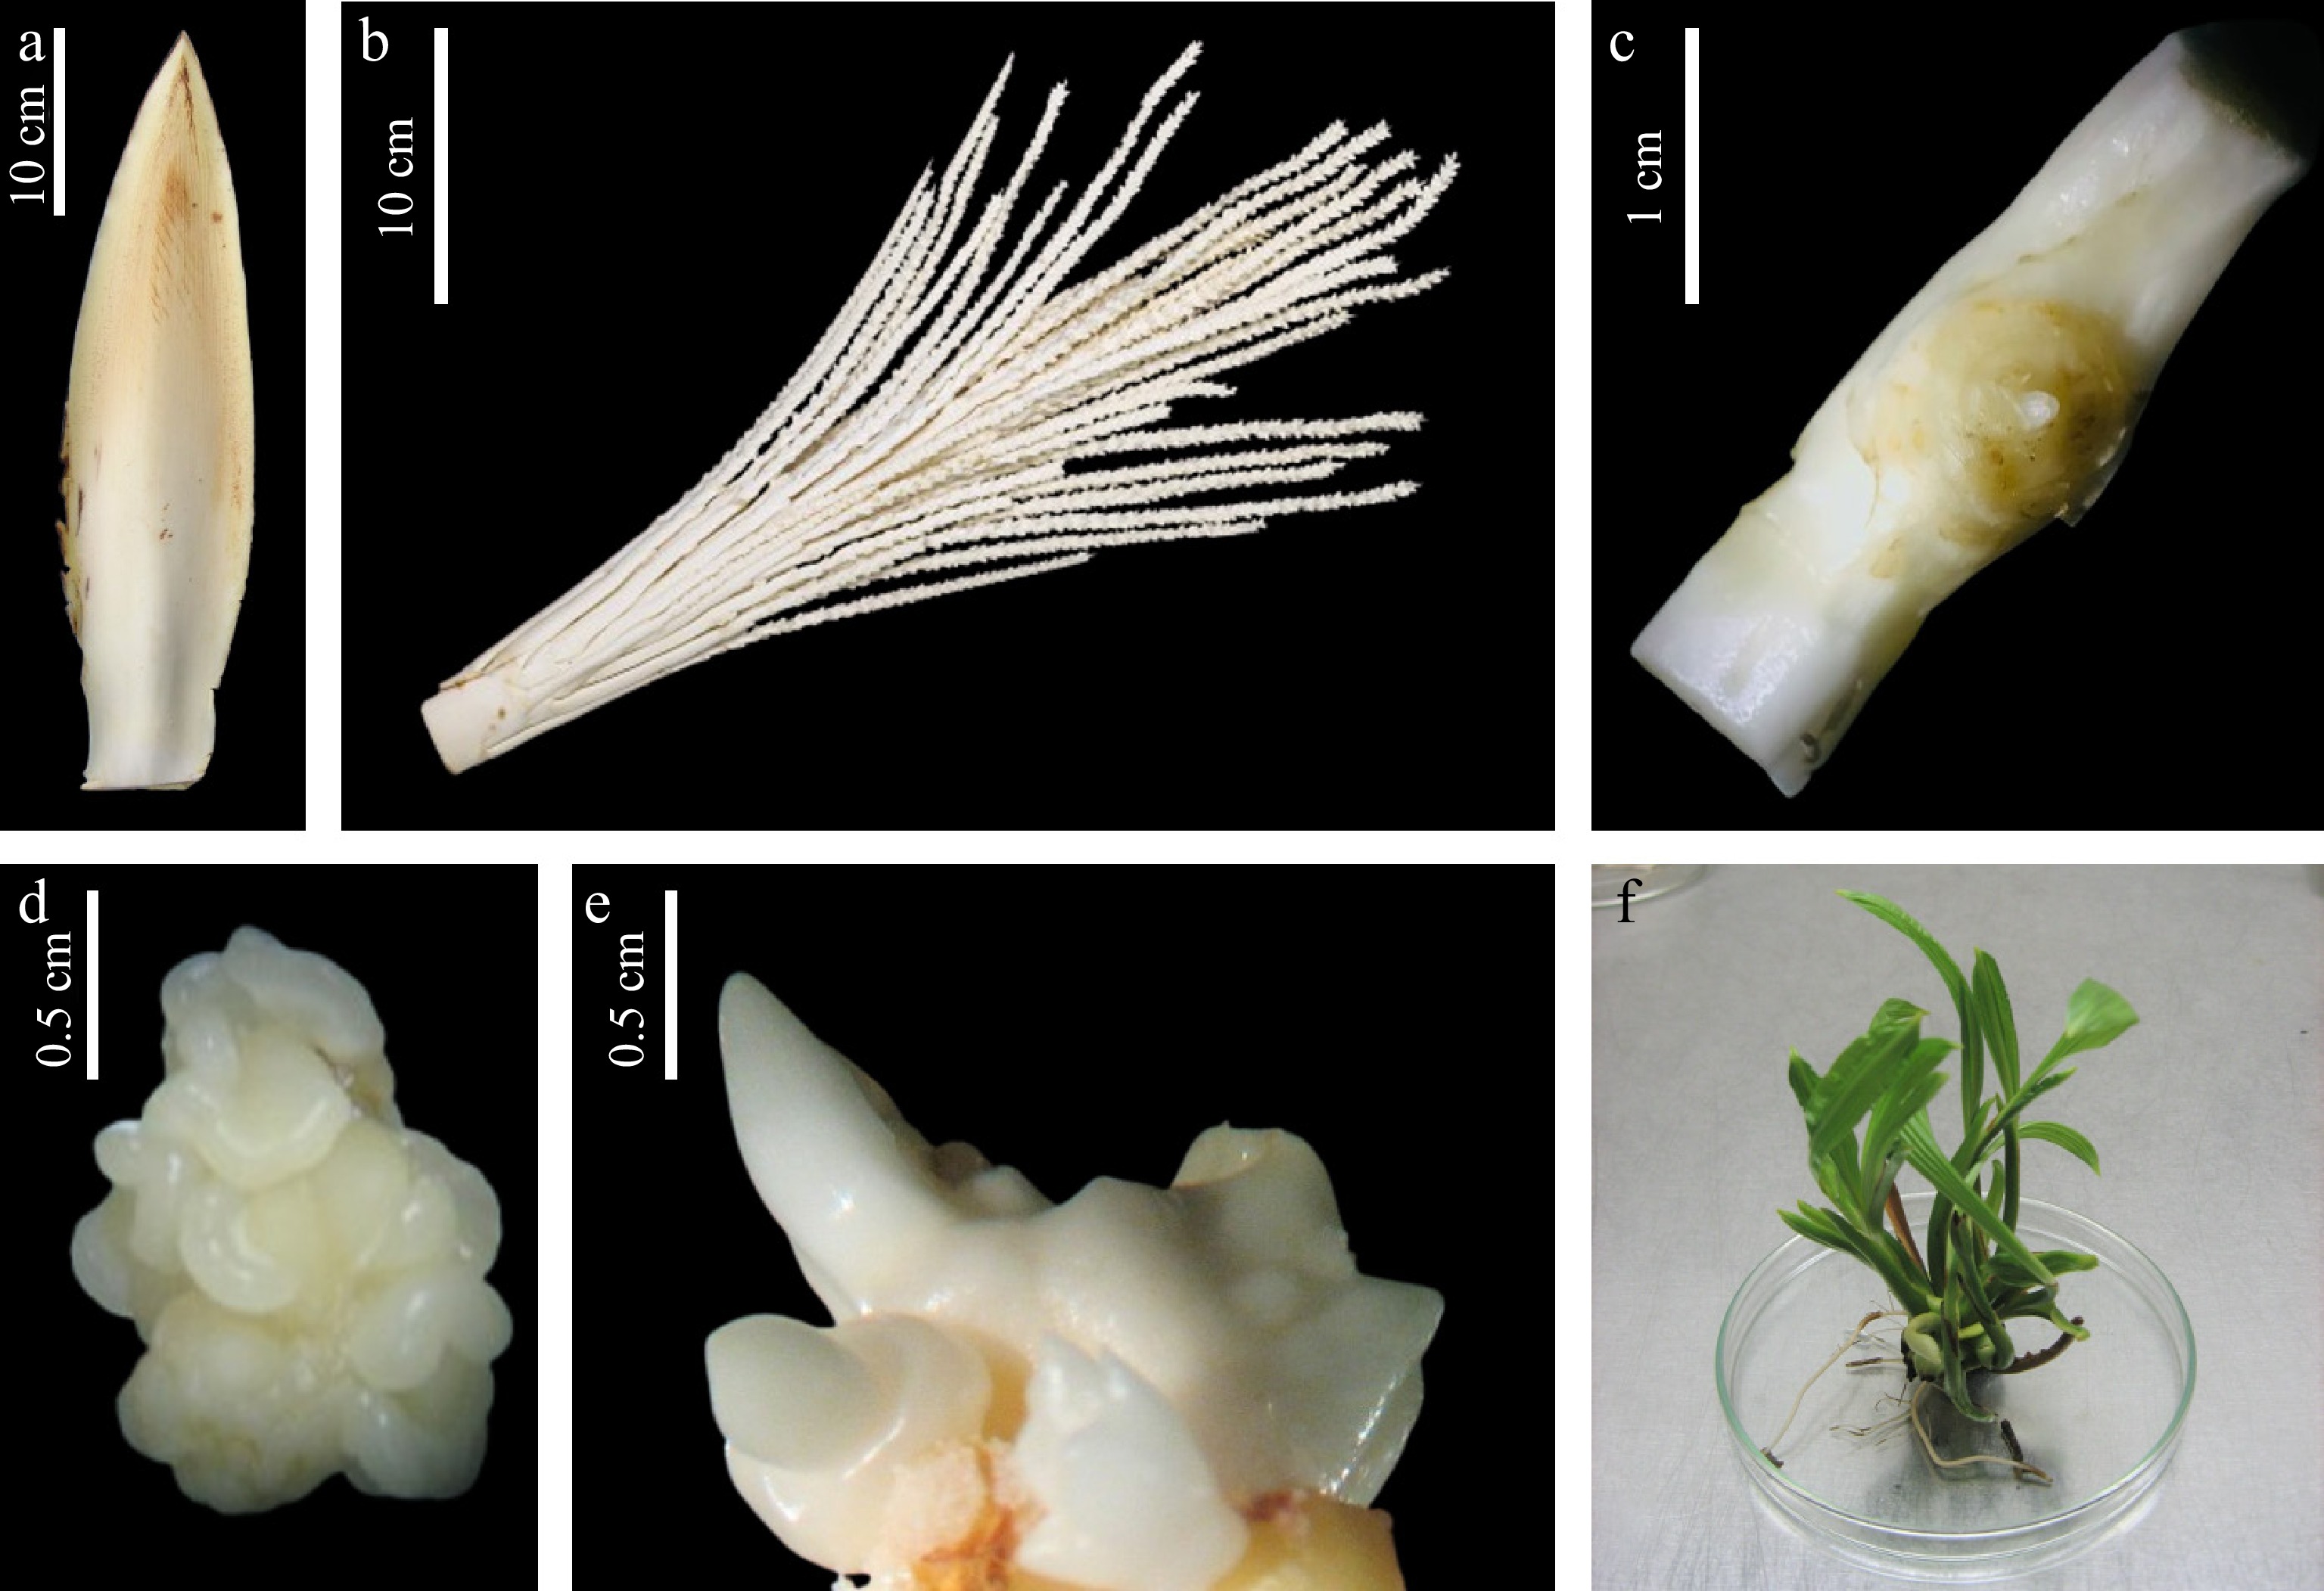
Figure 1.
Sequential stages in coconut (Cocos nucifera L.) somatic embryogenesis and somatic embryo germination. (a) Immature inflorescence at −4 stage with spathe; (b) rachillae; (c) unfertilized ovary after removal of perianth parts; (d) embryogenic callus clump; (e) germinating somatic embryo structure; (f) shoot cluster induced from callus.
-
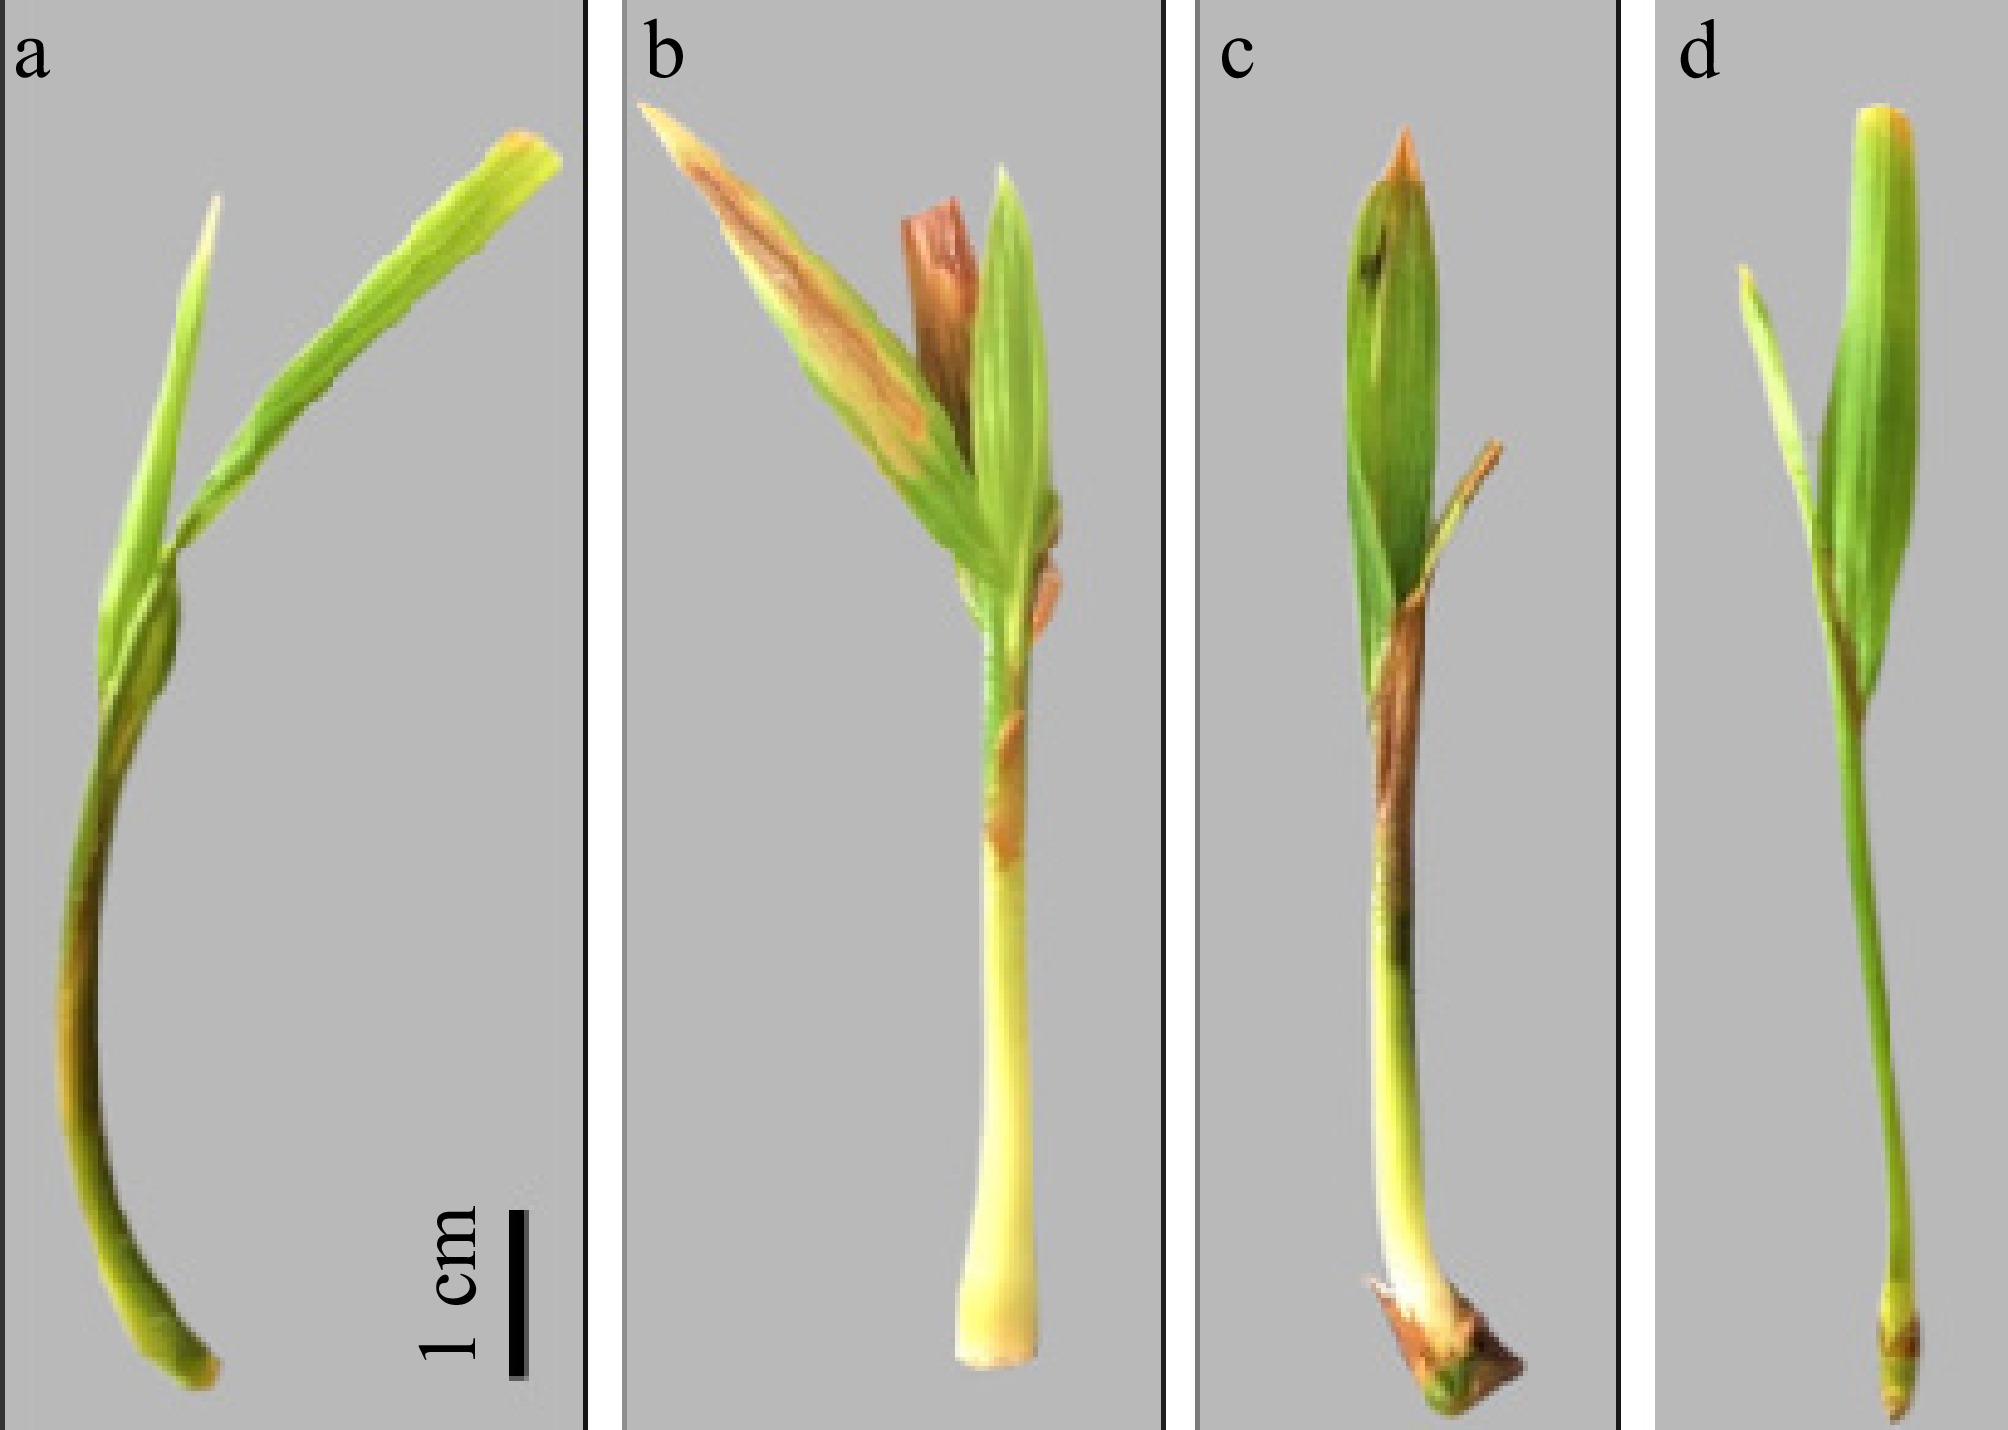
Figure 2.
Different shapes of bud in plantlets in vitro at the same developmental stage. All browning tissues were removed. (a), (b) Show the straight cut and no sign of root emergence, treatment needed to initiate root by using PGRs. (c), (d) Demonstrated a well-structured bud where primary root systems will start forming.
-
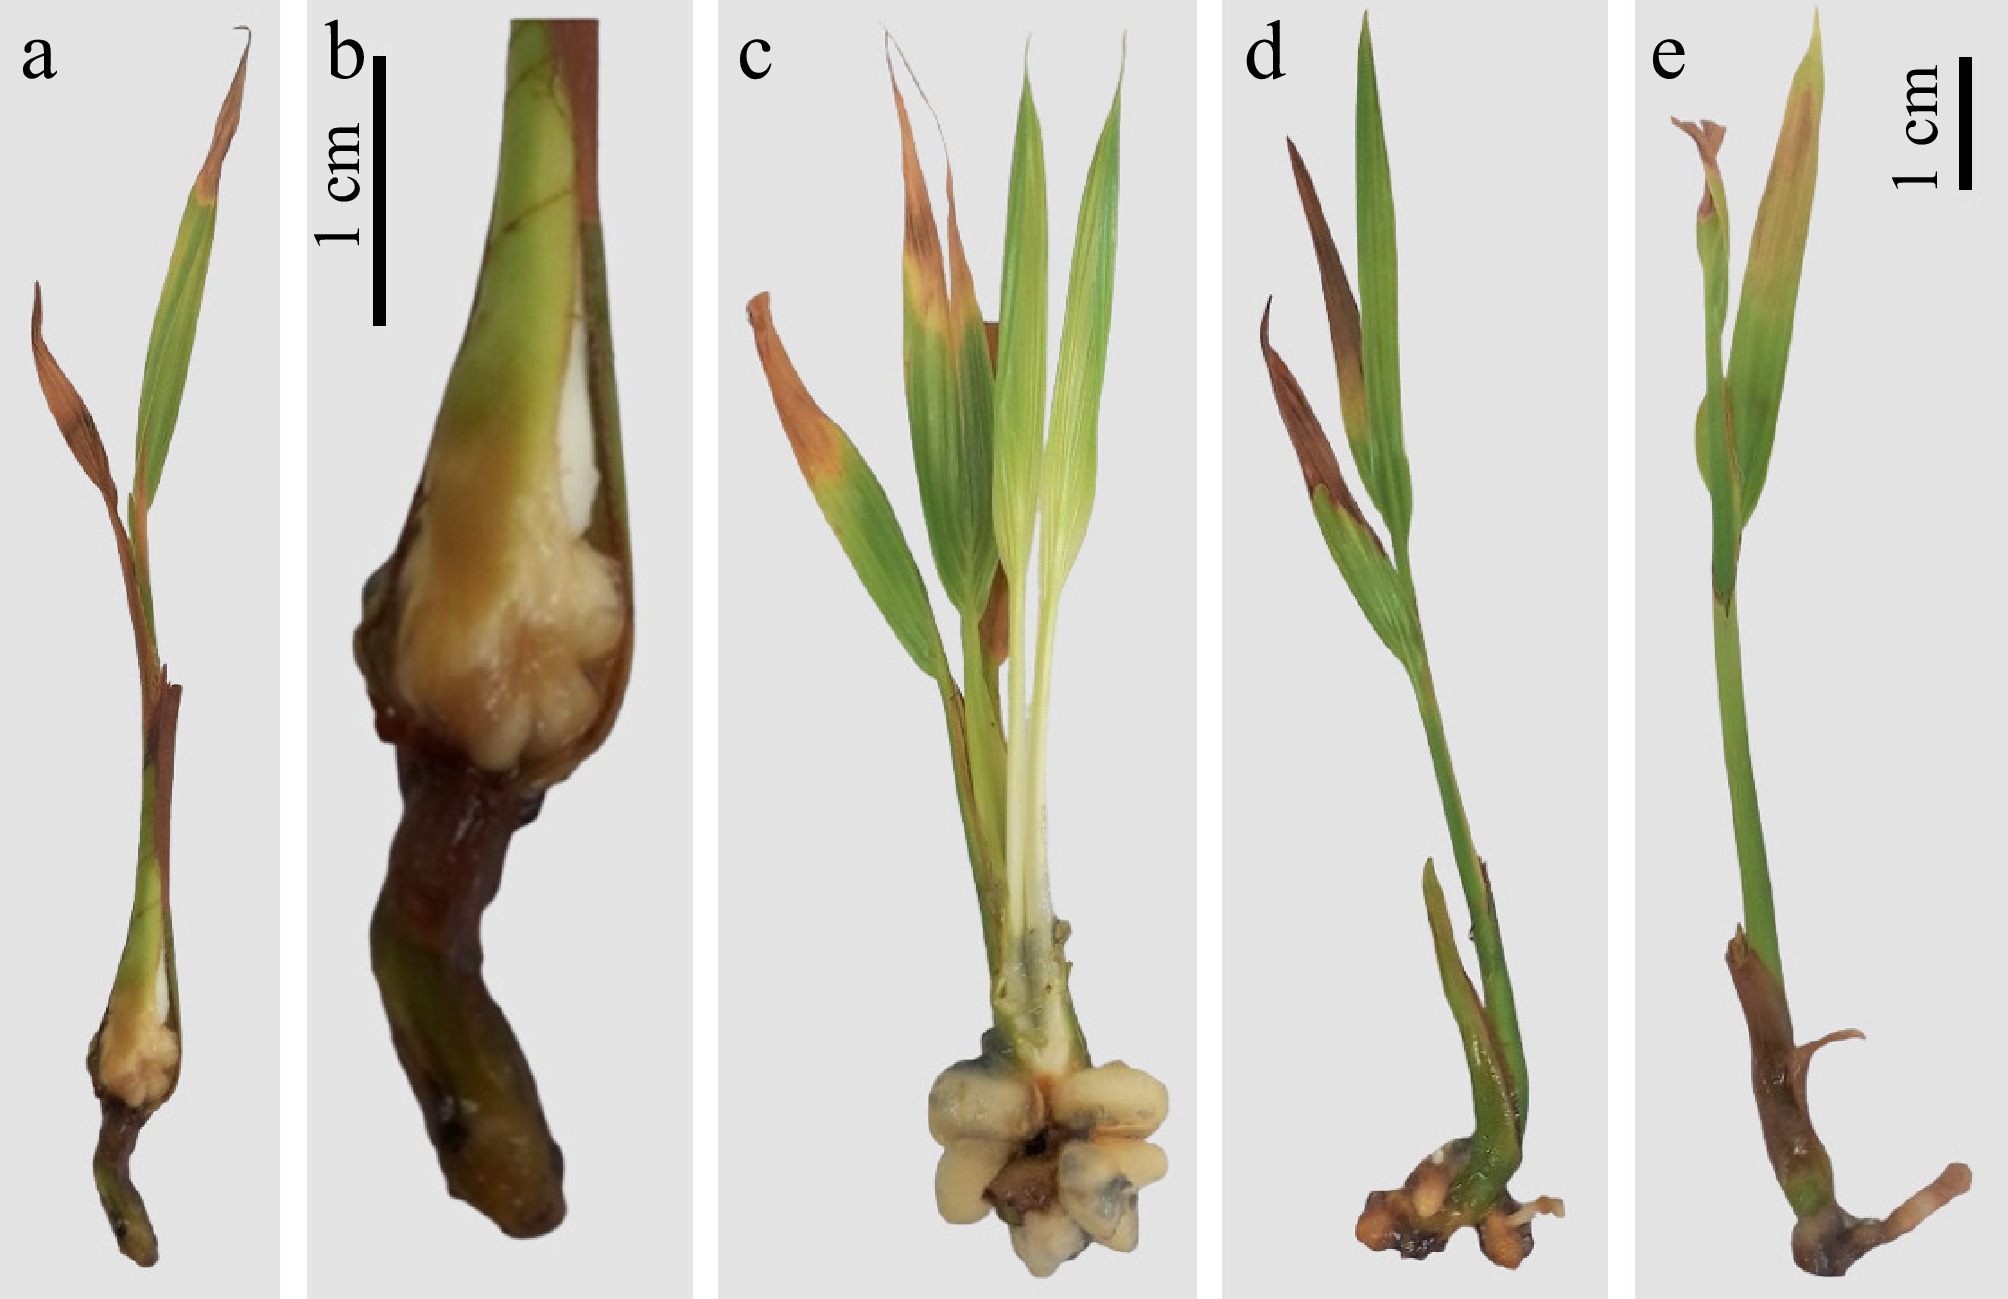
Figure 3.
Primary root initiation and morphological differences of emerging primary roots in different auxin-type PGR treatments. (a), (b) Emerging of primary roots at the base of in vitro derived coconut plantlet. (c) Biomass/number of primary roots induced by NAA. (d) Biomass/number of primary roots induced by IBA. (e) Biomass/number of primary roots induced by without auxin treatment.
-
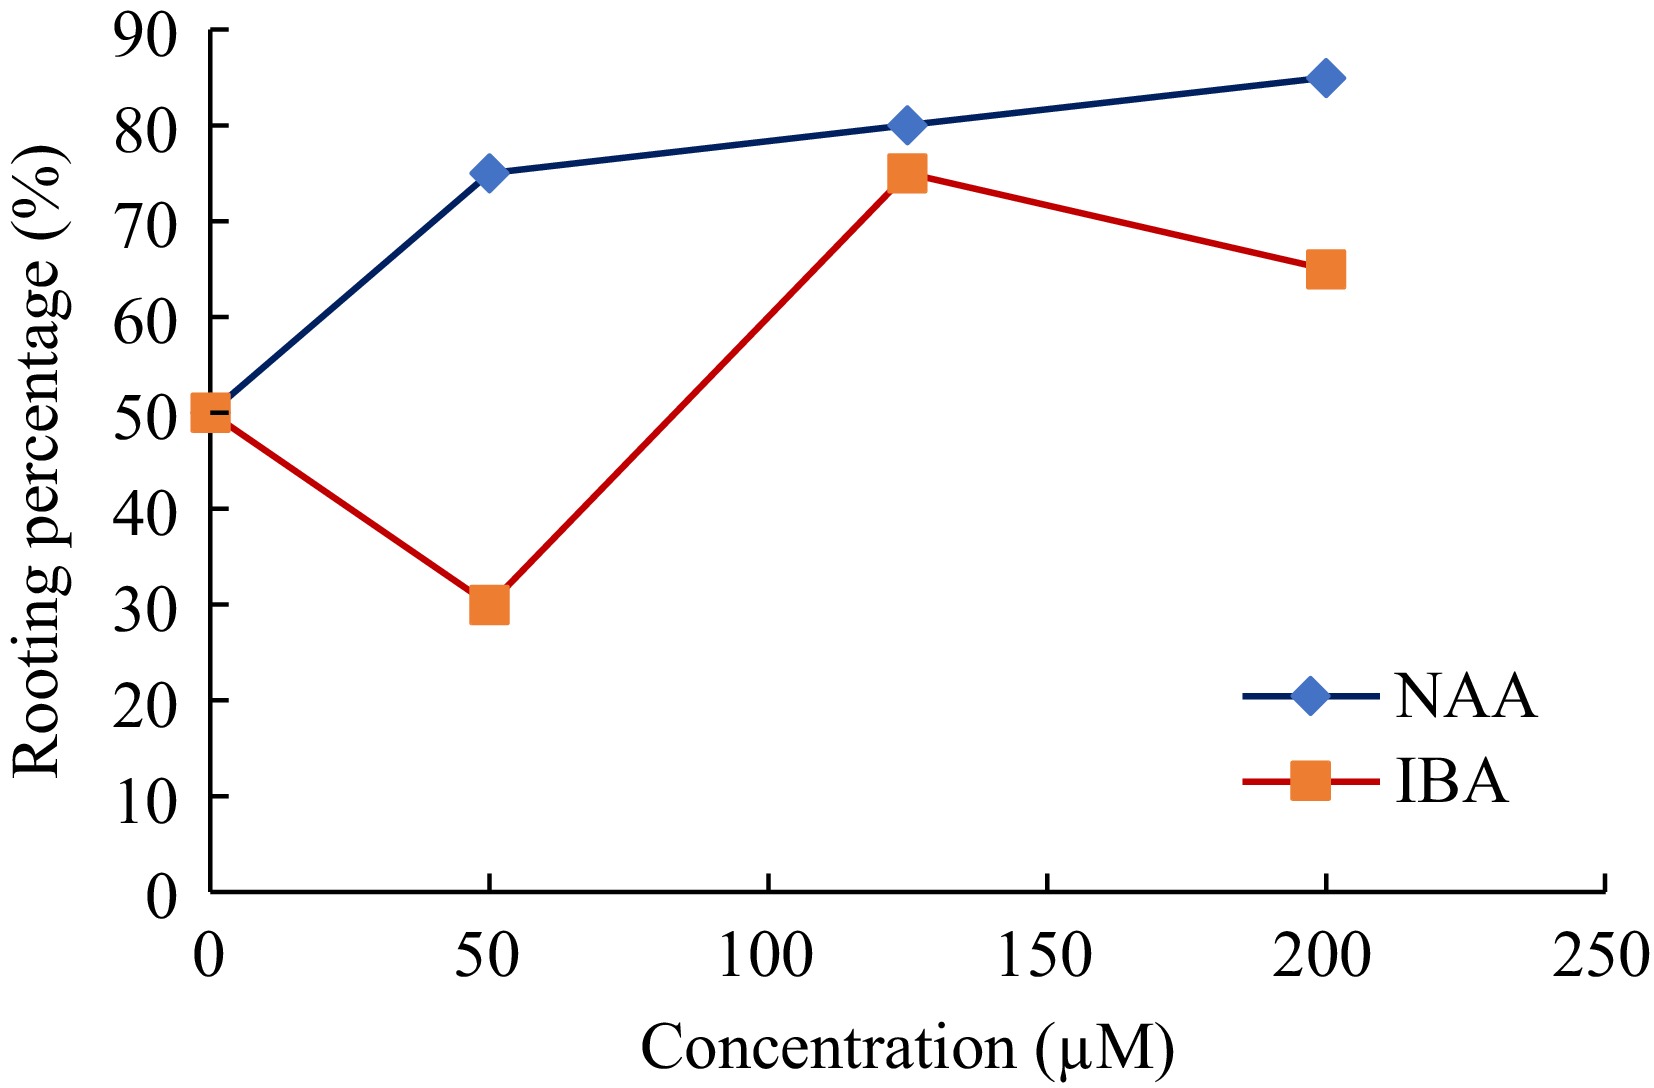
Figure 4.
Comparison of rooting percentages at different concentrations (50, 125, and 200 μM) of IBA and NAA.
-
Treatment PGR type PGR concentration (μM) T1 NAA 50 T2 NAA 125 T3 NAA 200 T4 IBA 50 T5 IBA 125 T6 IBA 200 T7 (control) None 0 Table 1.
Treatments with plant growth regulators (PGRs) and their concentrations used in the experiment.
-
Treatment (μM) Number of primary roots Length of primary roots (mm) Number of secondary roots Length of secondary roots (mm) NAA 50 3.10ab ± 2.94 10.04ab ± 7.97 0.75bc ± 1.44 1.10bc ± 2.57 NAA 125 2.55ab ± 1.88 6.79bcd ± 6.46 0.60bc ± 5.72 4.03b ± 0.00 NAA 200 3.55a ± 2.63 7.88abc ± 5.53 0.95bc ± 1.61 3.02bc ± 5.08 IBA 50 0.50d ± 0.70 0.40e ± 1.27 0.40bc ± 1.27 1.20bc ± 3.75 IBA 125 2.10bc ± 0.89 11.63a ± 8.73 1.45ab ± 1.67 7.72a ± 8.56 IBA 200 2.30abc ± 1.97 5.40cd ± 6.81 2.15a ± 3.20 2.60bc ± 3.97 Control 0.90cd ± 1.02 2.90de ± 3.82 0.00c ± 0.00 0.00c ± 0.00 Mean values followed by the same letter in a column are not significantly different at p ≤ 0.05. The best treatment was highlighted in bold. Table 2.
Effect of NAA and IBA on in vitro root development of coconut plantlets.
-
Treatment (μM) Shoot height increment (cm) Weight increment (g) Number of new leaves Girth increment (mm) NAA 50 1.421c ± 0.491 1.36ab ± 1.35 1.30a ± 0.10 1.70ab ± 1.78 NAA 125 2.594b ± 1.574 1.57ab ± 0.97 1.35a ± 1.27 1.72ab ± 1.28 NAA 200 1.467c ± 0.717 1.42ab ± 0.88 1.50a ± 0.69 2.05a ± 2.09 IBA 50 3.224ab ± 2.122 0.78cd ± 0.38 1.25a ± 1.25 0.98bc ± 0.96 IBA 125 4.175a ± 2.324 1.70a ± 0.93 1.45a ± 1.0 0.96bc ± 1.26 IBA 200 3.462ab ± 1.366 1.01bc ± 1.11 1.50a ± 0.83 0.48c ± 0.81 Control 3.964a ± 2.207 0.34d ± 0.25 0.75a ± 0.79 1.18bc ± 1.04 Mean values followed by the same letter in a column are not significantly different at p ≤ 0.05. The best treatments were highlighted in bold. Table 3.
Number of new leaves, shoot length, girth, and weight increment of in vitro coconut plantlets exposed to different auxin levels.
Figures
(4)
Tables
(3)