-
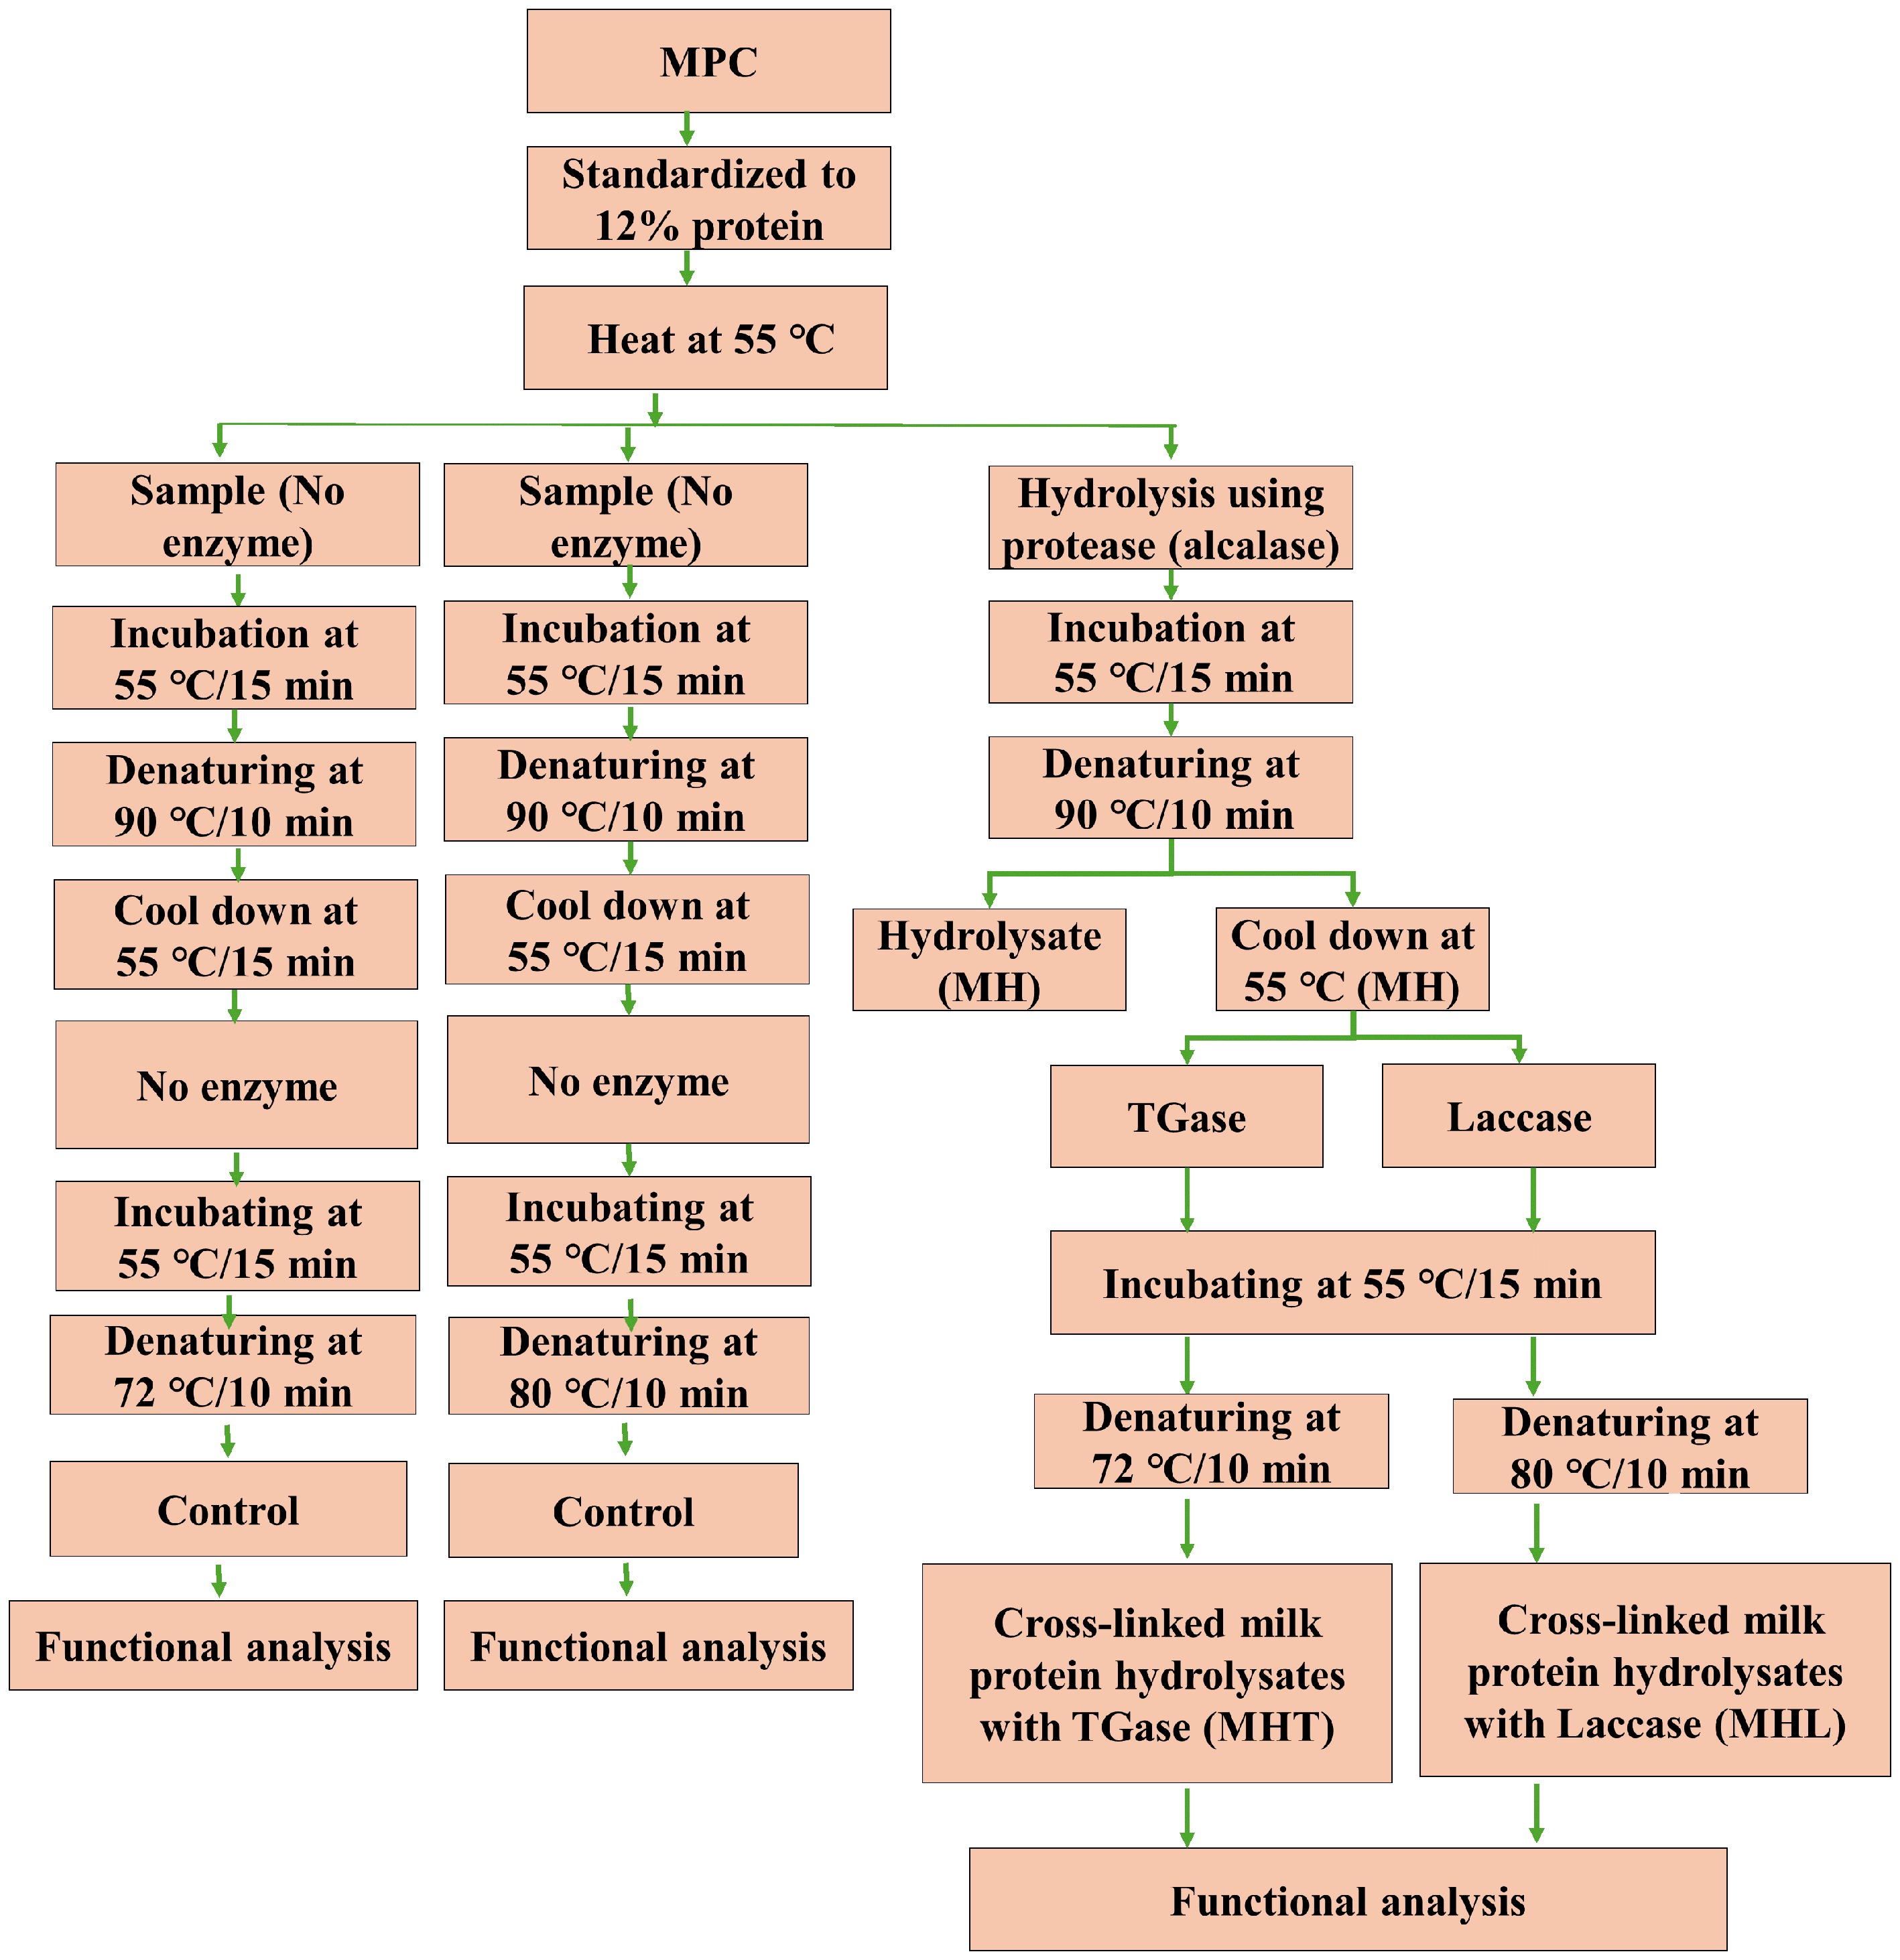
Figure 1.
Experimental design for the manufacture of treatment milk protein concentrate (MPC). Abbreviations: MPC = milk protein concentrate treatment: TGase = transglutaminase: MH = milk protein hydrolysate, alcalase: MHT = cross-linked milk protein hydrolysate, TGase: MHL = cross-linked milk protein hydrolysate, laccase.
-
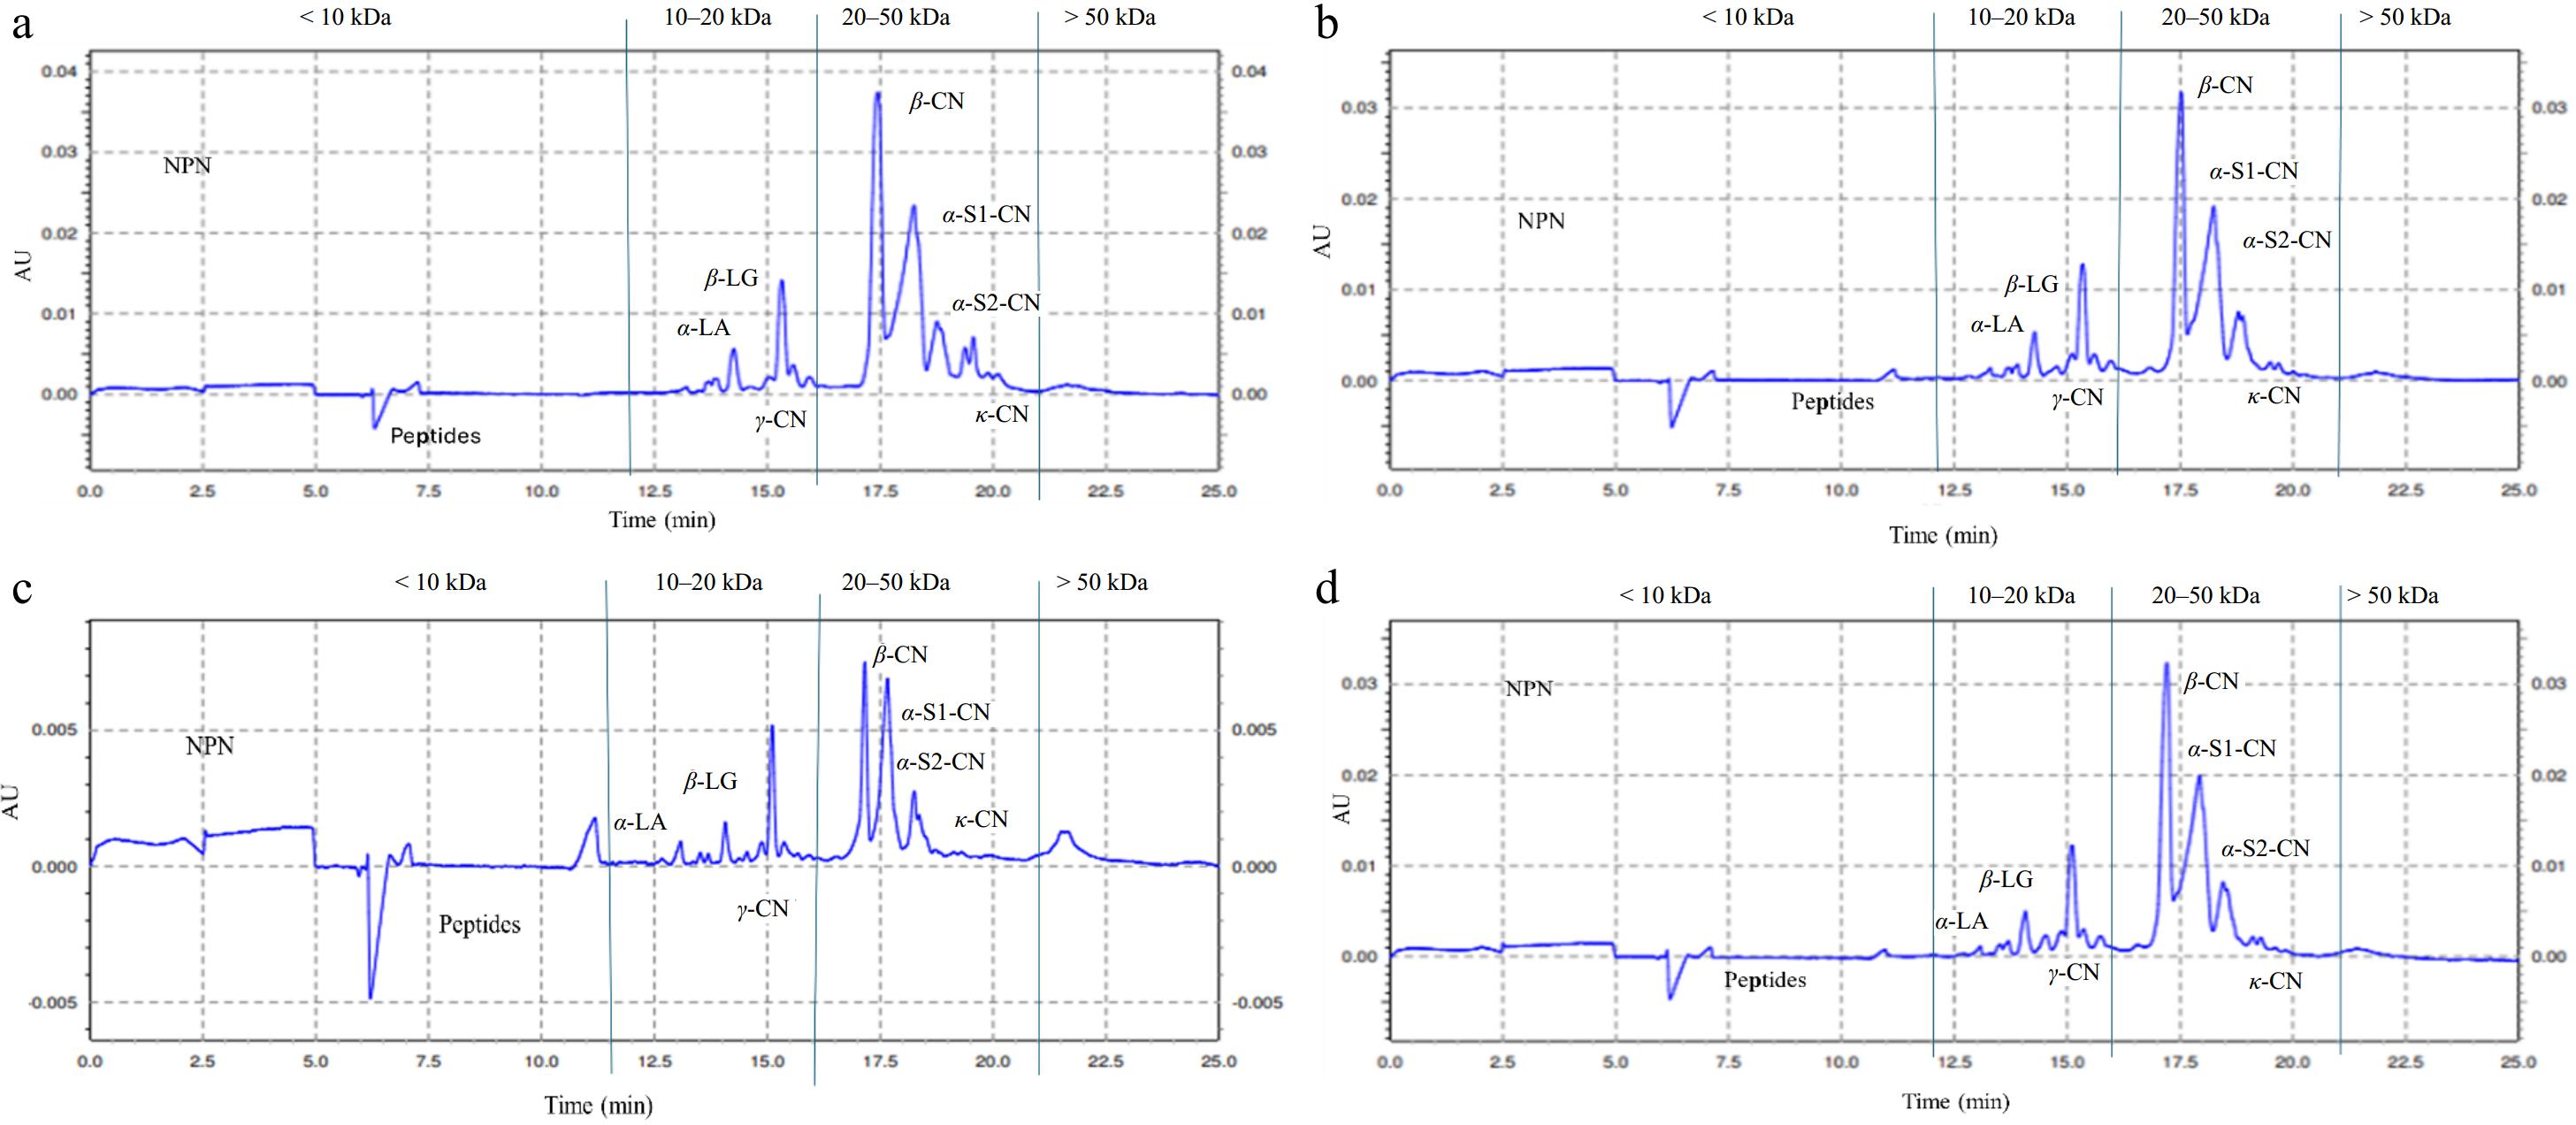
Figure 2.
Typical electropherograms of milk protein concentrate (MPC) treated with alcalase, transglutaminase, and laccase: (a) Control = without adding enzyme. (b) MH = milk protein hydrolysate, alcalase. (c) MHT = cross-linked milk protein hydrolysate, TGase. (d) MHL = cross-linked milk protein hydrolysate, laccase.
-
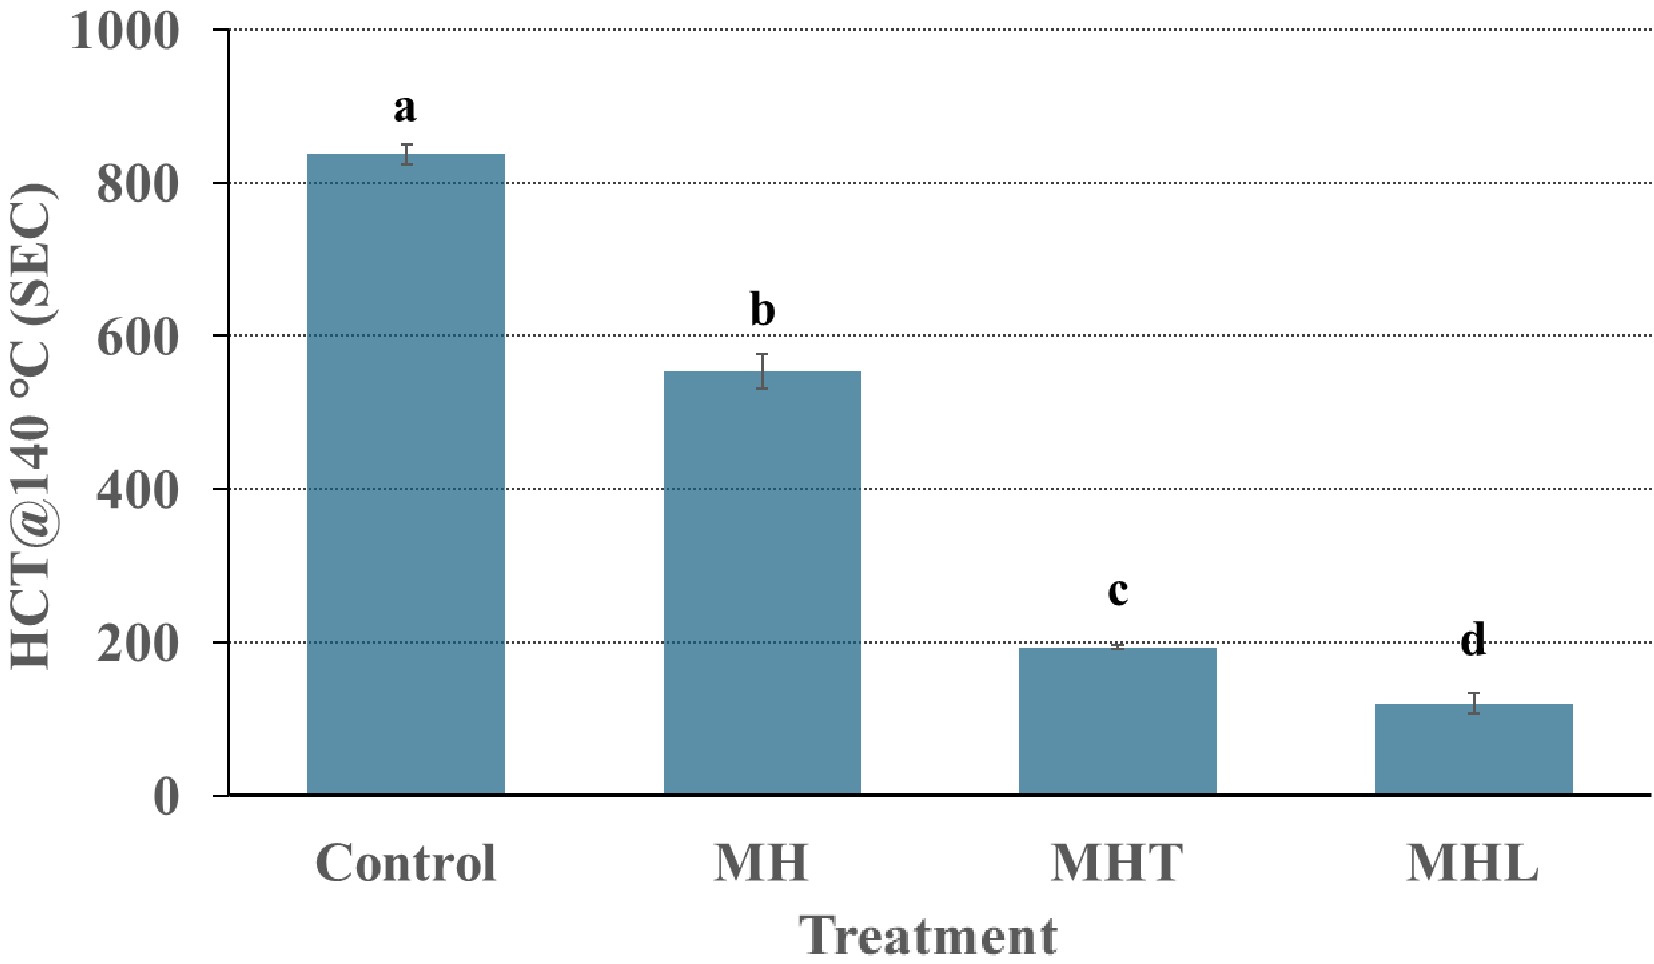
Figure 3.
HCT at 140 °C as a function of milk protein concentrate treated with different enzymes: control = without addition enzyme, MH = milk protein hydrolysate, alcalase; MHT = cross-linked milk protein hydrolysate, TGase; MHL = cross-linked milk protein hydrolysate, laccase. Error bars are the standard error of mean for triplicate analysis for triplicate analysis for triplicate analysis for each treatment. a−d Completely different superscript letters between the HCT values on the column bar show significant differences (p < 0.05) between the different enzymes of samples.
-
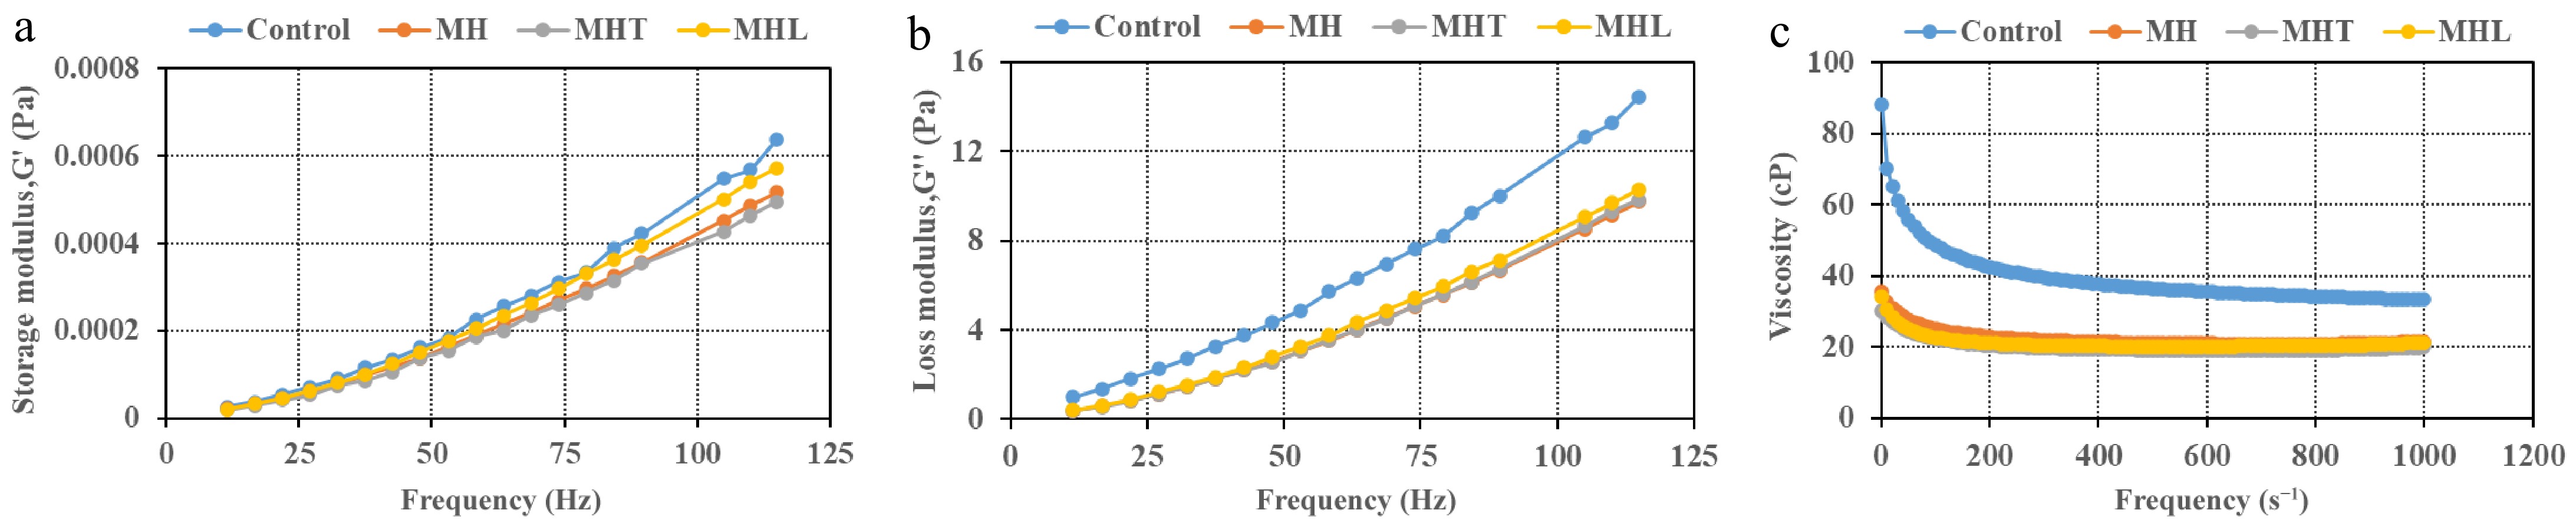
Figure 4.
Frequency sweep test. (a) Storage modulus. (b) Loss modulus. (c) Viscosity as a function of MPC treated with different enzymes: control = without addition enzyme; MH = milk protein hydrolysate, alcalase; MHT = cross-linked milk protein hydrolysate, TGase; MHL = cross-linked milk protein hydrolysate, laccase. Error bars for the standard error of the mean (n = 3) are not displayed for the better visual of the graph.
-
Replicate Moisture (%) Ash (%) Protein (%) NPN (%) MPC 1 83.48 ± 0.13 1.28 ± 0.13 12.58 ± 0.16 0.02 ± 0.00 MPC 2 76.58 ± 0.12 1.02 ± 0.13 12.05 ± 0.08 0.01 ± 0.00 MPC 3 80.03 ± 0.12 1.15 ± 0.13 12.31 ± 0.12 0.01 ± 0.00 All values are the mean of duplicate analyses ± standard deviation. Abbreviations: MPC = milk protein concentrate; MCC= micellar casein concentrate; NPN = non-protein nitrogen. Table 1.
Proximate composition of liquid MPC.
-
Interactions < 10 kDa 10−20 kDa 20−50 kDa > 50 kDa Control vs MH NS * * NS Control vs MHT * NS * * Control vs MHL NS * NS NS MH vs MHT * NS NS NS MH vs MHL NS NS NS NS MHT vs MHL * NS NS NS Control = without enzyme addition; MH = milk protein hydrolysate, alcalase; MHT = cross-linked milk protein hydrolysate, TGase; MHL = cross-linked milk protein hydrolysate, laccase. < 10 kDa = non-protein-nitrogen and low MW protein fractions; 10−20 kDa = whey protein and medium peptides; 20−50 kDa = casein fractions; > 50 kDa = high molecular weight protein; statistical differences indicated by: NS = non-significant; * = significant (p < 0.05). Table 2.
Statistical analysis of protein fractions in MPC.
-
Molecular weight Control MH MHT MHL < 10 kDa (%) 1.77 ± 0.68b 4.45 ± 2.45ab 9.35 ± 4.62a 1.83 ± 0.18b 10−20 kDa (%) 14.82 ± 2.06b 19.34 ± 1.75a 16.31 ± 2.51ab 20.45 ± 0.30a 20−50 kDa (%) 81.96 ± 2.43a 74.43 ± 4.95b 69.04 ± 8.65b 76.38 ± 0.40ab > 50 kDa (%) 1.45 ± 0.15b 1.78 ± 2.33ab 5.30 ± 4.65a 1.35 ± 0.03ab All values are the mean of triplicate analyses ± standard deviation. Abbreviations: control = without enzyme addition; MH = milk protein hydrolysate, alcalase; MHT = cross-linked milk protein hydrolysate, TGase; MHL = cross-linked milk protein hydrolysate, laccase. a−b Completely different superscript letters between the values in the row show significant differences (p < 0.05) between the different levels of enzymes in the sample. Table 3.
Percentage-wise distribution of MPC fractions (n = 3) with different molecular weights.
-
Interactions PS (µm) HS (s) FO (%) FS (%) EA (%) ES (%) Control vs MH NS * NS NS NS NS Control vs MHT NS * NS * NS NS Control vs MHL * * * * NS NS MH vs MHT NS * NS NS NS NS MH vs MHL * * * NS NS NS MHT vs MHL NS NS * NS NS NS Control = without enzyme addition; MH = milk protein hydrolysate, alcalase; MHT = cross-linked milk protein hydrolysate, TGase; MHL = cross-linked milk protein hydrolysate, laccase; PS = particle size; FO = foam overrun; FS = foam stability; EA = emulsifying ability; ES = emulsifying stability; HS = heat stability. All values are means of triplicate analyses. Statistical differences indicated by: NS = non-significant; * = significant (p < 0.05). Table 4.
Statistical analysis of different functional tests of treated and control samples.
-
Sample PS (µm) FO (%) FS (%) EA (%) ES (%) Control 0.19 ± 0.01b 46.25 ± 10.38a 122.71 ± 5.42 70.58 ± 4.69 70.58 ± 4.69 MH 0.21 ± 0.01a 48.33 ± 9.54a 125.67 ± 8.59 64.92 ± 6.50 64.92 ± 6.50 MHT 0.21 ± 0.01ab 45.0 ± 16.33a 121.67 ± 13.12 63.33 ± 2.95 63.33 ± 2.95 MHL 0.23 ± 0.01a 21.67 ± 1.18b 113.33 ± 1.81 75.00 ± 7.79 75.00 ± 7.79 All values are the mean duplicate analysis ± standard deviation. Control = without enzyme addition; MH = milk protein hydrolysate, alcalase; MHT = cross-linked milk protein hydrolysate, TGase; MHL = cross-linked milk protein hydrolysate, laccase; PS = particle size; FO = foam overrun; FS = foam stability; EA = emulsifying ability; ES = emulsifying stability; HS = heat stability. All values are means of triplicate analyses. a−b Completely different superscript letters between the values in the column show significant differences (p < 0.05) between the different levels of enzymes in the sample. Table 5.
Mean (n = 3) different functional tests of control and treated samples.
Figures
(4)
Tables
(5)