-

Figure 1.
Phenotypic characteristics of Liriodendron petals. (a) Representative petal phenotypes of Liriodendron samples. Scale bar = 1 cm. (b) Comparative analysis of phenotypic differences between inner and outer petals. Data were analyzed by two-way ANOVA followed by Tukey's post-hoc test. Results are presented as mean ± SD. Different letters indicate statistically significant difference (p < 0.05).
-

Figure 2.
Microstructure of Liriodendron petals. (a) Cross sections of different regions of Liriodendron petals. U: upper region of the petal. M: middle region of the petal. L: lower region of the petal. Scale bar = 50 μm. (b) Chlorophyll distribution in different petal regions during Liriodendron flower development. Scale bar = 50 μm. (c) Chlorophyll fluorescence intensity in different petal regions. Data were analyzed using two-way ANOVA followed by Tukey's post-hoc test. Results are presented as mean ± SD. * and ** indicate statistically significant differences at the p < 0.05 and p < 0.01 levels, respectively.
-

Figure 3.
Transcriptomic analysis of Liriodendron petals. (a) Correlation analysis among different samples. (b) Comparative analysis of differentially expressed unigenes across multiple group comparisons. (c) Distribution of K-means clustering patterns of differentially expressed unigenes. Clusters are ordered according to the number of transcripts they contain. (d) KEGG enrichment analysis of unigene clusters. Dot sizes represent the proportion of unigenes within each pathway, and adjusted p values were calculated using the hypergeometric test.
-

Figure 4.
Carotenoid and terpenoid backbone biosynthesis pathways and expression profiles of related differentially expressed unigenes in Liriodendron petals. Heatmap shows relative expression profiles (blue-white-orange) of carotenoid biosynthesis-related unigenes in Liriodendron petals. DXS, 1-deoxy-D-xylulose-5-phosphate synthase; DXR, 1-deoxy-D-xylulose-5-phosphate reductor isomerase; ISPD, 2-C-methyl-D-erythritol 4-phosphate cytidylyltransferase; ISPE, 4-(cytidine 5′-diphospho)-2-C-methyl-D-erythritol kinase; ISPF, 2-C-methyl-D -erythritol 2,4-cyclodiphosphate synthase; GCPE, (E)-4-hydroxy-3-methylbut-2-enyl diphosphate synthase; ISPH, (E)-4-hydroxy-3-methylbut-2-enyl diphosphate reductase; IDI, isopentenyl diphosphate; GGPS, geranylgeranyl diphosphate synthase; GPS, geranyl diphosphate synthase; PSY, phytoene synthase; PDS, phytoene desaturase; ZDS, ζ-carotene desaturase; CRTISO, carotenoid isomerase; LCYE, lycopene ε-cyclase; LCYB, lycopene β-cyclase; CRTZ, β-carotene hydroxylase; CYP97C1, carotene ε-monooxygenase; CYP97A3, β-ring hydroxylase; ZEP, zeaxanthin epoxidase; VDE, violaxanthin de-epoxidase; NCED, 9-cis-epoxycarotenoid dioxygenase. ABA2, xanthoxin dehydrogenase; AAO3, abscisic-aldehyde oxidase; CYP707A, (+)-abscisic acid 8'-hydroxylase; CCS1, capsanthin synthase. S1, S2, T, and C represent JZ1, JZ2, Lt, and Lc, respectively. The pathway diagram was adapted from KEGG (
www.kegg.jp ). -
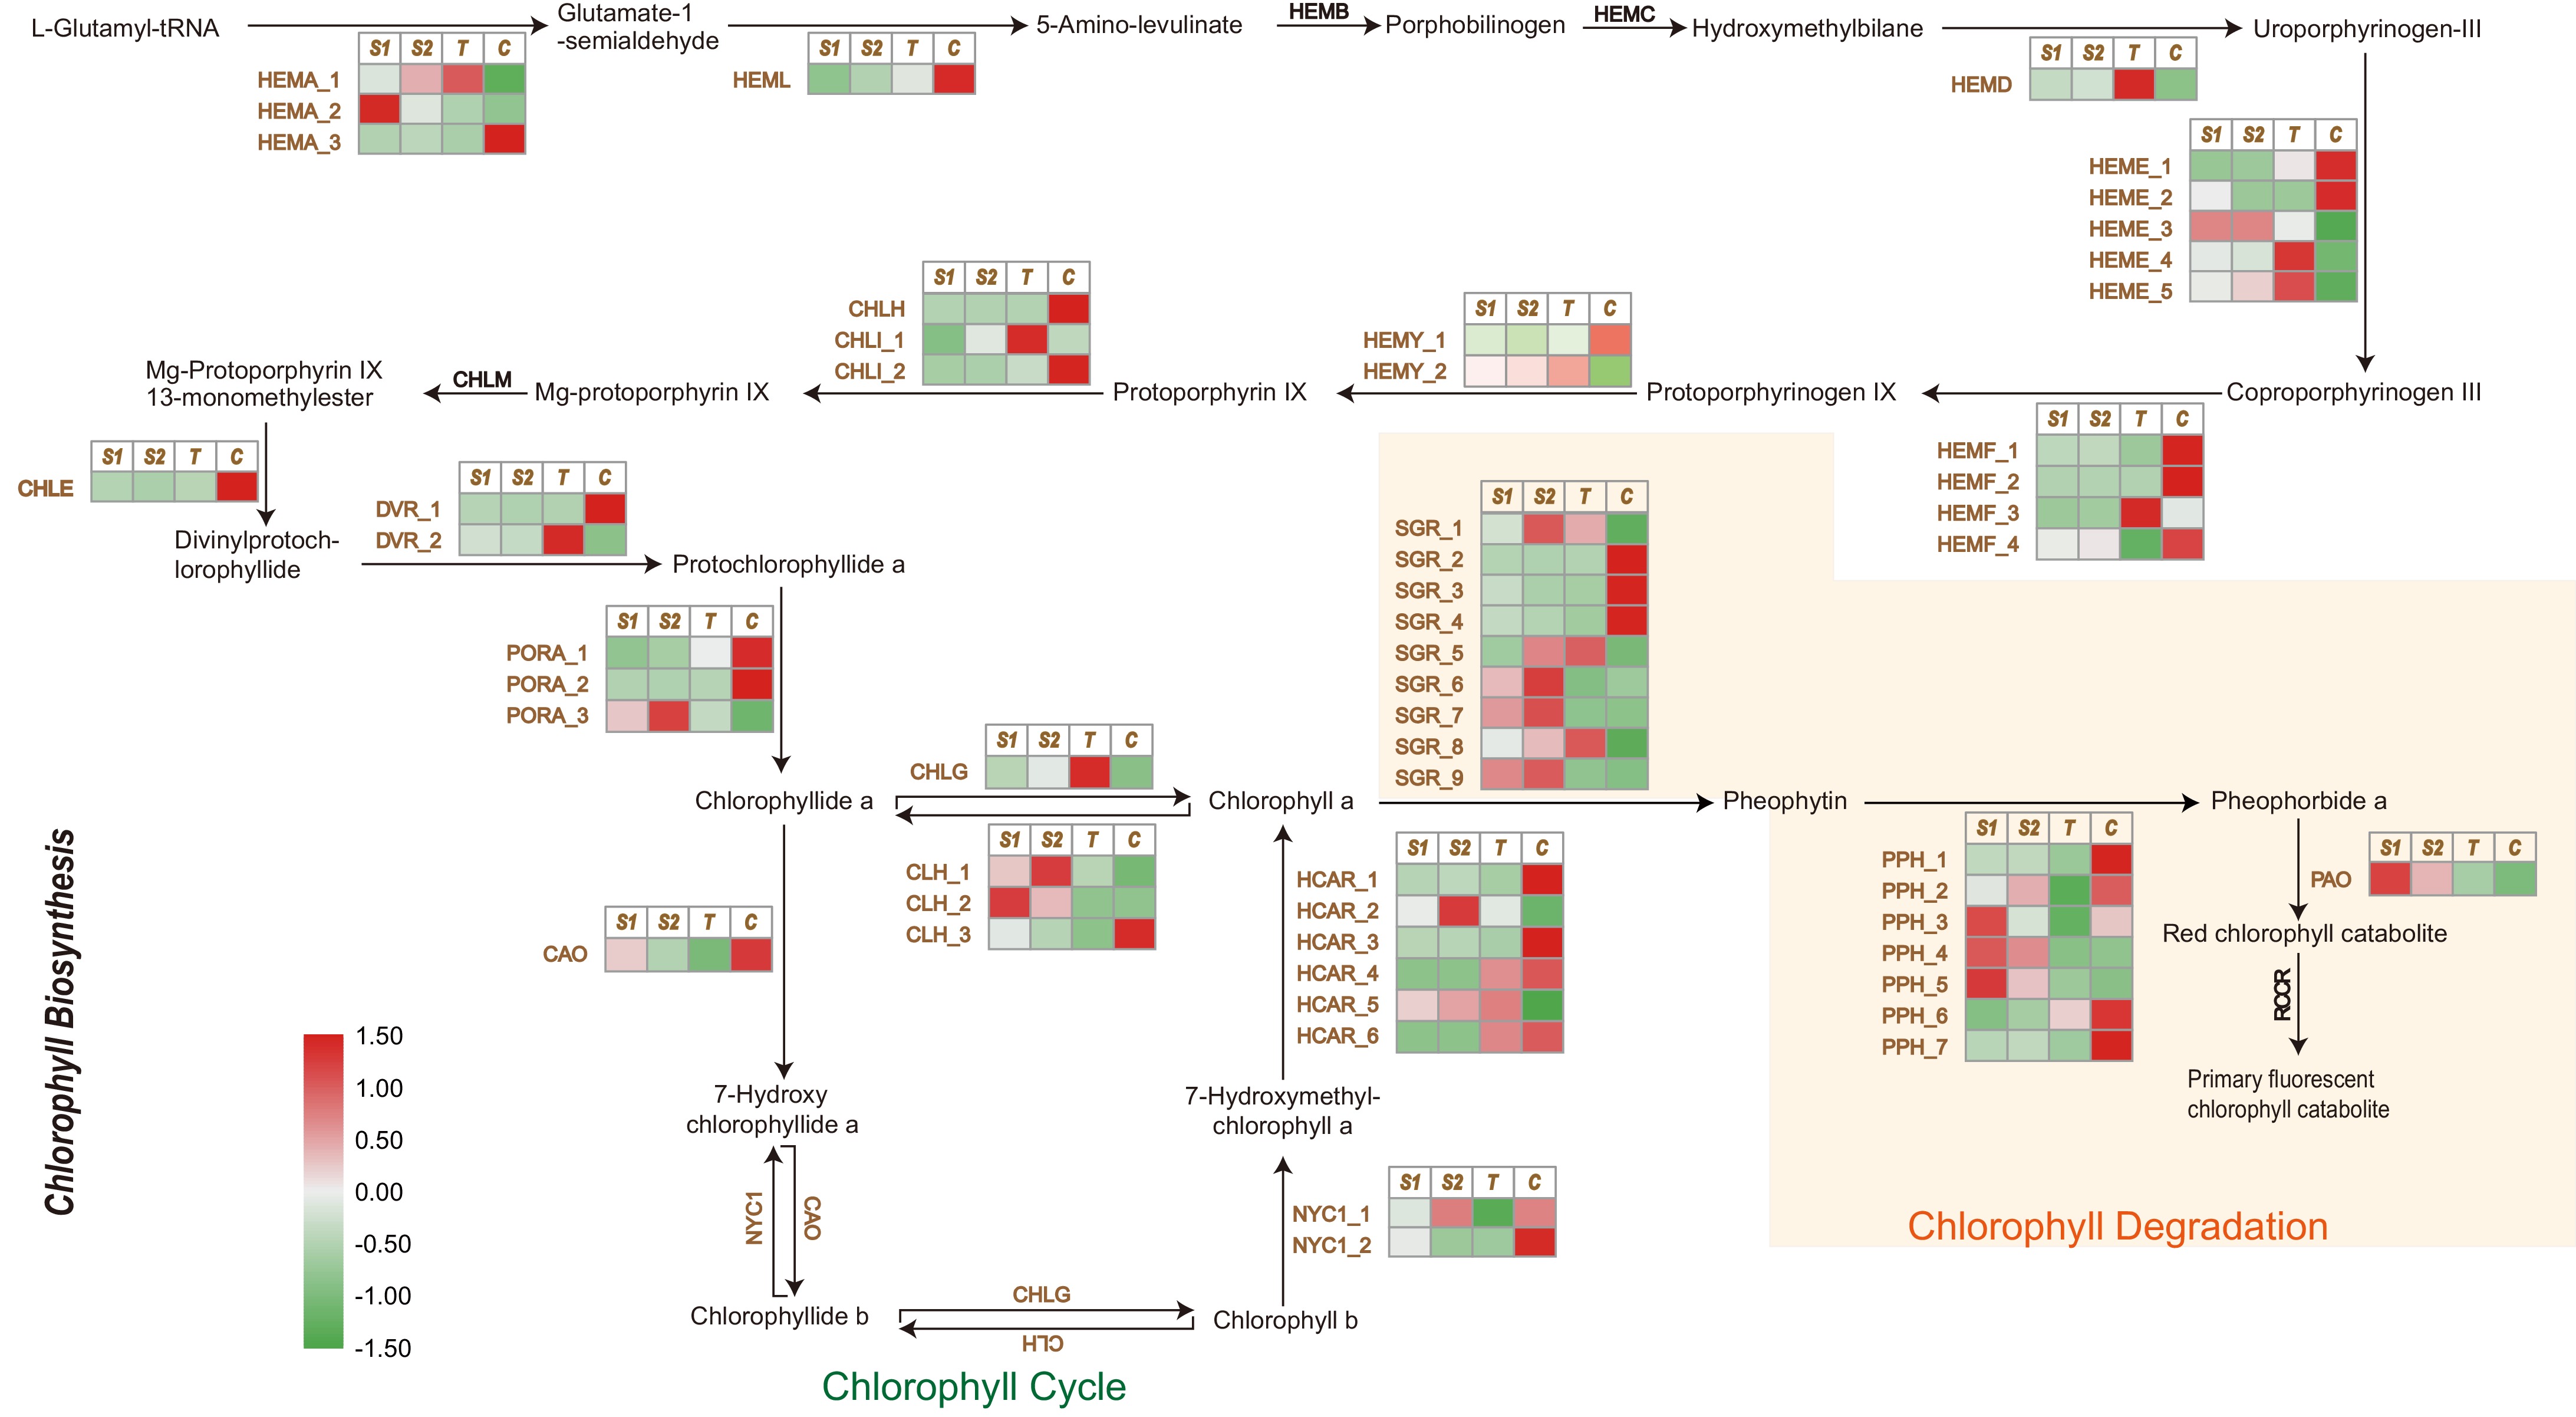
Figure 5.
Chlorophyll biosynthesis and degradation pathways and expression profiles of related differentially expressed unigenes in Liriodendron petals. Heatmap shows relative expression profiles (green-white-red) of chlorophyll biosynthesis and degradation pathway unigenes in Liriodendron petals. HEMA, glutamyl-tRNA reductase 1; HEML, glutamate-1-semialdehyde 2,1-aminomutase; HEMB, delta-aminolaevulinic acid dehydratase 1; HEMC, porphobilinogen deaminase; HEMD, uroporphyrinogen-III synthase; HEME, uroporphyrinogen decarboxylase 1; HEMF, coproporphyrinogen III oxidase; HEMY, geranylgeranyl diphosphate synthase; CHLH, magnesium-chelatase subunit H; CHLI, magnesium-chelatase subunit I; CHLM, magnesium-protoporphyrin O-methyltransferase; CHLE, anaerobic magnesium-protoporphyrin IX monomethyl ester cyclase; DVR, divinyl chlorophyllide a 8-vinyl-reductase; PORA, protochlorophyllide reductase A; CAO, protochlorophyllide reductase A; NYC1, chlorophyll (ide) b reductase; CHLG, chlorophyll synthase; CLH, chlorophyllase; HCAR, 7-hydroxymethyl chlorophyll a reductase; SGR, STAY-GREEN; PPH, pheophytins. PAO, pheophorbide a oxygenase; RCCR, red chlorophyll catabolite reductase. S1, S2, T, and C represent JZ1, JZ2, Lt and Lc, respectively. The pathway diagram was adapted from KEGG (
www.kegg.jp ). -
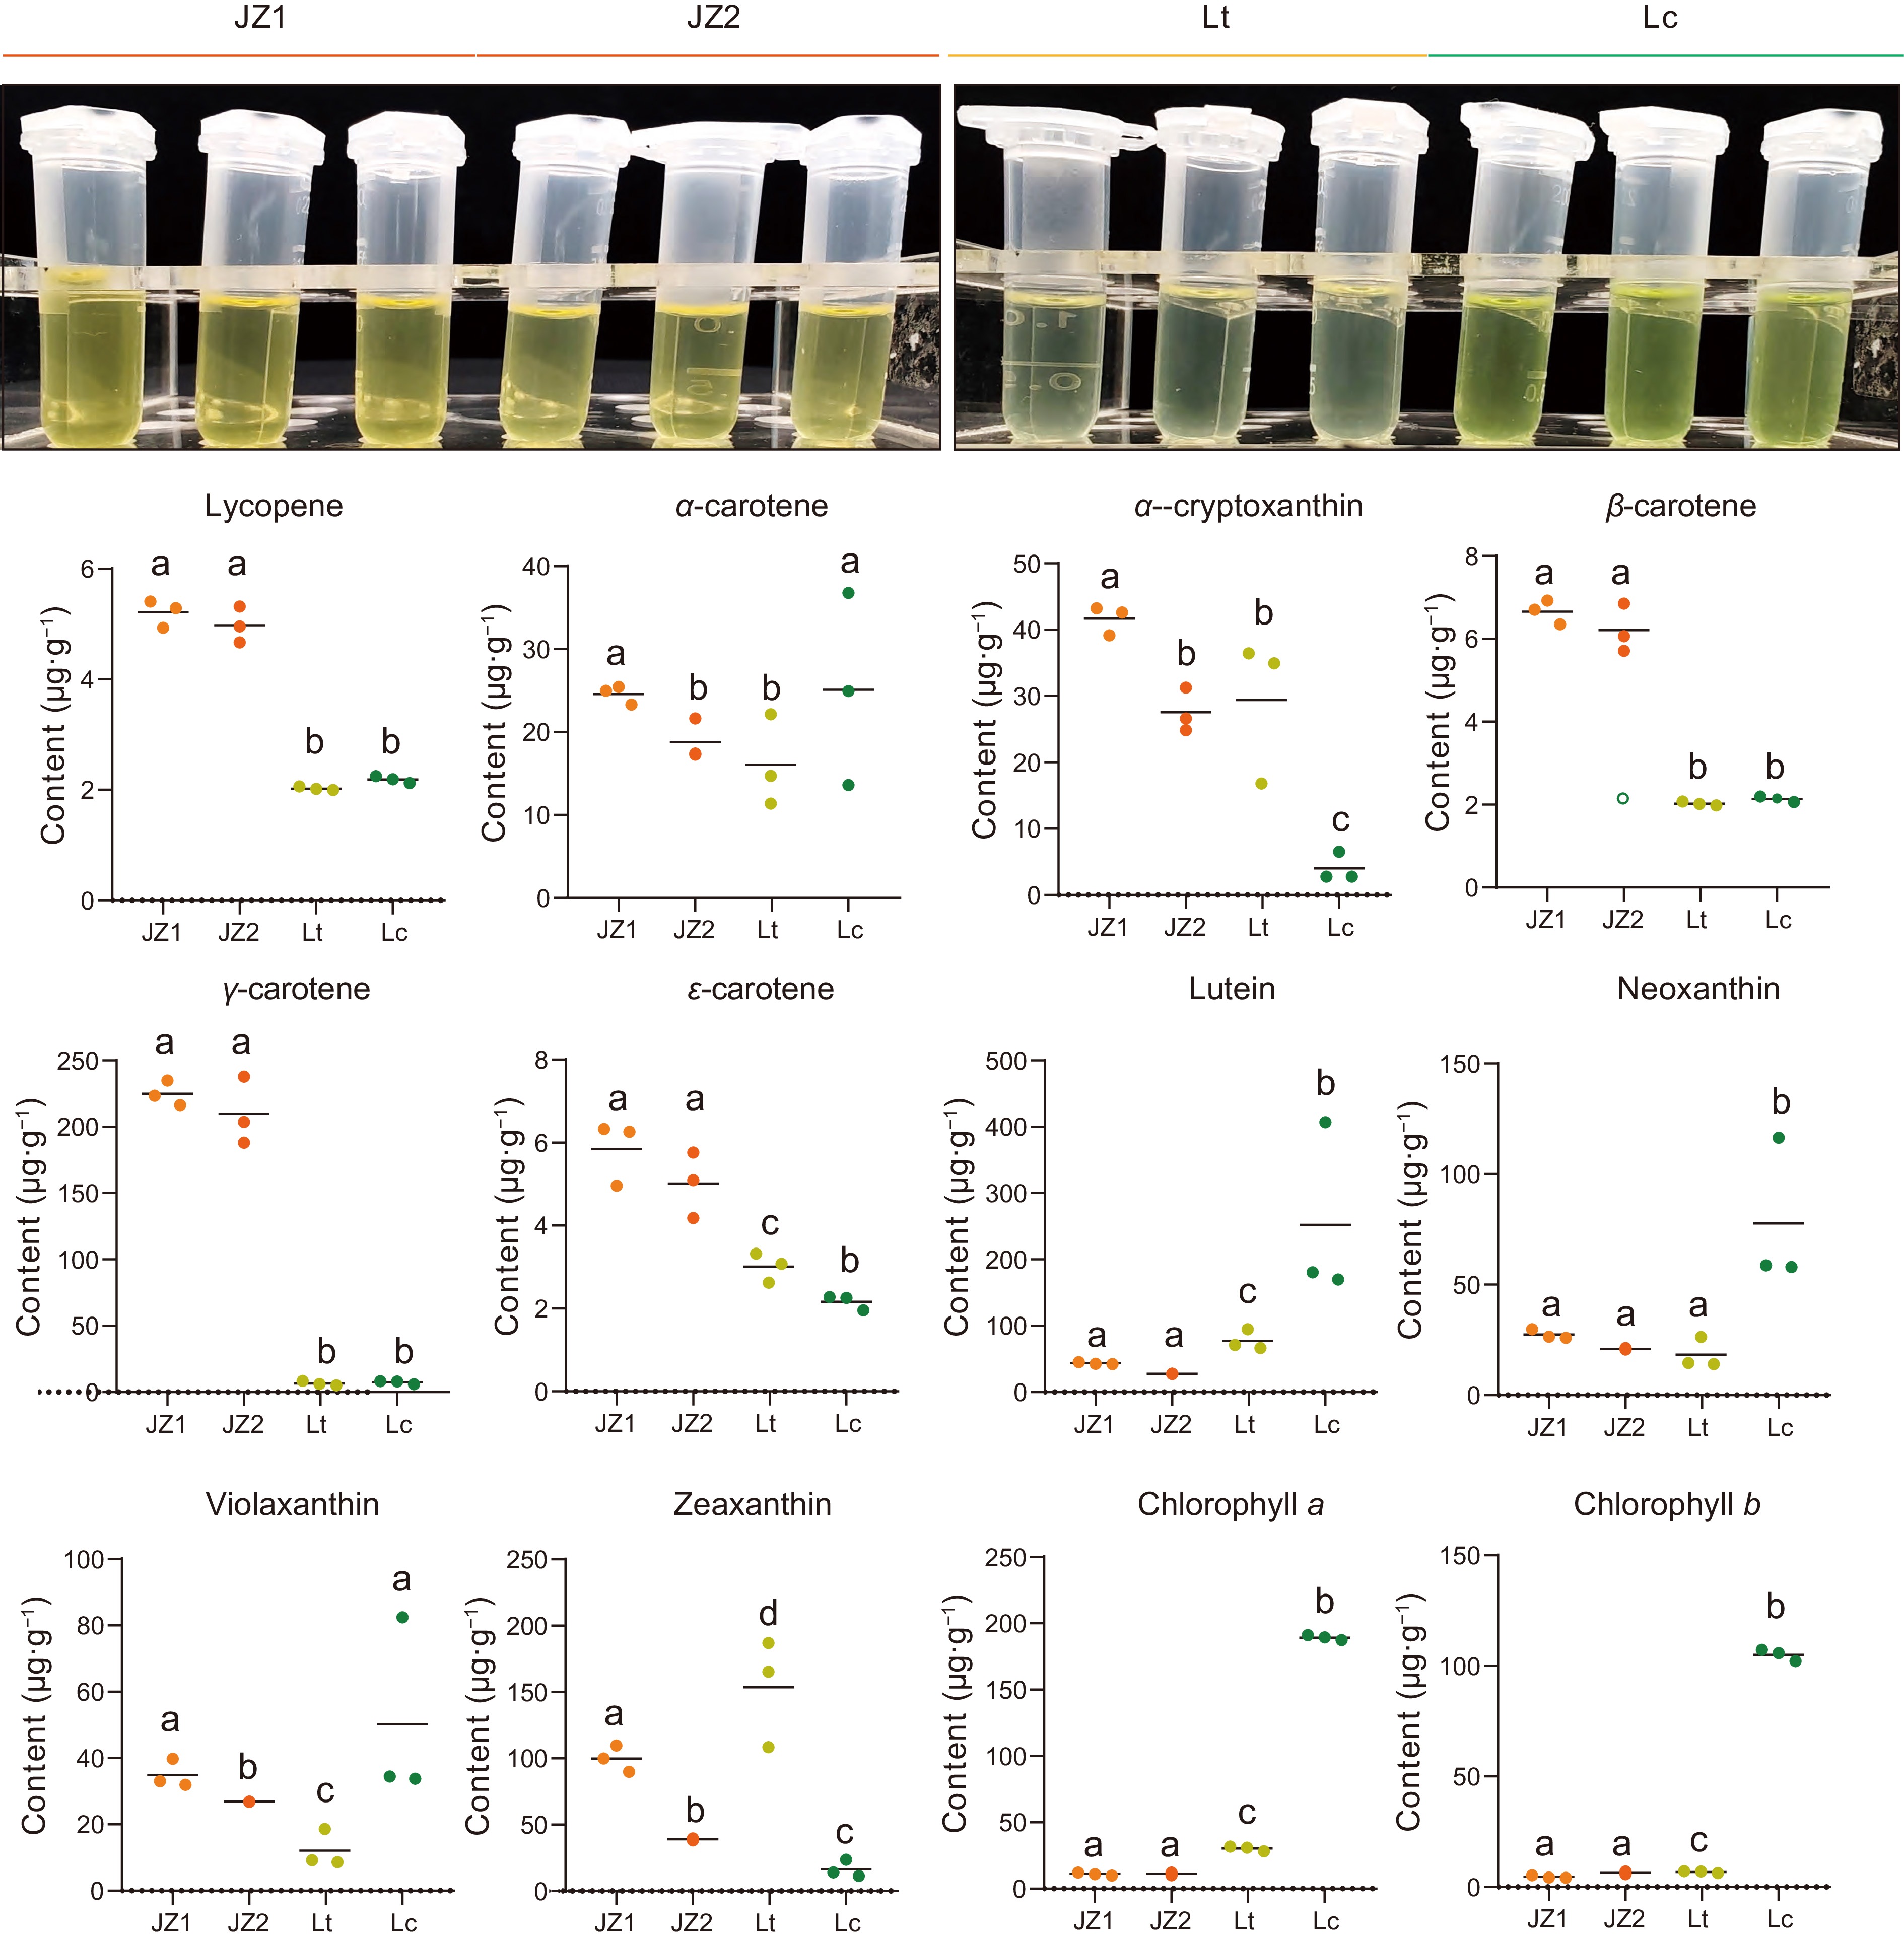
Figure 6.
Statistical analysis of carotenoid and chlorophyll contents in Liriodendron petals. Data were analyzed using two-way ANOVA followed by Tukey's post-hoc test. Results are presented as mean ± SD. Different letters indicate statistically significant differences (p < 0.05).
-
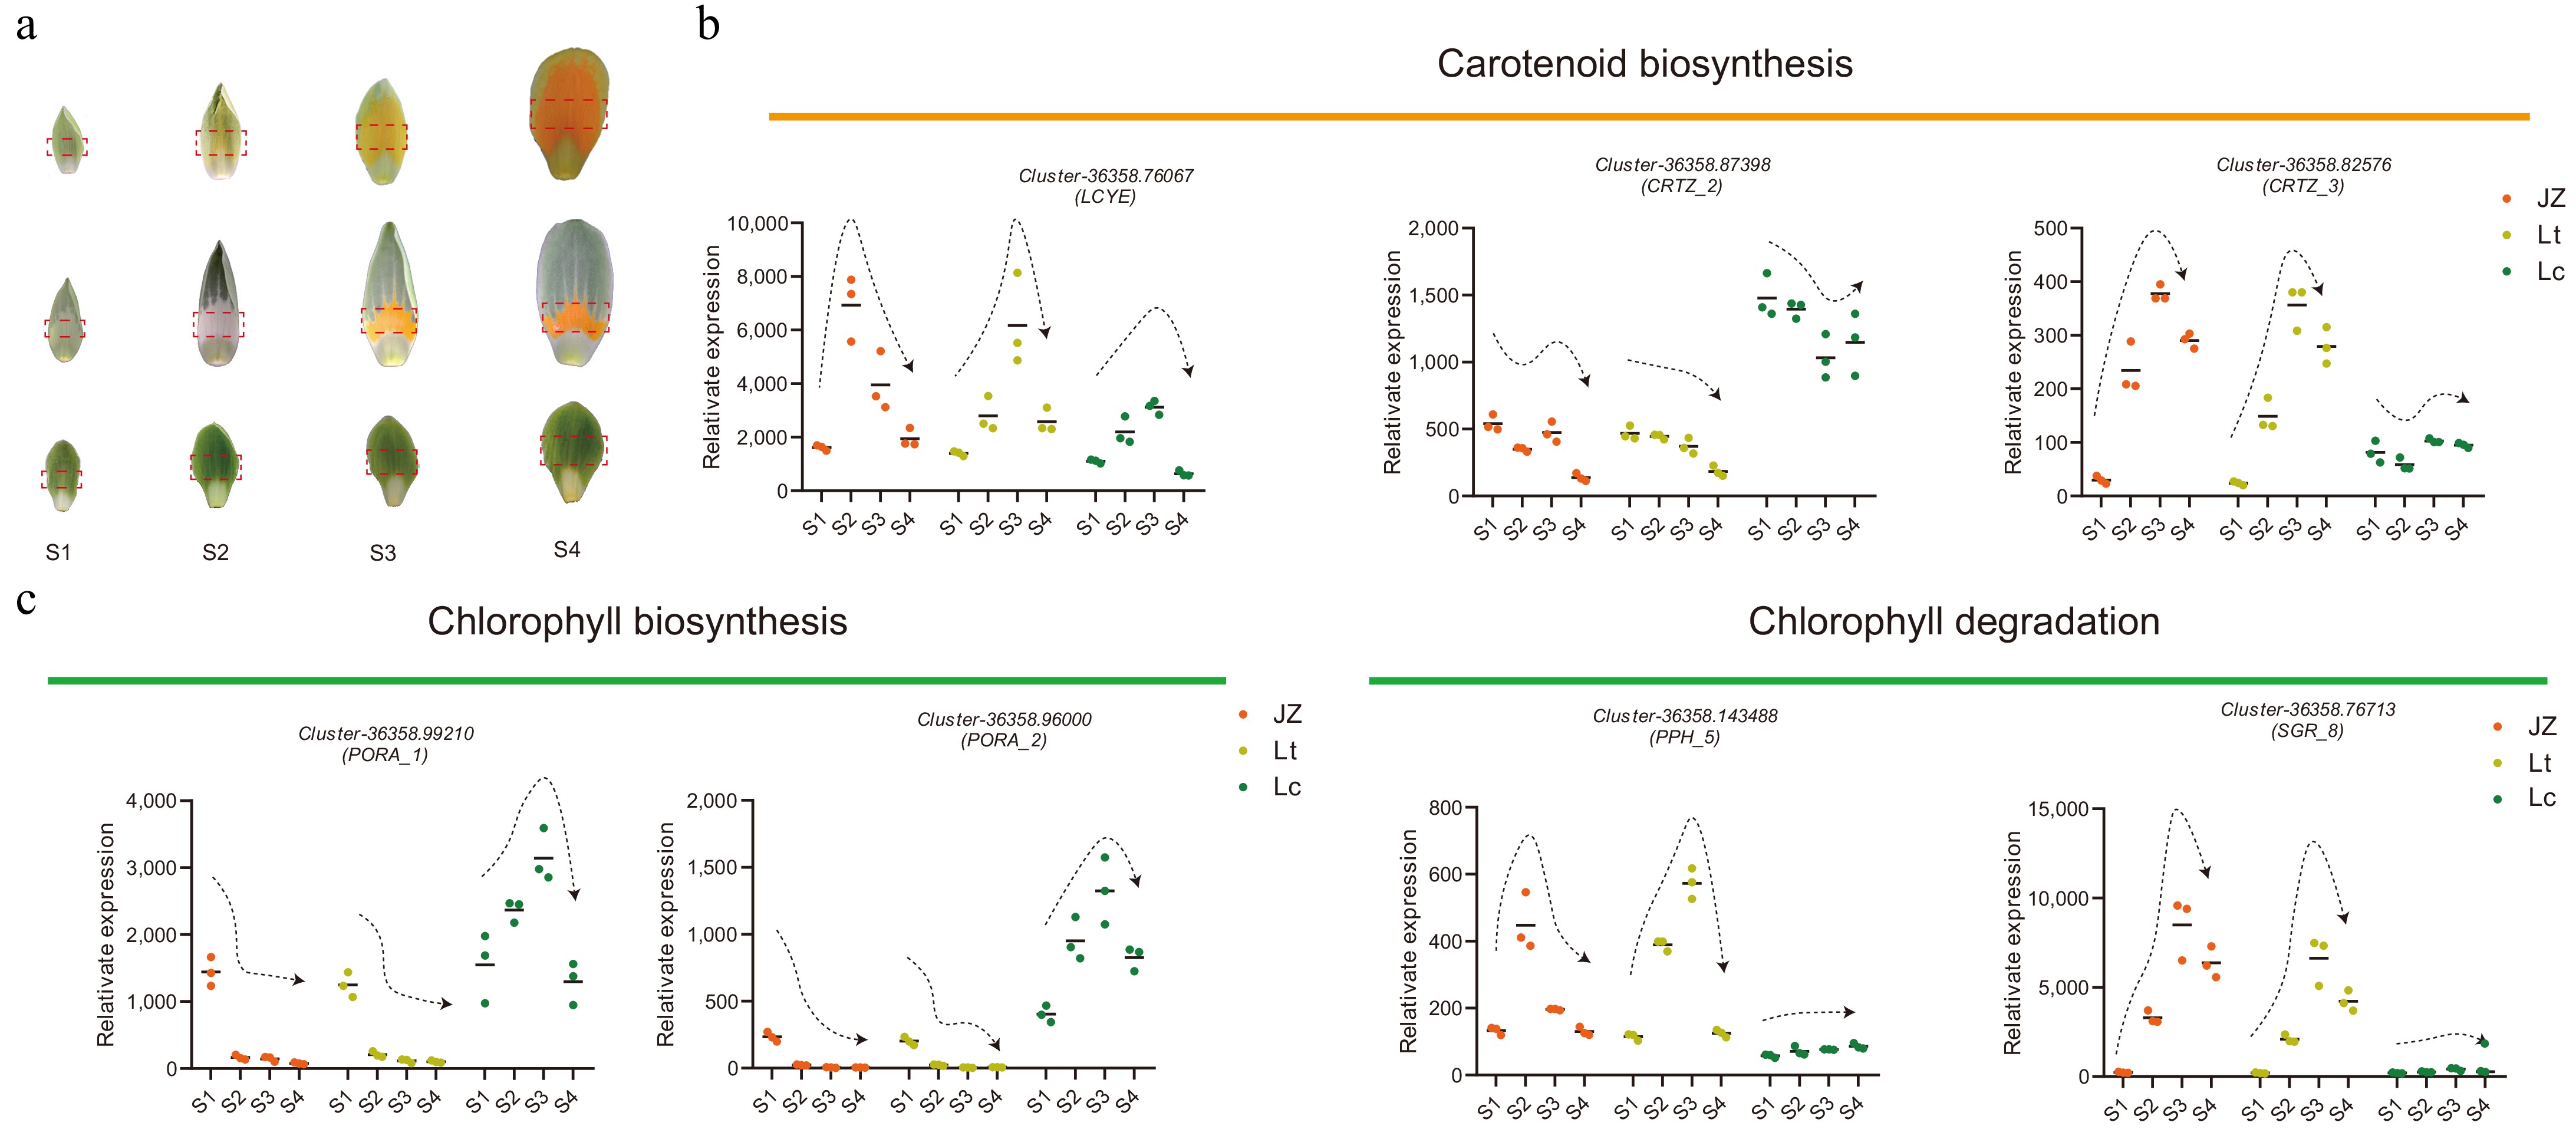
Figure 7.
Dynamic expression patterns of key carotenoid and chlorophyll biosynthesis unigenes in the central petal region during Liriodendron flower development. (a) Coloration patterns of the central petal region across development stages (S1−S4) of Liriodendron flowers. (b), (c) Temporal expression profiles of target unigenes in the central petal region.
-

Figure 8.
Phenotypic alterations induced by silencing LcPORA1 and LcPORA2 in L. chinense petals. (a)−(c) Downregulation of LcPORA1 and LcPORA2 expression via VIGS technology significantly affected petal coloration and chloroplast structure in L. chinense. Black arrows indicate normal chloroplasts, while blue arrows indicate abnormal chloroplasts. Scale bar = 1 cm. (d) Downregulation of LcPORA1 and LcPORA2 significantly reduced the chlorophyll content in L. chinense petals. Data were analyzed using two-way ANOVA followed by Tukey's post-hoc test. Results are presented as mean ± SD. *** indicates p < 0.001.
-
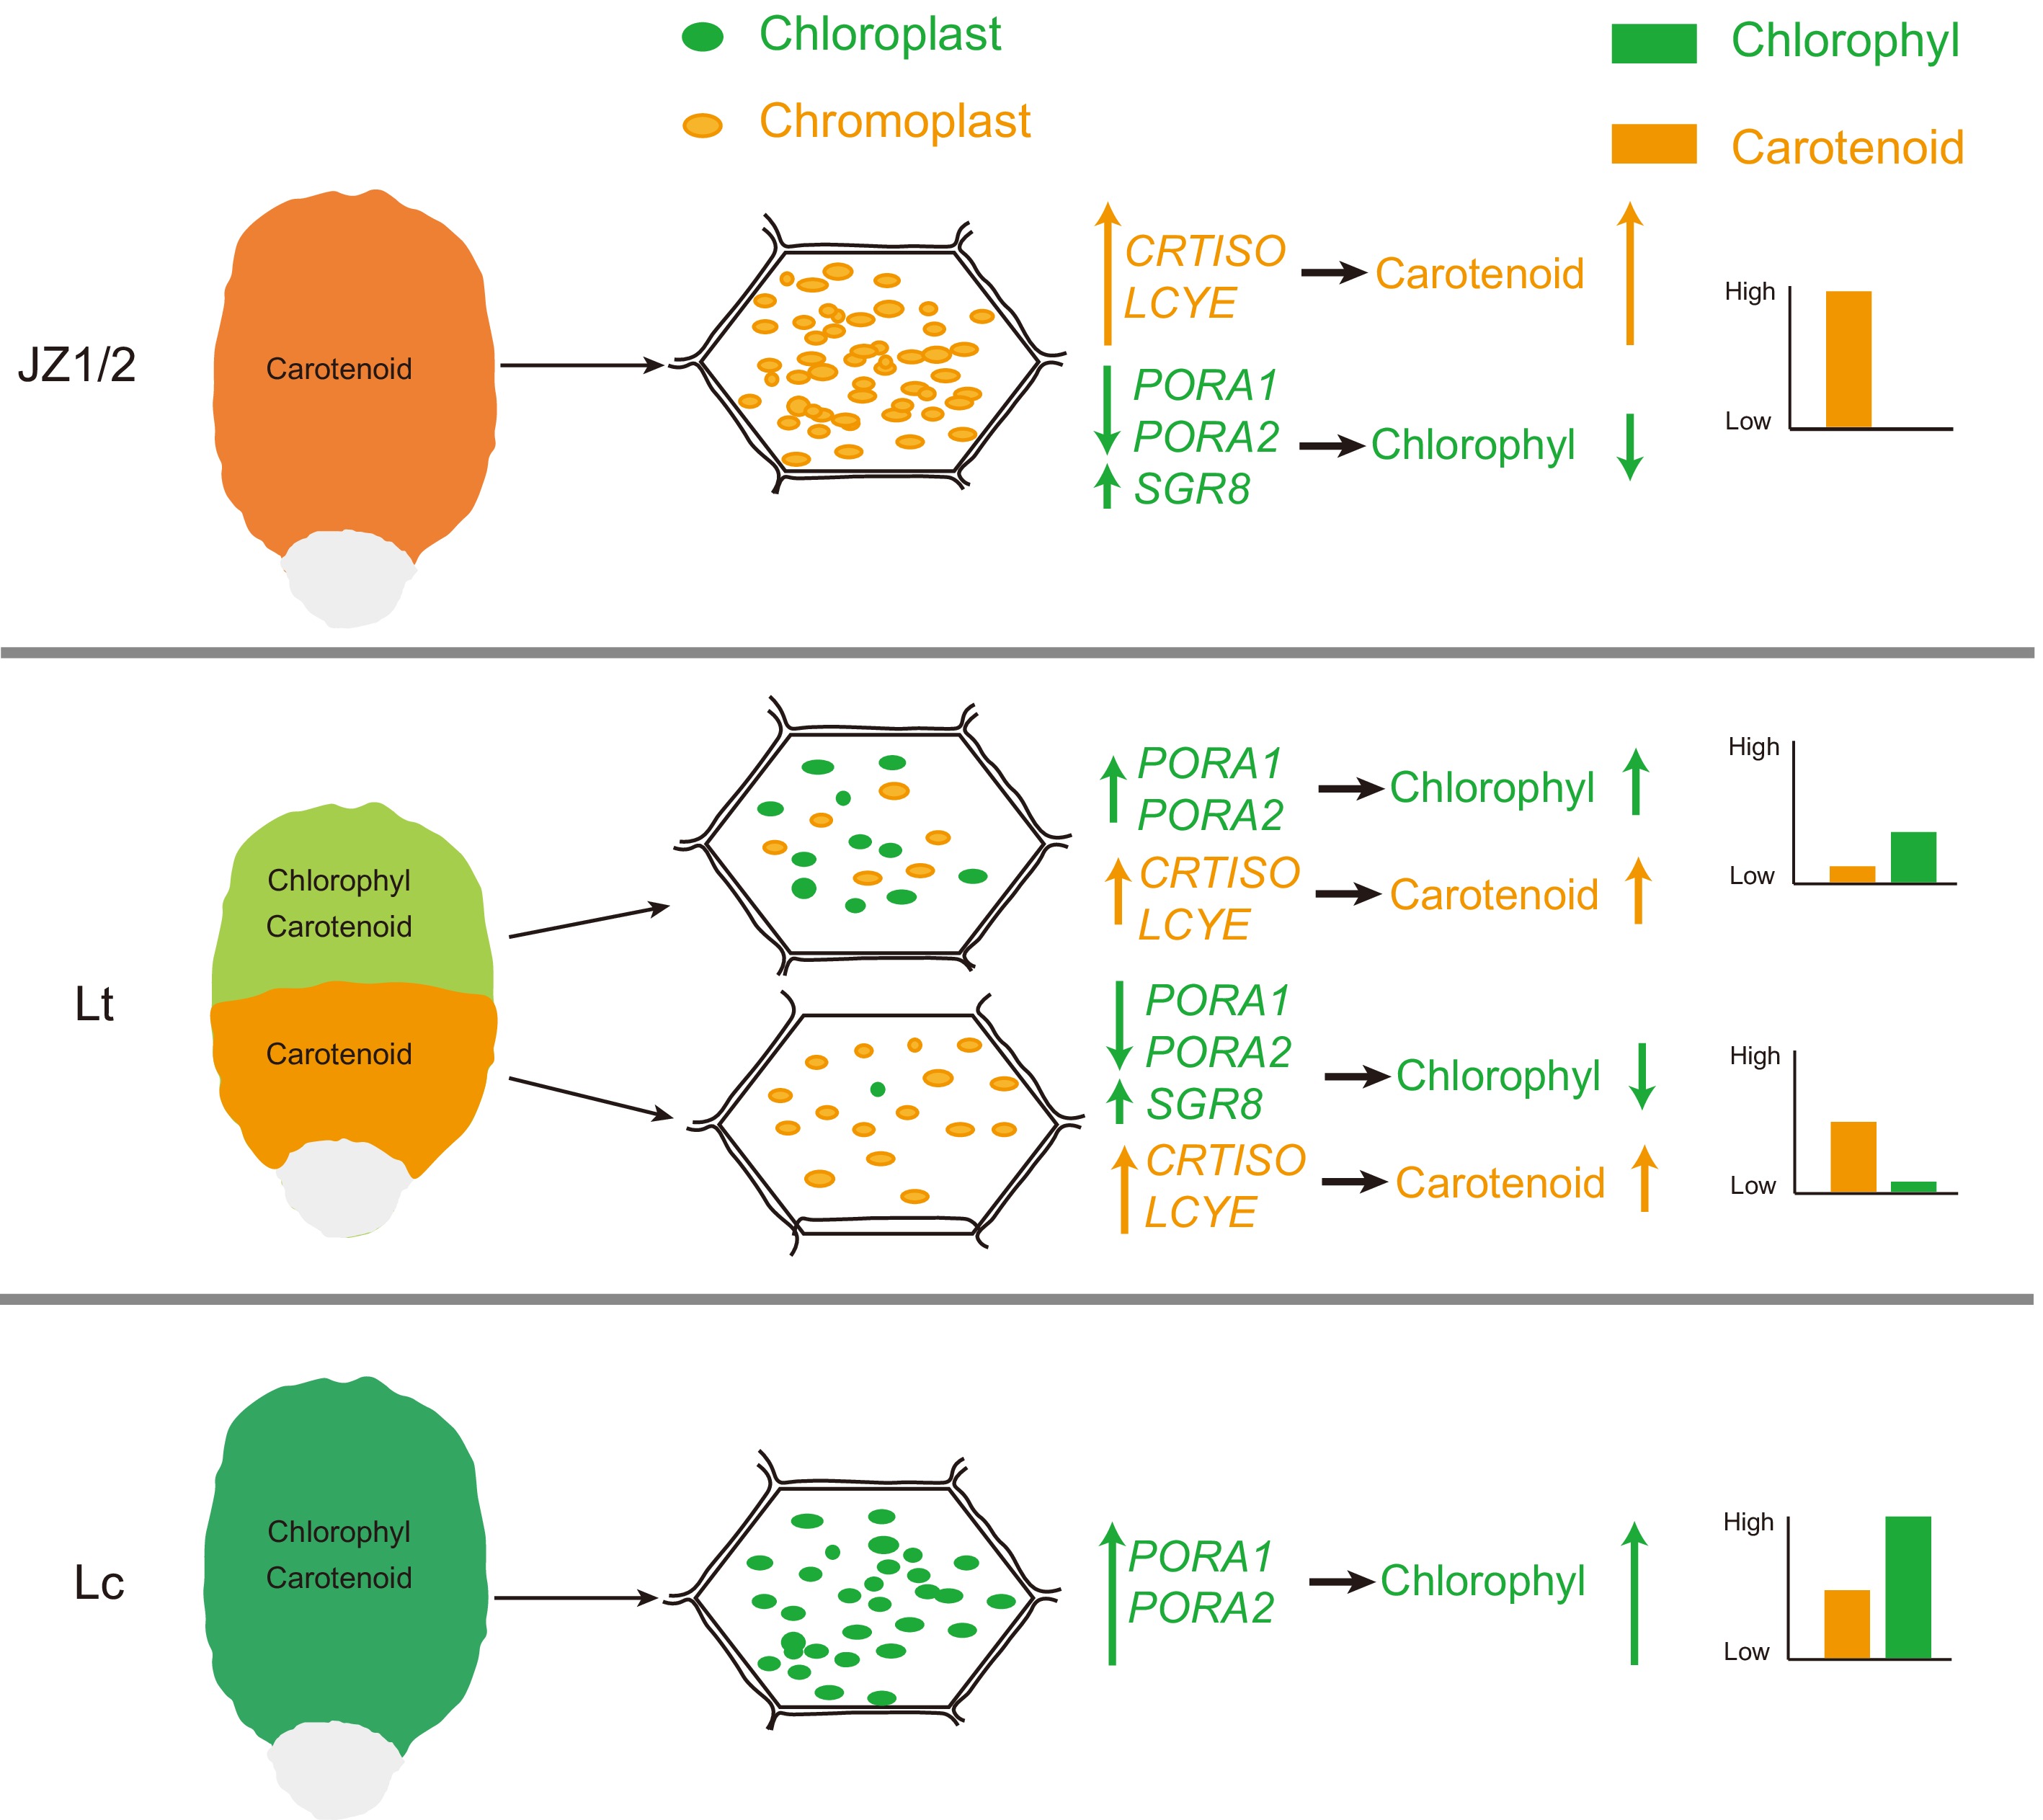
Figure 9.
Schematic illustration of petal color variation in Liriodendron. The green and orange elliptical spheres represent chloroplasts and chromoplasts, respectively. The green and orange on the coordinate axis represent the relative content of chlorophyll and carotenoids, respectively.
Figures
(9)
Tables
(0)