-
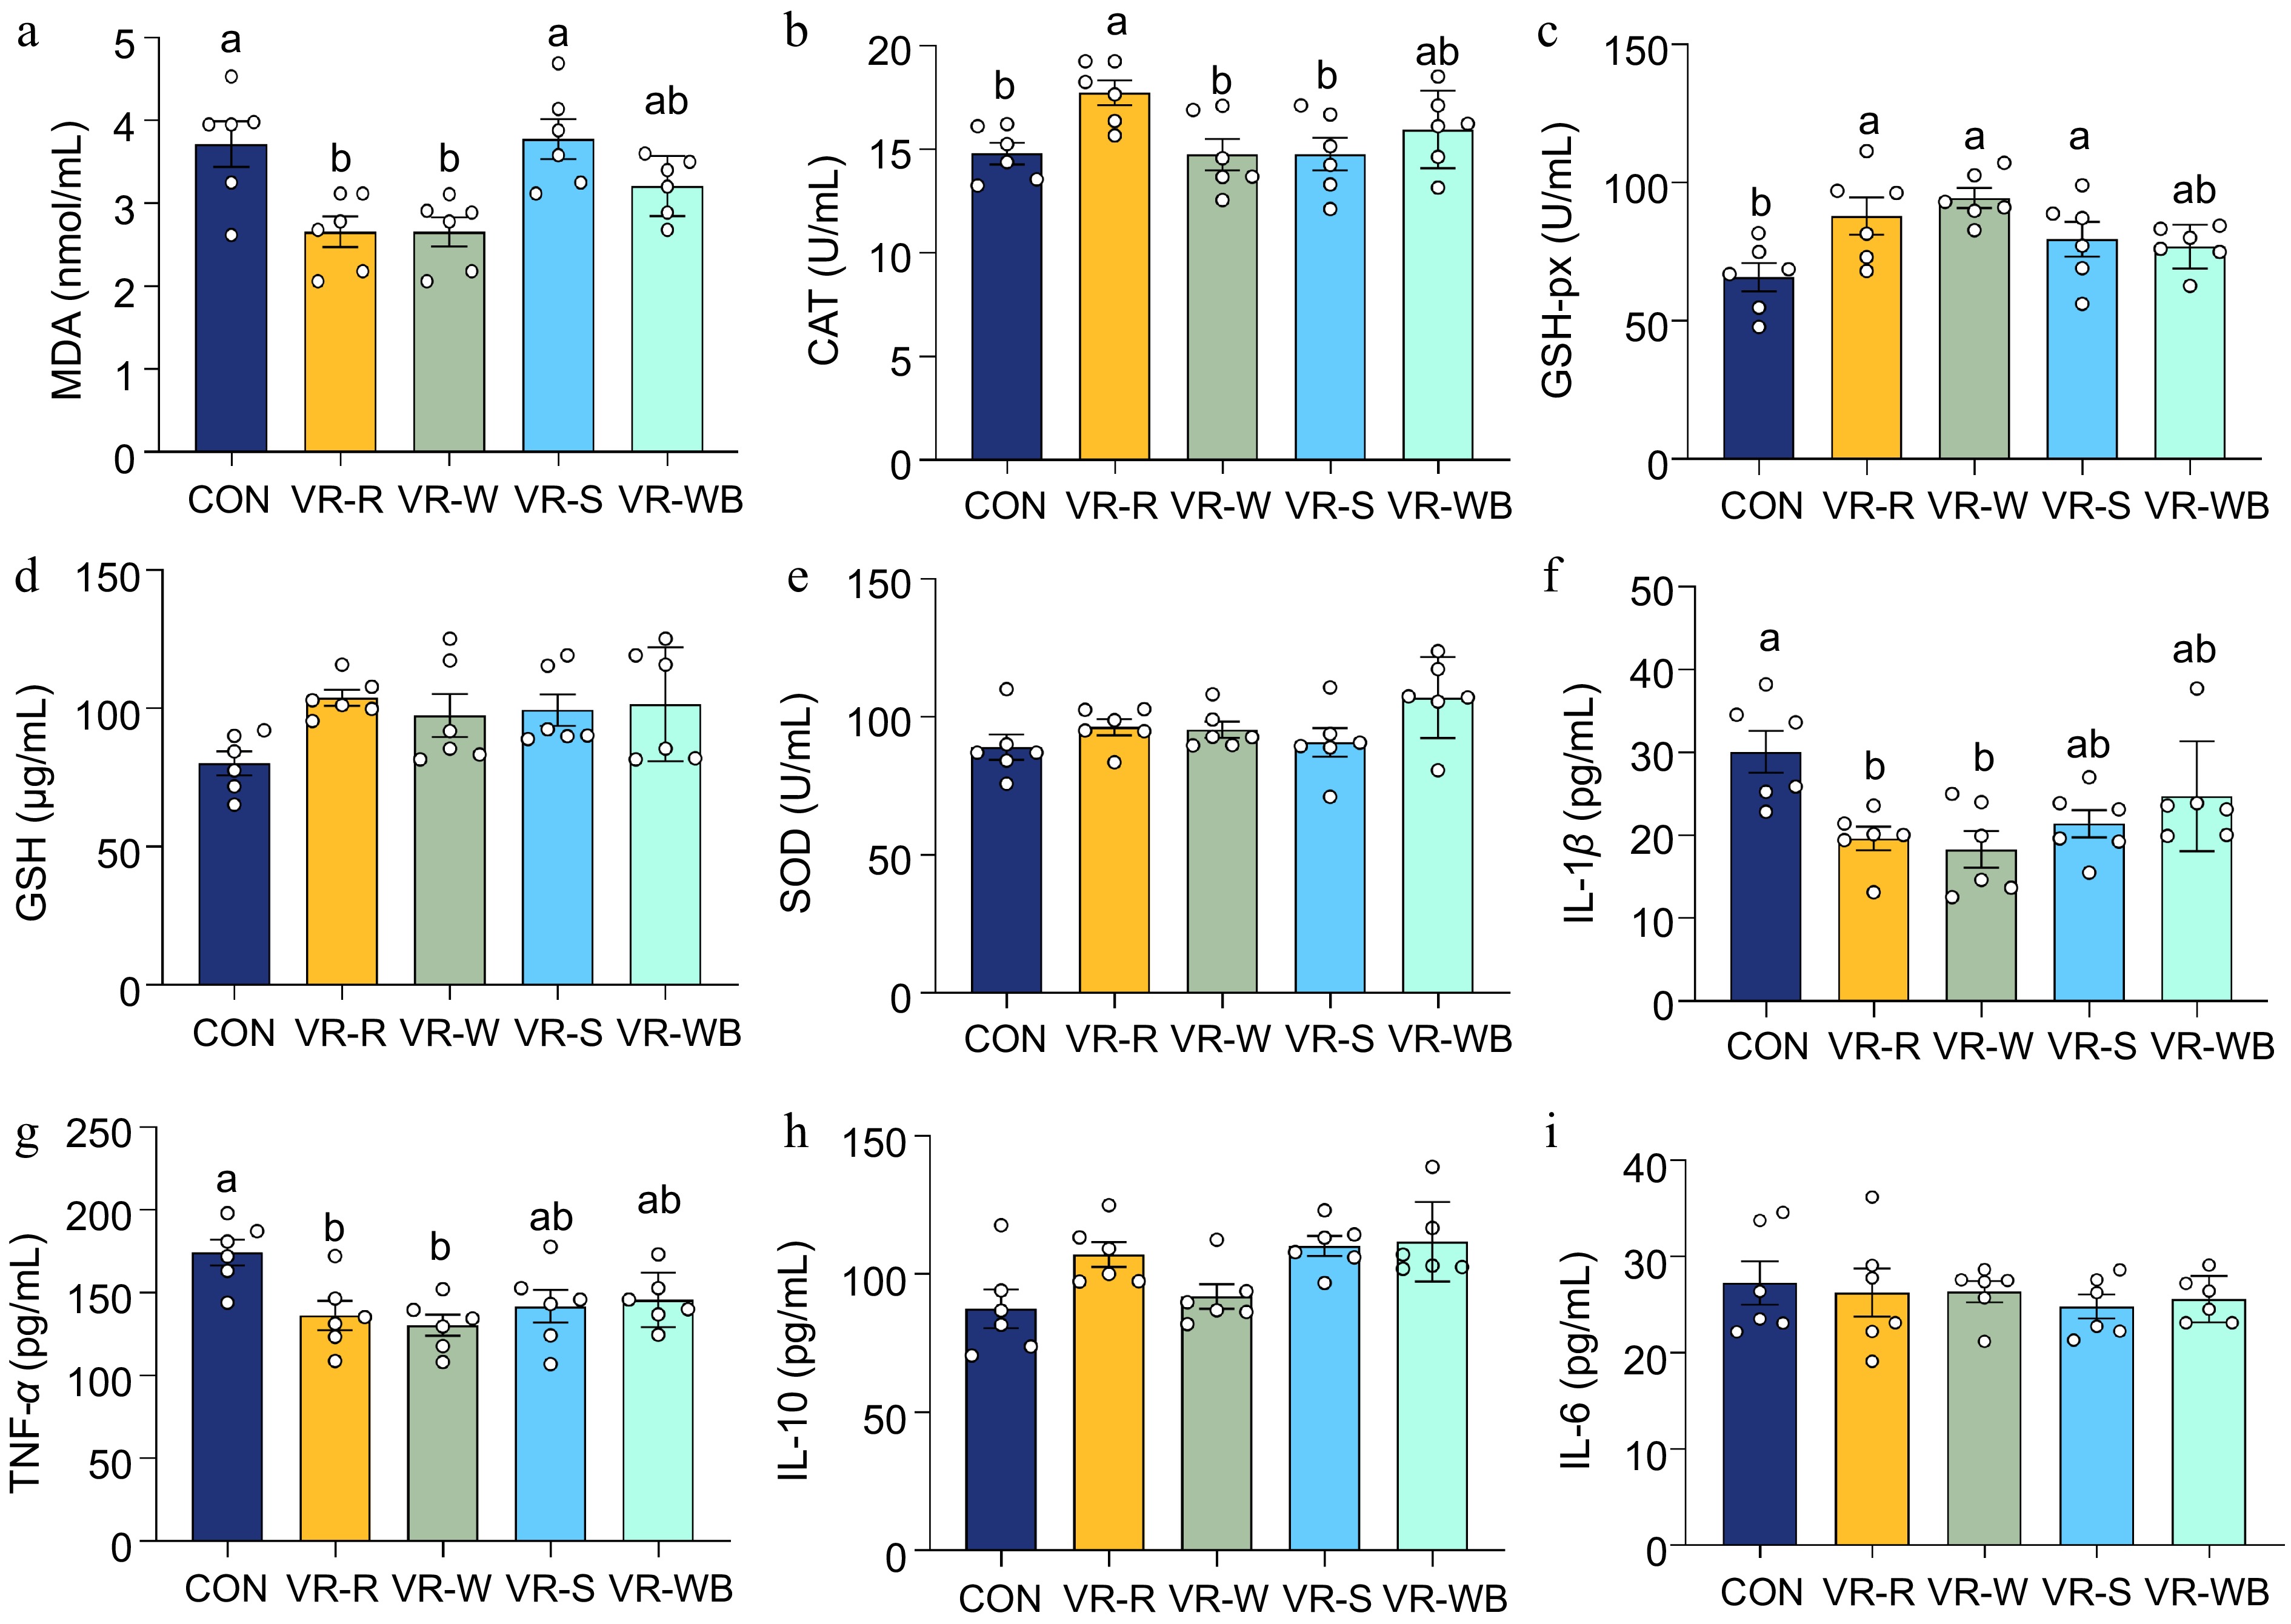
Figure 1.
Plasma antioxidative enzyme activities and cytokines of growing pigs fed diets based on different sources of VR. (a)−(d) The plasma activities of MDA, CAT, GSH-px, GSH, and SOD. (f)−(i) The plasma levels of IL-1β, TNF-α, IL-10, and IL-6 values are means ± SEMs, n = 6. Labelled means without a common letter are significantly different from each other, p < 0.05.
-
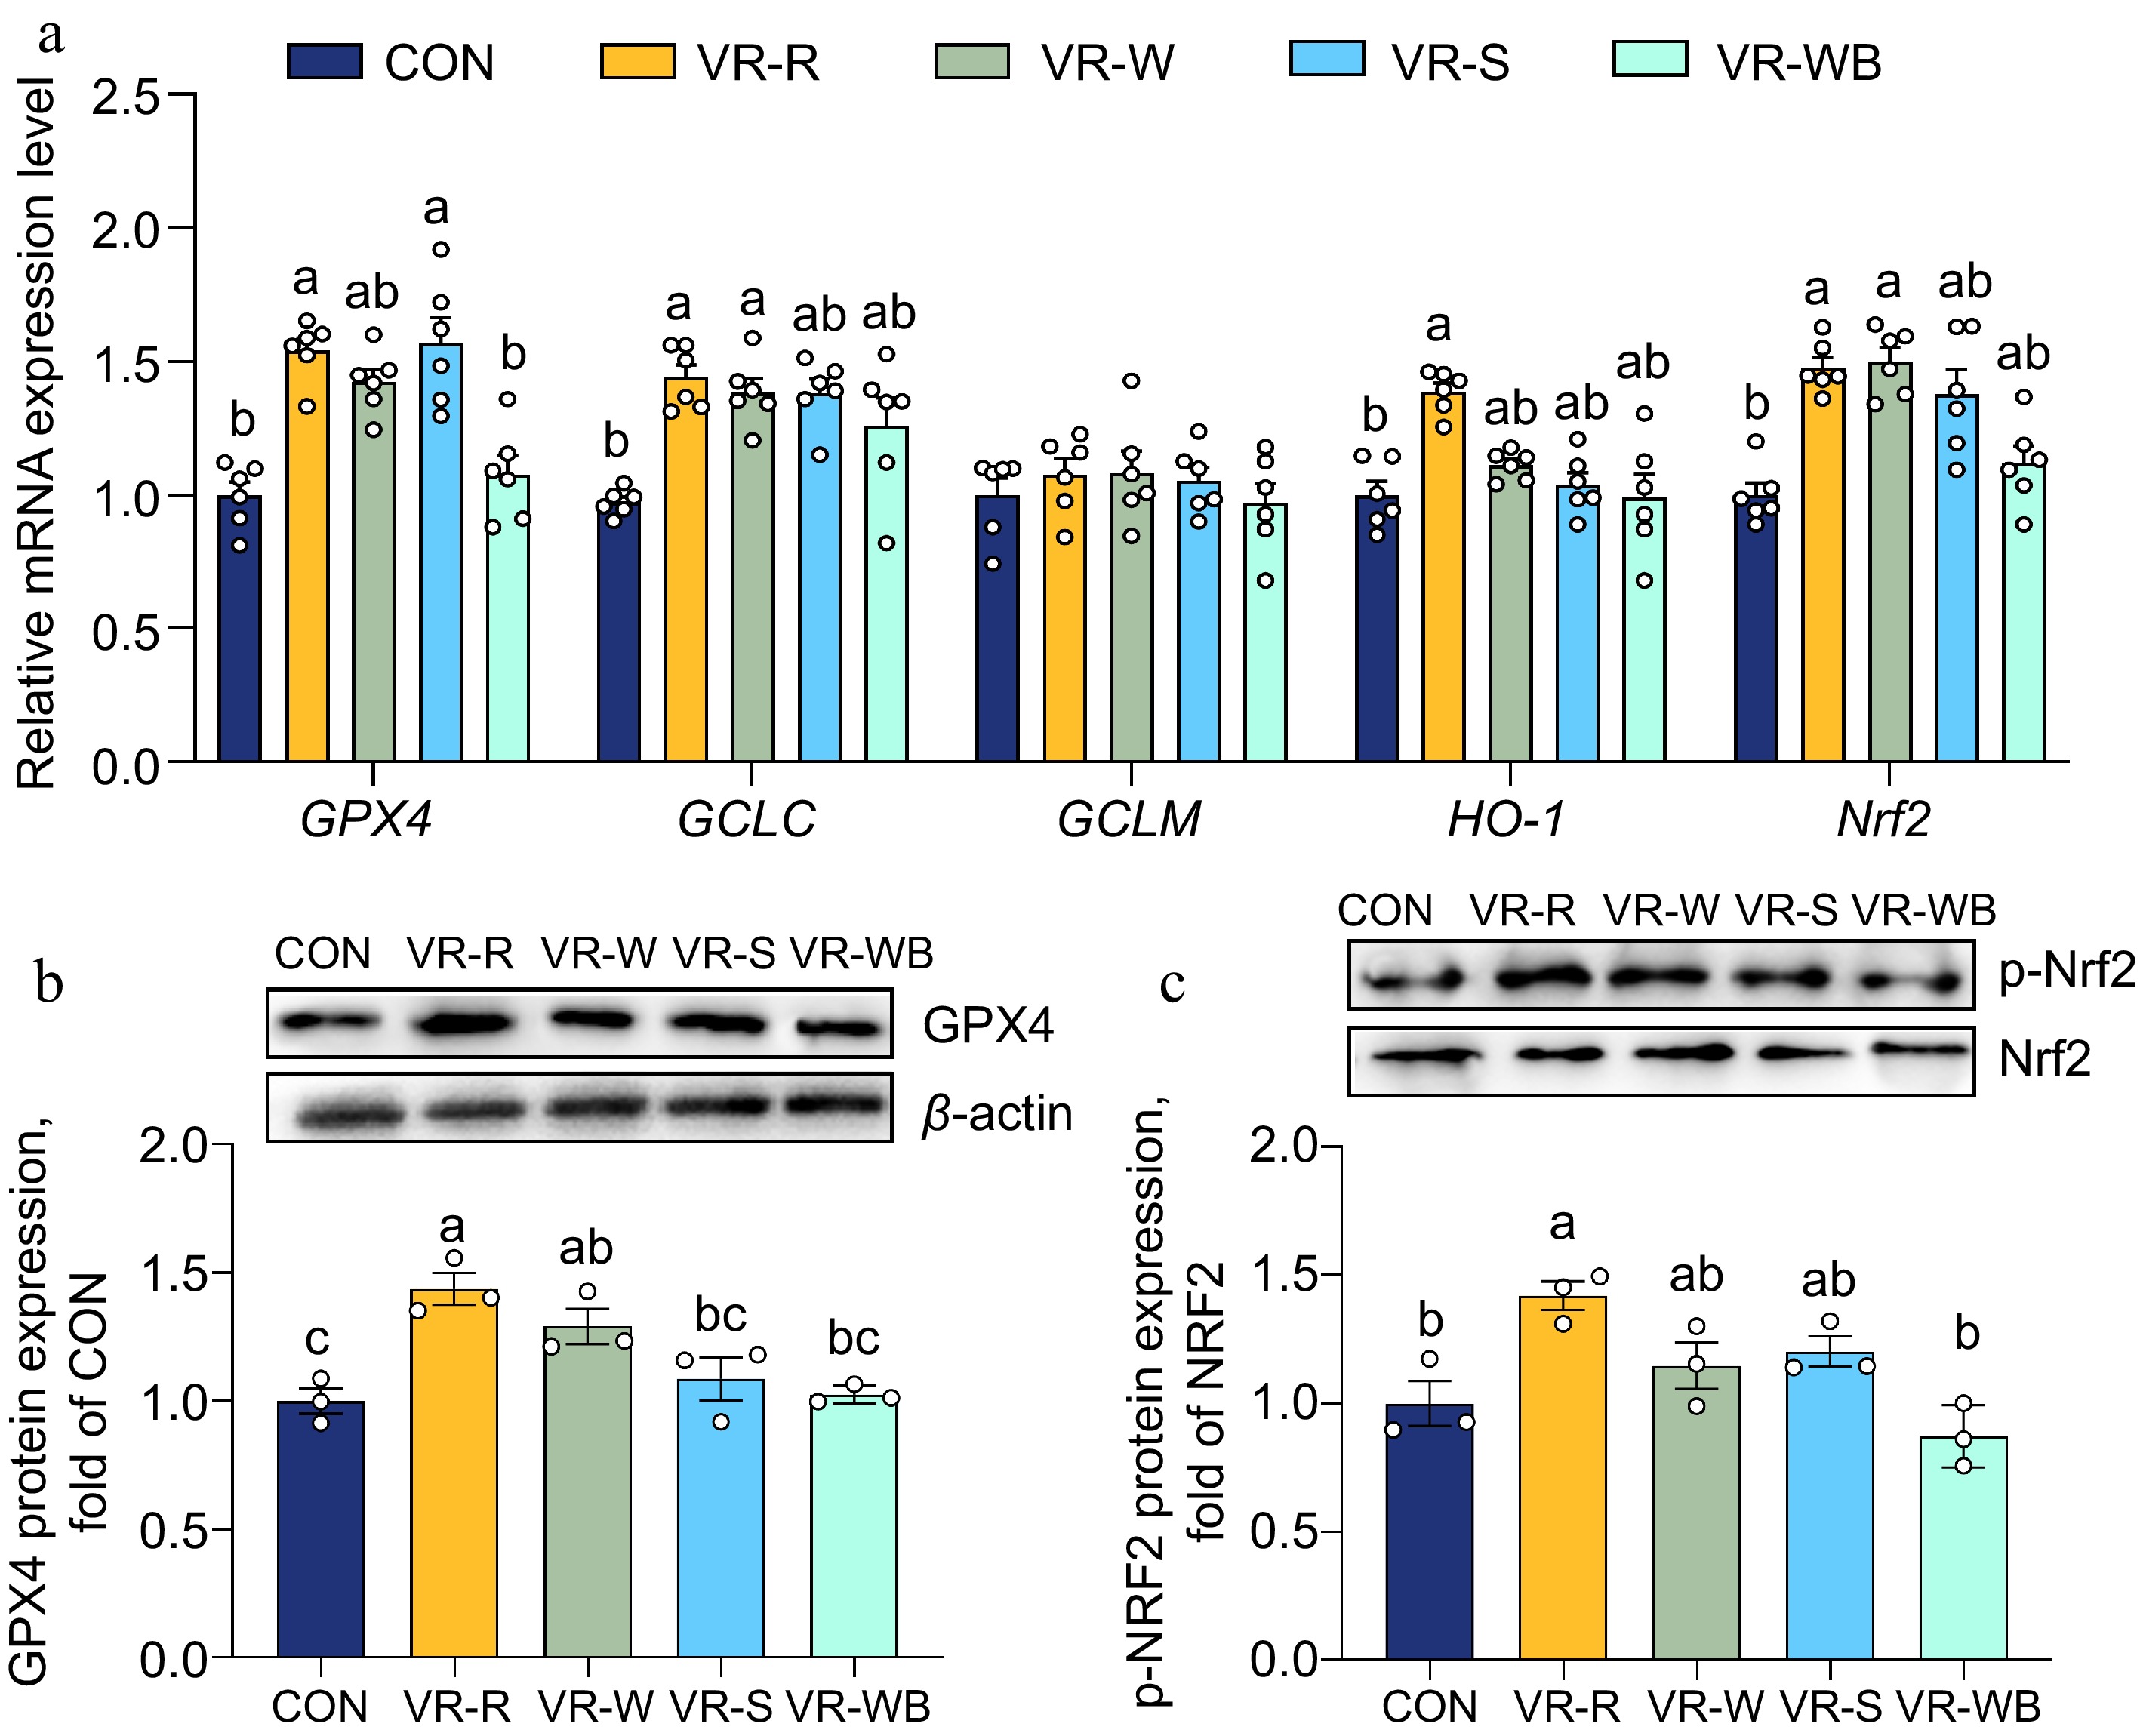
Figure 2.
Effects of VR on the intestinal oxidative stress related to Nrf2 pathways. (a) Relative mRNA expressions of GPX4, GCLC, GCLM, HO-1, and Nrf2 normalized to β-actin expression. (b), (c) Western blot analysis of GPX4 and p-Nrf2 protein levels normalized to β-actin or Nrf2. Values are means ± SEMs, n = 3 or 6. Labelled means without a common letter are significantly different from each other, p < 0.05.
-
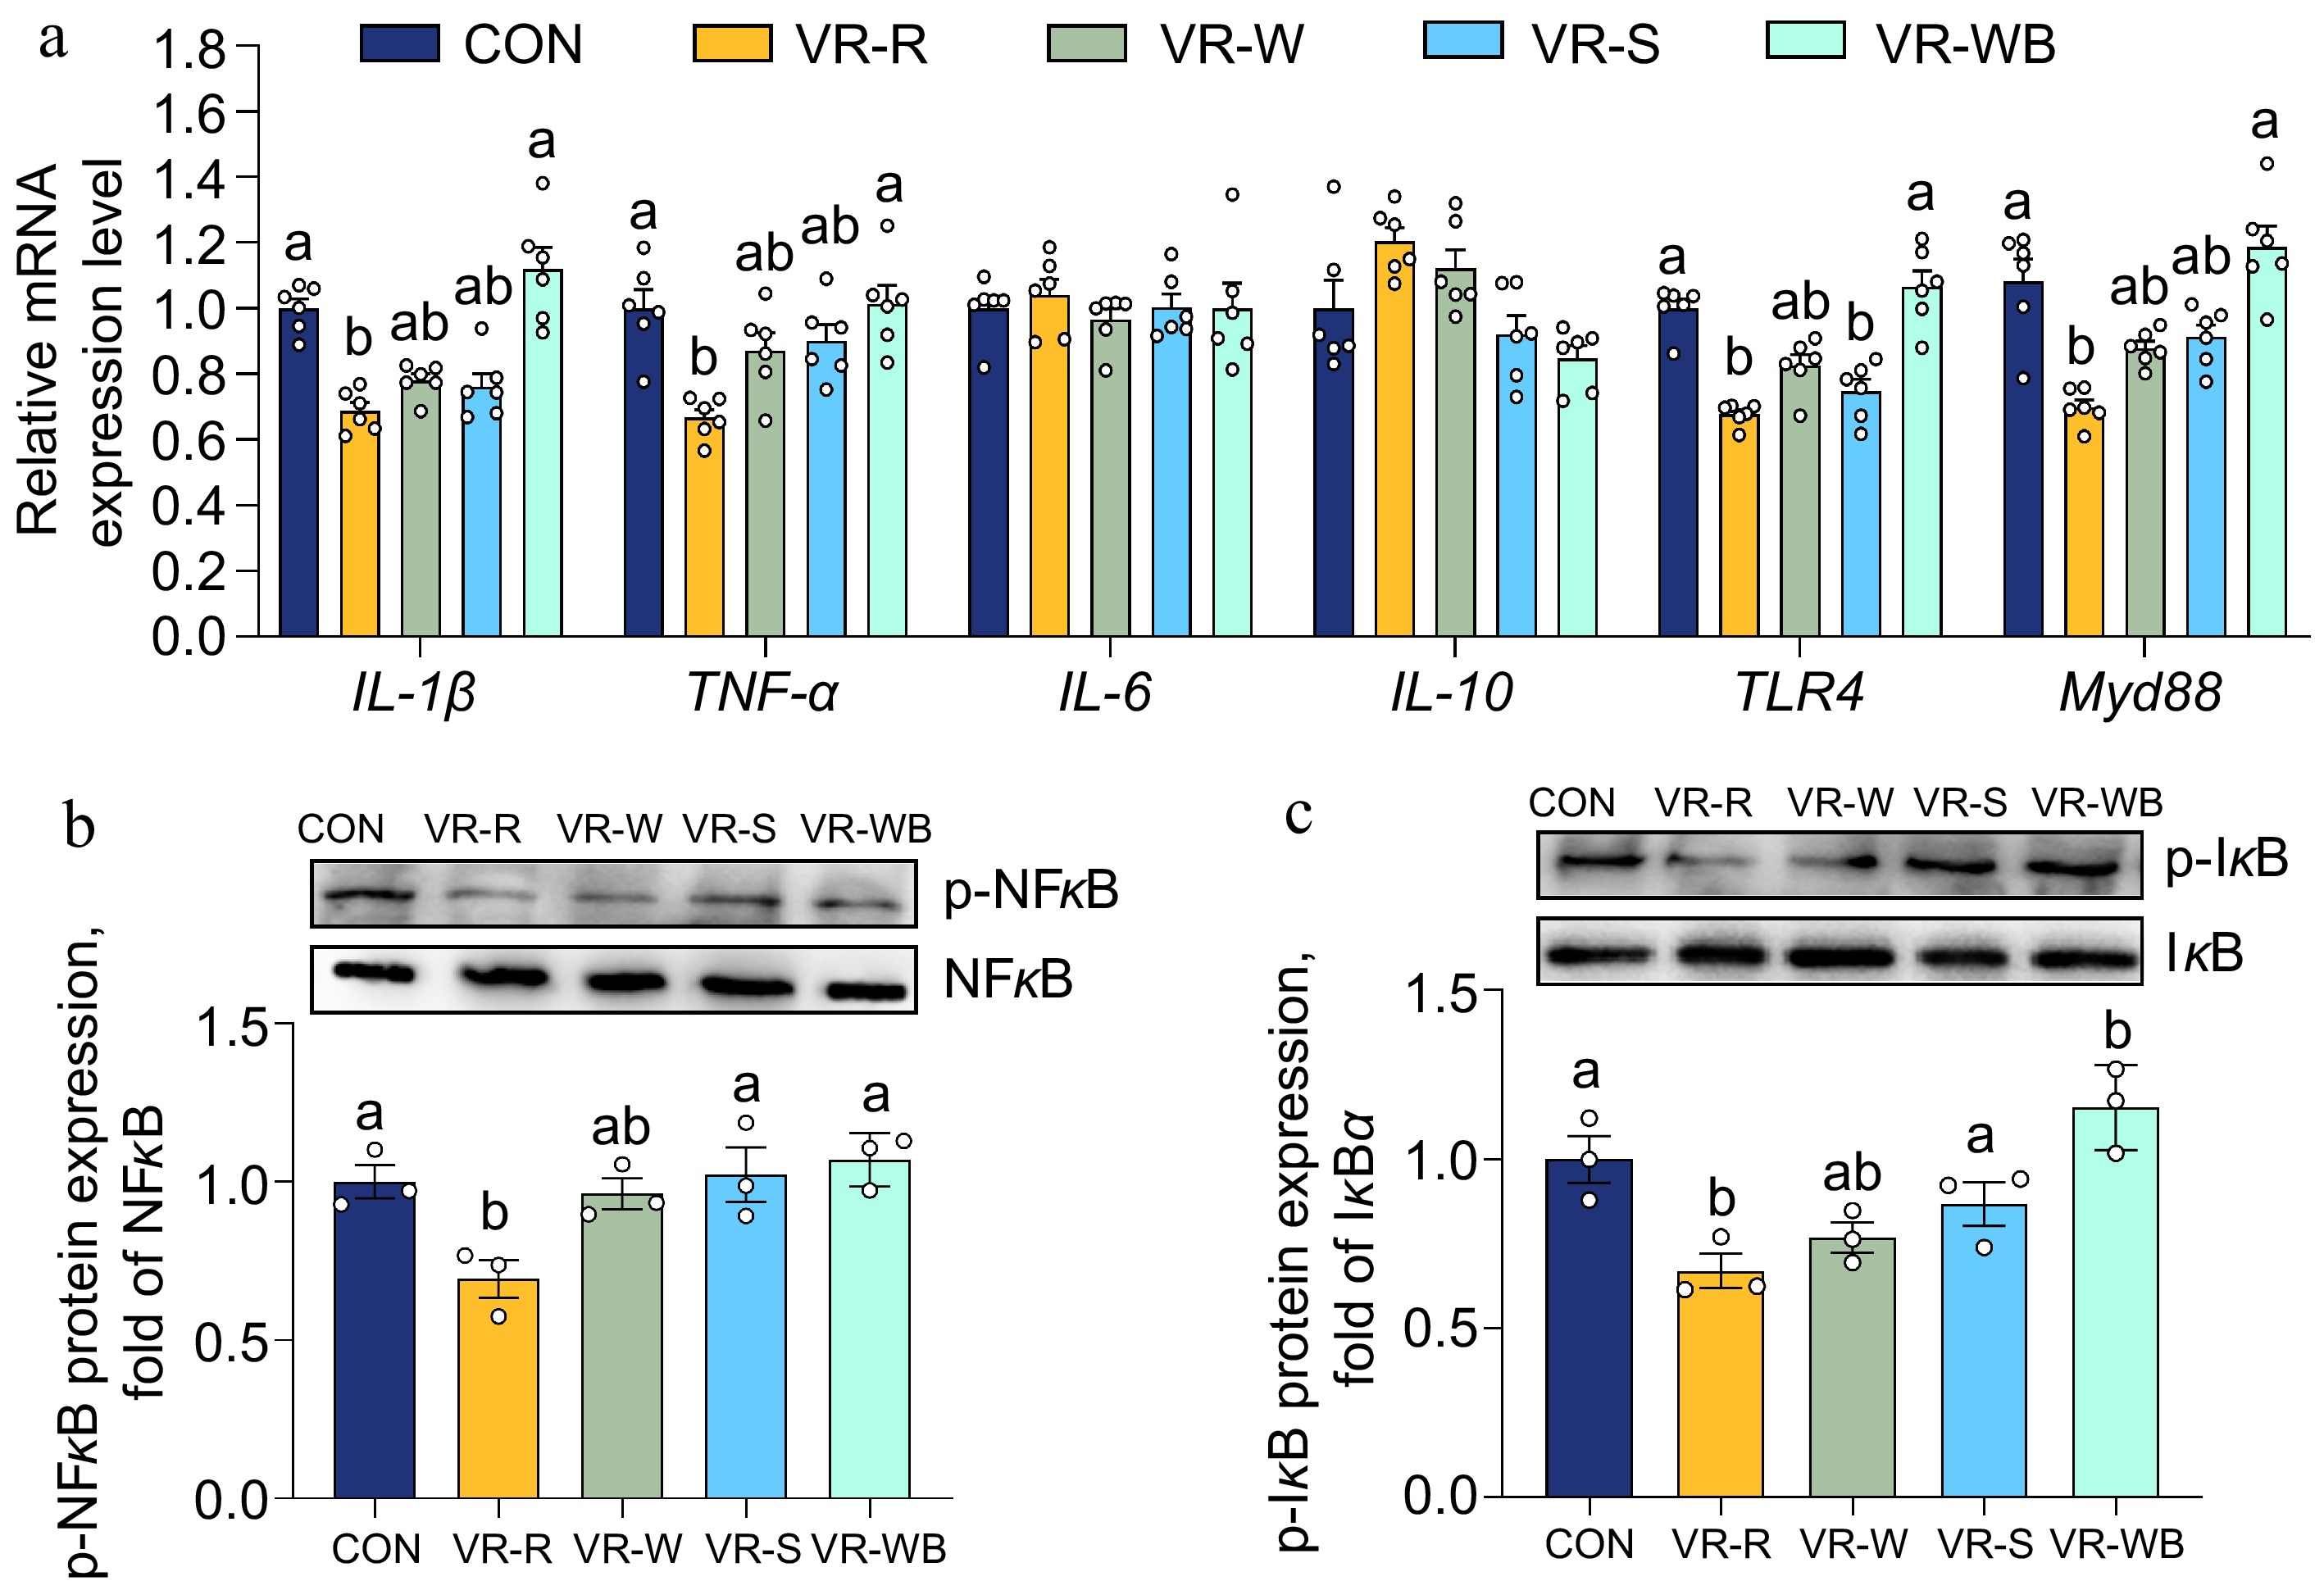
Figure 3.
Effects of VR on the intestinal inflammatory response related to NF-κB pathways. (a) Relative mRNA expressions of IL-1β, TNF-α, IL-6, IL-10, TLR4, and Myd88 normalized to β-actin expression. (b), (c) Western blot analysis of p-NFκB and p-IκB protein levels normalized to NFκB or IκB. Values are means ± SEMs, n = 3 or 6. Labelled means without a common letter are significantly different from each other, p < 0.05.
-
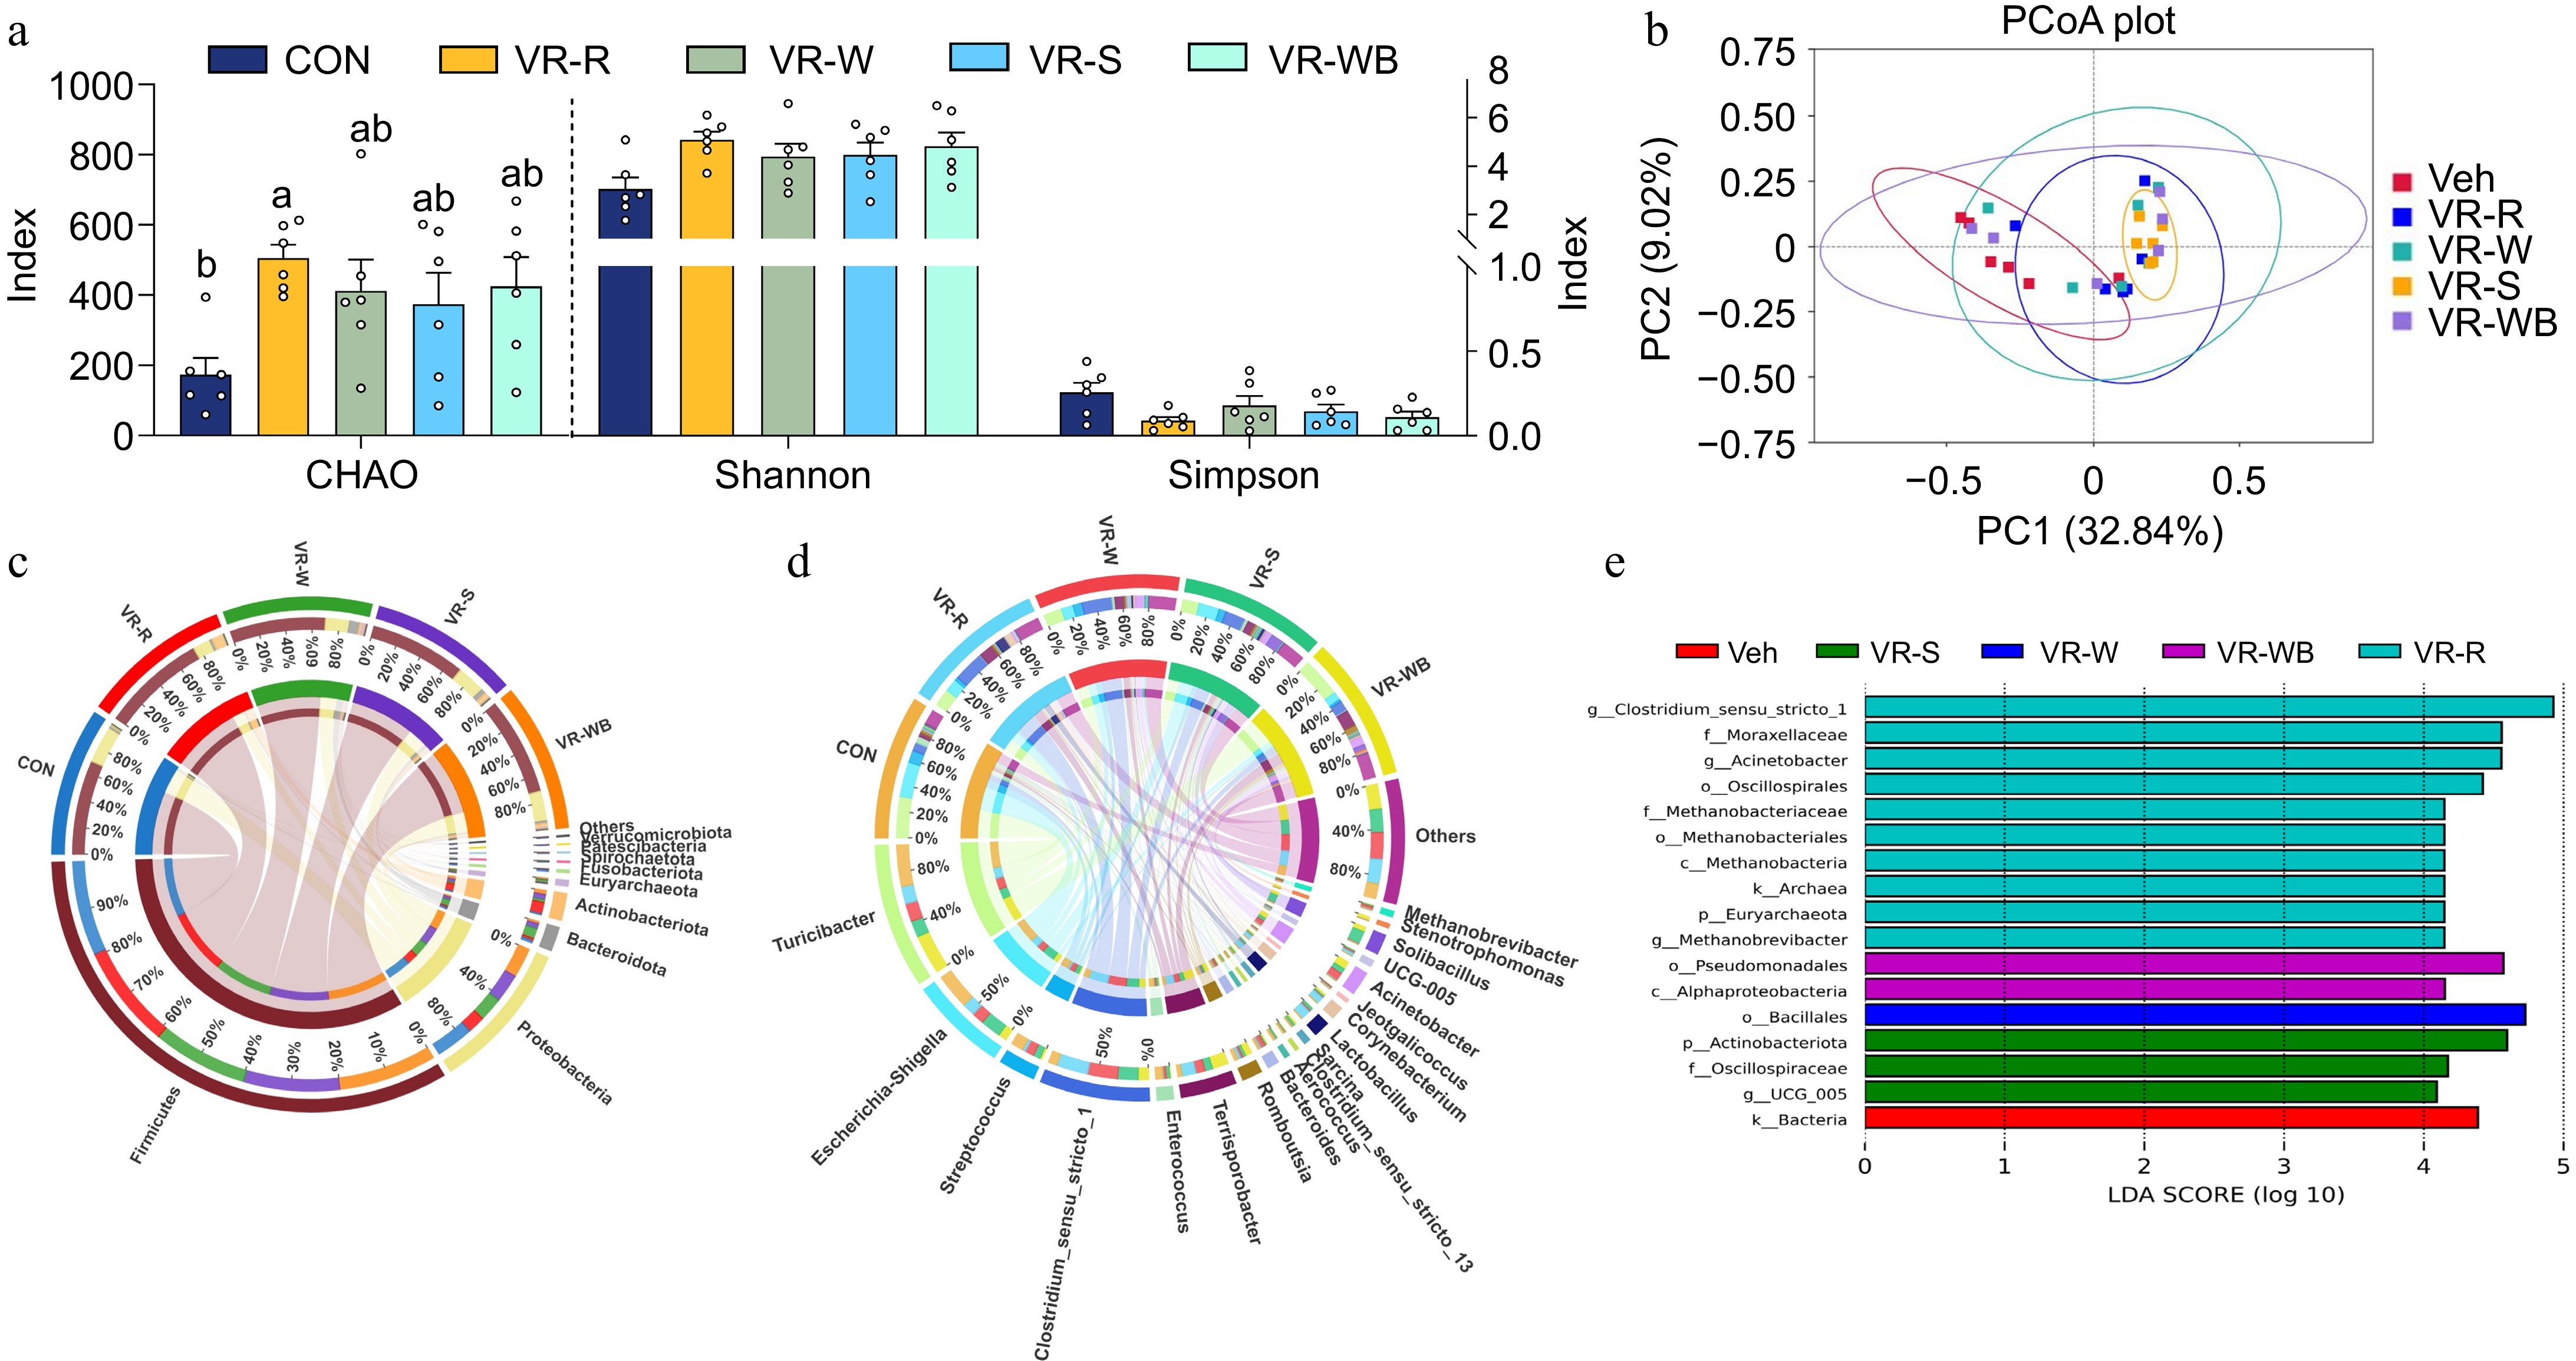
Figure 4.
Effects of VR on the intestinal bacterial composition and diversity. (a) The diversity of CHAO, Shannon Simpson. (b) PCoA analysis. (c), (d) The community structure of each group was analyzed at the phylum level and genus level. (e) Distribution histogram of different bacteria based on LDA score. Values are means ± SEMs, n = 6. Labeled means without a common letter are significantly different from each other, p < 0.05.
-
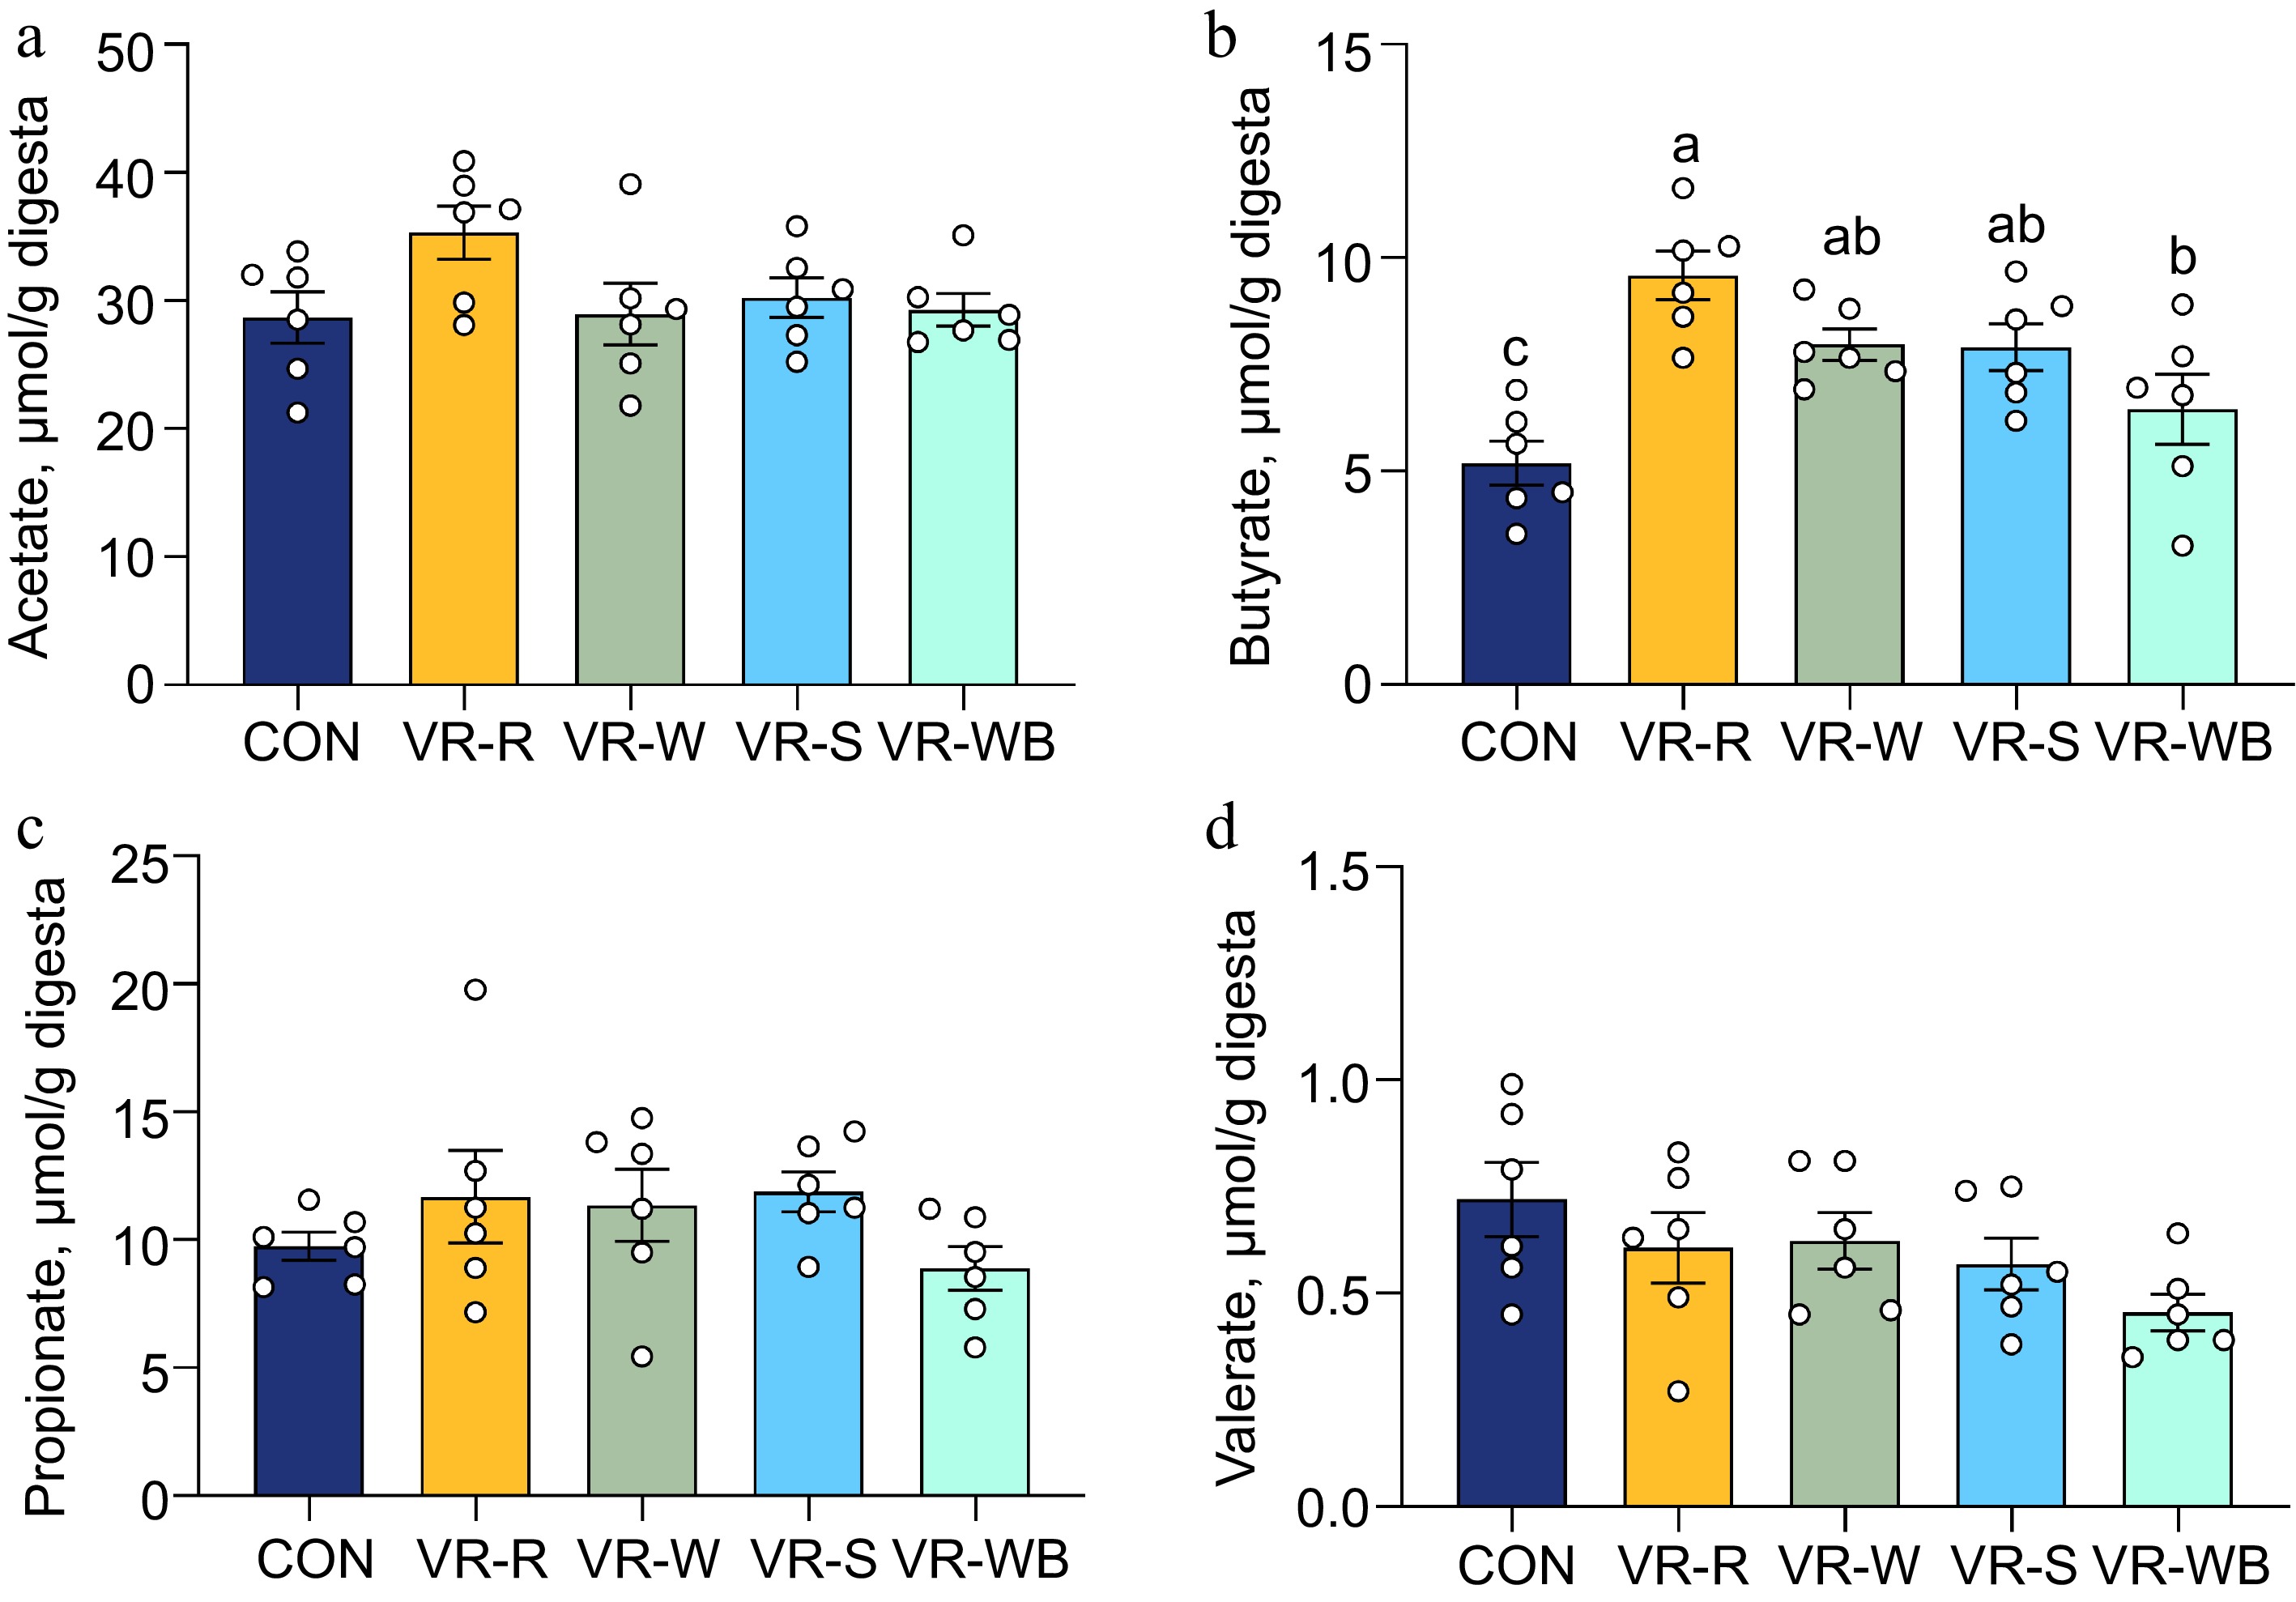
Figure 5.
Effects of VR on the intestinal bacterial composition and diversity. (a)−(d) concentrations of acetate, butyrate, propionate, and valerate. Values are means ± SEMs, n = 6. Labeled means without a common letter are significantly different from each other, p < 0.05.
-
Item Rice Wheat Sorghum Wheat bran VR1 VR2 VR3 VR4 VR5 VR6 VR7 VR8 VR9 VR10 Gross Energy (GE, MJ/kg) 18.59 17.92 18.98 17.74 18.64 18.69 17.58 17.36 20.70 15.03 Dry Matter (DM, %) 92.39 90.22 92.04 90.08 92.31 92.72 90.78 90.90 90.03 90.27 Crude Protein (CP, %) 13.6 10.42 11.68 10.35 13.69 14.52 15.63 10.44 11.76 4.10 Crude Fat (EE, %) 5.10 6.25 5.08 7.18 7.96 9.42 11.77 5.79 12.90 3.16 Total Mineral Content (Ash, %) 5.38 2.23 8.59 1.56 1.89 7.35 2.43 4.23 9.21 10.00 Neutral Detergent Fiber (NDF, %) 65.73 48.72 59.18 59.13 40.42 58.75 42.23 58.39 57.50 63.19 Acid Detergent Fiber (ADF, %) 56.03 27.83 34.20 27.99 16.86 40.67 20.63 32.40 28.81 43.24 Crude Fiber (CF, %) 30.60 23.76 25.01 26.29 13.40 30.29 11.03 25.53 18.86 30.29 Total Dietary Fiber (TDF, %) 66.40 51.10 60.20 63.10 41.90 60.60 45.90 61.80 59.40 63.80 Soluble Dietary Fiber (SDF, %) 0.80 3.10 3.80 6.30 1.90 0.80 4.70 4.60 5.40 0.50 Insoluble Dietary Fiber (IDF, %) 65.60 48.00 56.40 56.80 40.00 59.80 41.20 57.20 54.00 63.30 Amino Acid, % Asp 0.48 0.69 0.74 0.76 0.75 0.60 0.82 0.67 0.79 0.38 Thr 0.36 0.39 0.40 0.36 0.46 0.34 0.43 0.31 0.41 0.21 Ser 0.36 0.42 0.38 0.37 0.43 0.36 0.64 0.32 0.41 0.21 Glu 1.70 1.68 1.41 1.39 1.51 1.95 2.01 1.20 1.47 0.71 Gly 0.35 0.35 0.51 0.50 0.59 0.46 0.54 0.42 0.53 0.27 Ala 0.72 0.77 0.61 0.60 0.60 0.76 0.79 0.51 0.61 0.32 Cys 0.06 0.09 0.15 0.18 0.10 0.19 0.12 0.18 0.15 0.09 Val 0.50 0.52 0.60 0.58 0.62 0.59 0.98 0.52 0.54 0.29 Met 0.12 0.12 0.13 0.11 0.14 0.09 0.16 0.14 0.10 0.03 Ile 0.37 0.39 0.39 0.38 0.41 0.39 0.47 0.31 0.40 0.20 Leu 1.00 1.08 0.73 0.68 0.72 1.00 1.30 0.58 0.81 0.37 Tyr 0.27 0.27 0.31 0.29 0.28 0.32 0.64 0.27 0.32 0.18 Phe 0.32 0.37 0.34 0.31 0.30 0.40 0.24 0.27 0.36 0.17 Lys 0.13 0.24 0.42 0.40 0.39 0.18 0.26 0.32 0.36 0.16 His 0.16 0.21 0.23 0.23 0.27 0.19 0.31 0.17 0.24 0.15 Arg 0.04 0.26 0.50 0.47 0.47 0.16 0.28 0.40 0.41 0.13 Pro 0.48 0.54 0.36 0.34 0.37 0.69 0.51 0.30 0.49 0.30 Mineral Ca, % 0.20 0.17 0.01 0.01 0.01 0.01 0.01 0.03 0.01 0.01 P, % 0.05 0.04 0.09 0.08 0.08 0.06 0.04 0.08 0.06 0.02 Phytate Phosphorus, % 0.40 0.32 0.24 0.08 0.08 0.30 0.38 0.45 0.30 0.24 Na, % 0.11 0.03 0.04 0.09 0.09 0.03 0.07 0.08 0.03 0.04 K, % 0.13 0.06 0.11 0.08 0.08 0.06 0.04 0.09 0.06 0.03 Mg, % 0.03 0.03 0.07 0.03 0.03 0.06 0.03 0.05 0.06 0.02 Cu, mg/kg 8.25 12.56 10.56 17.20 17.20 16.52 16.58 26.81 16.52 11.25 Fe, mg/kg 218 663 663 682 682 465 1002 785 465 358 Zn, mg/kg 15.02 12.65 16.68 18.36 18.36 21.35 21.54 23.54 21.35 19.35 Table 1.
Chemical composition and amino acids of vinegar residue from different sources (as-fed basis).
-
Item Corn Rice Wheat Sorghum Wheat bran SEM p-value VR1 VR2 VR3 VR4 VR5 VR6 VR7 VR8 VR9 VR10 As-fed basis GE intake, MJ/d 20.65a 19.17a 18.28a 18.93a 18.60a 16.81a 19.26a 19.61a 11.69b 17.73a 18.18a 0.390 <0.01 GE in feces, MJ/d 5.13de 6.12bcd 6.93abc 6.71abc 6.61abcd 6.77abc 7.74a 7.42ab 4.11e 5.91bcd 5.82cd 0.151 <0.01 GE in urine, MJ/d 0.61a 0.45ab 0.42ab 0.53a 0.22b 0.62a 0.63a 0.56a 0.40ab 0.37b 0.46ab 0.024 <0.01 ATTD of GE 0.75a 0.68b 0.62cd 0.65bcd 0.64bcd 0.60d 0.60d 0.62cd 0.65bcd 0.67bc 0.68b 0.006 <0.01 DE/(MJ/kg) 14.40a 13.01b 11.93ab 12.37bc 12.35bc 11.40d 11.47d 11.96bcd 12.41bc 12.75bc 13.02b 0.117 <0.01 ME/(MJ/kg) 13.79a 12.08b 11.07bcd 11.52bc 11.13bcd 10.06d 10.54cd 11.11bcd 10.40cd 11.63bc 11.60bc 0.140 <0.01 In the same row, values with different small letter superscripts mean significant difference (p < 0.05), while values with the same or no letter superscripts mean no significant difference (p > 0.05). The same applies below. Table 2.
Effective energy values of vinegar residue from different sources.
-
Item Treatment SEM p-value CON VR-R VR-W VR-S VR-WB Initial weight, kg 20.55 20.86 20.61 20.88 20.31 0.22 0.895 Final weight, kg 43.52 43.30 42.39 42.30 42.65 0.51 0.354 ADG, g/d 656 641 622 612 643 13 0.685 ADFI, g/d 1304 1275 1314 1266 1298 25 0.421 F/G 1.99b 1.99b 2.11a 2.06ab 2.02ab 0.03 0.038 Values are means ± SEMs, n = 6. Labeled means without a common letter are significantly different from each other, p < 0.05. Table 3.
Growth performance of growing pigs fed diets based on different sources of VR.
Figures
(5)
Tables
(3)