-
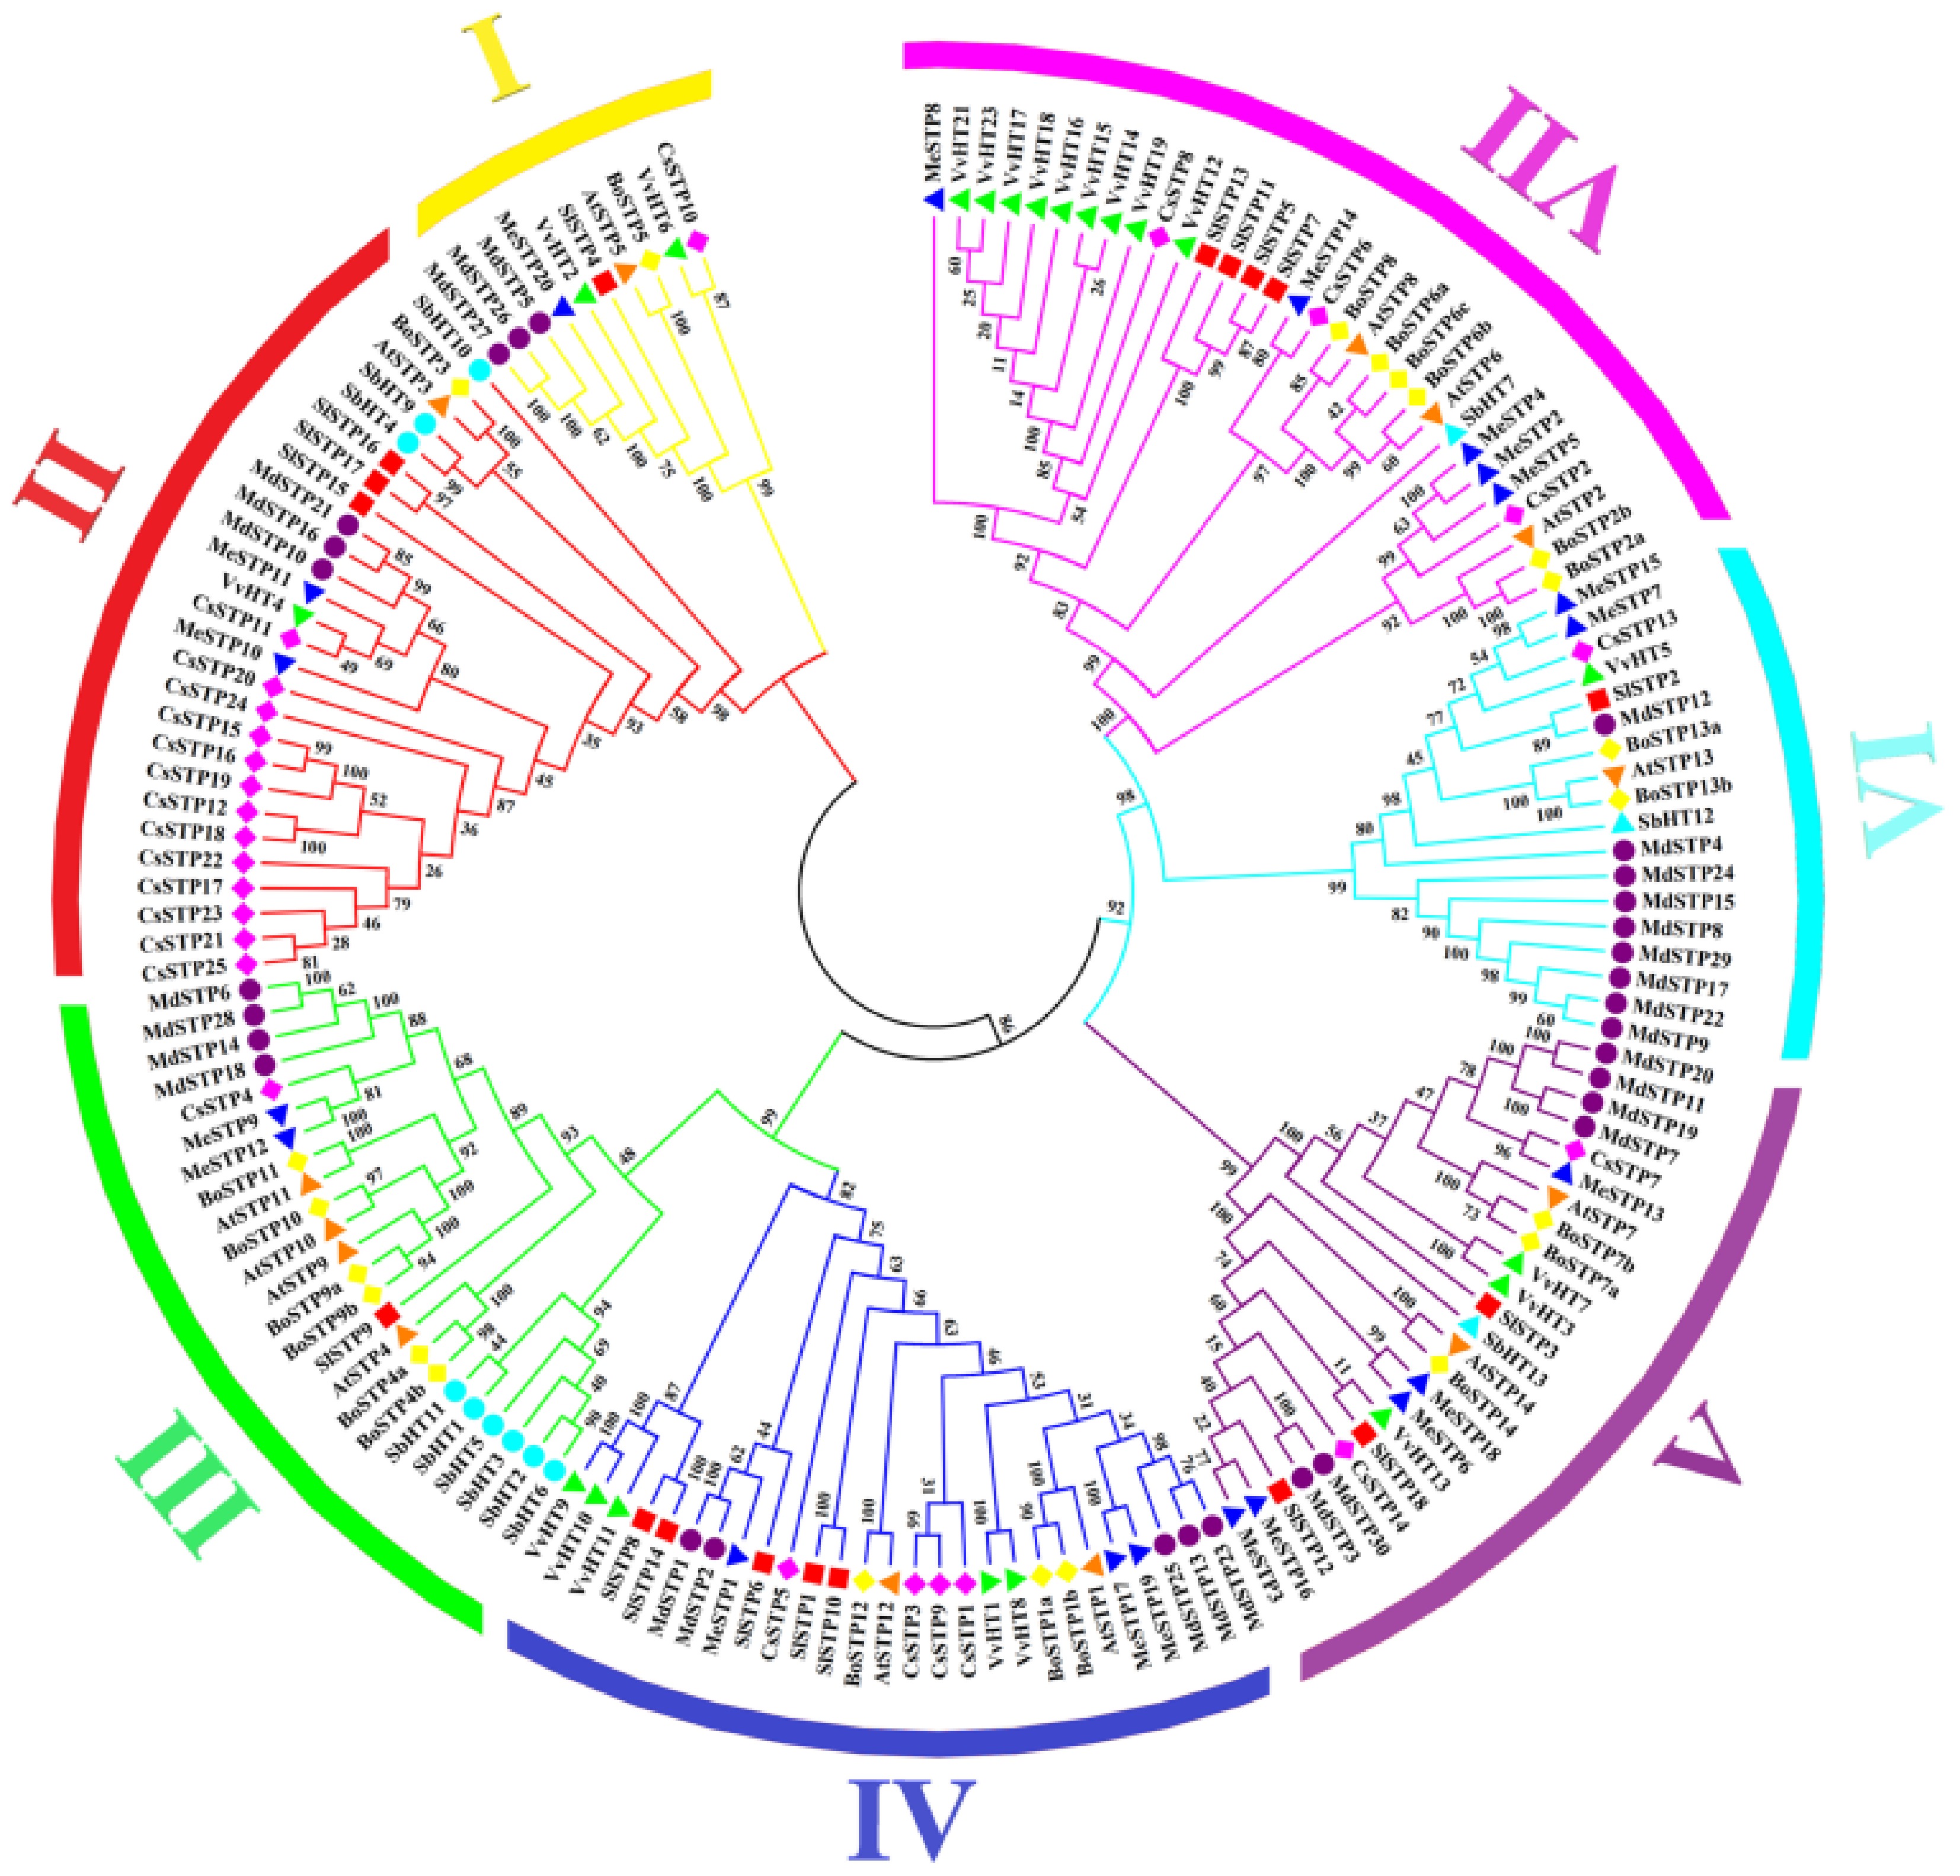
Figure 1.
Phylogenetic tree of STP proteins based on multiple species. The outermost ring of the phylogenetic tree is color-coded to represent different subfamilies, while distinct symbols on the branches denote various species. The numbers above the branches indicate bootstrap values. The abbreviations At, Cs, Sl, Me, Br, Sb, and Vv correspond to Arabidopsis, sweet orange, tomato, cassava, Chinese cabbage, sorghum, and grape, respectively.
-
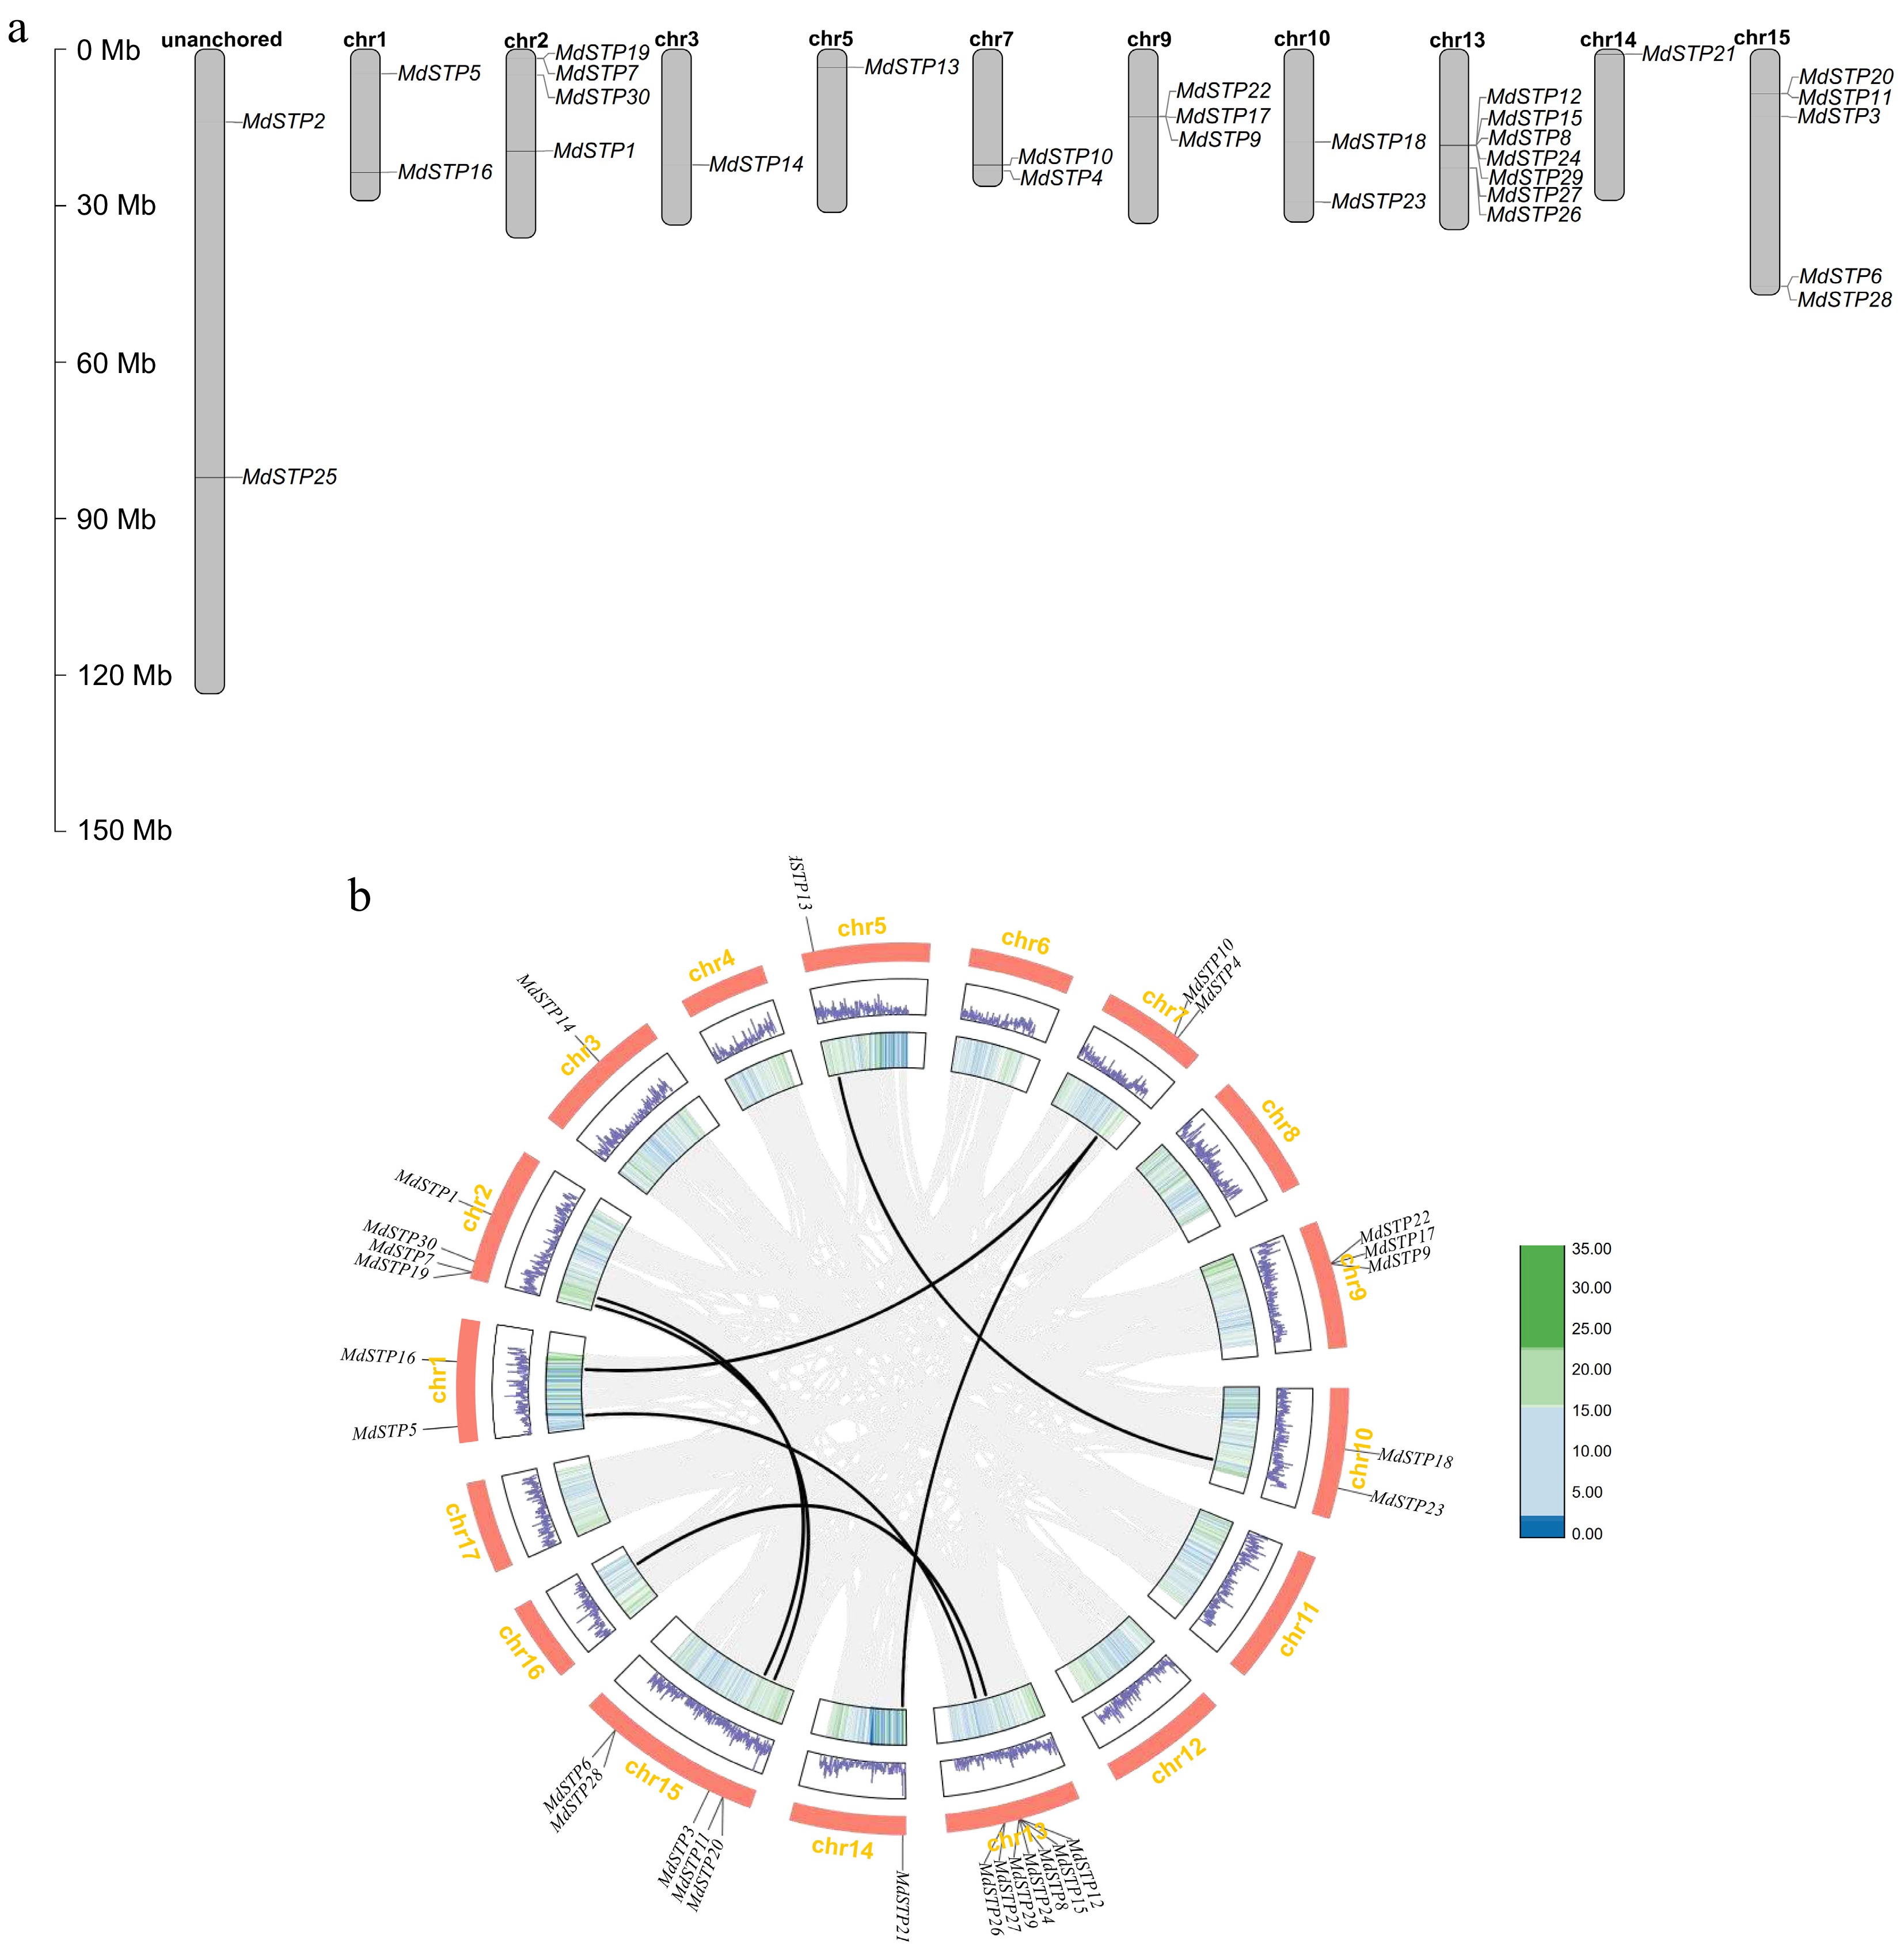
Figure 2.
Chromosomal localization and intra-species synteny of MdSTPs gene family members in apple. (a) Illustrates the chromosomal localization of MdSTPs gene family members in apple. (b) Demonstrates the syntenic relationships within the apple genome. In (a), the positions of individual genes are marked by black lines, with corresponding chromosome numbers displayed at the top of each chromosomal bar. In (b), grey lines represent syntenic blocks within the apple genome, while black lines specifically indicate syntenic gene pairs of MdSTPs. The innermost first and second concentric circles display gene density distributions across corresponding chromosomes, presented as heatmaps and line graphs, respectively.
-
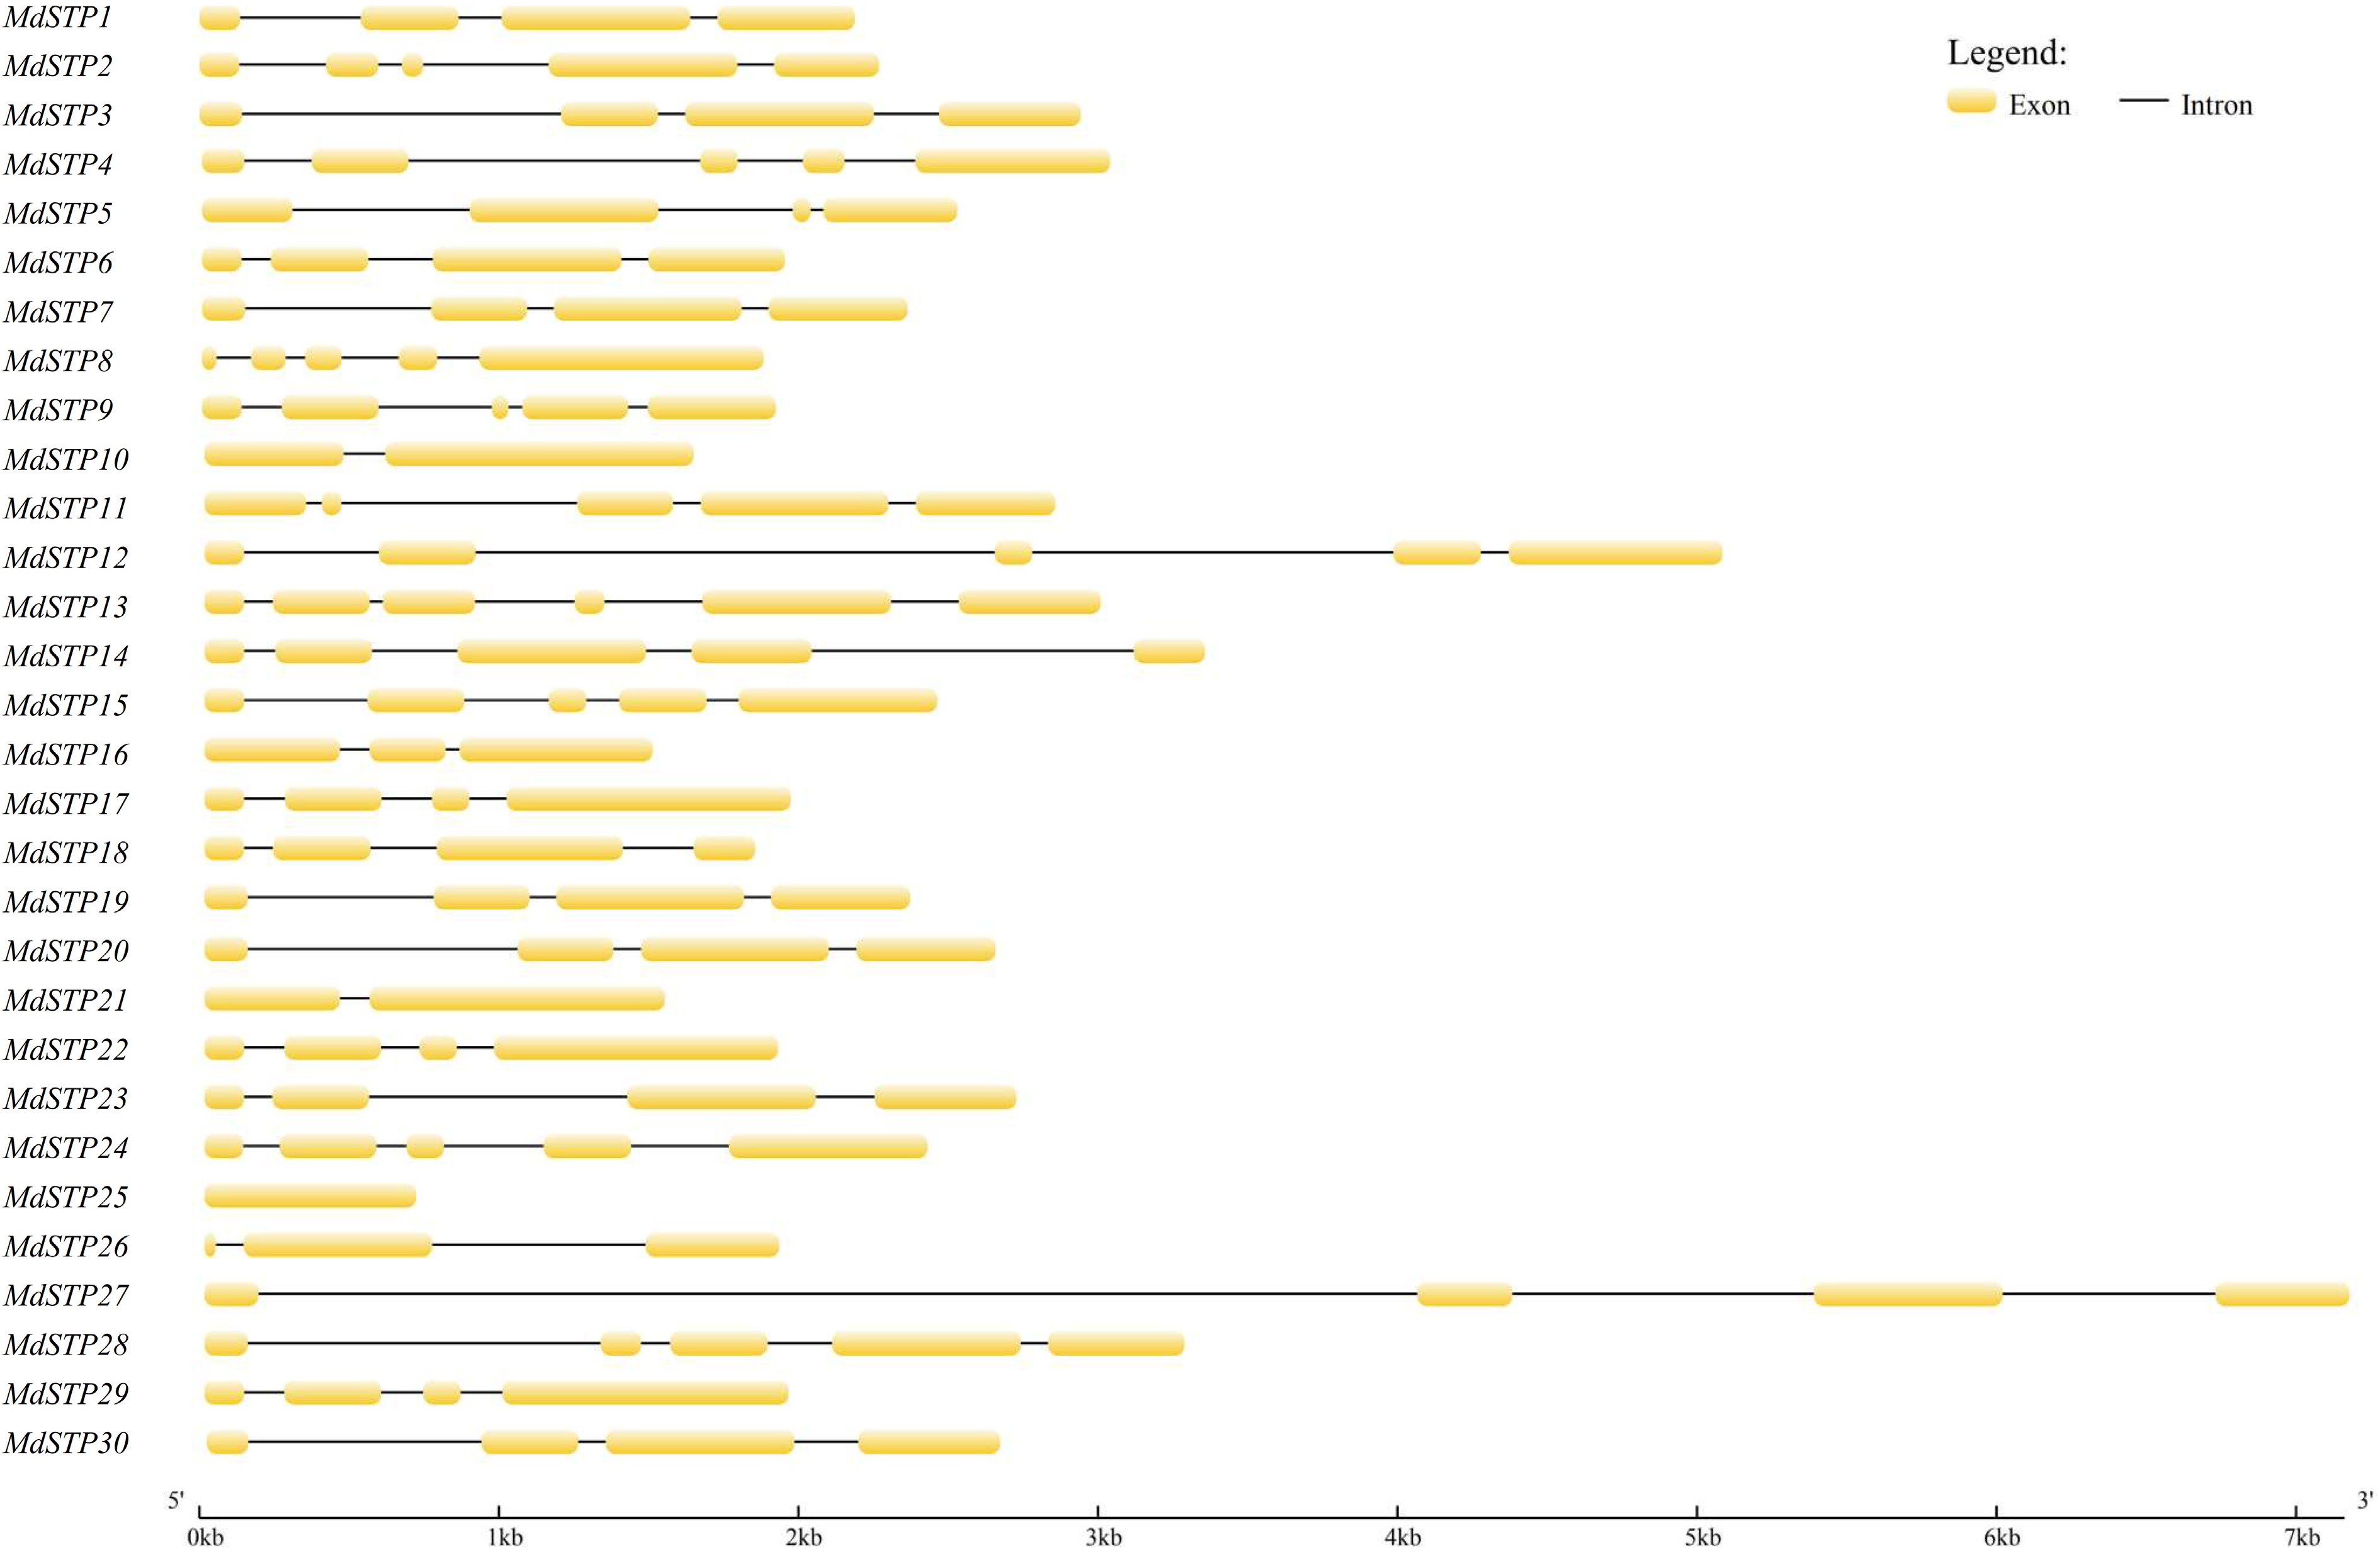
Figure 3.
Gene structure of MdSTPs. Exons are depicted as yellow boxes, while introns are represented by black lines.
-
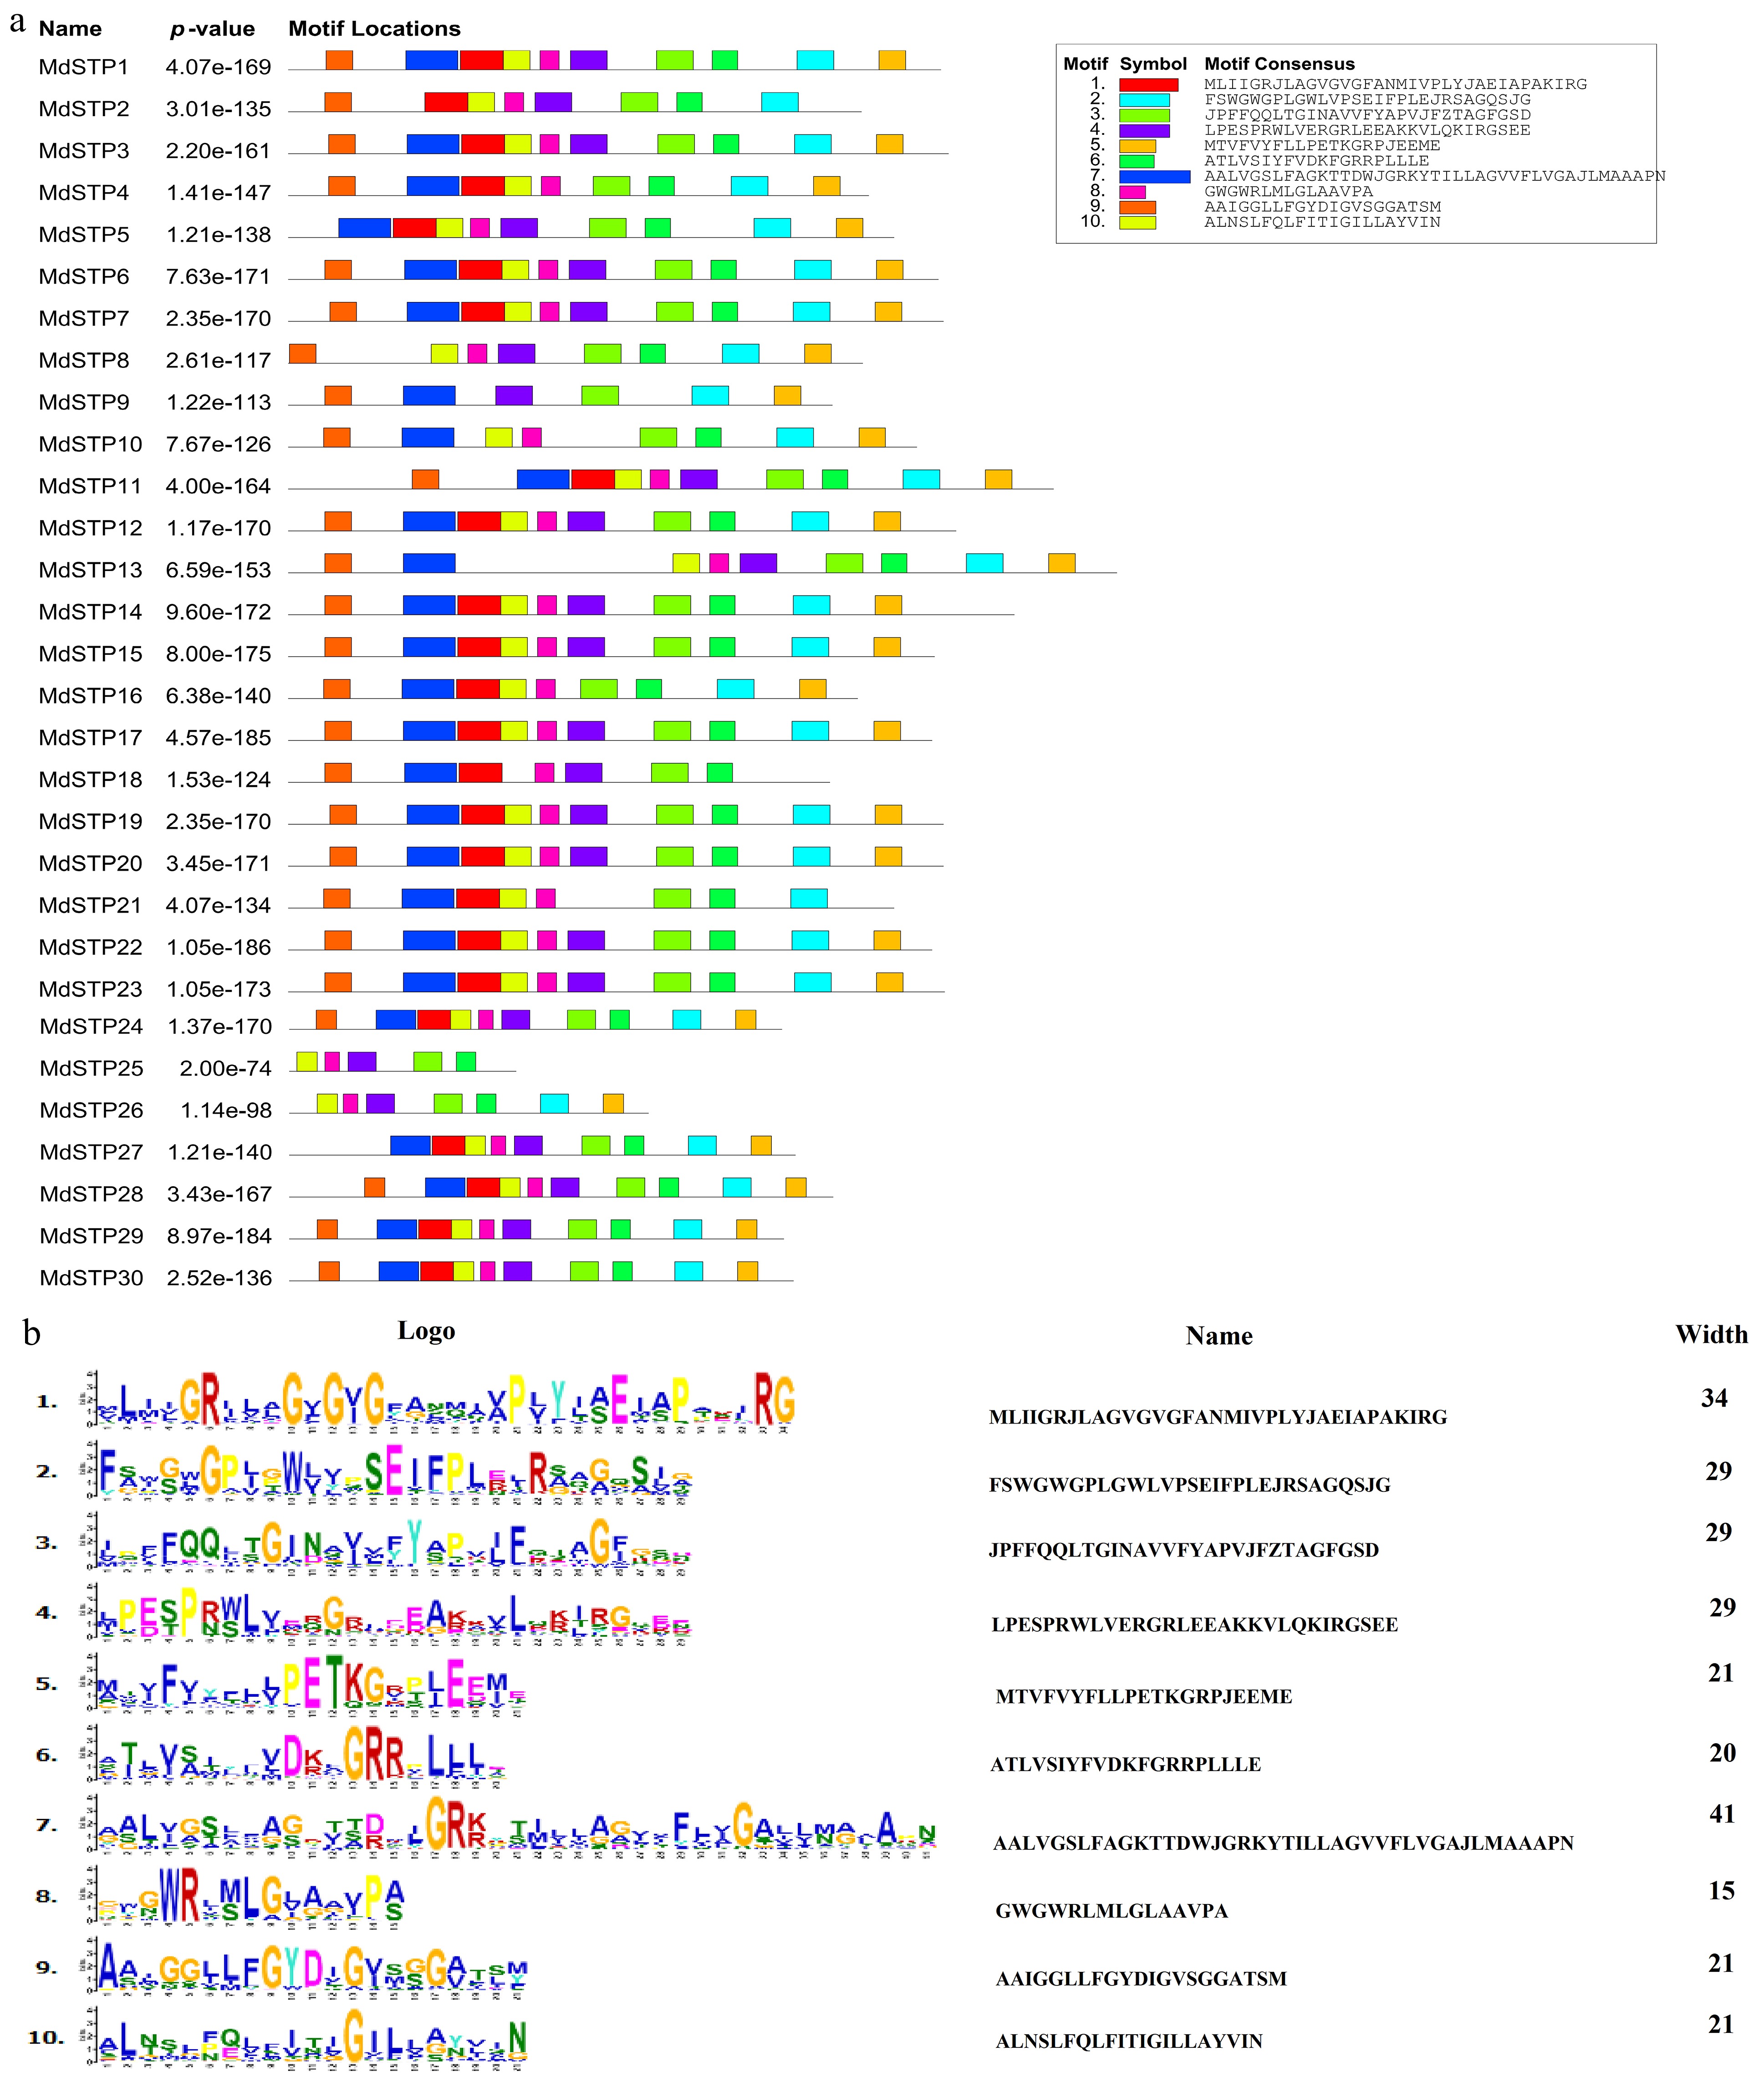
Figure 4.
Analysis of motifs in MdSTPs Proteins. (a) A total of 10 motifs were identified. (b) Sequence characteristics of the motifs. In (a), the 10 putative motifs are sequentially numbered from 1 to 10 and represented by distinct colors.
-
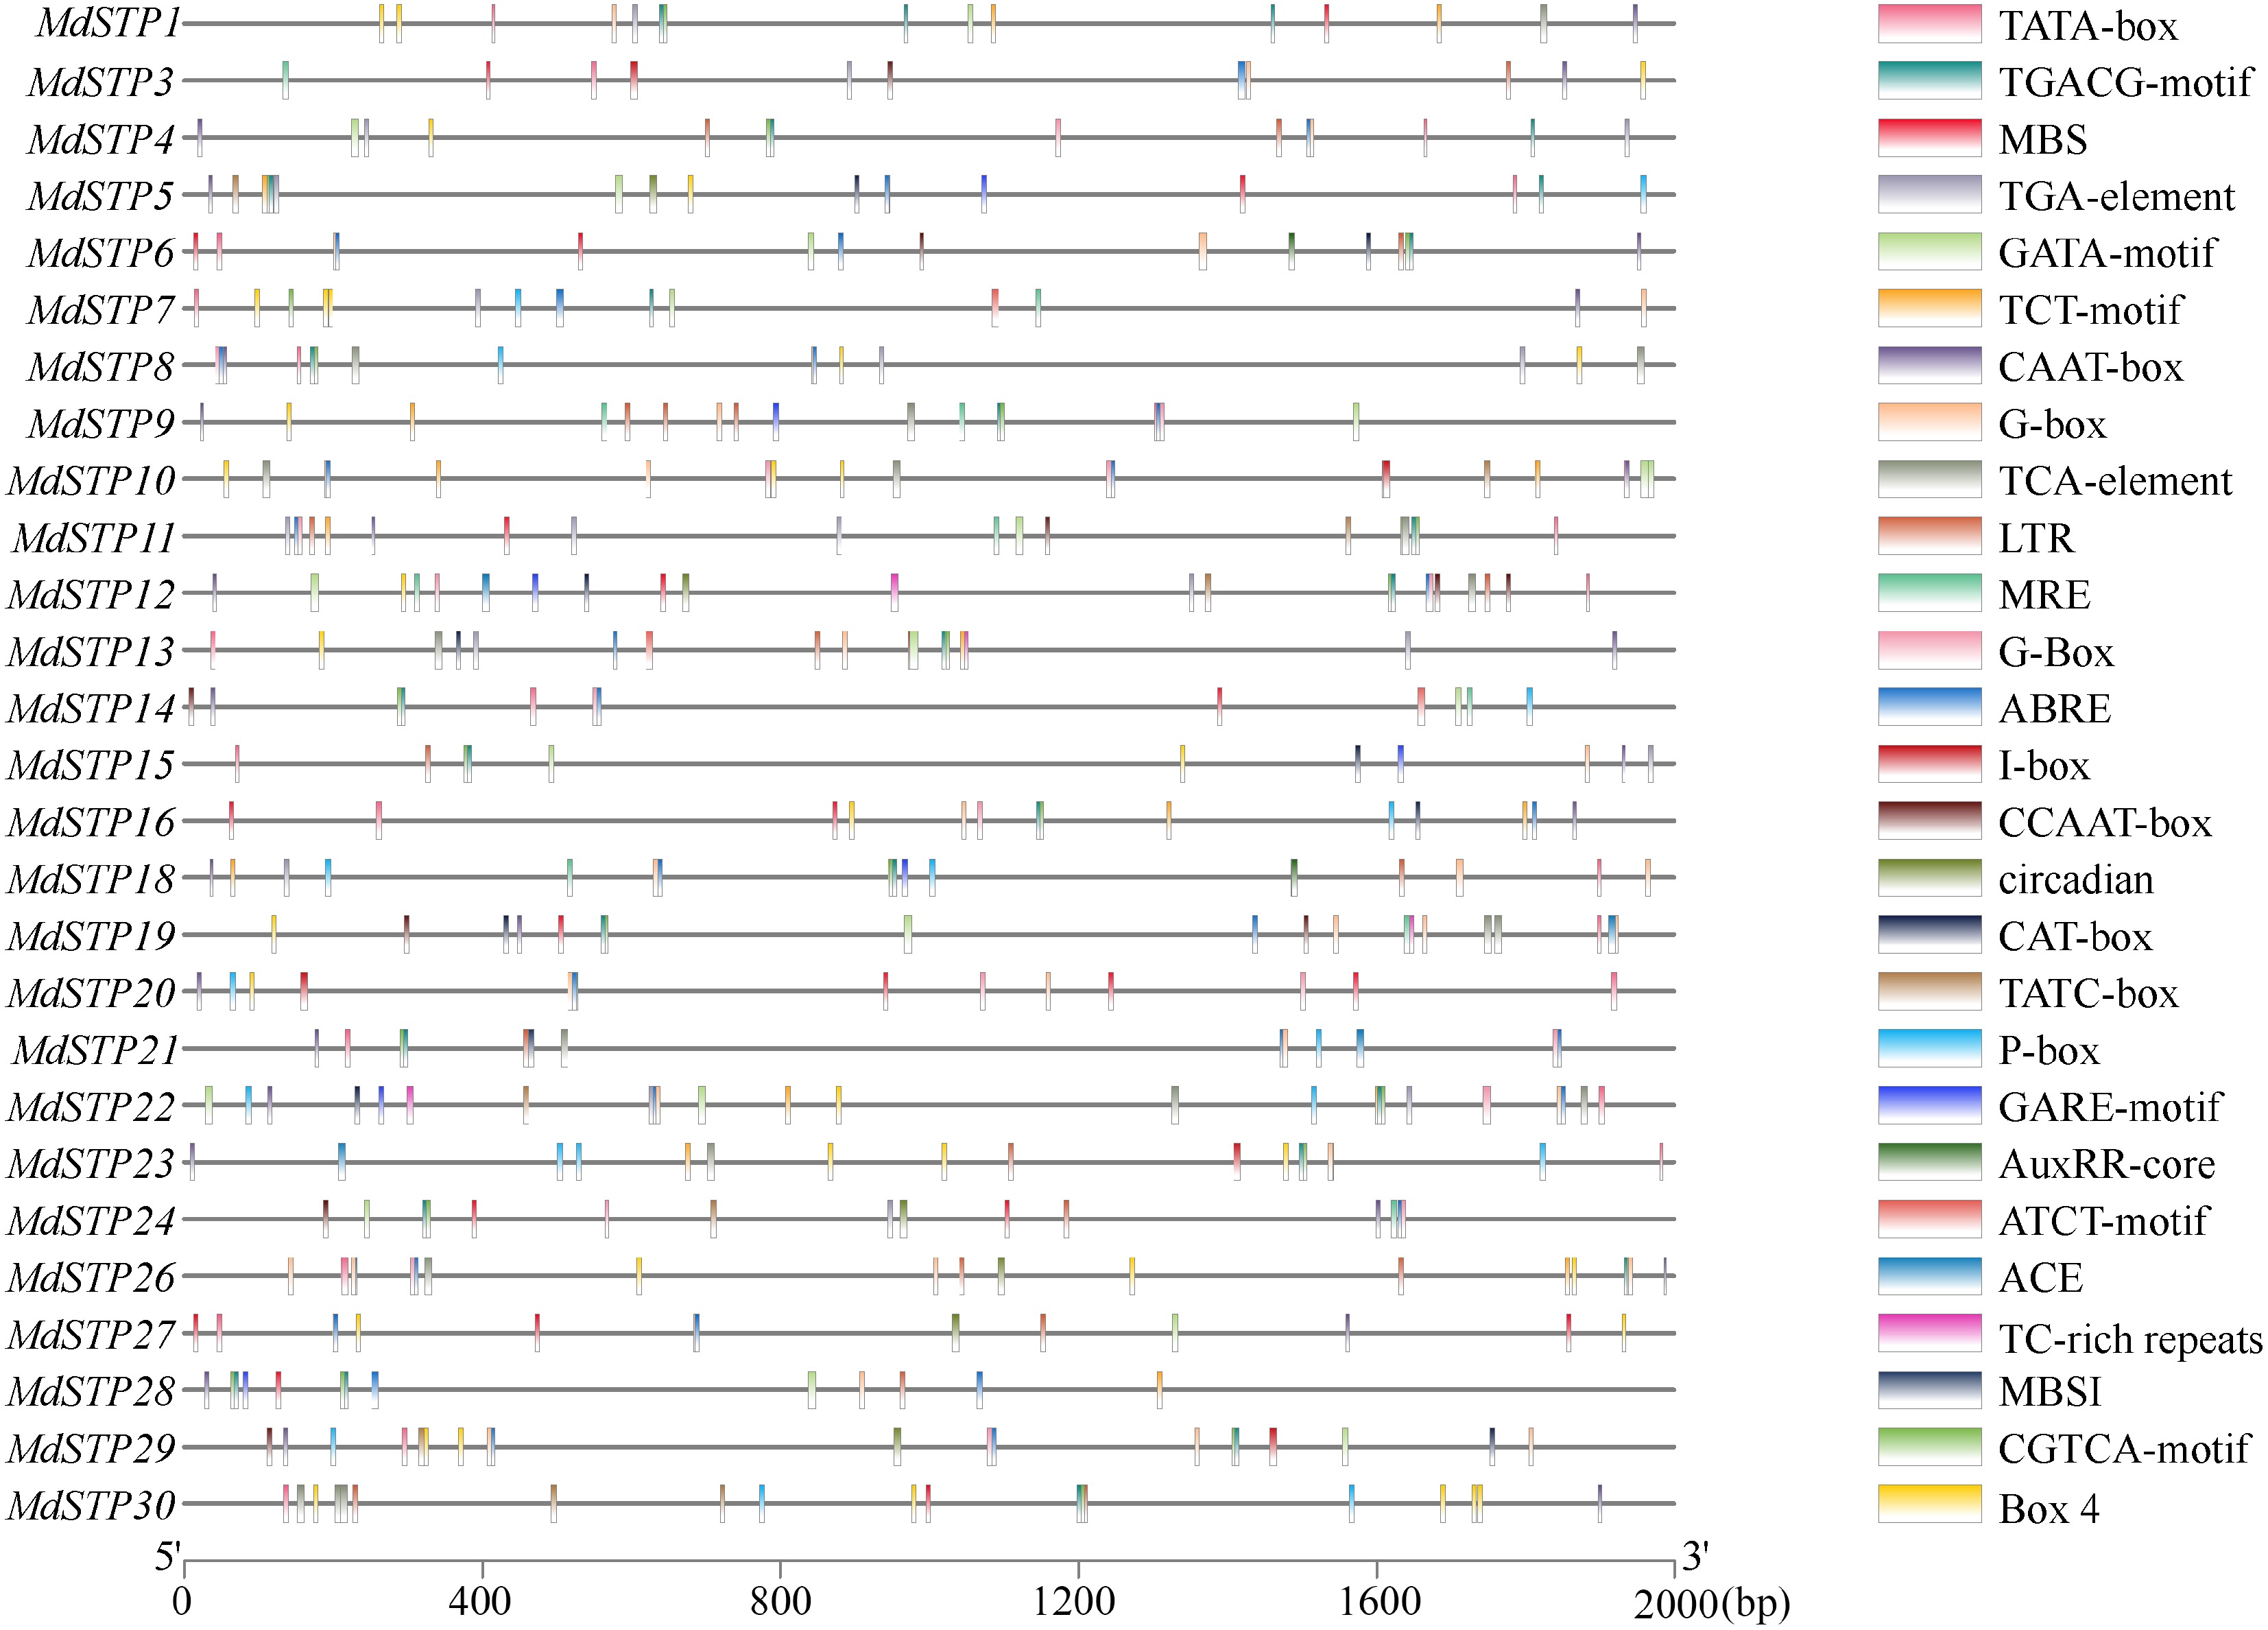
Figure 5.
Cis-acting regulatory elements of MdSTPs genes. A total of 27 cis-acting elements were identified within the promoter regions of the 30 MdSTPs genes, each represented by distinctively colored boxes.
-
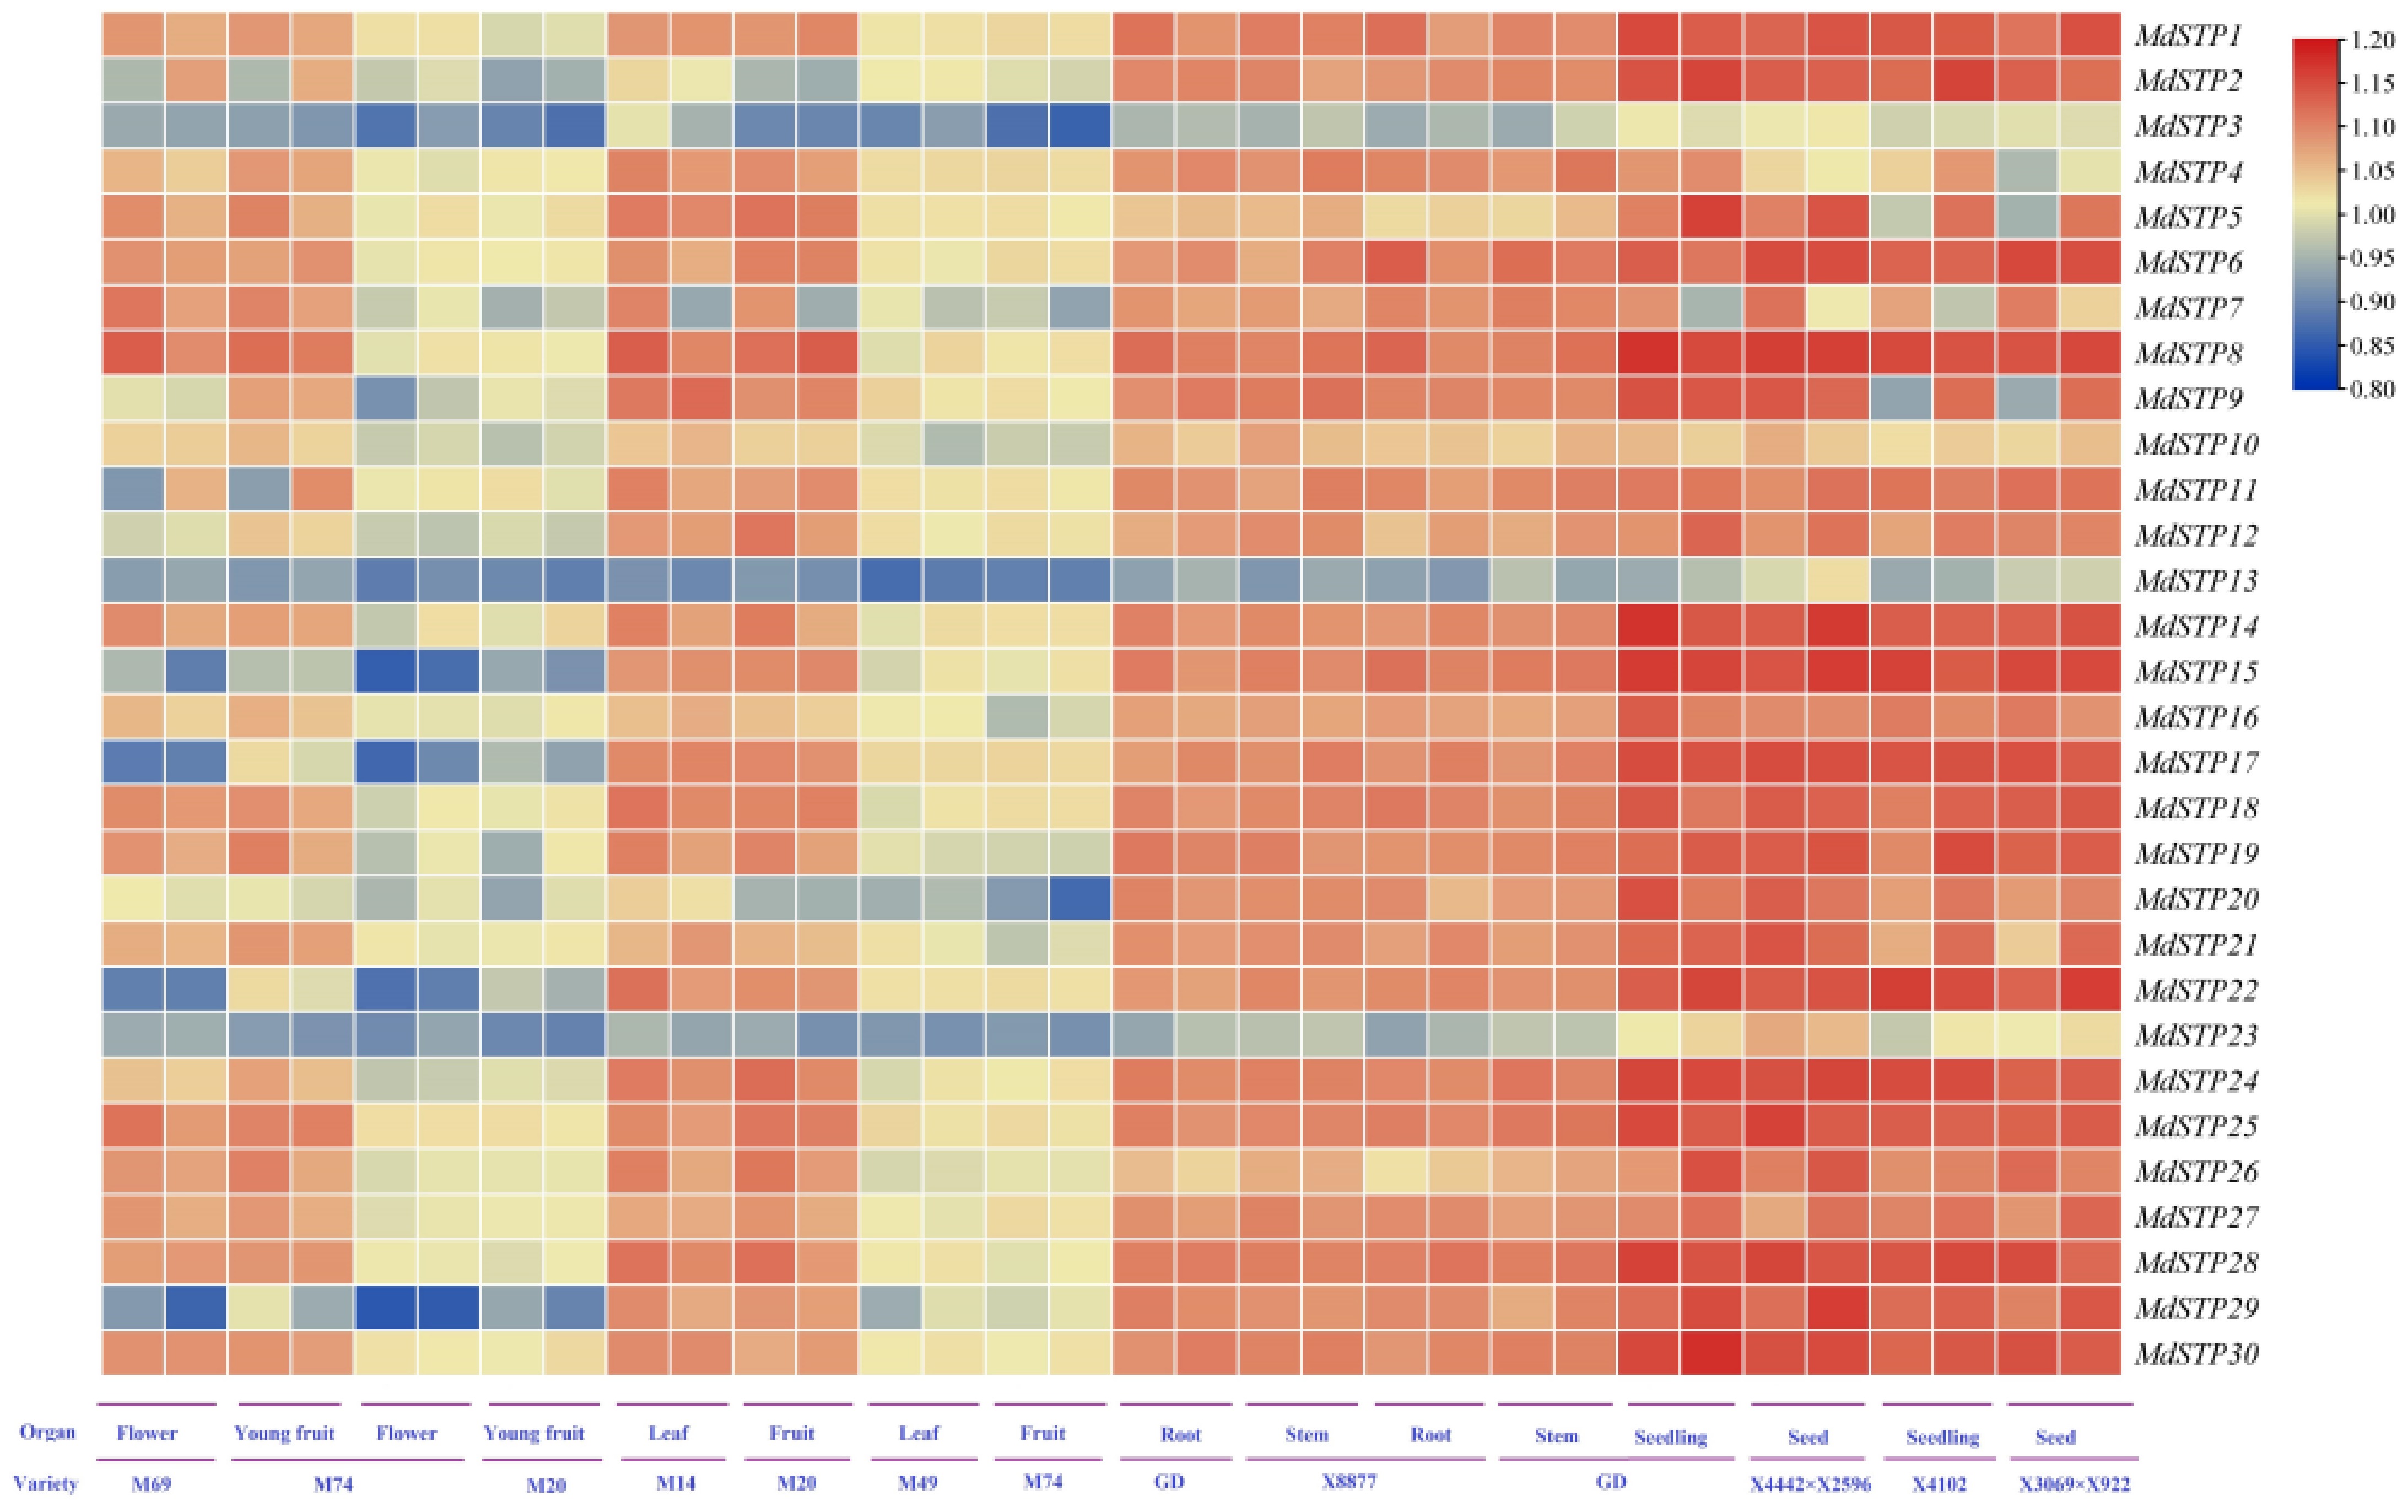
Figure 6.
Expression levels of MdSTPs across various cultivars and tissues. At the bottom of the heatmap, 'Variety' denotes different apple cultivars, while 'Organ' represents various tissue types. The heatmap employs a blue-yellow-red color gradient to indicate gene expression levels, ranging from low to high. The expression levels are comparatively analyzed based on the integrated data from both the horizontal and vertical axes.
-
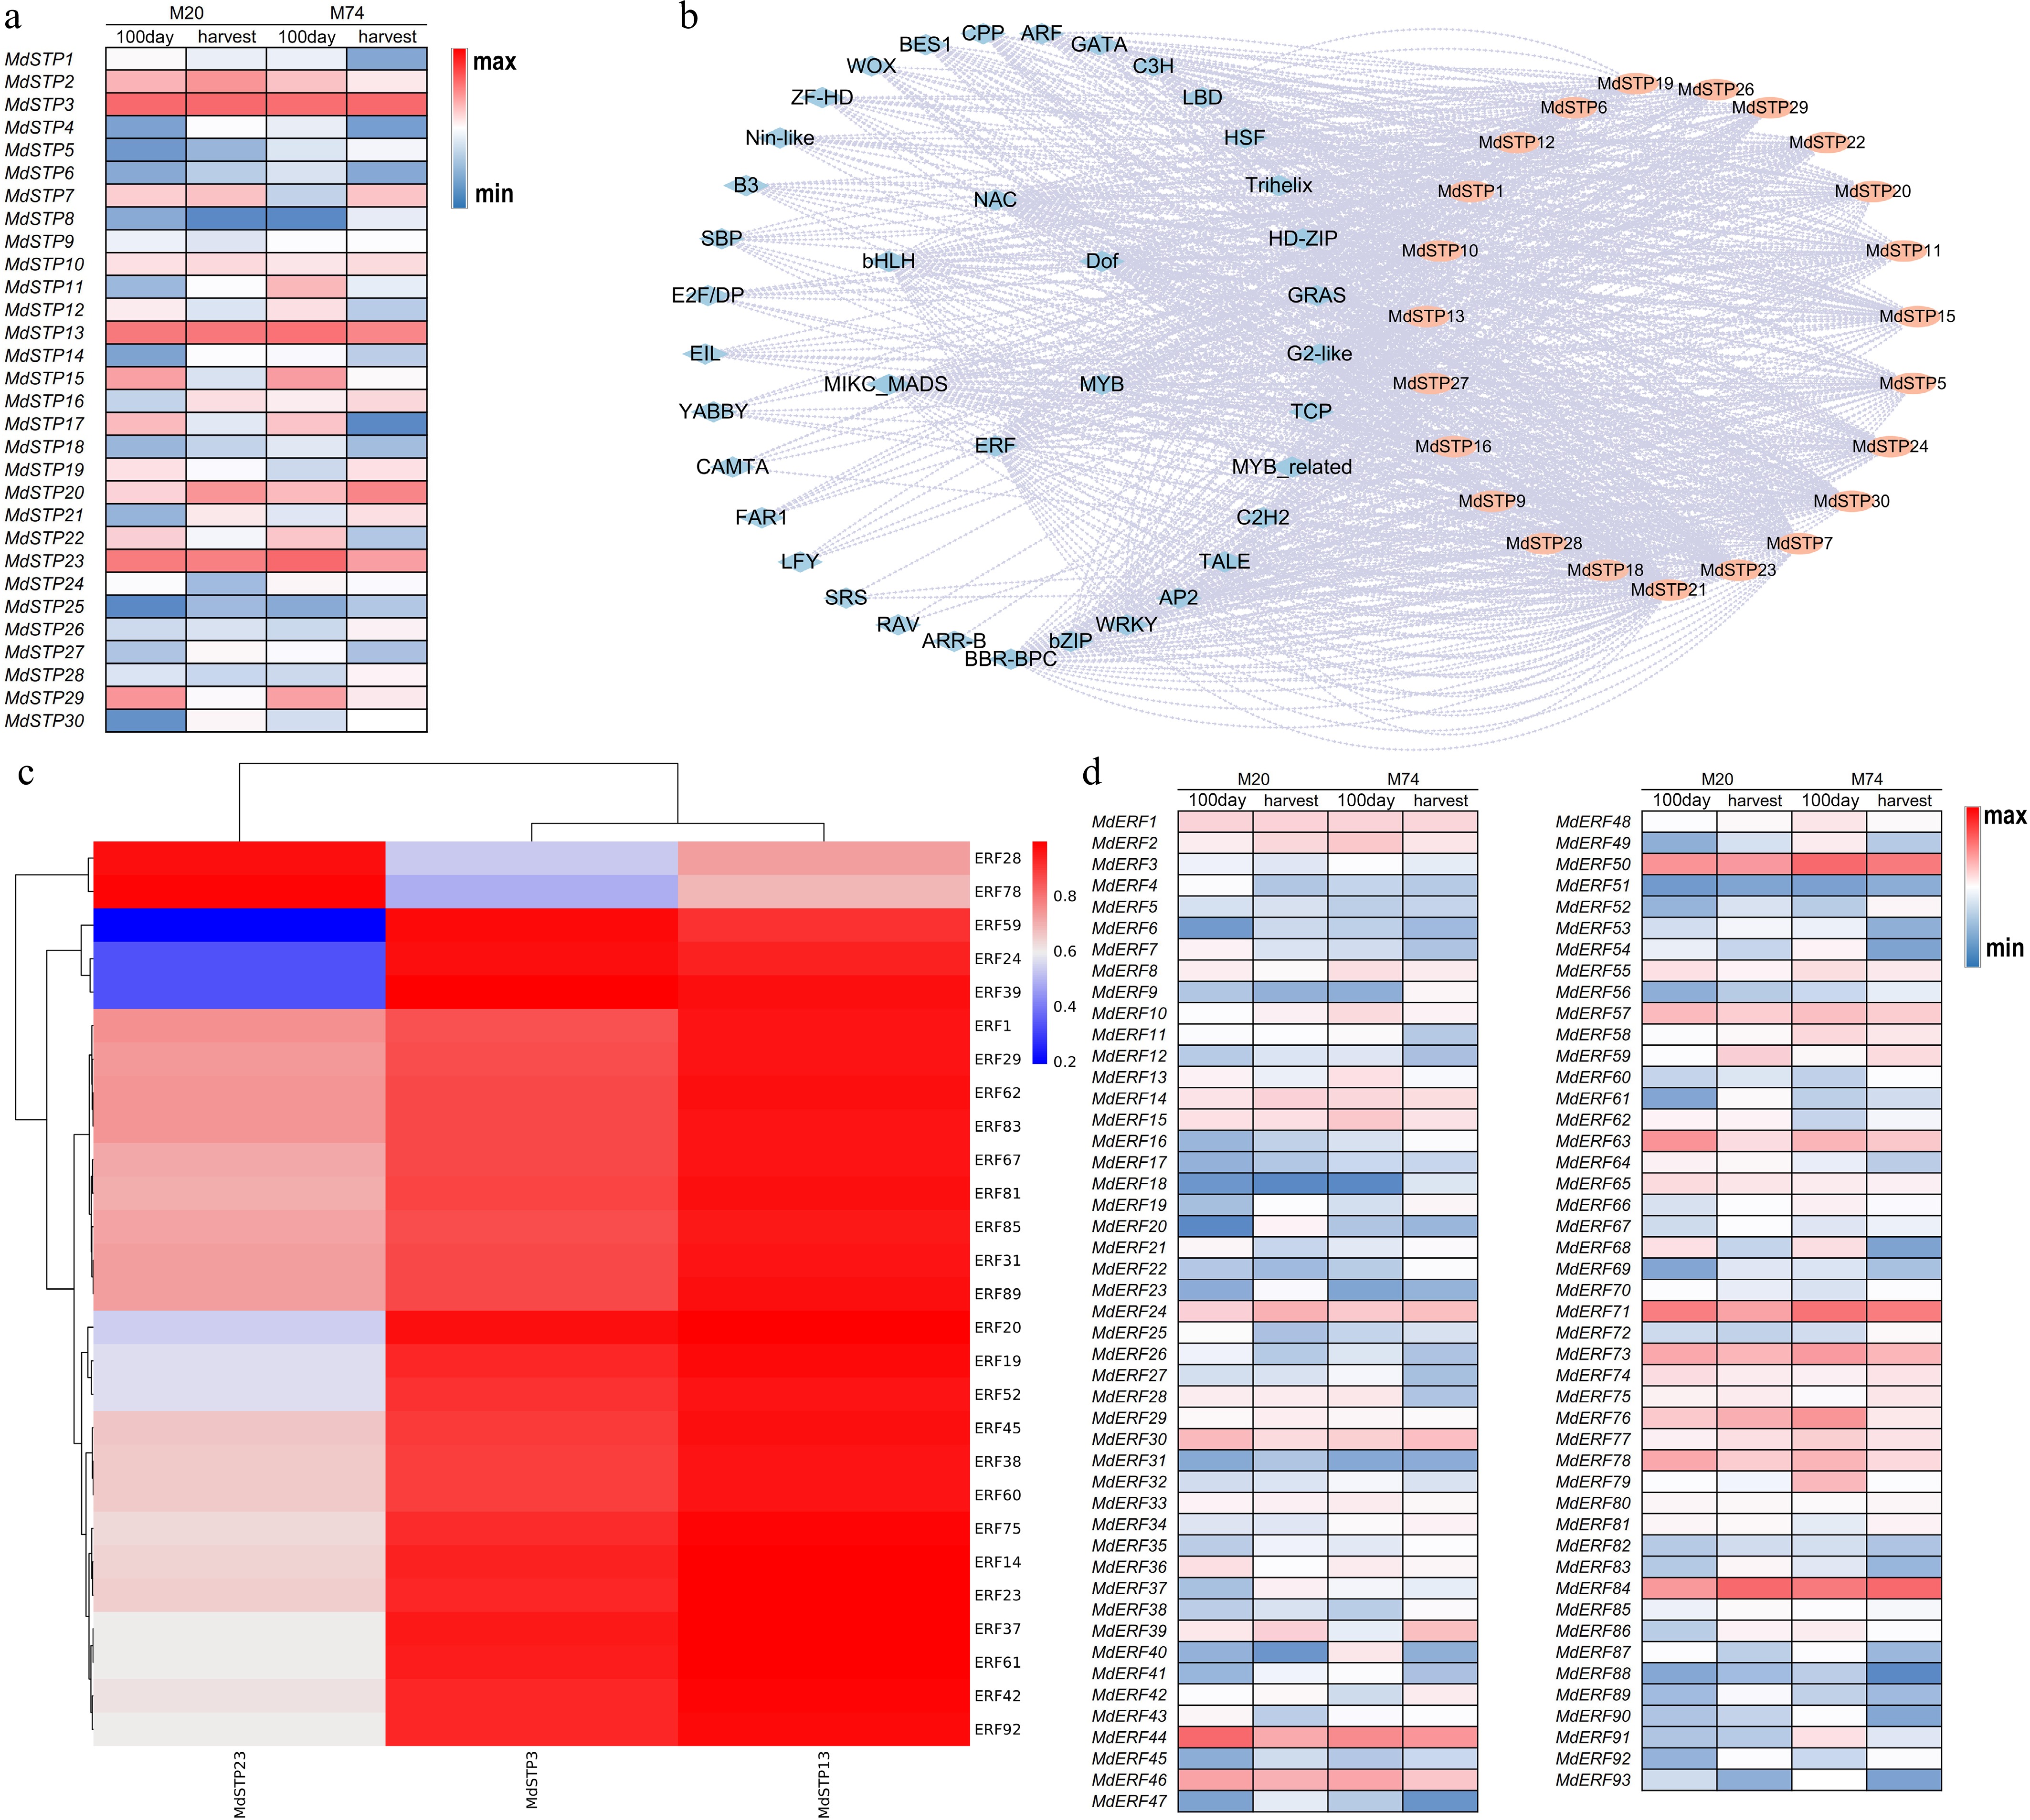
Figure 7.
The expression level of MdSTPs in fruits and its transcriptional regulatory mechanism. (a) Expression levels of MdSTPs in fruits. (b) Transcription factor regulatory network. (c) Correlation between the expression levels of MdERFs and MdSTPs. (d) Expression levels of MdERFs in fruits. In (a) and (d), '100 day' refers to 100 d post-flowering, while 'harvest' indicates the fruit ripening stage. The blue-white-red color gradient represents low-medium-high expression levels, respectively. The expression levels are comparatively analyzed based on the integrated data from both the horizontal and vertical axes. In (b), blue denotes transcription factors, while orange represents MdSTPs.
-
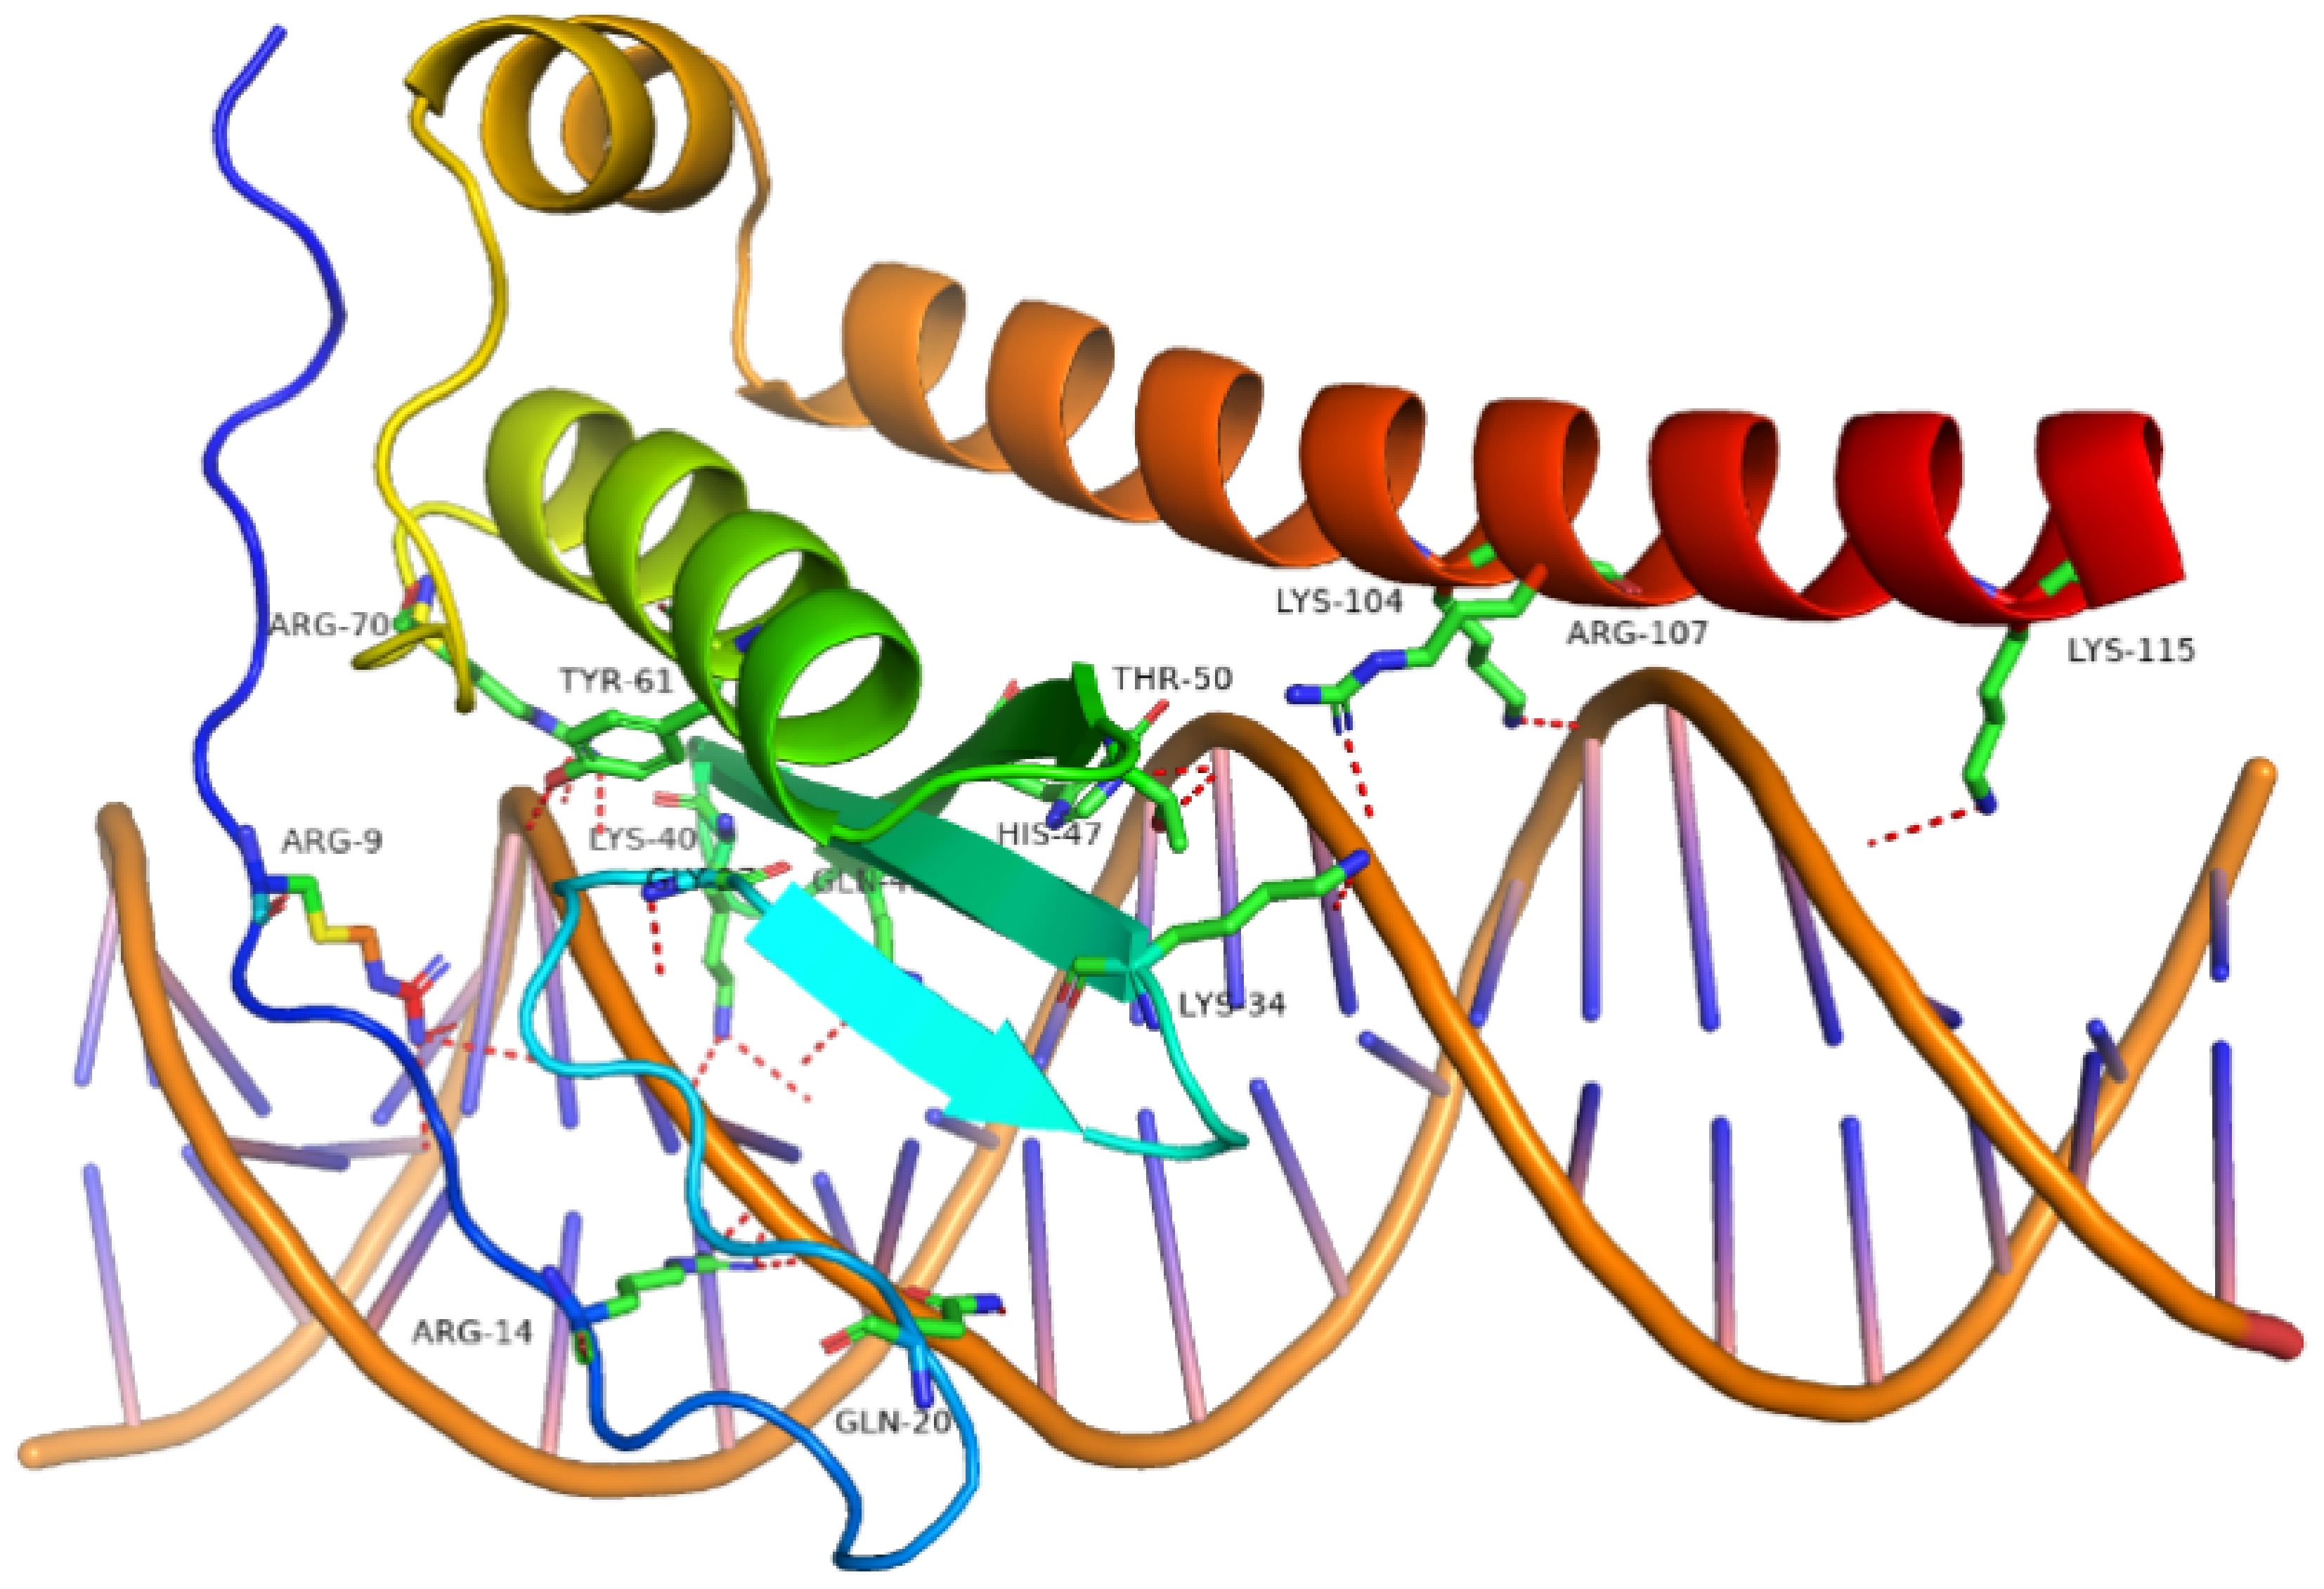
Figure 8.
The molecular conformation of the docking between MdERF and MdSTP13 promoter region. The red dashed lines indicate hydrogen bonds between the AP2 domain and the MdSTP13 promoter region.
-
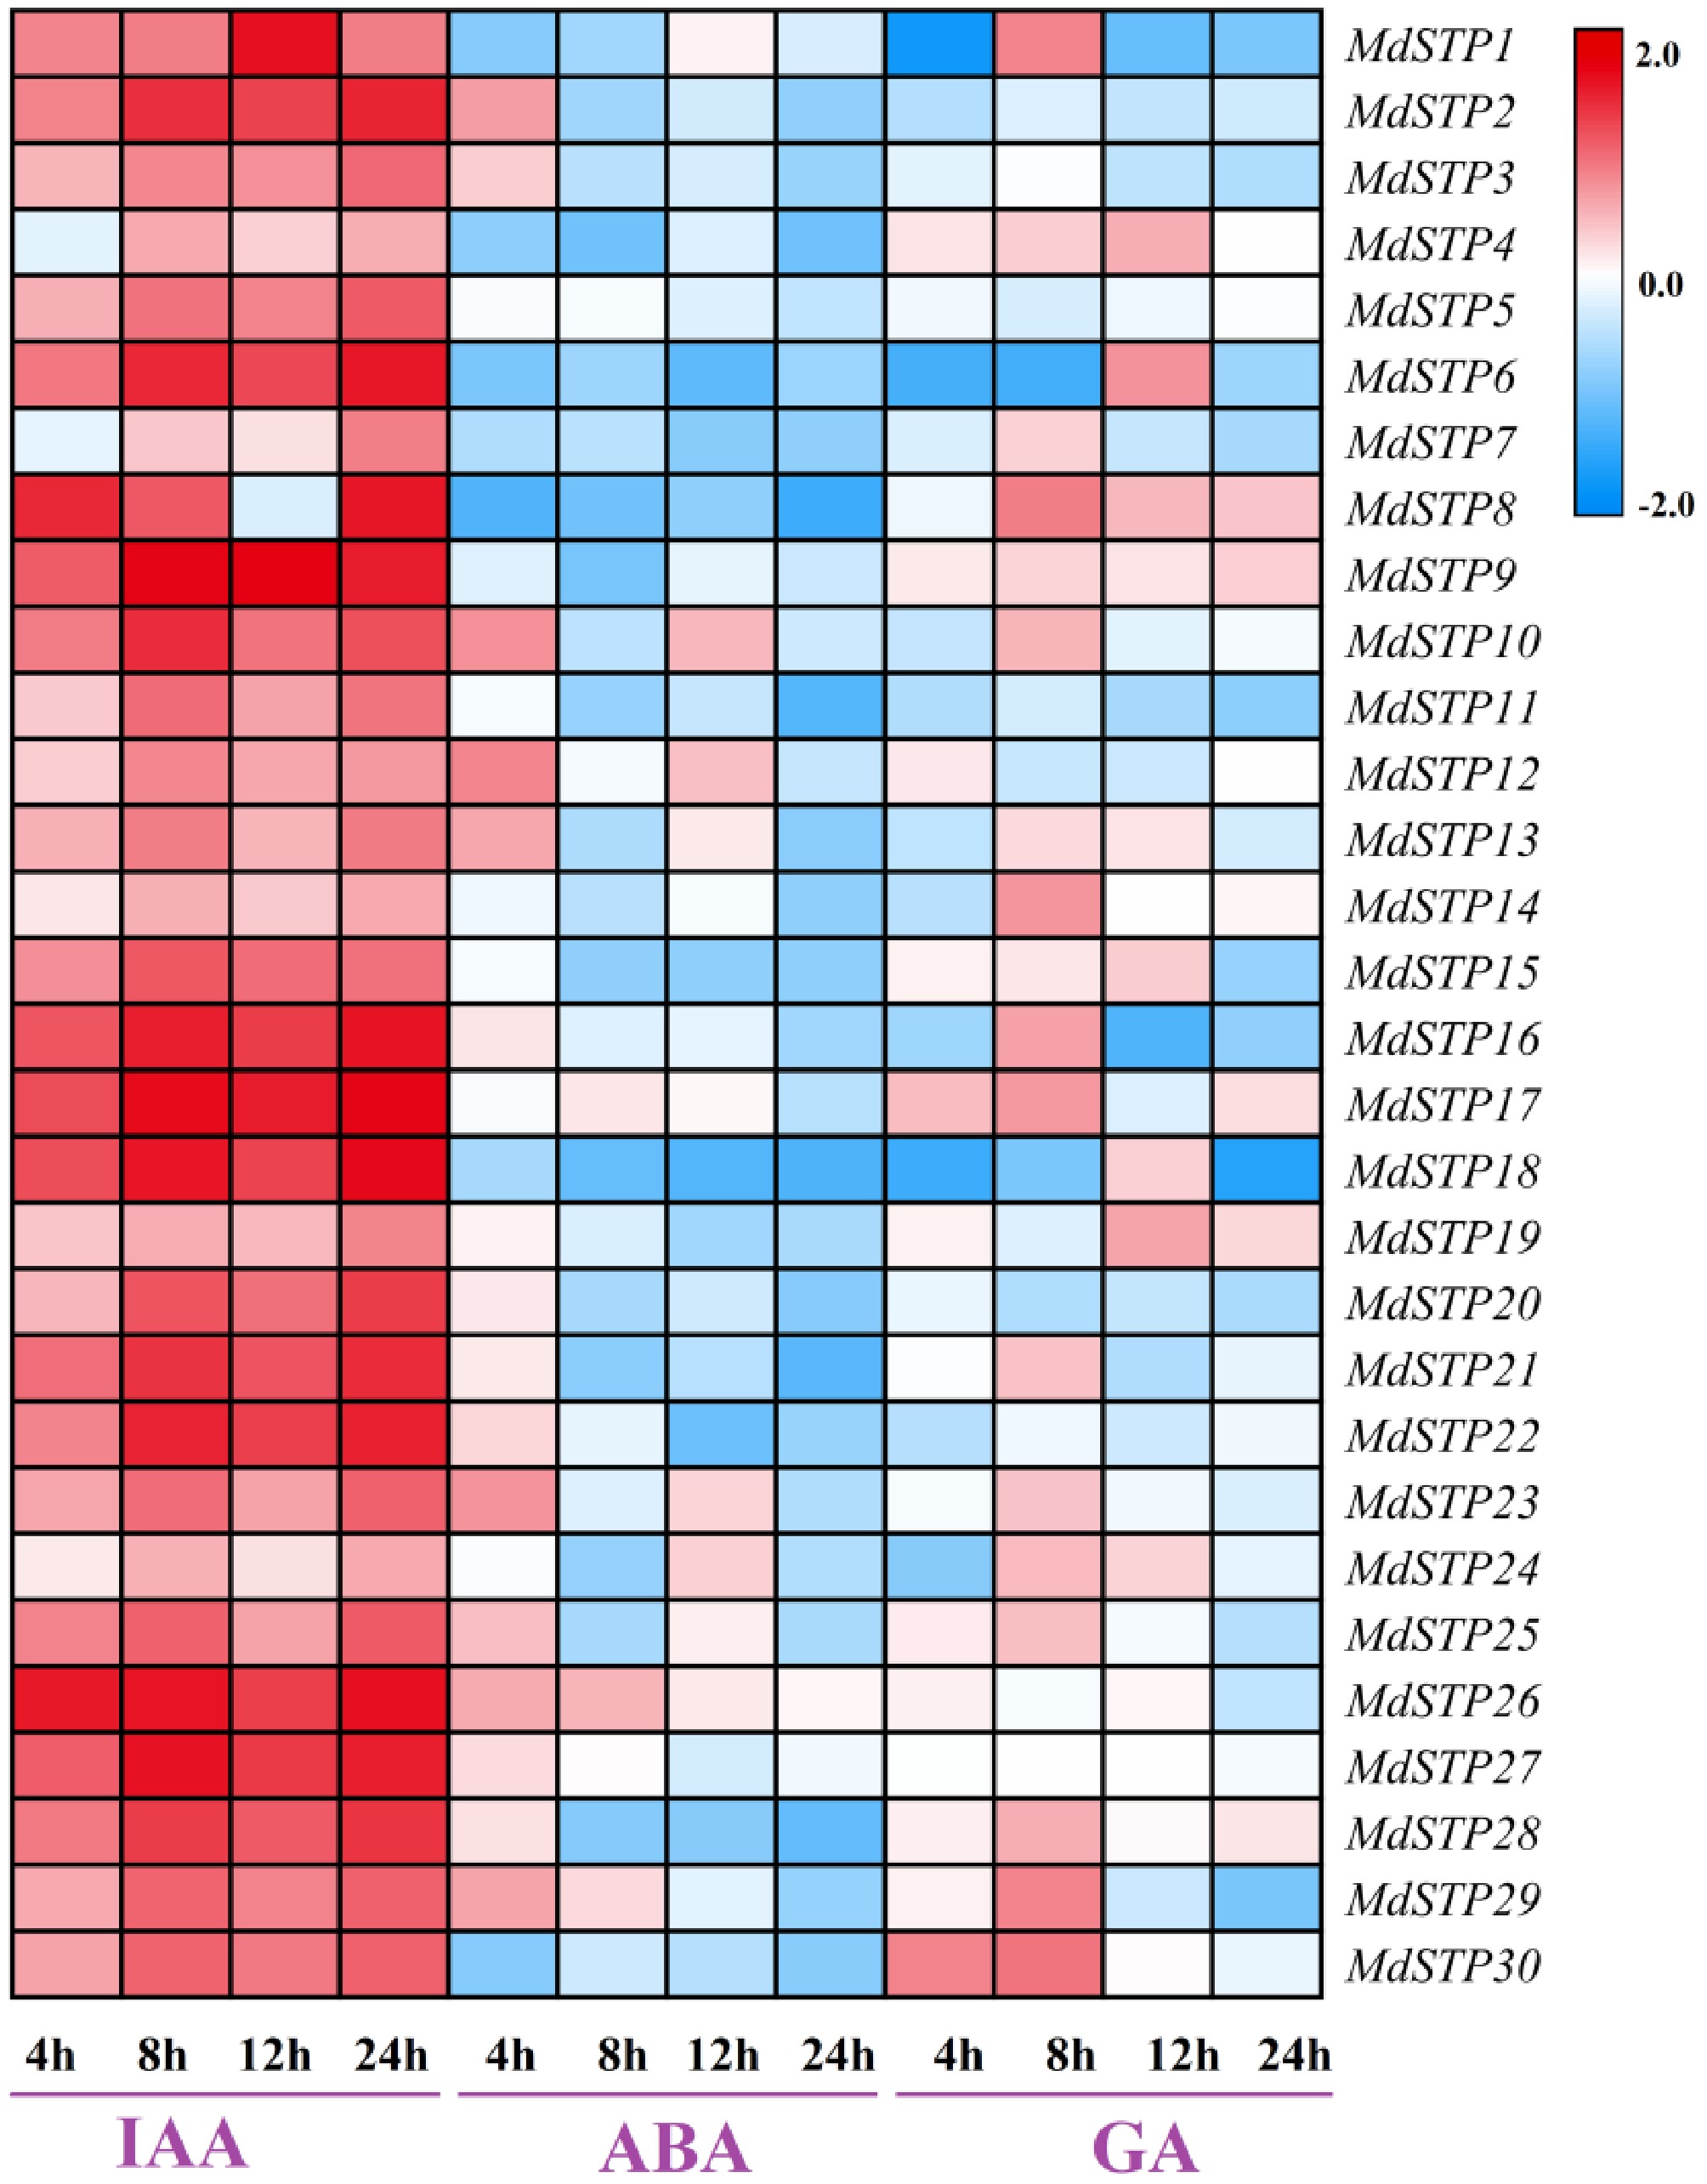
Figure 9.
Expression levels of MdSTPs gene under different hormone treatments. The horizontal axis represents different time points of plant hormone treatments, while the vertical axis indicates the relative expression levels of MdSTPs. The blue-white-red color gradient signifies low-medium-high gene expression levels, respectively. The expression levels are comparatively analyzed based on the integrated data from both the horizontal and vertical axes.
-
Gene name Gene accession no. Chromosome
locationPeptide (aa) Mw (kD) PI II AI GRAVY CDs (bp) FULL (bp) MdSTP1 MDP0000137412 Chr 02 516 185,529.61 7.14 38.78 25.58 0.603 1,551 2,189 MdSTP2 MDP0000146340 − 453 49,132.05 8.95 30.30 106.75 0.581 1,359 2,270 MdSTP3 MDP0000154362 Chr 15 522 56,747.72 9.09 33.43 111.34 0.535 1,569 2,943 MdSTP4 MDP0000175148 Chr 13 459 254,819.64 6.72 39.01 26.77 0.616 1,380 3,033 MdSTP5 MDP0000177942 Chr 01 479 214,554.17 7.53 35.91 26.45 0.604 1,440 2,522 MdSTP6 MDP0000185402 Chr 15 514 − − 27.77 104.11 0.616 1,545 1,947 MdSTP7 MDP0000187438 Chr 02 518 56,544.23 9.34 34.07 103.92 0.452 1,557 2,357 MdSTP8 MDP0000190194 Chr 13 454 157,635.95 6.41 42.94 26.49 0.655 1,365 1,876 MdSTP9 MDP0000190996 Chr 09 430 162,749.64 7.27 43.10 25.51 0.533 1,293 1,917 MdSTP10 MDP0000191620 Chr 07 497 53,868.39 9.39 31.32 105.94 0.574 1,494 1,634 MdSTP11 MDP0000192591 Chr 15 605 66,120.31 8.96 33.13 102.83 0.401 1,818 2,841 MdSTP12 MDP0000193050 Chr 13 528 57,859.72 9.24 39.08 106.91 0.426 1,587 5,069 MdSTP13 MDP0000193898 Chr 05 655 72,422.79 9.20 34.86 100.15 0.453 1,968 2,993 MdSTP14 MDP0000201154 Chr 03 574 62,630.85 9.03 30.94 98.17 0.352 1,725 3,341 MdSTP15 MDP0000204929 Chr 13 551 205,076.15 6.62 41.55 28.20 0.658 1,536 2,447 MdSTP16 MDP0000216376 Chr 01 450 124,547.01 6.97 38.52 23.51 0.608 1,353 1,497 MdSTP17 MDP0000231284 Chr 09 509 55,673.94 9.06 34.07 110.51 0.606 1,530 1,958 MdSTP18 MDP0000236607 Chr 10 428 155,806.89 7.08 40.50 24.13 0.654 1,287 1,840 MdSTP19 MDP0000240921 Chr 02 518 56,580.07 9.34 34.11 103.92 0.457 1,557 2,357 MdSTP20 MDP0000258256 Chr 15 518 56,293.23 9.23 33.39 108.26 0.505 1,557 2,642 MdSTP21 MDP0000266249 Chr 14 479 51,146.79 9.28 32.64 106.47 0.568 1,440 1,538 MdSTP22 MDP0000282726 Chr 09 509 55,818.17 8.97 31.36 110.67 0.599 1,530 1,916 MdSTP23 MDP0000288533 Chr 10 519 228,109.15 6.55 35.69 25.74 0.641 1,560 2,712 MdSTP24 MDP0000289098 Chr 13 510 56,313.63 9.00 29.22 112.00 0.571 2,415 1,533 MdSTP25 MDP0000294725 − 235 26,332.08 9.33 39.69 110.81 0.376 708 708 MdSTP26 MDP0000485591 Chr 13 371 161,539.07 4.97 38.02 26.82 0.647 1,116 1,920 MdSTP27 MDP0000721688 Chr 13 524 57,363.86 9.43 41.79 99.56 0.306 1,575 7,162 MdSTP28 MDP0000735707 Chr 15 563 61,159.36 8.89 29.65 97.14 0.477 1,692 3,273 MdSTP29 MDP0000831221 Chr 13 511 55,997.23 9.10 33.31 107.03 0.565 1,536 1,951 MdSTP30 MDP0000906893 Chr 02 521 223,660.09 6.98 38.53 27.14 0.641 1,566 2,649 Table 1.
Physical and chemical property analysis of STP genes in apple.
-
Protein Alpha helix Extended strand Beta turn Random coil Subcellular localization MdSTP1 50.58% 15.70% 5.23% 28.49% plas, vacu, golg, cyto MdSTP2 50.77% 14.79% 4.64% 29.80% plas, vacu, cyto, E.R., golg MdSTP3 47.89% 15.71% 5.75% 30.65% plas, vacu, E.R. MdSTP4 45.75% 18.08% 5.66% 30.50% plas, vacu, golg, E.R. MdSTP5 55.95% 15.03% 4.80% 24.22% plas, vacu MdSTP6 49.61% 15.76% 5.06% 29.57% plas, vacu, cyto, E.R. MdSTP7 47.30% 16.41% 5.02% 31.27% plas, vacu, golg, cyto MdSTP8 54.63% 14.98% 5.07% 25.33% plas, E.R., golg MdSTP9 51.63% 15.58% 6.05% 26.74% plas, vacu MdSTP10 52.92% 16.30% 4.63% 26.16% plas, vacu, cyto, E.R. MdSTP11 48.43% 16.86% 4.46% 30.25% plas, vacu, golg, cyto MdSTP12 49.05% 15.34% 5.68% 29.92% plas, vacu, E.R., cyto, mito MdSTP13 48.09% 19.24% 7.48% 25.19% plas, vacu, golg, cyto, E.R. MdSTP14 47.74% 15.85% 5.92% 30.49% plas, vacu, cyto, mito, E.R. MdSTP15 49.71% 15.46% 5.48% 29.35% vacu, plas, cyto, E.R. MdSTP16 48.89% 17.33% 4.67% 29.11% plas, vacu, cyto MdSTP17 51.67% 15.52% 5.70% 27.11% plas, vacu MdSTP18 49.71% 15.46% 5.48% 29.35% plas, vacu, E.R., cyto, mito, extr MdSTP19 48.65% 16.80% 4.83% 29.73% plas, vacu, golg, cyto MdSTP20 48.46% 16.22% 5.02% 30.31% vacu, plas, golg, cyto MdSTP21 46.14% 19.83% 5.64% 28.39% vacu, plas, cyto MdSTP22 50.49% 15.13% 5.70% 28.68% plas, vacu, E.R., chlo, pero MdSTP23 49.13% 16.96% 5.59% 28.32% vacu, plas, golg, cyto MdSTP24 47.65% 17.06% 6.67% 28.63% vacu, plas, E.R., chlo, cyto, pero MdSTP25 56.60% 14.89% 7.66% 20.85% plas, E.R., golg, chlo, vacu MdSTP26 52.29% 14.02% 4.58% 29.11% plas, vacu, golg MdSTP27 47.14% 16.41% 4.77% 31.68% plas, vacu MdSTP28 47.78% 17.41% 6.04% 28.77% plas, E.R., golg MdSTP29 48.92% 14.68% 6.07% 30.33% plas, vacu, E.R., chlo, pero MdSTP30 47.60% 16.12% 5.37% 30.90% plas, vacu, cyto, E.R. Table 2.
The secondary structure and subcellular location of STP proteins in apple.
Figures
(9)
Tables
(2)