-
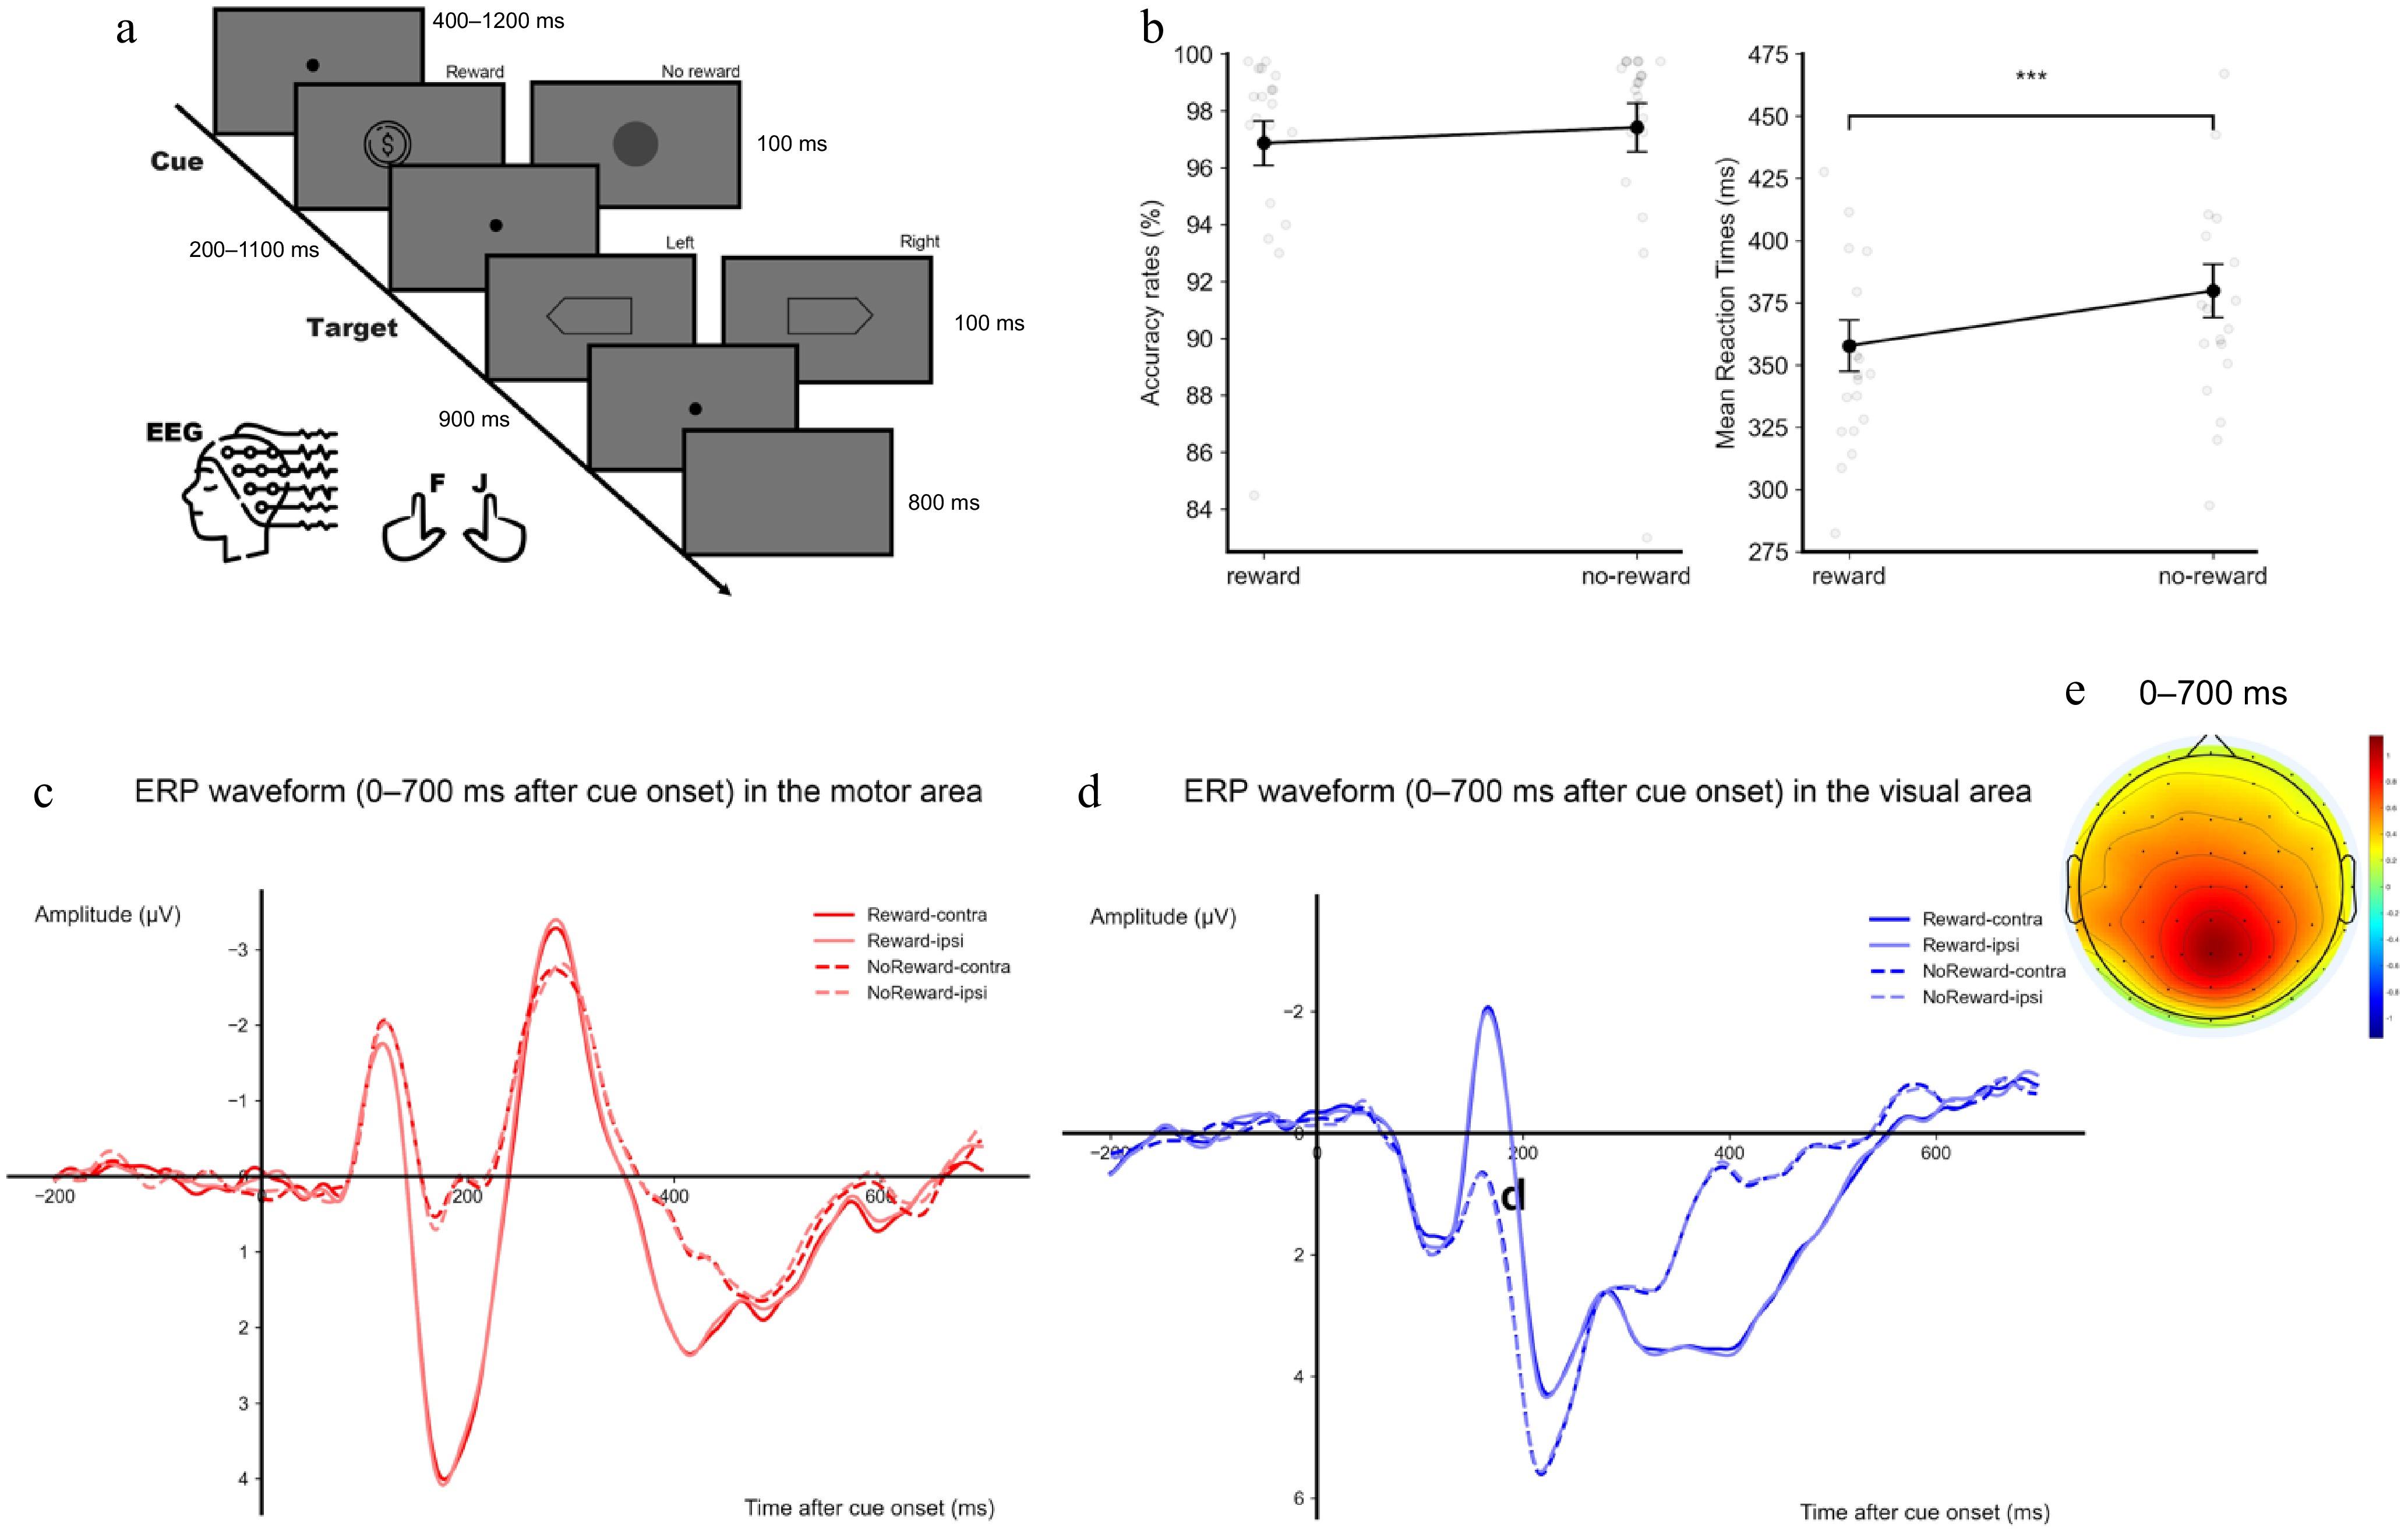
Figure 1.
(a) Illustration of the experimental design and an example of a trial sequence. The reward cue was shown as the 1-Yuan coin, while the no-reward cue was shown as the round mask. Participants had to judge the head direction of the target hexagon. (b) Mean accuracies (left) and reaction times (RT, right) are shown as a function of reward. (c) ERP waveforms within 0–700 ms after the cue onset over the motor area. (d) ERP waveforms within 0–700 ms after the cue onset over the visual area. The four conditions are reward-contralateral, reward-ipsilateral, no-reward-contralateral, and no-reward-ipsilateral. (e) The topographical distribution of amplitude difference between reward and no-reward conditions within 0–700 ms after the cue onset. Error bars represent ± 1 s.e.m. calculated across participants (n = 20). ** p < 0.01, *** p < 0.001.
-
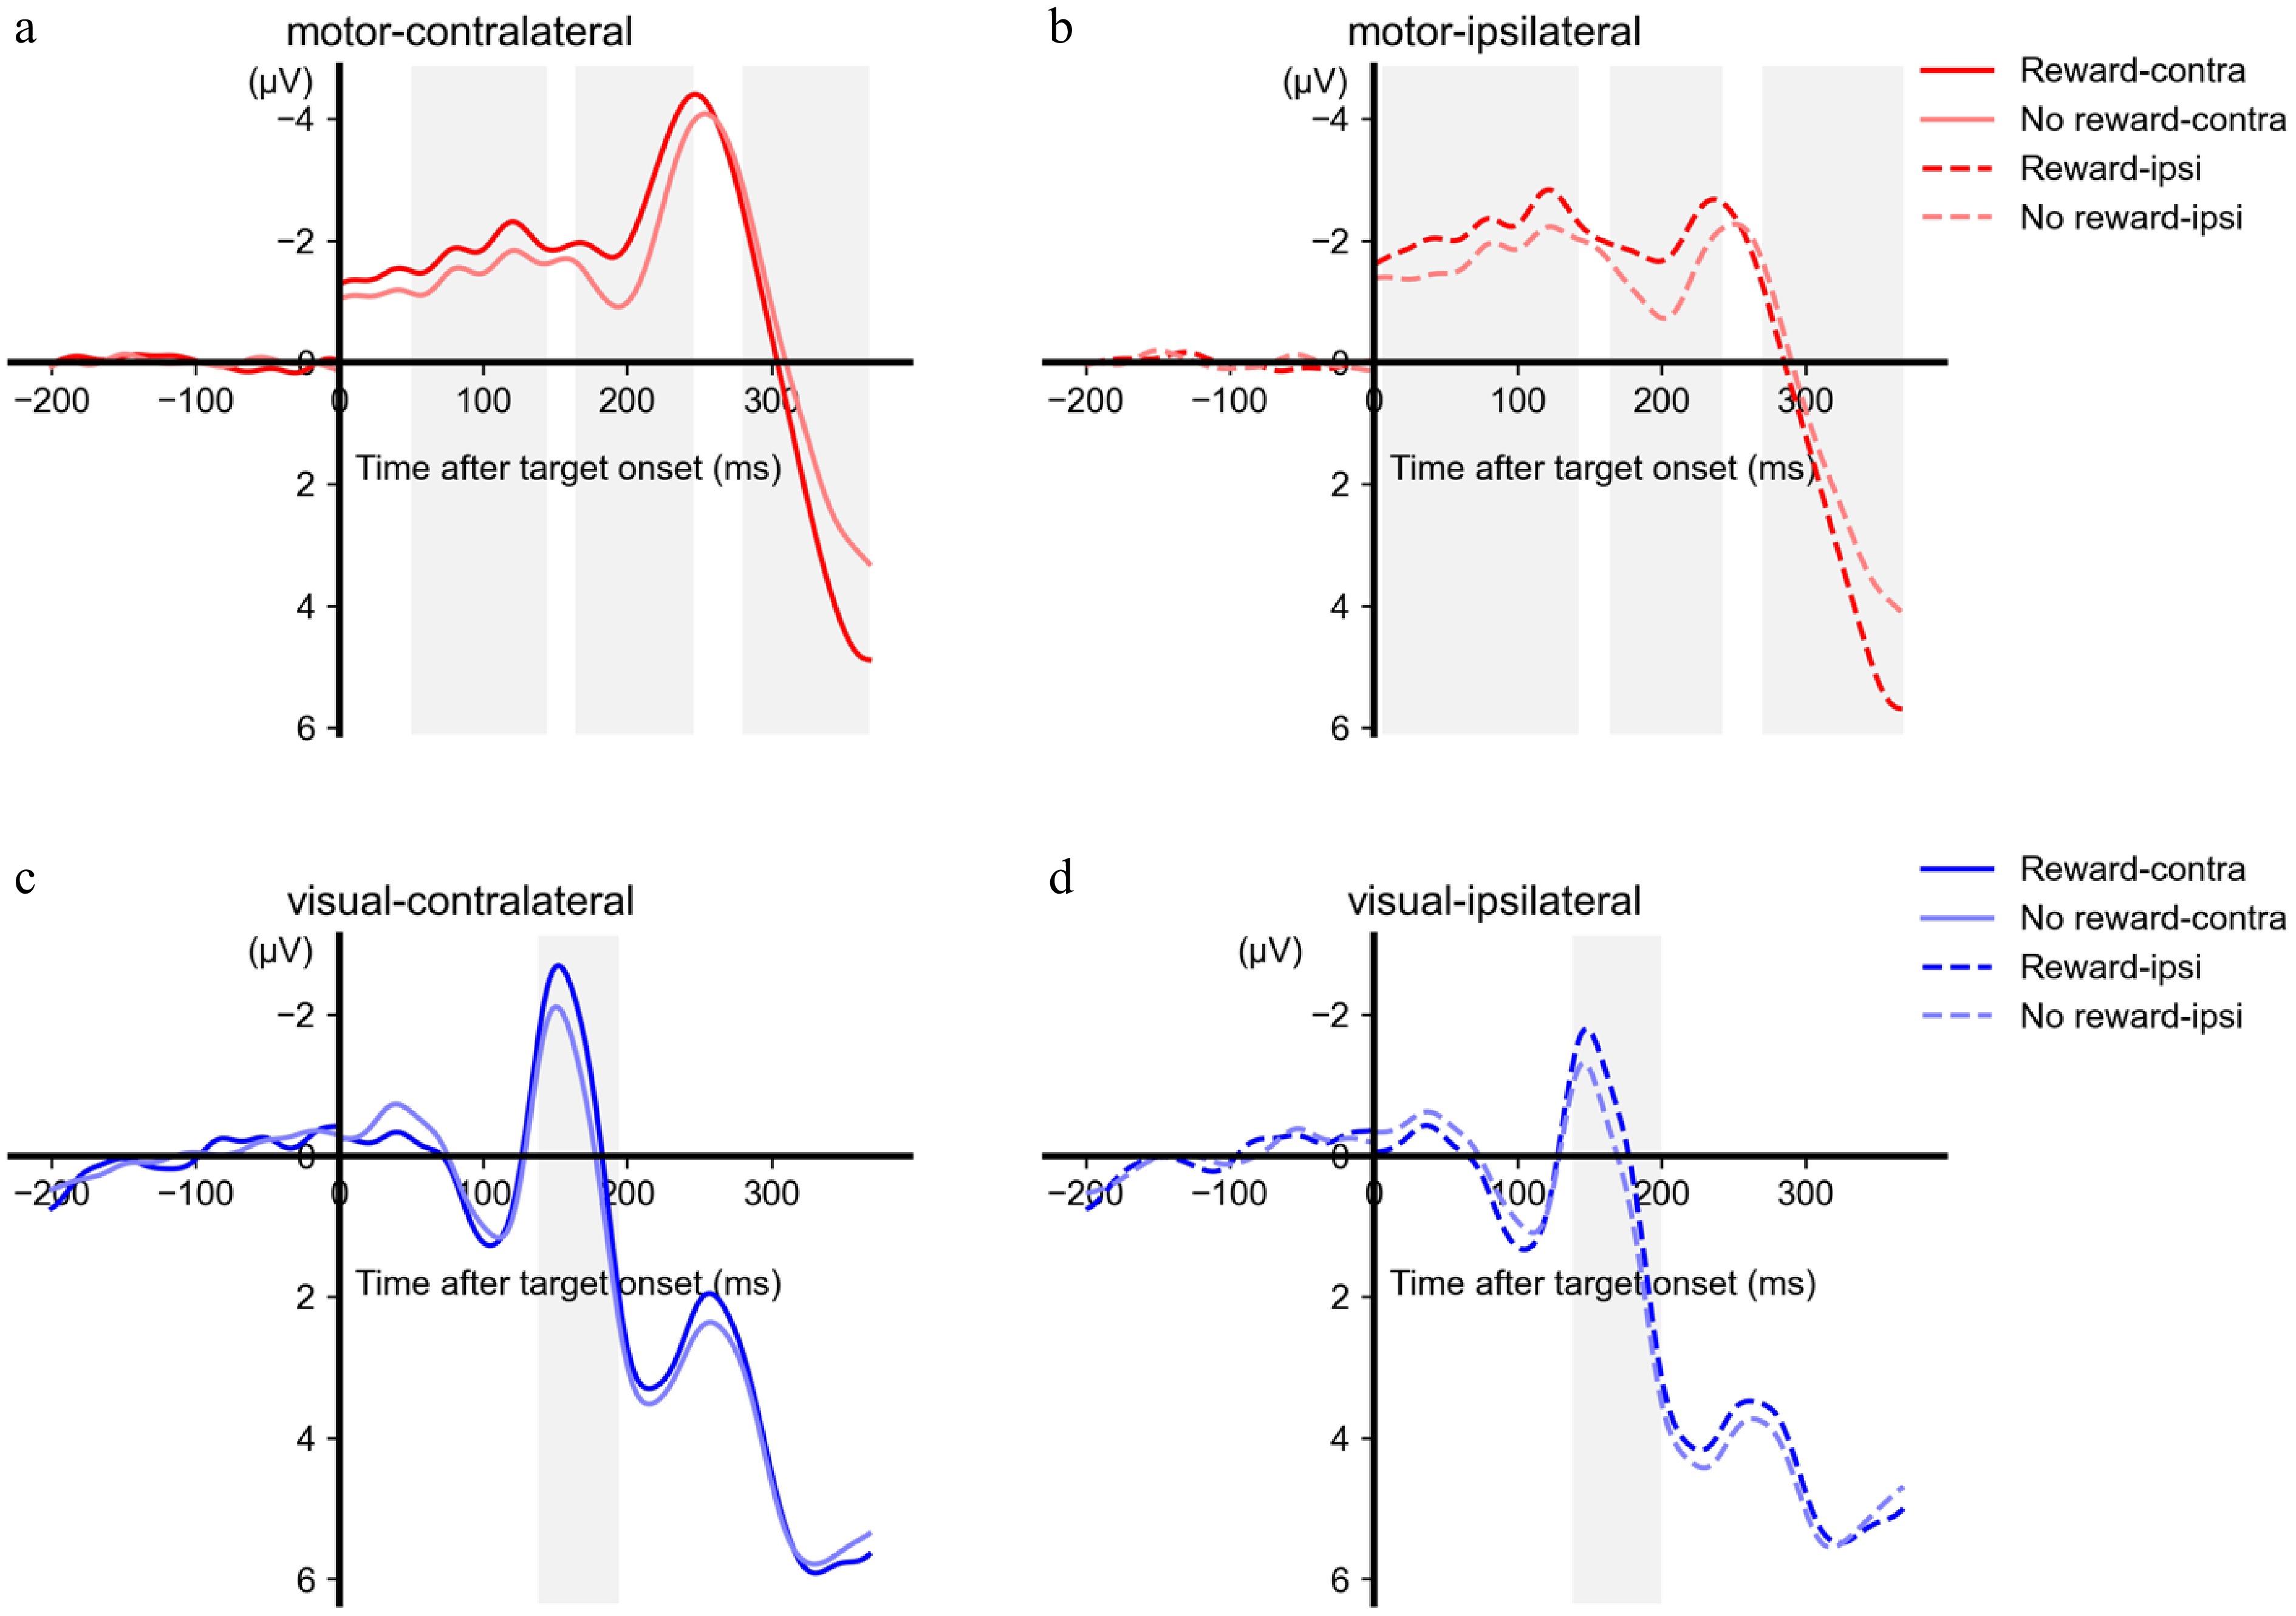
Figure 2.
ERP results of the target phase. The ERP waveforms are shown as a function of the time, hemisphere (a and c: contralateral to the target direction, b and d: ipsilateral to the target direction), reward, and areas (a and b: motor area, c and d: visual area). Note that the time points after the zero point are relative to the target onset, and the time points before the zero point are relative to the cue onset. The grey-shaded areas represent the time window during which a significant difference in amplitudes was observed between the reward and no-reward conditions.
-
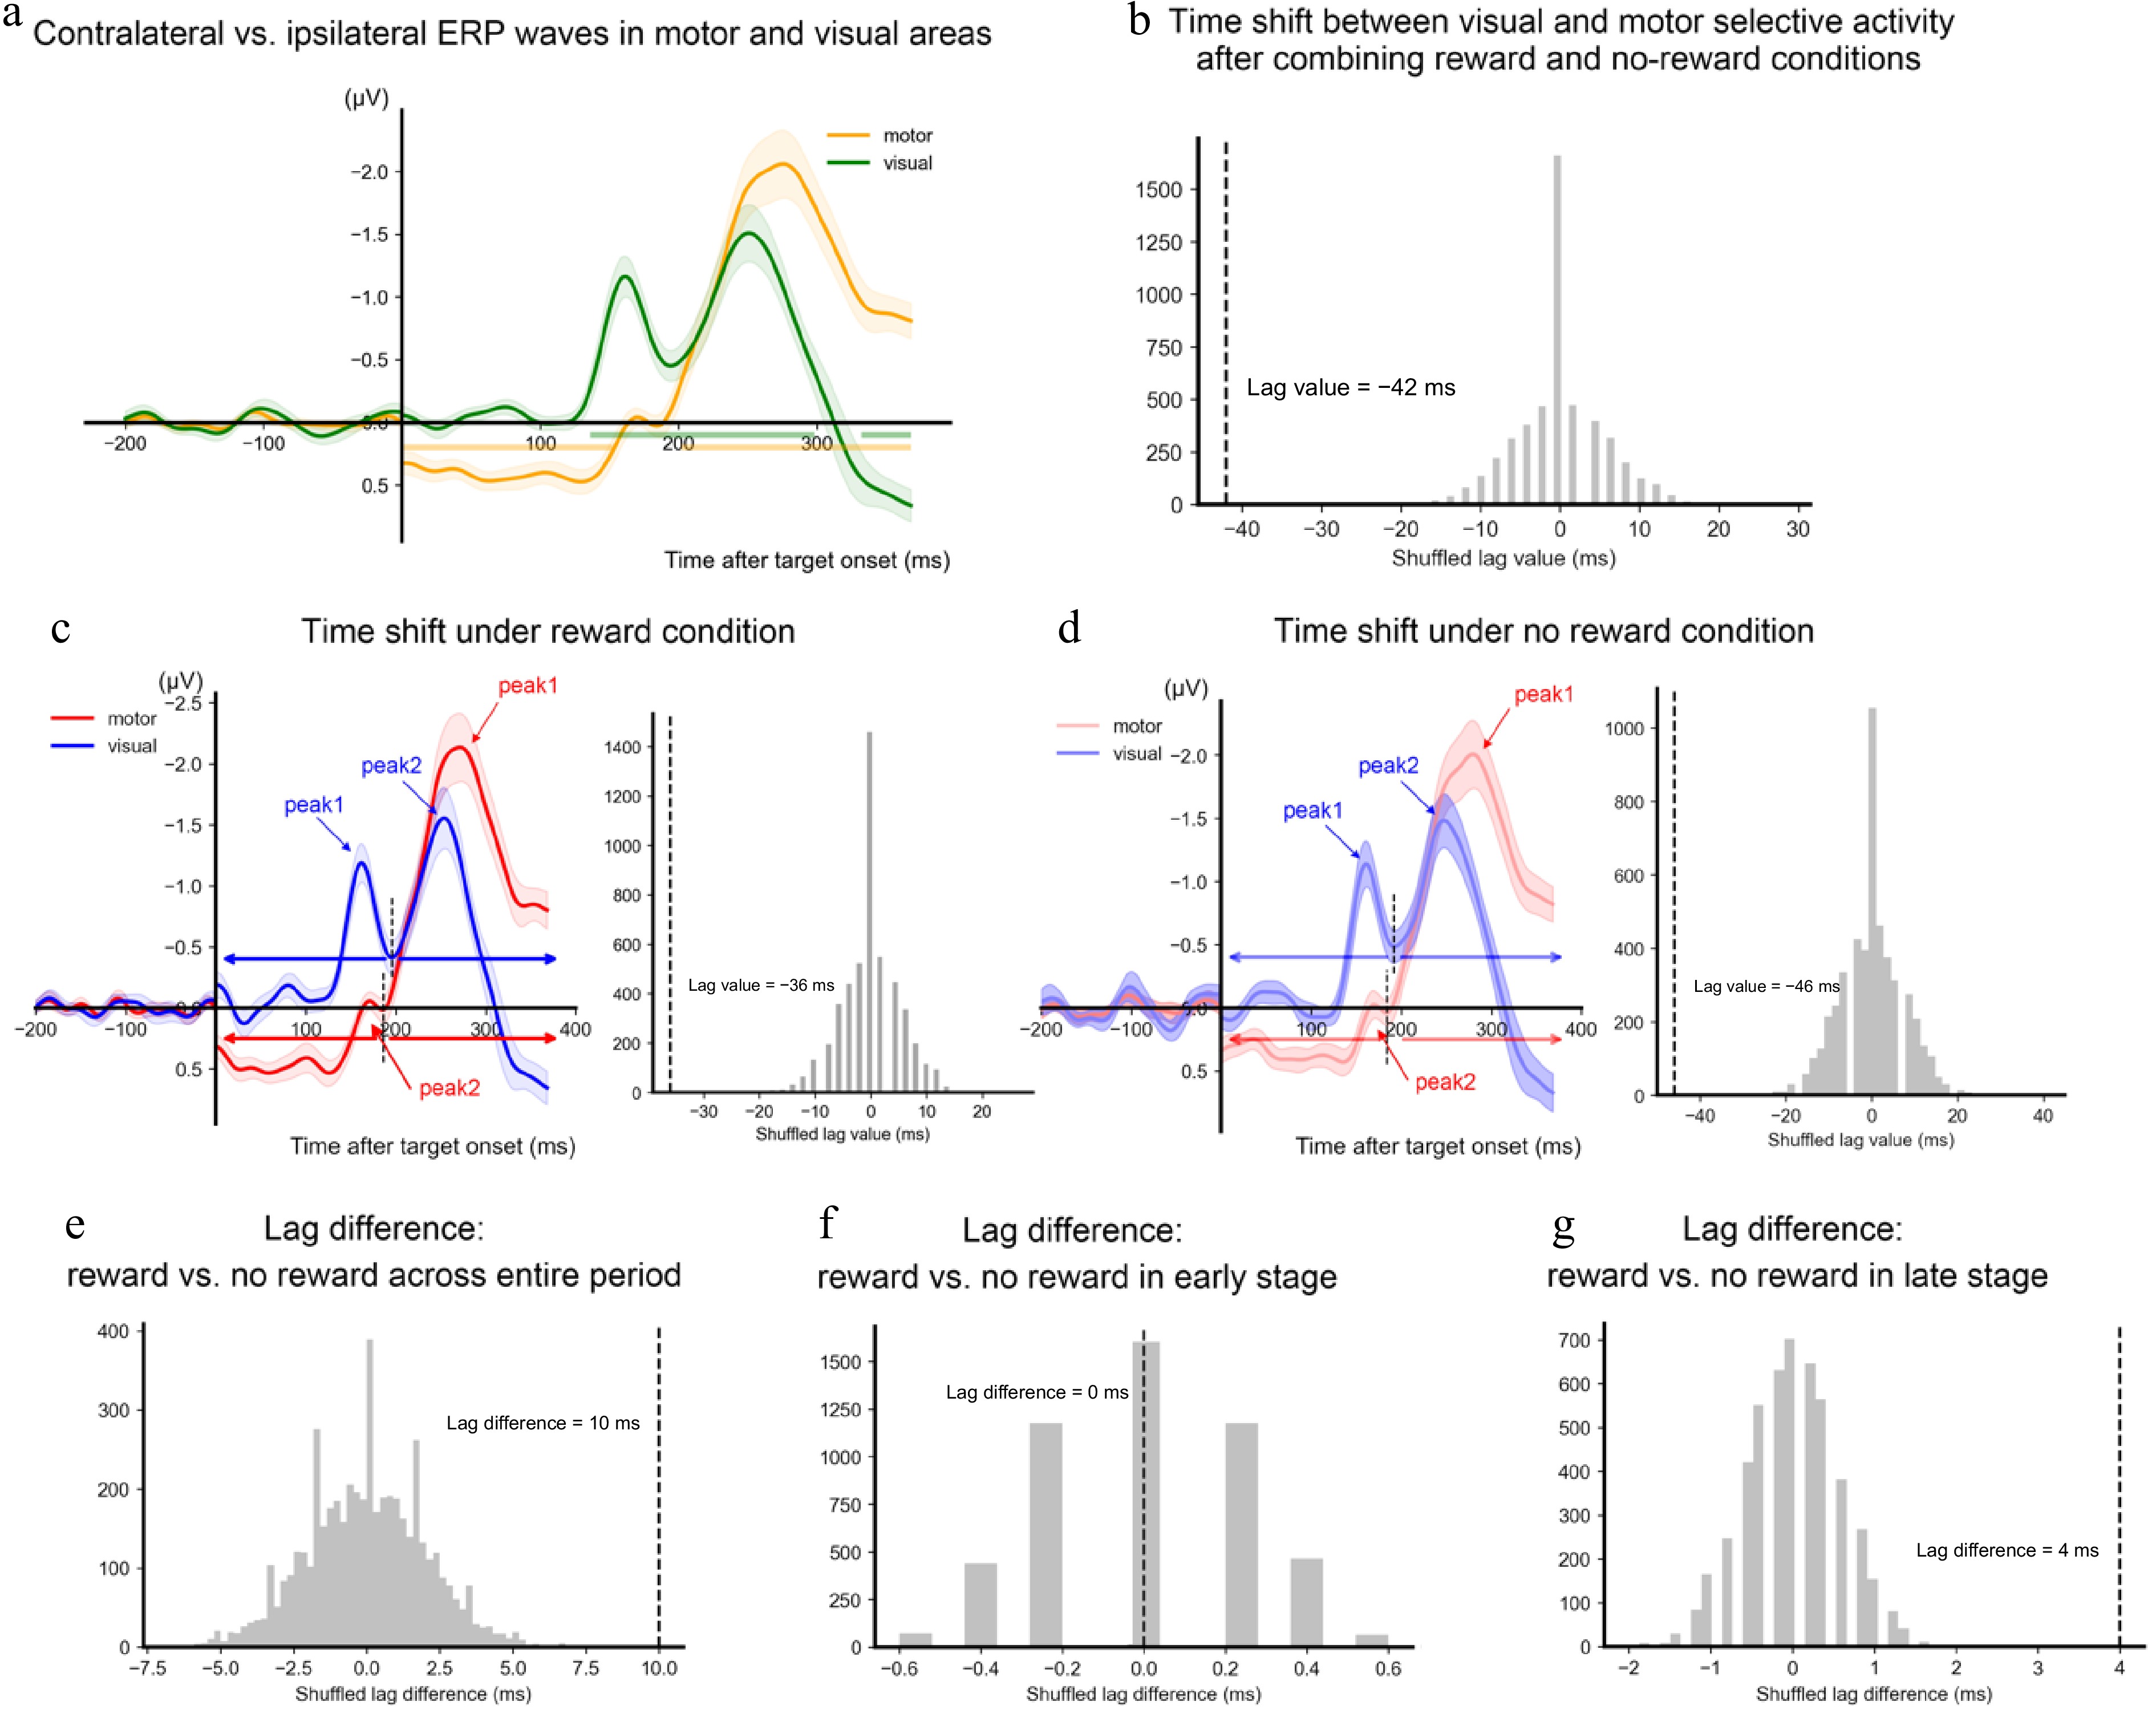
Figure 3.
Latency results of the selective activity. (a) The differences in waveforms between the contralateral side and the ipsilateral side of the target direction are shown as a function of time and area (yellow for motor area and green for visual area). The horizontal lines denote the time clusters showing a significant difference between contralateral and ipsilateral activities. (b) The dashed vertical line denotes the lag value between the visual selective activity and the motor selectivity estimated based on the cross-correlation. The gray bars denoted the distribution of the estimated lag values based on permutations (n = 5,000). (c) Visual (red) and motor (blue) selective activity and the lag results in reward conditions. (d) Visual (red) and motor (blue) selective activity and the lag results in no-reward conditions. Peak values of the identified components are marked in arrows. The short dashed vertical lines on the left panel denote the lowest amplitude between the two peaks. The time range before the lowest amplitude was identified as the early stage, and the time range after the lowest amplitude was identified as the late stage. (e) The difference in visual-motor lag values between reward and no-reward conditions estimated based on the whole time range. (f) The difference of visual-motor lag values between reward and no-reward conditions estimated based on the early stage. (g) The difference of visual-motor lag values between reward and no-reward conditions estimated based on the late stage. All shadings represent ± 1 s.e.m. calculated across all participants.
Figures
(3)
Tables
(0)