-
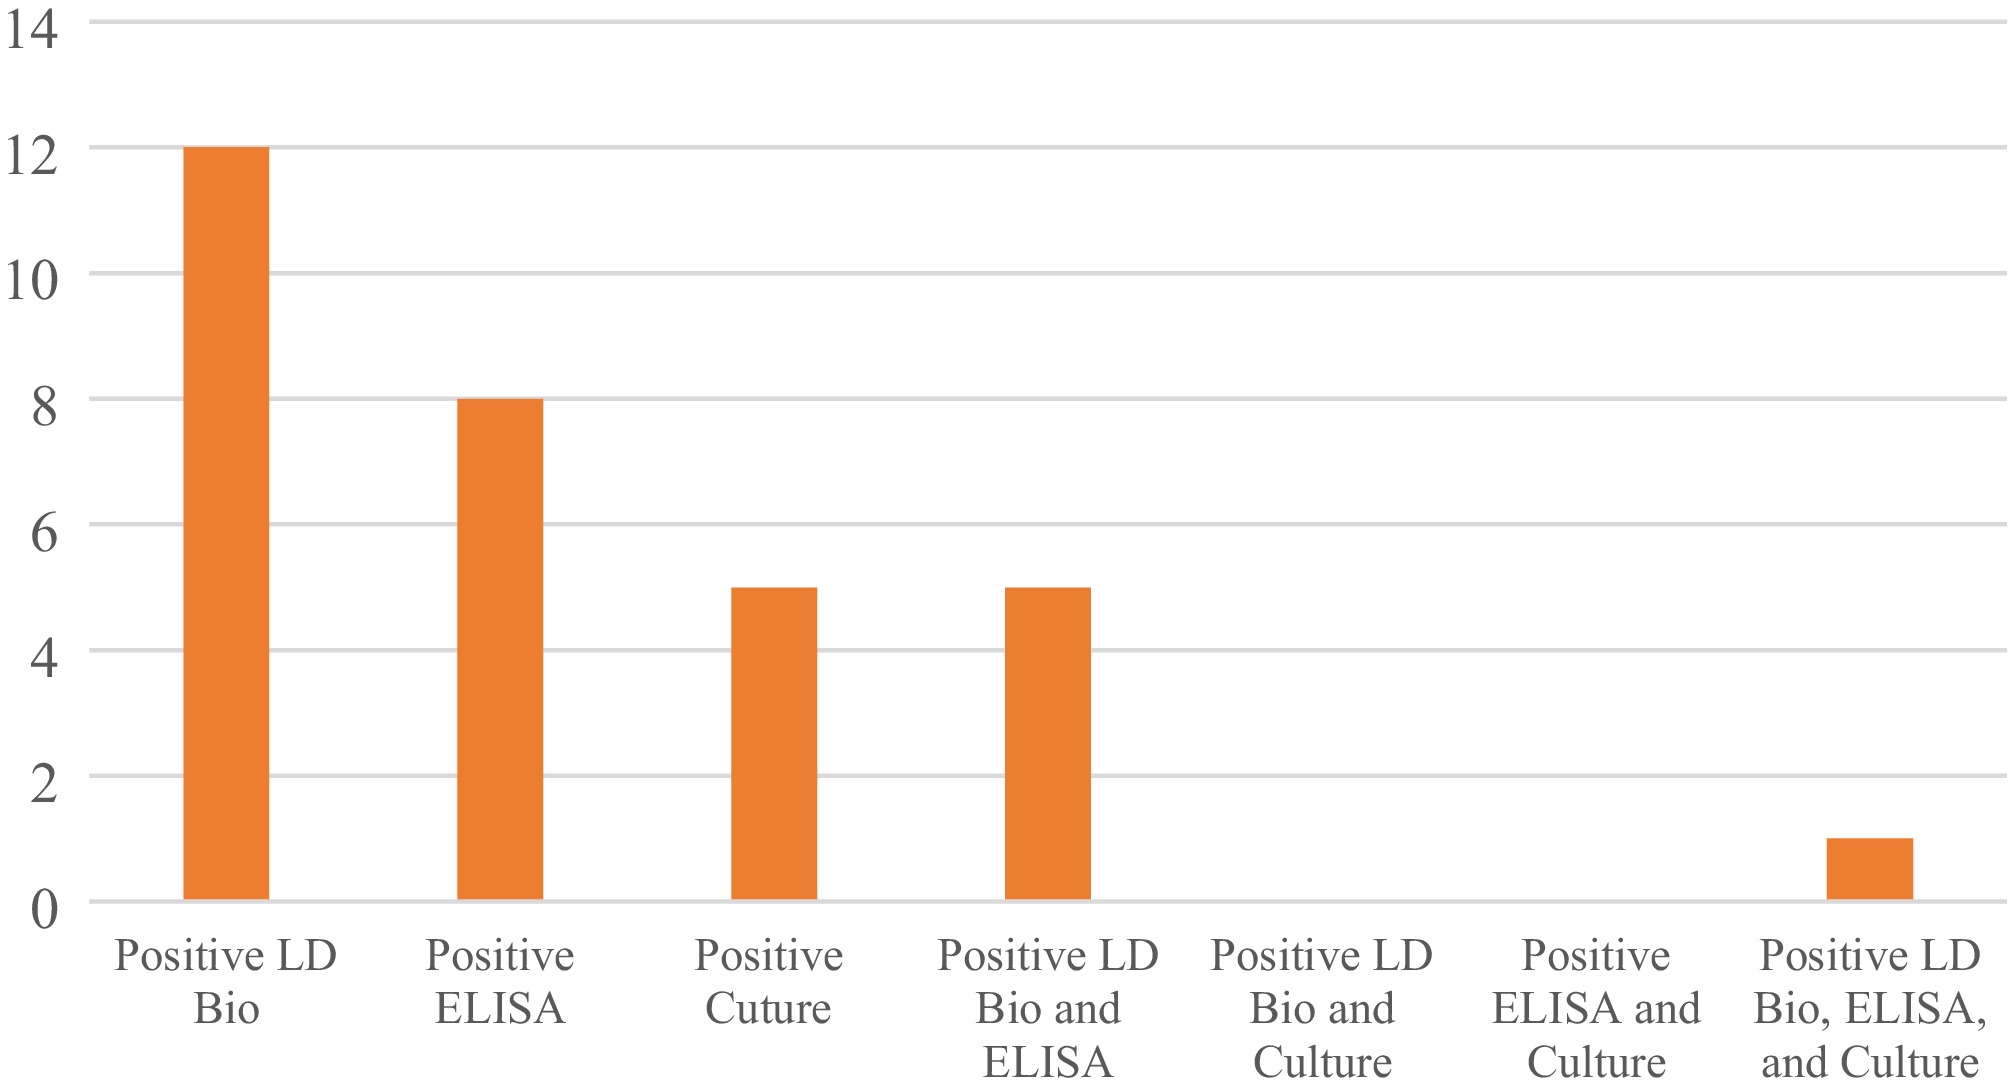
Figure 1.
Incidence of positive probable CPA values based on various diagnostic modalities.
-
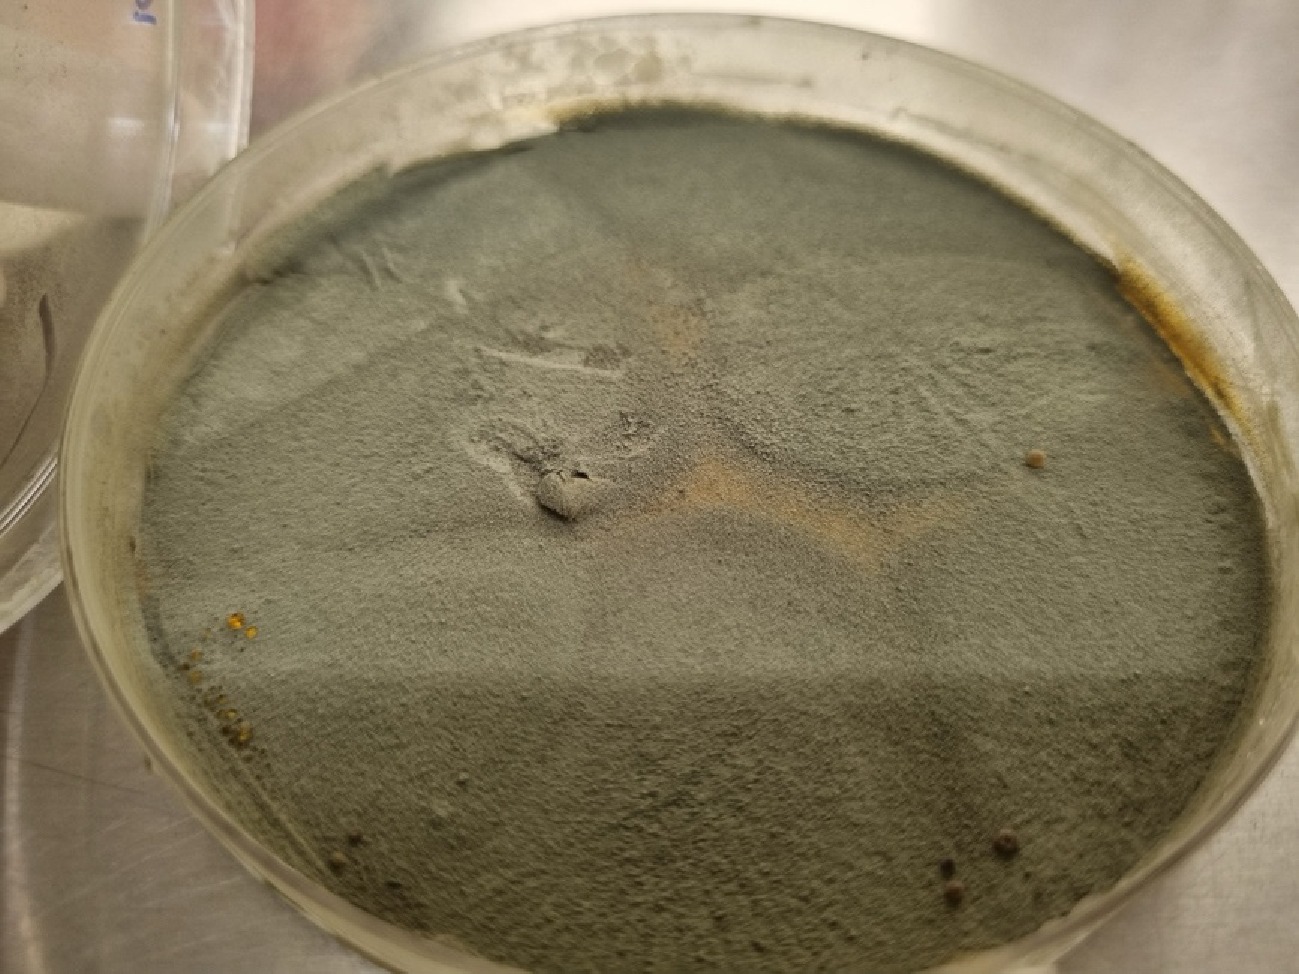
Figure 2.
Morphology of Aspergillus fumigatus colony grown on Sabouraud dextrose agar, showing bluish-green surface and velvety texture, consistent with the typical features of this species.
-
Characteristics Probable CPA (n = 16) Non-CPA (n = 13) p-value N Percentage Mean ± SD N Percentage Mean ± SD Gender Men 10 34.5% 10 34.5% 0.404 Women 6 20.7% 3 10.3% Age (year) 51.88 ± 13.64 53.54 ± 14.86 0.756 TB treatment duration (month) 12.0 ± 8.41 10.23 ± 5.63 0.640 Comorbid Asthma 0 0 1 3.4% 0.259 COPD 2 6.9% 0 0 0.186 Diabetes mellitus 2 6.9% 1 3.4% 0.672 Lung cancer 1 3.4% 0 0 0.359 Malignancies other than lung 1 3.4% 0 0 0.359 Arthritis 1 3.4% 1 3.4% 0.879 Smoking history 5 17.2% 9 31.0% 0.042 Symptoms Cough with sputum 12 41.4% 10 34.5% 0.904 Hemoptysis 10 34.5% 8 27.6% 0.958 Chest pain 13 44.8% 8 27.6% 0.238 Shortness of breath 10 34.5% 11 37.9% 0.185 Unusual fatigue 15 51.7% 11 37.9% 0.422 Table 1.
Research sample characteristics and bivariate analysis results based on CPA incidence.
-
Diagnostic Probable CPA Sensitivity Specificity Positive predictive value Negative predictive value Accuracy Yes No ICT Positive 12 (41.4%) 1 (3.4%) 75.0% 92.31% 92.31% 75.0% 82.76% Negative 4 (13.8%) 12 (41.4%) Bold values indicate positive predictive value and accuracy as key diagnostic parameters. Table 2.
Diagnostic test of an immunochromatographic test for chronic pulmonary aspergillosis.
-
Diagnostic Probable CPA Sensitivity Specificity Positive predictive value Negative predictive value Accuracy Yes No ELISA Positive 8 (27.6%) 3 (10.3%) 50.00% 76.92% 72.73% 55.56% 62.07% Negative 8 (27.6%) 10 (34.5%) Bold values indicate positive predictive value and accuracy as key diagnostic parameters. Table 3.
Diagnostic test of enzyme-linked immunosorbent assay for chronic pulmonary aspergillosis.
-
Diagnostic Culture Sensitivity Specificity Positive predictive value Negative predictive value Accuracy Yes No ICT Positive 2 (6.9%) 11 (37.9%) 40.00% 54.17% 15.38% 81.25% 51.72% Negative 3 (10.3%) 13 (44.8%) Bold values indicate positive predictive value and accuracy as key diagnostic parameters. Table 4.
Diagnostic test of an immunochromatographic test against sputum culture results for chronic pulmonary aspergillosis.
-
Diagnostic Culture Sensitivity Specificity Positive predictive value Negative predictive value Accuracy Yes No ELISA Positive 2 (6.9%) 9 (31.0%) 40.00% 62.50% 18.18% 83.33% 58.62% Negative 3 (10.3%) 15 (51.7%) Bold values indicate positive predictive value and accuracy as key diagnostic parameters. Table 5.
Diagnostic test of enzyme-linked immunosorbent assay against sputum culture results for chronic pulmonary aspergillosis.
Figures
(2)
Tables
(5)