-
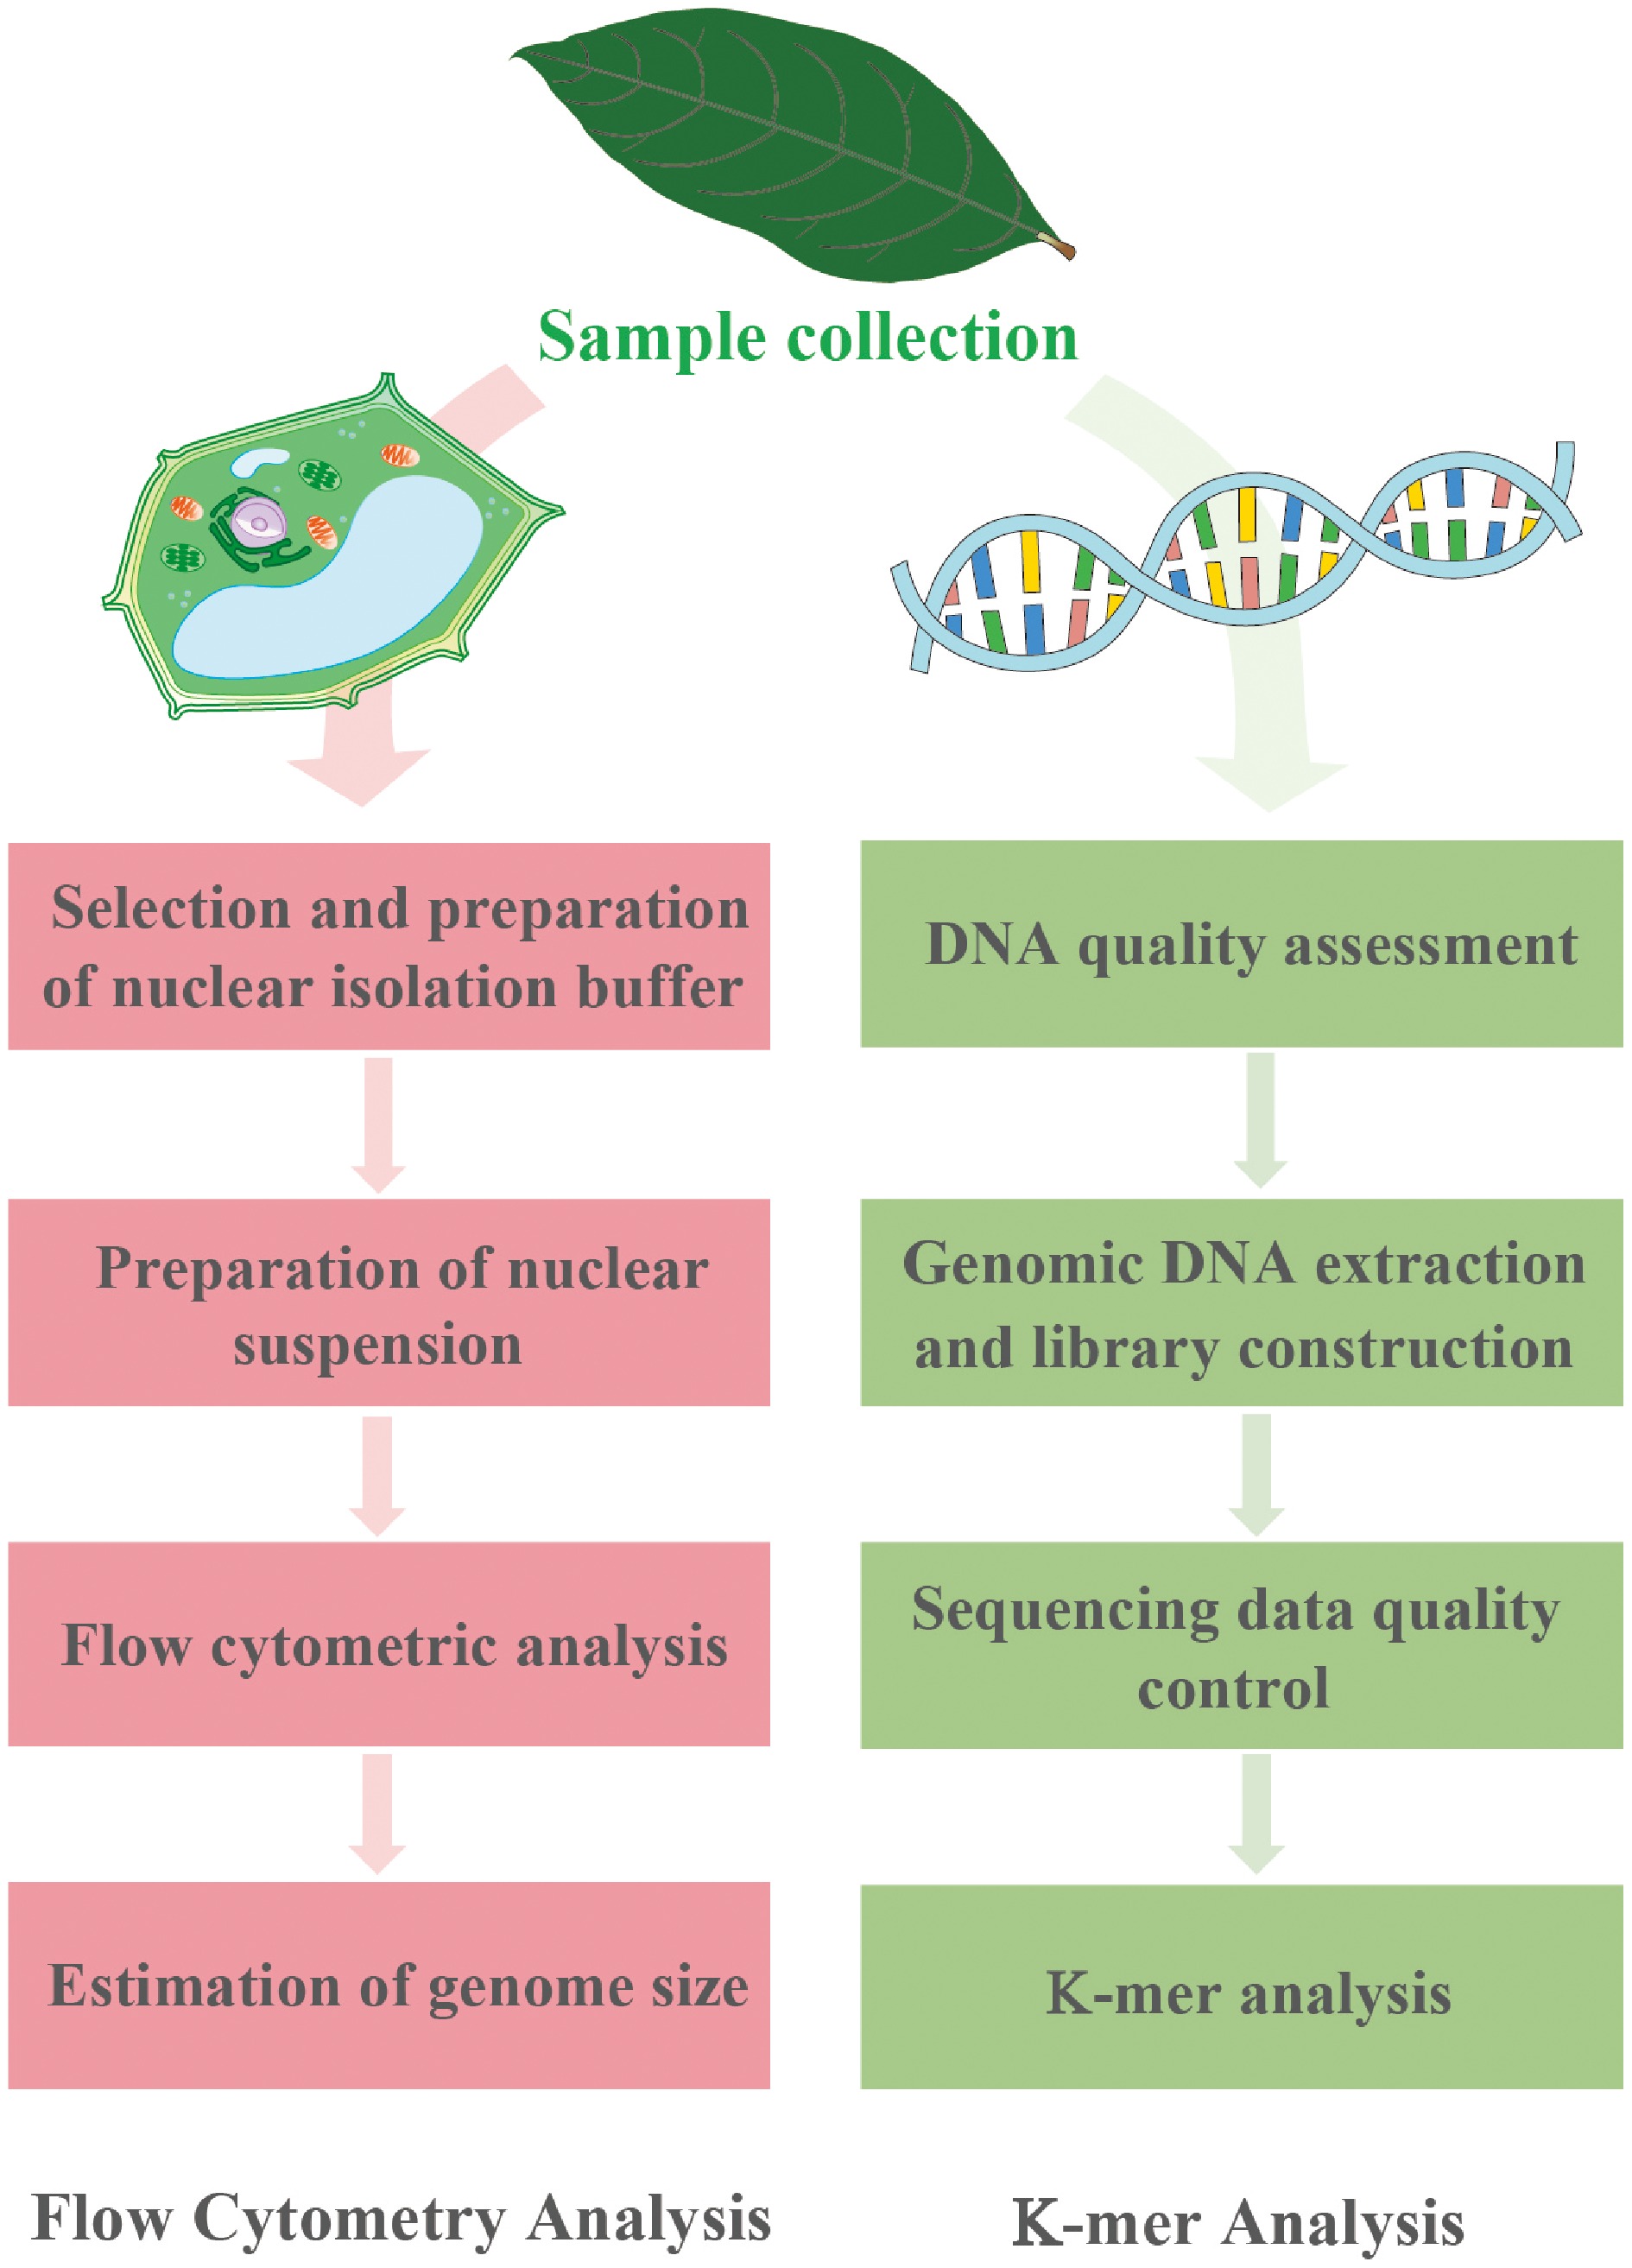
Figure 1.
Experimental protocols for FCM (left) and K-mer analysis (right).
-
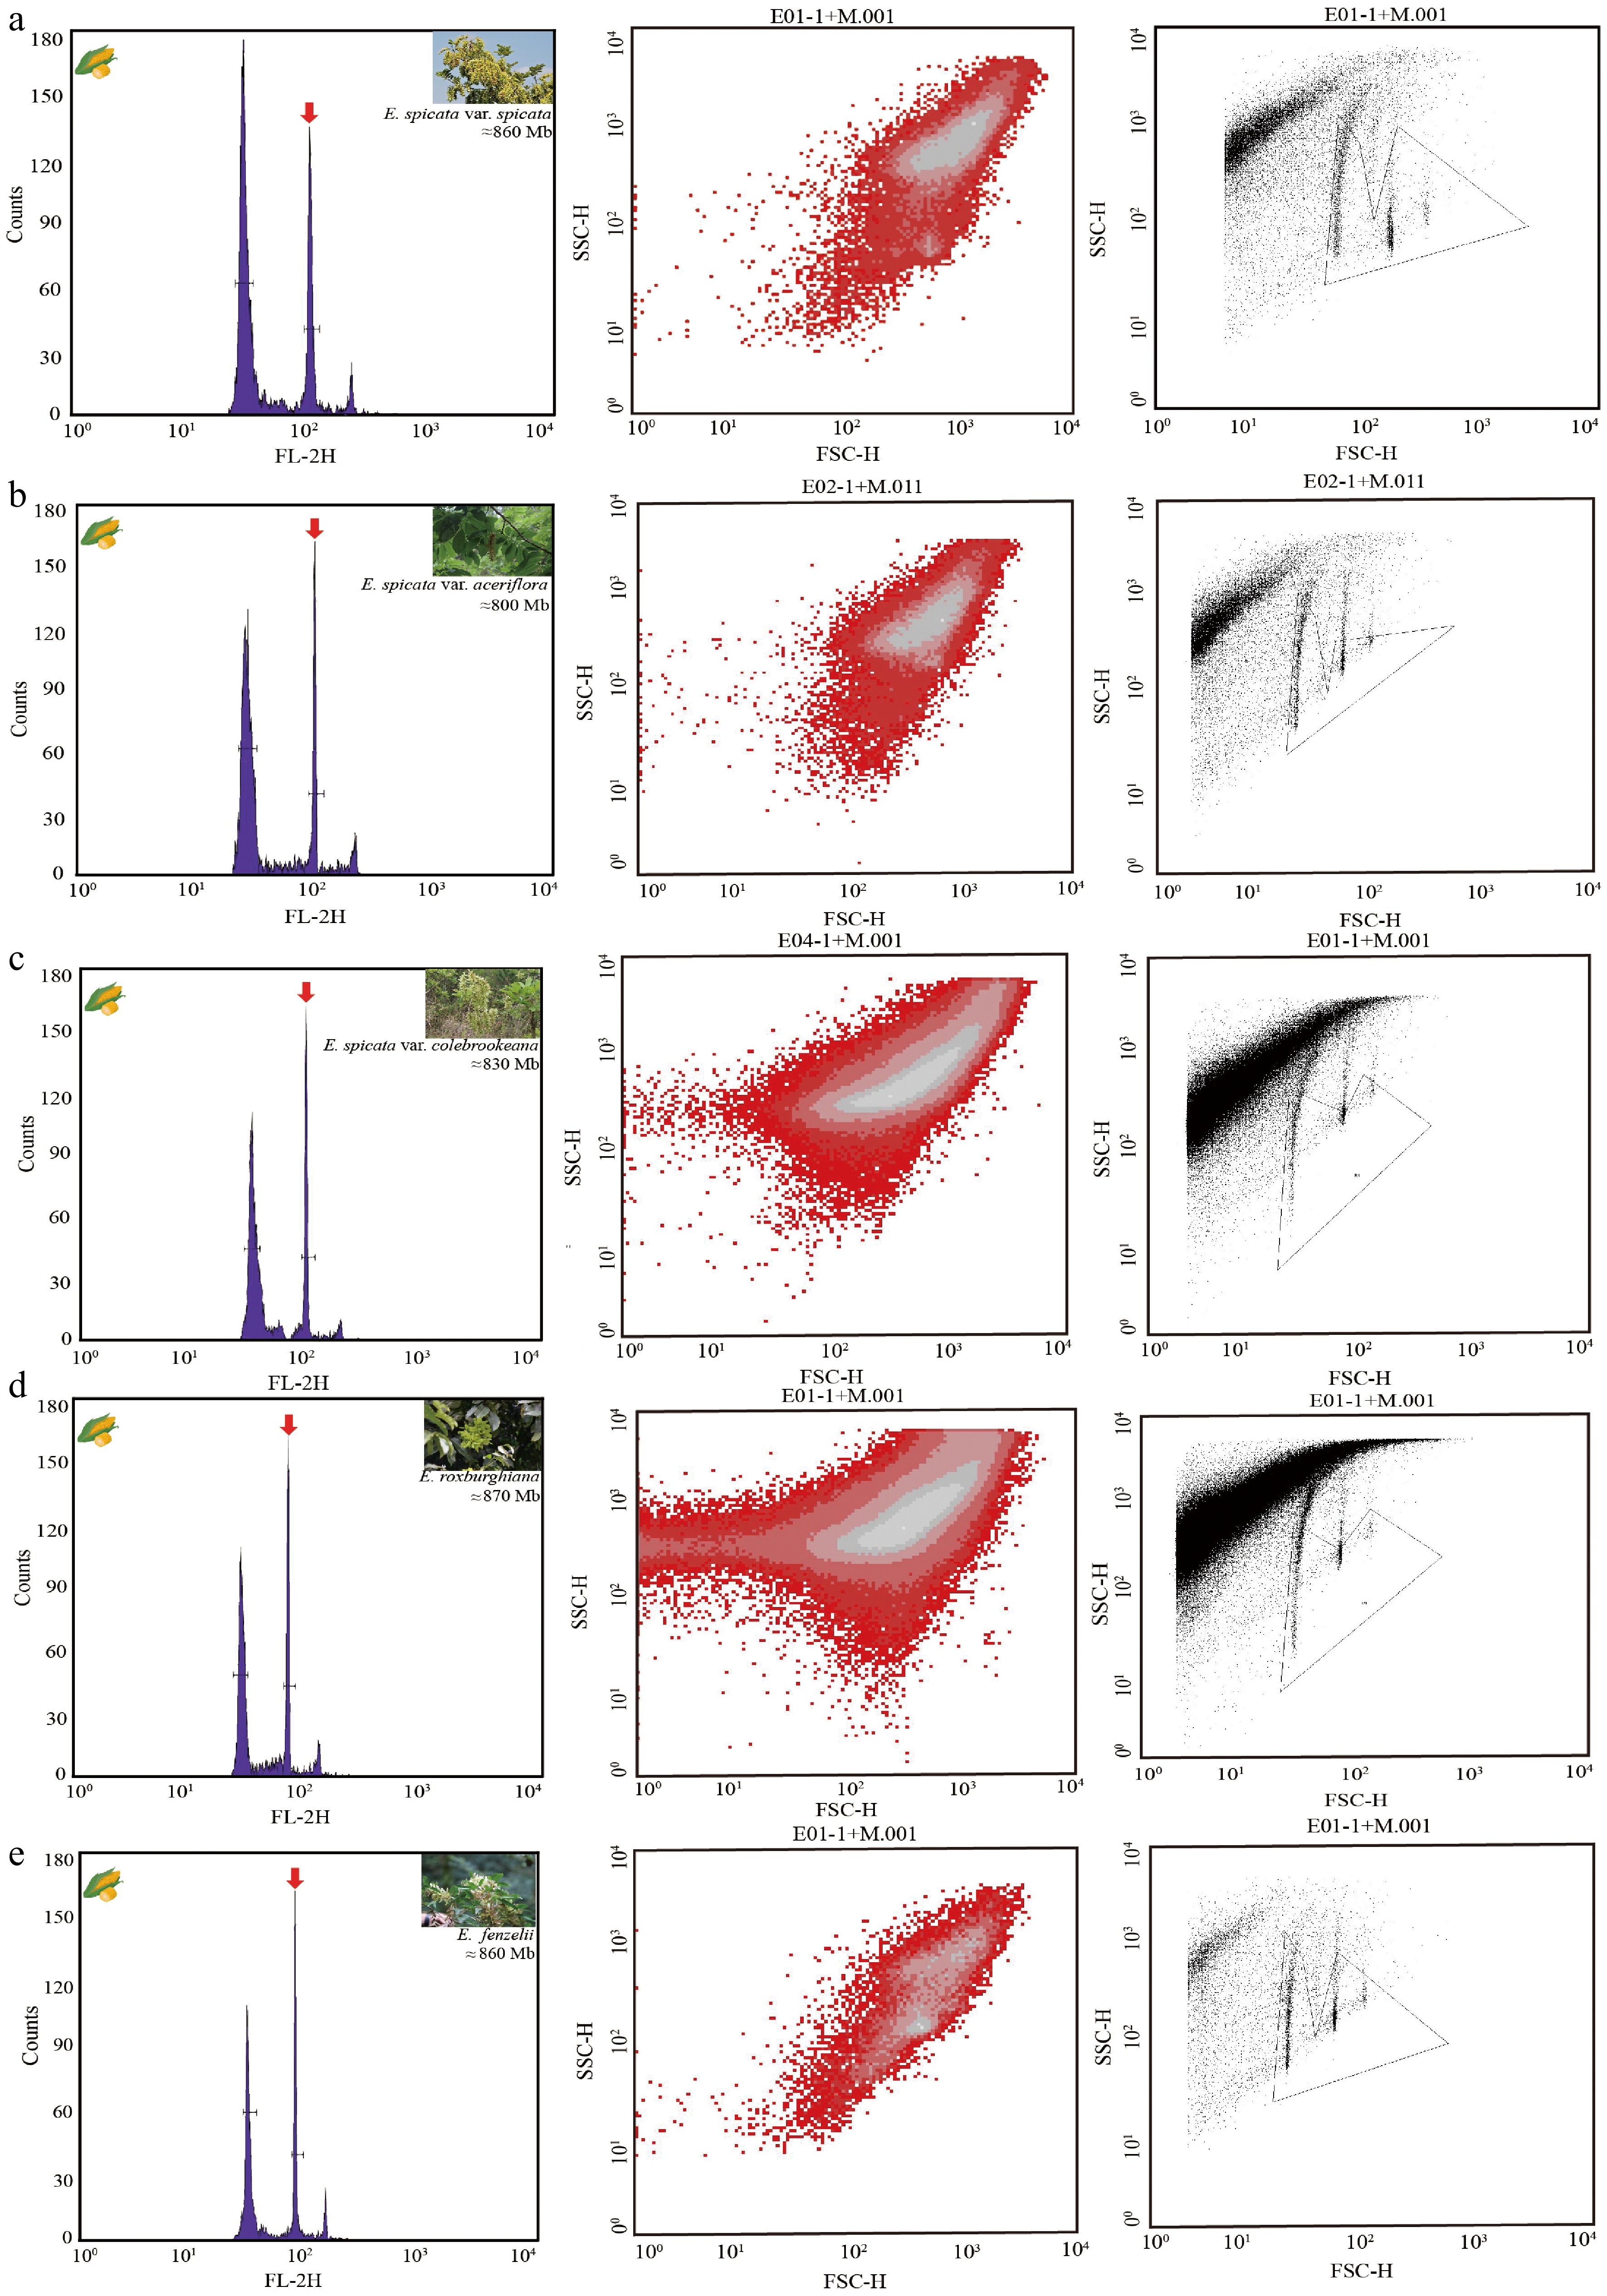
Figure 2.
FCM histograms and scatter plots of estimated nuclear DNA content in five Engelhardia species. (a)–(e) represent different species or varieties of Engelhardia, showing the FCM results from the same sample. Left: fluorescence intensity histogram (FL-2H) indicating the relative nuclear DNA content, with the major G1 peaks marked by red arrows. Middle: dot plots of forward scatter (FSC-H) versus side scatter (SSC-H), showing cell/nuclei size and granularity. Right: corresponding gated regions for nuclei selection in FSC-SSC space. (a) E. spicata var. spicata; estimated genome size ≈ 860 Mb. (b) E. spicata var. aceriflora; estimated genome size ≈ 800 Mb. (c) E. spicata var. colebrookeana; estimated genome size ≈ 830 Mb. (d) E. roxburghiana; estimated genome size ≈ 870 Mb. (e) E. fenzelii; estimated genome size ≈ 860 Mb. All measurements were performed using PI staining with an appropriate internal standard. Histograms show clearly separated peaks for the sample and standard, allowing a reliable estimation of genome size.
-
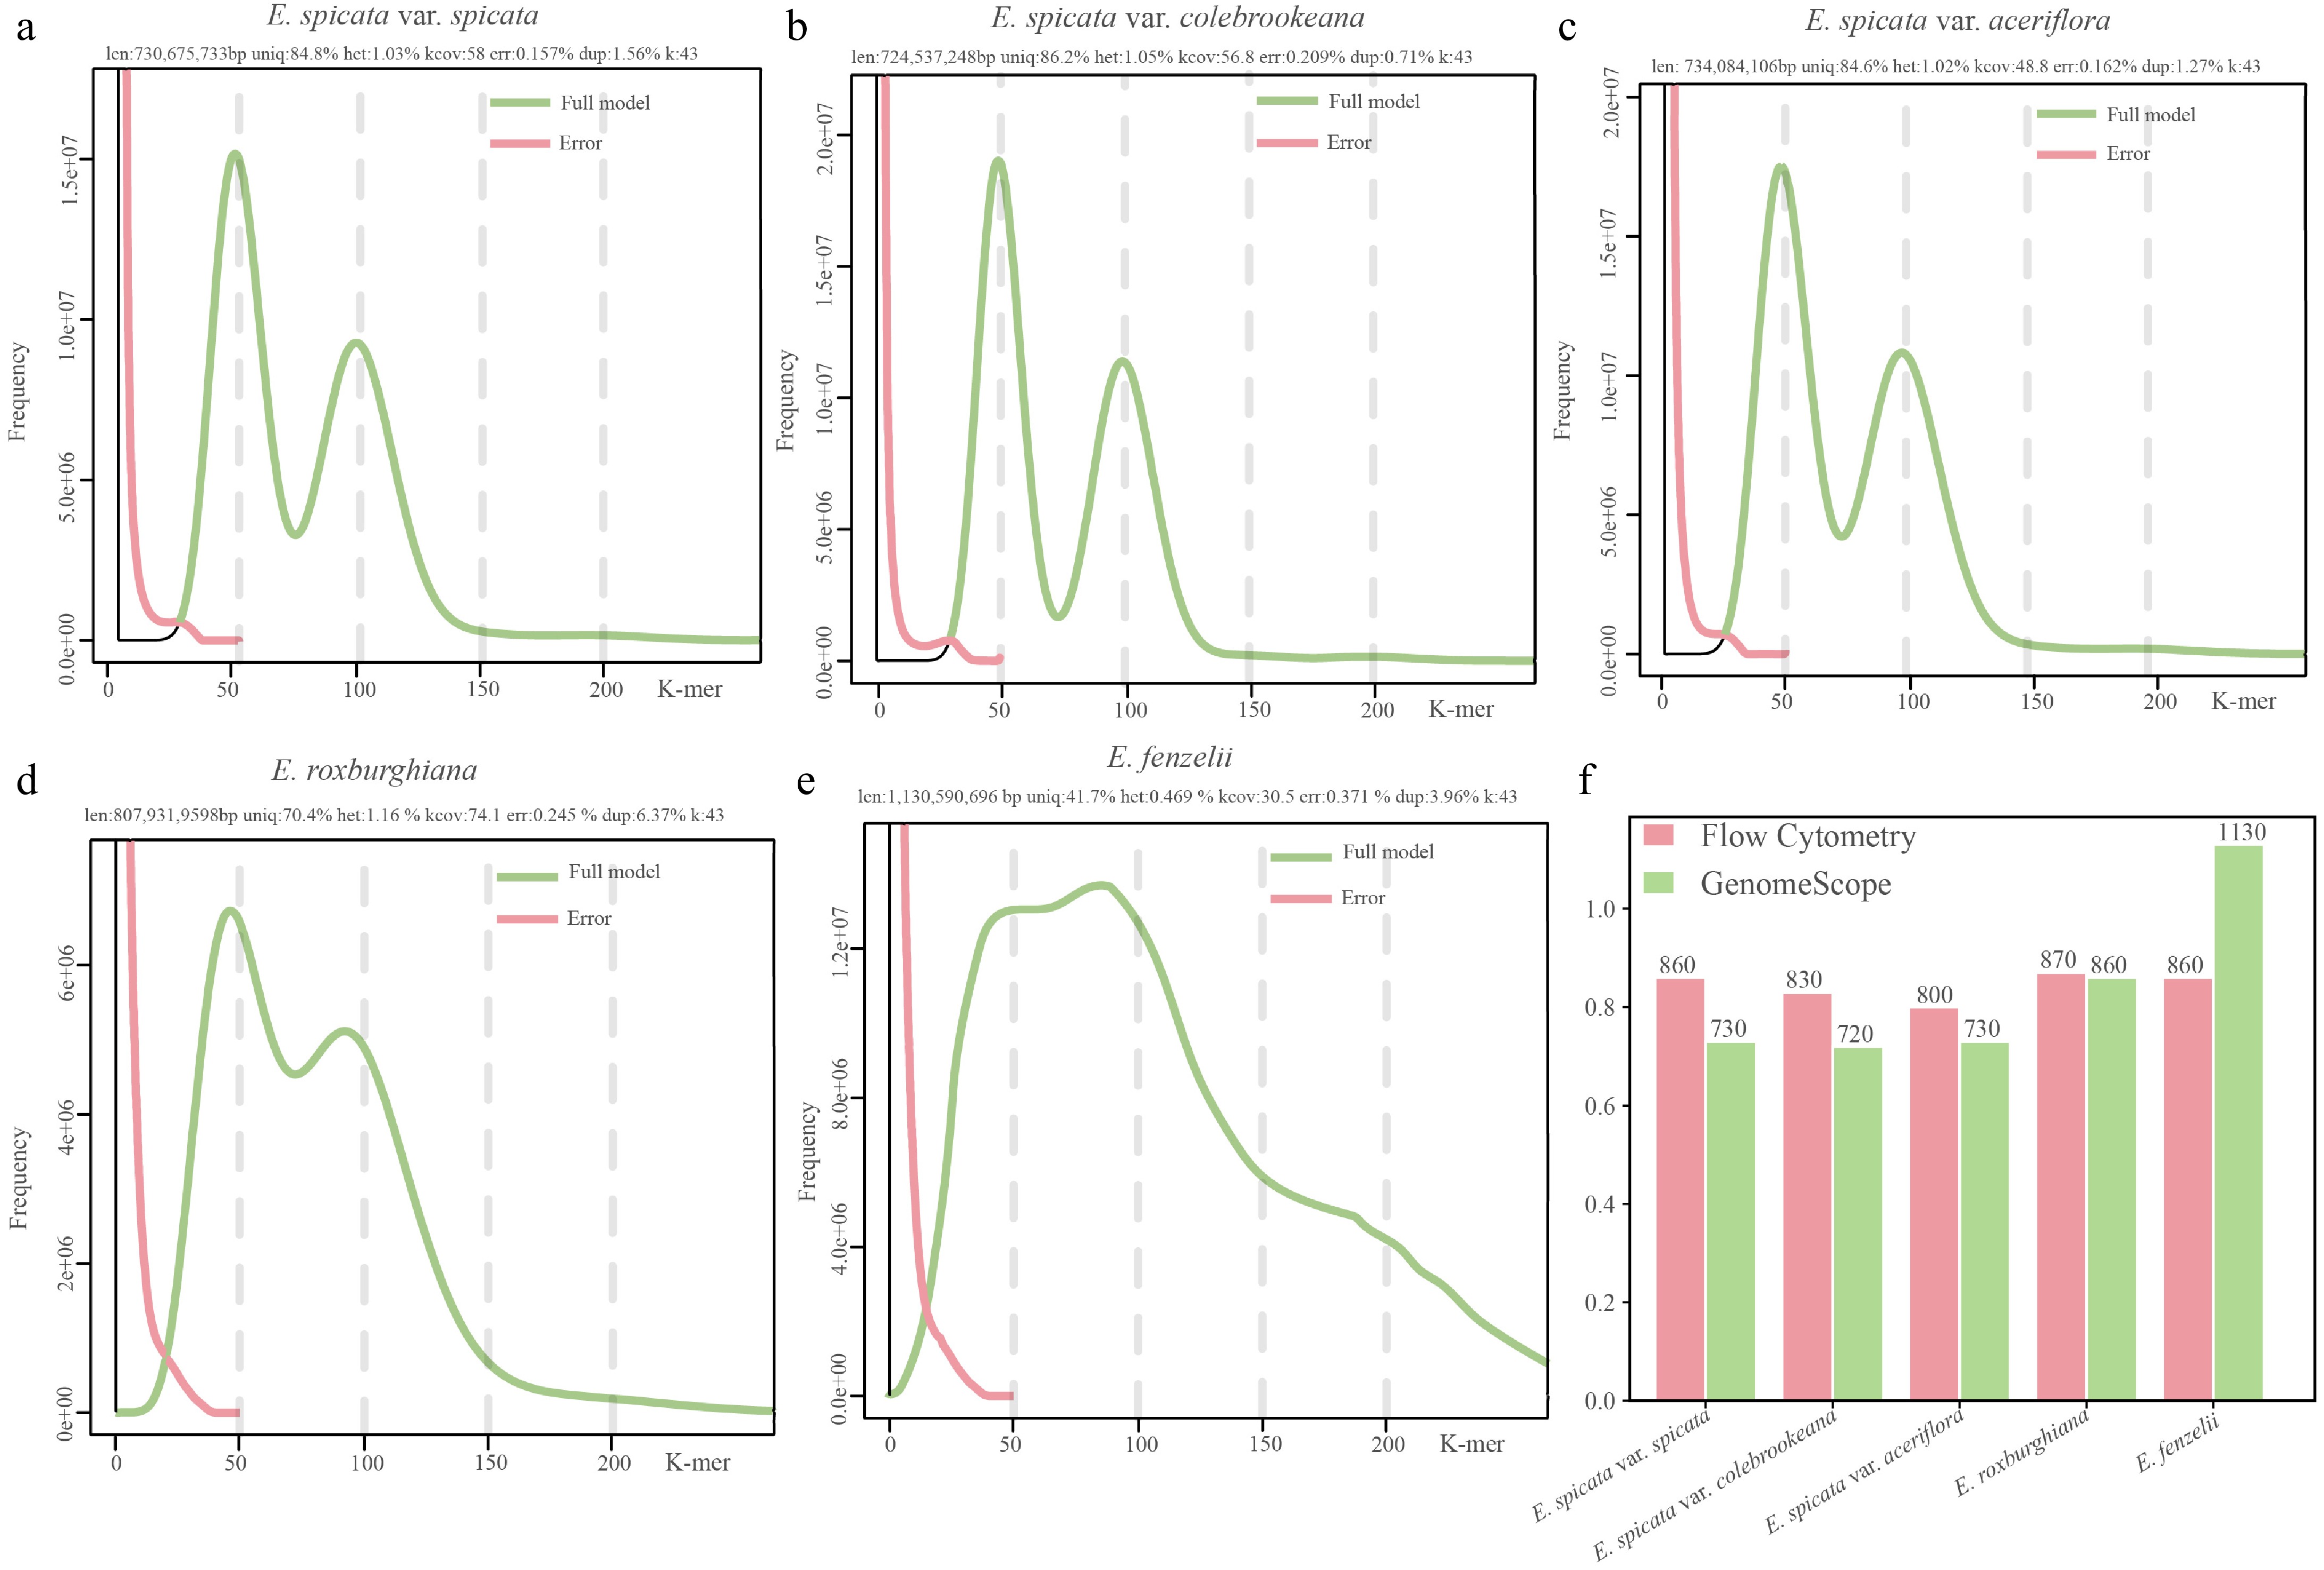
Figure 3.
Estimated genome size based on K-mer analysis and comparison with FCM measurements in five Engelhardia species. (a)–(e) K-mer frequency distributions and genome profiling results generated using GenomeScope2 for five Engelhardia taxa based on Illumina sequencing data (K = 43). The green curve represents the model's fit to the observed K-mer frequency histogram, while the pink curve shows the error. Key genome characteristics such as genome size, heterozygosity (het), unique sequence proportion (uniq), and sequencing error rate (err) are shown above each plot. (f) Comparison of genome size (Mb) estimates from FCM (pink bars) and K-mer analysis (green bars).
Figures
(3)
Tables
(0)