-
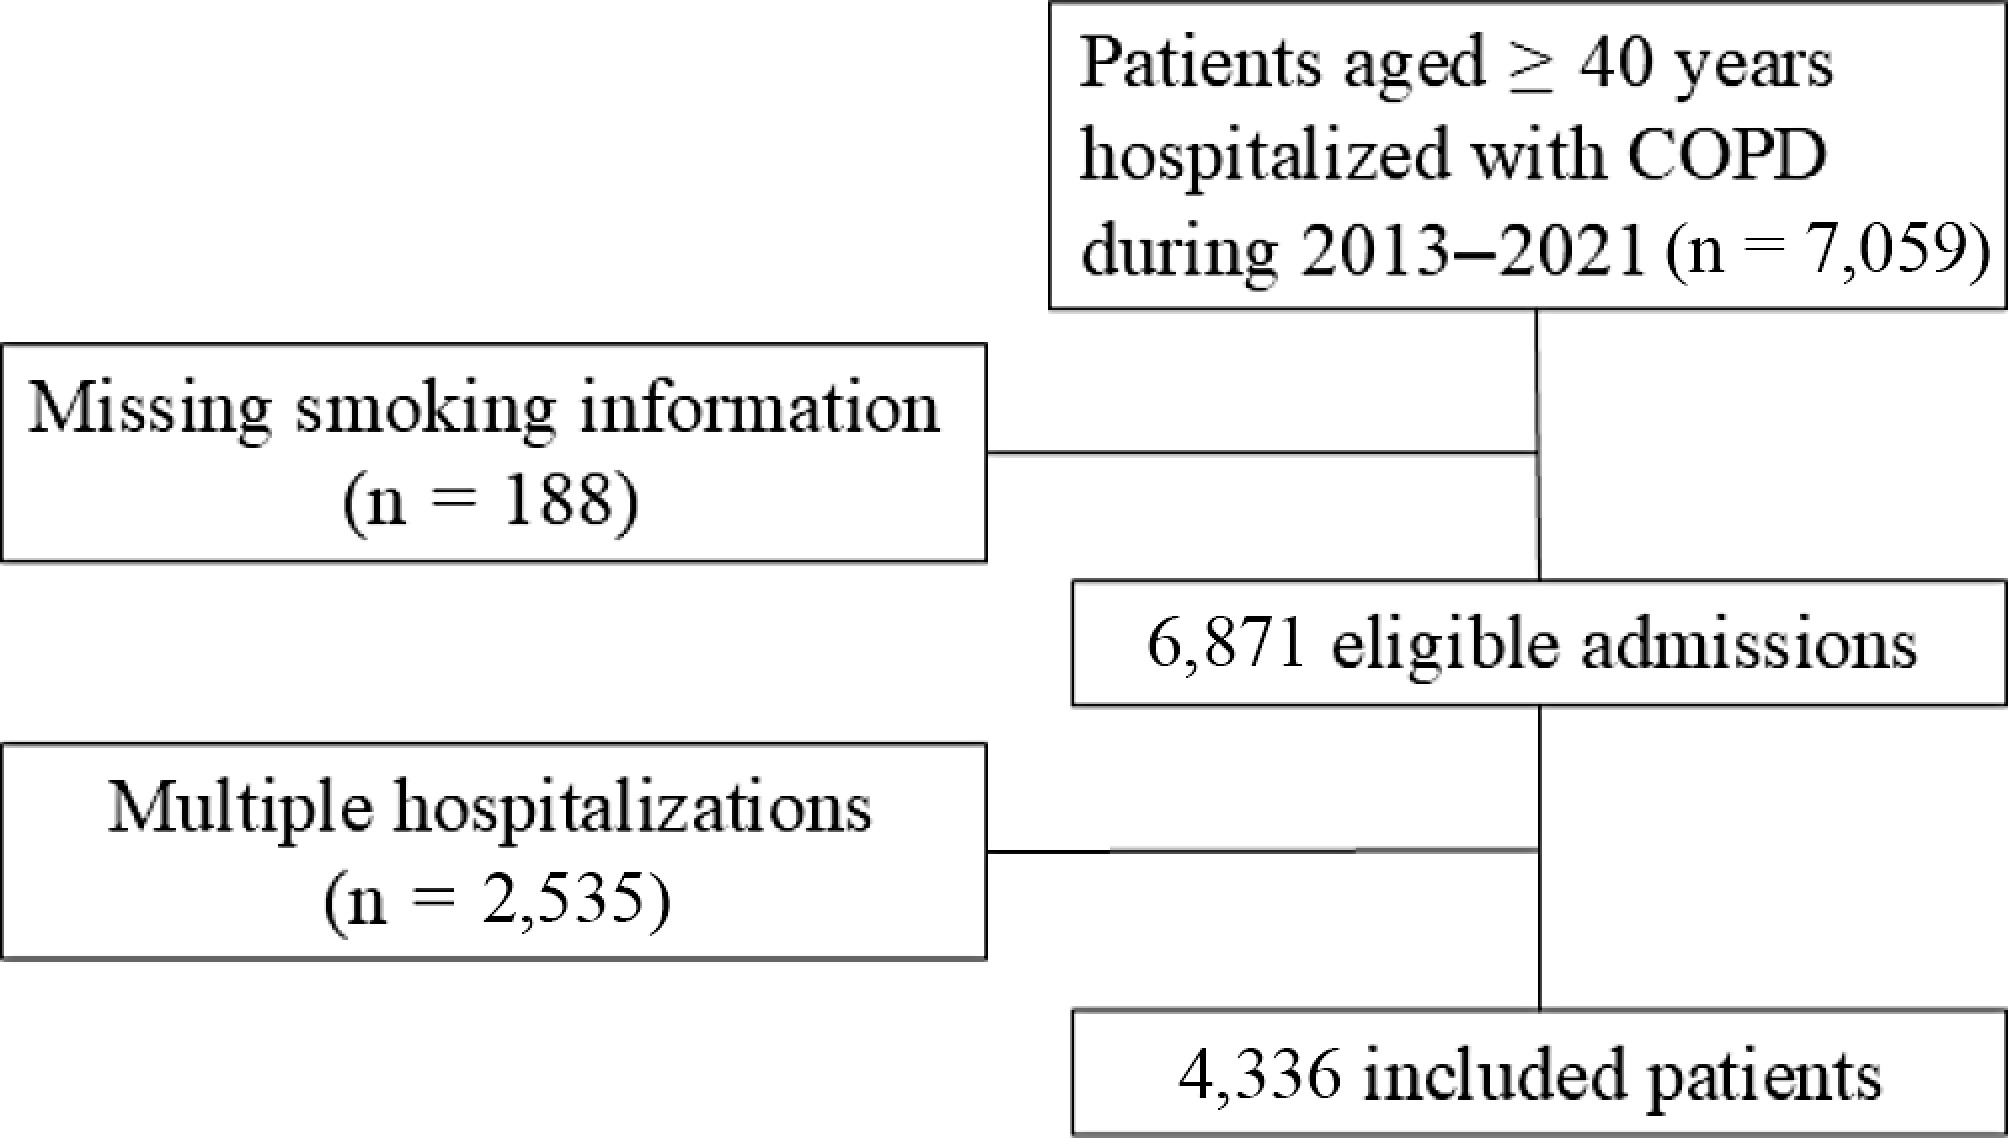
Figure 1.
Flowchart of patient inclusion.
-
Total Never smokers Ever smokers
< 40 pack-yearsEver smokers
≥ 40 pack-yearsp N (%) 4,336 1,175 (27.1) 1,527 (35.2) 1,634 (35.7) Male (%) 3,399 (78.4) 573 (48.8) 1271 (83.2) 1,555 (95.2) < 0.001 Age, M (IQR) 72 (64, 79) 75 (67, 82) 72 (64, 79) 69 (63, 77) < 0.001 Comorbidity, n (%) Asthma 618 (14.3) 195 (16.6) 222 (14.5) 201 (12.3) 0.005 Interstitial lung disease 142 (3.3) 31 (2.6) 484 (3.1) 63 (4.9) 0.190 Coronary heart disease 1067 (24.6) 301 (25.6) 375 (24.6) 397 (23.9) 0.591 Congestive heart failure 878 (20.2) 272 (23.1) 300 (19.6) 306 (18.7) 0.012 Cerebral vascular disease 624 (14.4) 198 (16.9) 216 (14.1) 210 (12.9) 0.011 Diabetes 819 (18.9) 260 (22.1) 272 (17.8) 287 (17.6) < 0.004 Cancer 225 (5.2) 35 (3.0) 89 (5.8) 101 (6.2) < 0.001 Charlson Comorbidity Index, n (%) 0.024 1 1,736 (40.0) 437 (37.2) 647 (42.4) 652 (39.9) ≥ 2 2,600 (60.0) 738 (62.8) 880 (57.6) 982 (60.1) AECOPD hospitalization in the past year, n (%) 1,440 (33.2) 332 (27.4) 517 (33.9) 601 (36.8) < 0.001 Emergency admission, n (%) 551 (12.7) 130 (11.1) 184 (12.0) 237 (14.5) 0.016 WBC (109/L), M (IQR) 6.9 (5.5, 8.9) 6.6 (5.4, 8.6) 6.9 (5.6, 9.0) 7.1 (5.6, 9.0) 0.001 Neutrophils (109/L), M (IQR) 4.7 (3.5, 6.6) 4.5 (3.3, 6.5) 4.7 (3.5, 6.8) 4.9 (3.5, 6.6) 0.007 Lymphocytes (109/L), M (IQR) 1.3 (0.9, 1.8) 1.3 (0.9, 1.9) 1.3 (0.9, 1.8) 1.3 (0.9, 1.8) 0.793 Neutrophil ratio,% 69.6 (60.7, 79.0) 69.8 (59.4, 79.3) 69.9 (61.5, 79.0) 69.2 (60.7, 79.0) 0.621 Eosinophils (/μL), M (IQR) 110 (20, 210) 100 (20, 200) 110 (20, 220) 120 (30, 230) <0.001 Basophils (/μL), M (IQR) 20 (10, 30) 20 (10, 30) 20 (10, 30) 20 (10, 30) < 0.001 ESR (mm/h) , M (IQR) 11.0 (4.0, 24.0) 13.0 (4.0, 26.0) 11.0 (3.0, 23.0) 10.0 (3.0, 22.0) < 0.001 Alb (g/L), M (IQR) 36.4 (33.2, 39.1) 35.8 (32.6, 38.6) 36.4 (33.2, 39.0) 36.8 (33.7, 39.4) < 0.001 Glb (g/L), M (IQR) 26.8 (23.5, 30.7) 27.8 (24.3, 31.7) 26.9 (23.6, 30.8) 26.0 (22.9, 29.9) < 0.001 ALT (U/L), M (IQR) 16.0 (12.0, 23.0) 16.0 (12.0, 23.0) 17.0 (12.0, 23.0) 16.0 (12.0, 23.0) 0.209 AST (U/L), M (IQR) 20.0 (16.0, 25.0) 20.0 (16.0, 26.0) 20.0 (16.0, 26.0) 19.0 (16.0, 25.0) 0.012 Cr (umol/L), M (IQR) 66.7 (55.9, 80.2) 65.0 (54.7, 80.0) 67.1 (56.1, 80.6) 67.2 (56.4, 79.7) 0.064 BUN (umol/L), M (IQR) 5.8 (4.7, 7.4) 5.8 (4.6, 7.4) 5.8 (4.6, 7.5) 5.9 (4.7, 7.3) 0.566 AECOPD, acute exacerbation of chronic obstructive pulmonary disease; WBC, white blood cells; ESR, erythrocyte sedimentation rate; Alb, albumin; Glb, globulin; TBIL, total bilirubin; DBIL, direct bilirubin; IBIL, indirect bilirubin; AST, aspartate aminotransferase; ALT, alanine aminotransferase; Cr, creatinine; BUN, blood urea nitrogen. Table 1.
Baseline characteristics of AECOPD inpatients by different smoking groups.
-
Total Never smokers Ever smokers
< 40 pack-yearsEver smokers
≥ 40 pack-yearsp Antibiotics Antibiotics use, n (%) 4,074 (94.0) 1,083 (92.2) 1,445 (94.6) 1,546 (94.6) 0.011 Antibiotics course (d), M (IQR) 9 (13, 19) 9 (12, 18) 9 (12, 18) 9 (13, 19) 0.125 Combination of ≥ 2 antibiotics, n (%) 2,233 (51.5) 578 (49.2) 791 (51.8) 864 (52.9) 0.149 Corticosteroids Corticosteroids use, n (%) 3,338 (77.0) 852 (72.5) 1,197 (78.4) 1,289 (78.9) < 0.001 Corticosteroids dose (mg), M (IQR) 200 (120, 280) 200 (94, 320) 187 (120, 280) 187 (120, 280) 0.492 Corticosteroids course (d), M (IQR) 4 (2, 7) 5 (2, 7) 4 (2, 7) 4 (2, 7) 0.714 Table 2.
Characteristics of in-hospital antibiotics and corticosteroids treatment for AECOPD by smoking groups.
-
Never smokers Ever smokers
< 40 pack-yearsEver smokers
≥ 40 pack-yearsNumber of cases (%) 1,175 (27.1) 1,527 (35.2) 1,634 (36.7) Antibiotics use,
OR (95% CI)Ref 1.84 (1.32−2.57) 1.80 (1.29−2.53) Corticosteroids use,
OR (95% CI)Ref 1.41 (1.17−1.71) 1.46 (1.20−1.78) Note: Logistic model adjusted for age (< 65 years = 0, ≥ 65 years = 1), gender (female = 0, male = 1), Charlson Comorbidity Index (score 1 = 0, score ≥ 2 = 1), emergency admission (no= 0, yes = 1), AECOPD hospitalization in the past year (no = 0, yes = 1), complex infection defined as comorbid pneumonia, bronchiectasis, or use mechanical ventilation (no = 0, yes = 1). Table 3.
The association of smoking history with antibiotics and corticosteroids use in AECOPD inpatients (OR and 95% CIs).
-
Never smokers Ever smokers
< 40 pack-yearsEver smokers
≥ 40 pack-yearsNumber of cases 1,175 1,527 1,634 In-hospital mortality N (%) 24 (2.0) 29 (1.9) 22 (1.3) Multi-adjusted OR (95% CI) Ref 0.98 (0.54−1.76) 0.68 (0.35−1.34) 30–day AECOPD readmission N (%) 76 (6.5) 107 (7.0) 90 (5.5) Multi-adjusted OR (95% CI) Ref 0.99 (0.72−1.38) 0.70 (0.49−1.00) 90–d AECOPD readmission N (%) 130 (11.1) 202 (13.2) 234 (14.3) Multi-adjusted OR (95% CI) Ref 1.09 (0.85−1.41) 1.13 (0.87−1.47) 1–year AECOPD readmission N (%) 274 (23.0) 444 (29.1) 535 (32.7) Multi-adjusted OR (95% CI) Ref 1.24 (1.02−1.51) 1.43 (1.17−1.76) Note: Logistic model adjusted for age (< 65 years = 0, ≥ 65 years = 1), gender (female = 0, male = 1), Charlson Comorbidity Index (score 1 = 0, score ≥ 2 = 1), emergency admission (no = 0, yes = 1), AECOPD hospitalization in the past year (no = 0, yes = 1), complex infection defined as comorbid pneumonia, bronchiectasis, or use mechanical ventilation (no = 0, yes = 1), antibiotics use (no = 0, yes = 1), and corticosteroids use (no = 0, yes = 1). Table 4.
The association of smoking history with in-hospital mortality and AECOPD readmission risk.
Figures
(1)
Tables
(4)