-
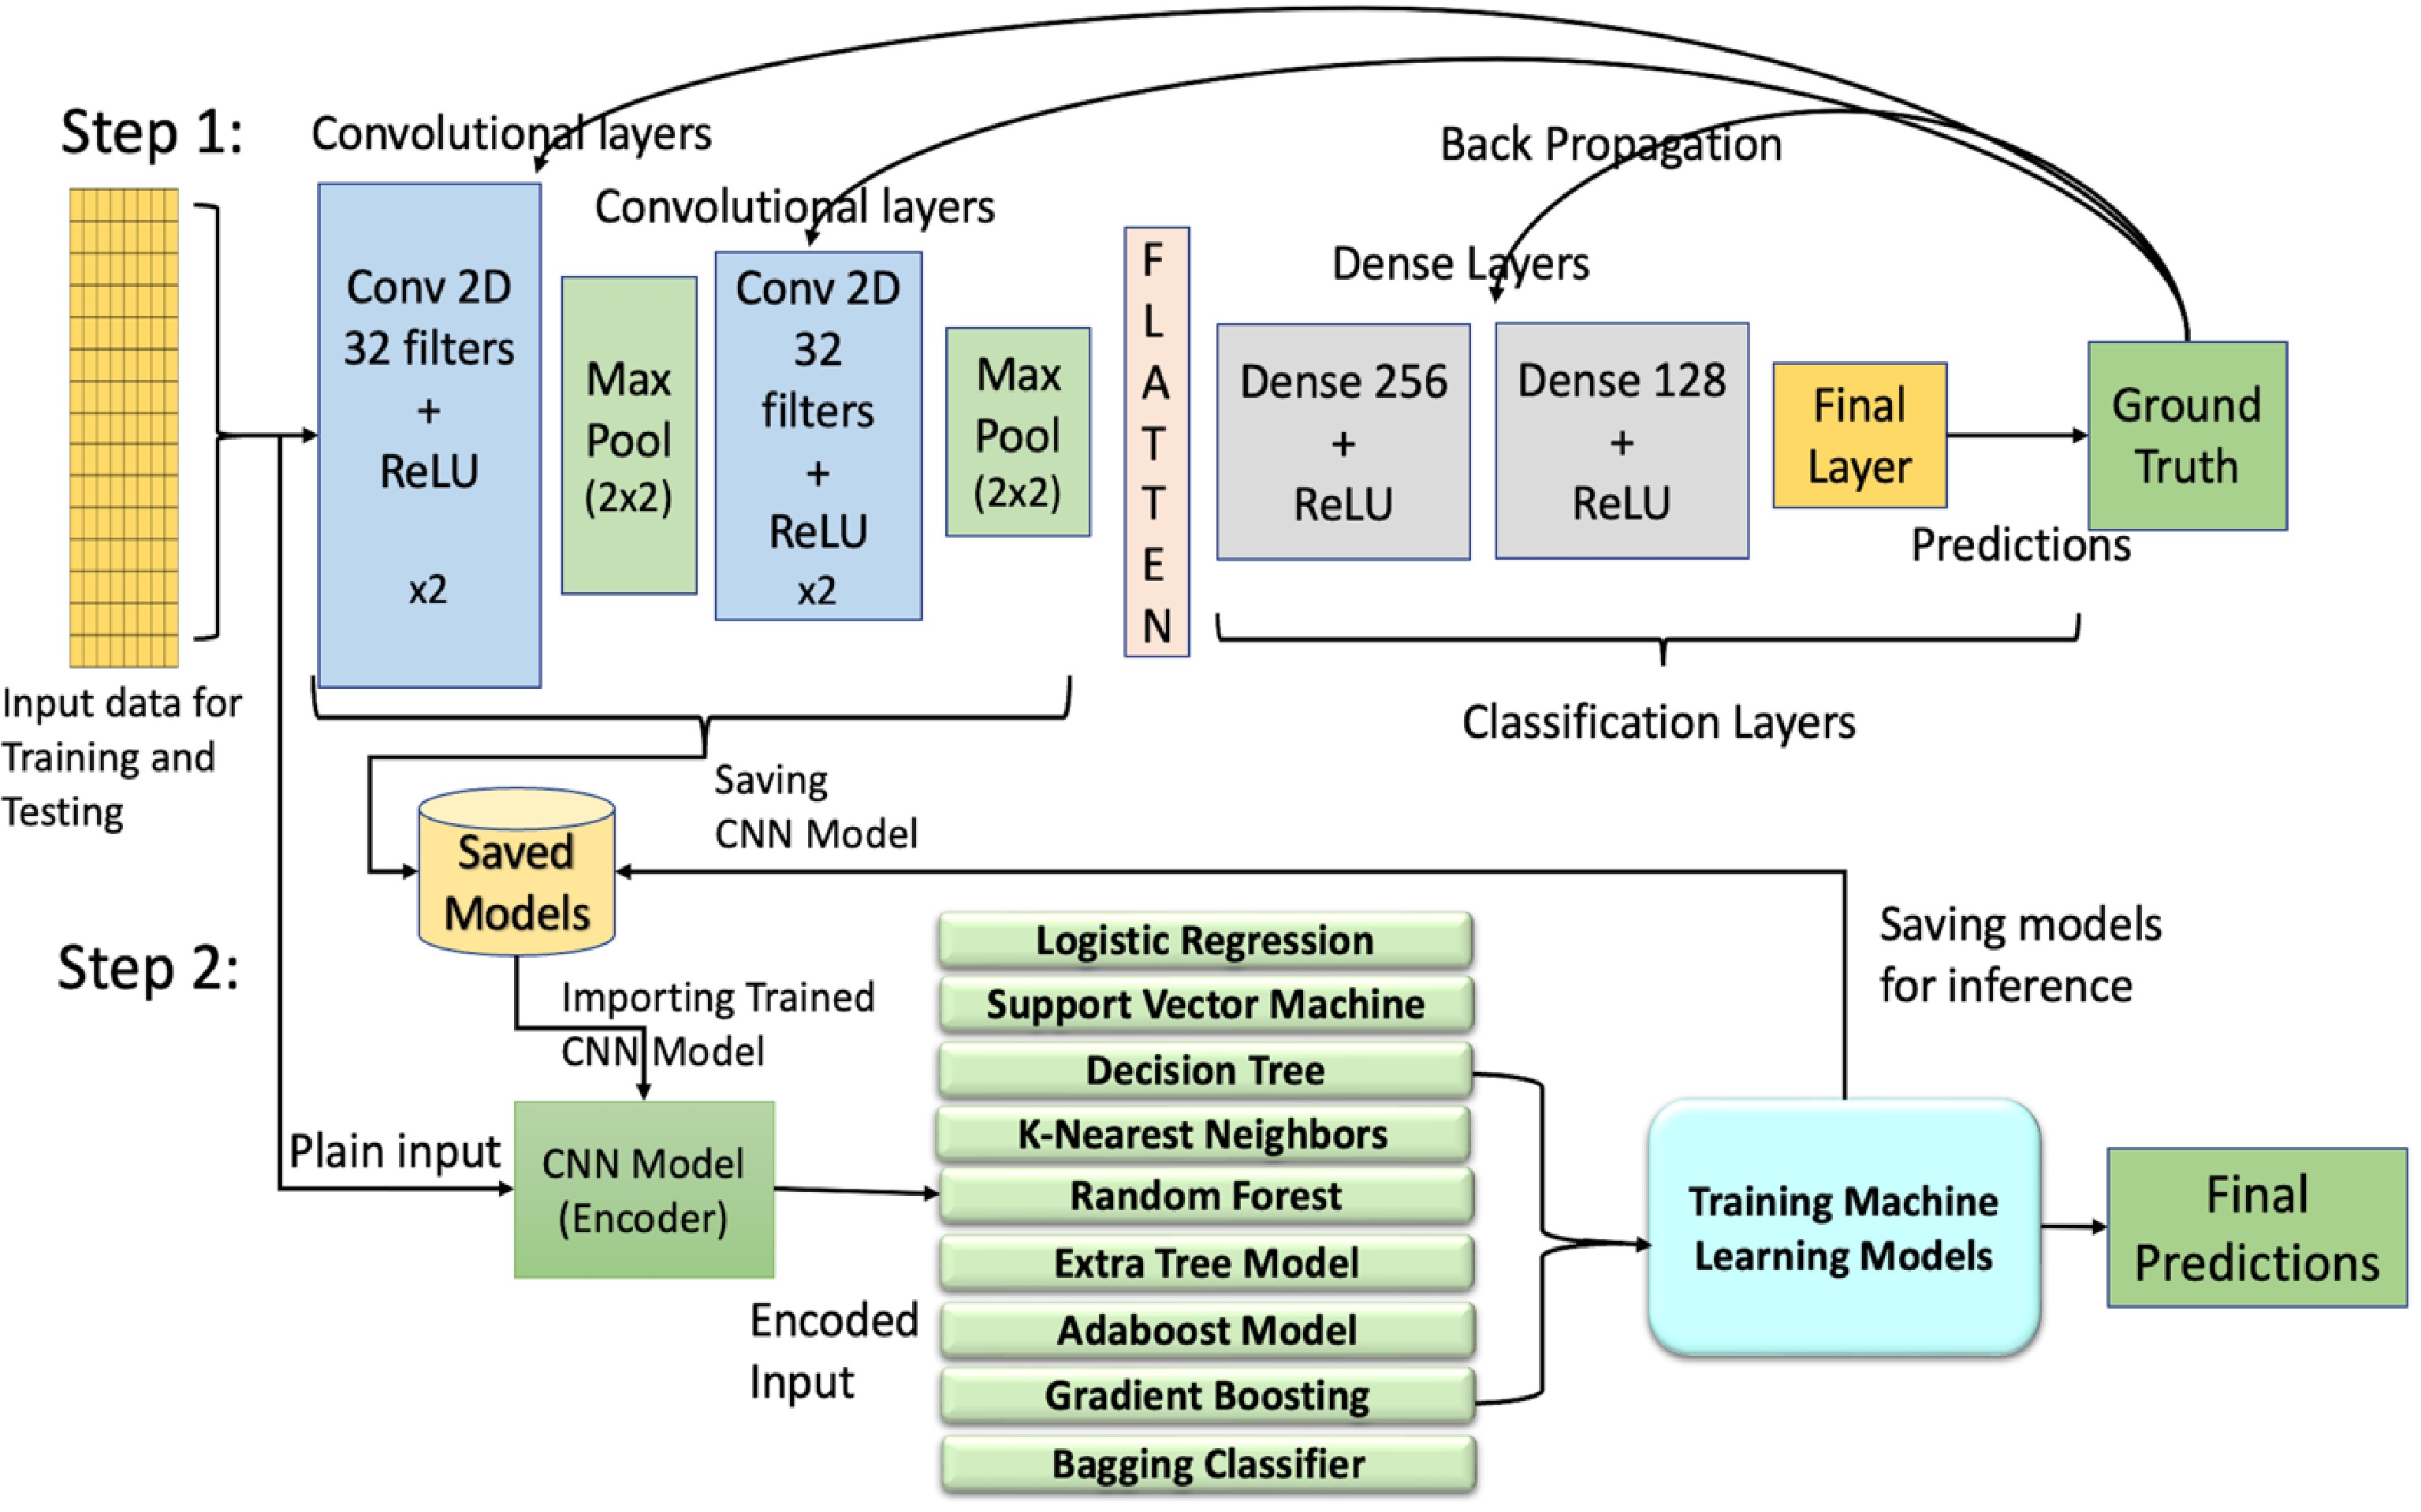
Figure 1.
Illustration of the architectures of hybrid models combining machine learning (ML) and deep learning (DL) approaches. Step 1 includes training of the convolutional neural networks (CNN) using back propagation while Step 2 uses the outputs from the convolutional encoder/feature extractor of Step 1 to train ML models. Conv, convolutional layer; ReLU, rectified linear unit.
-
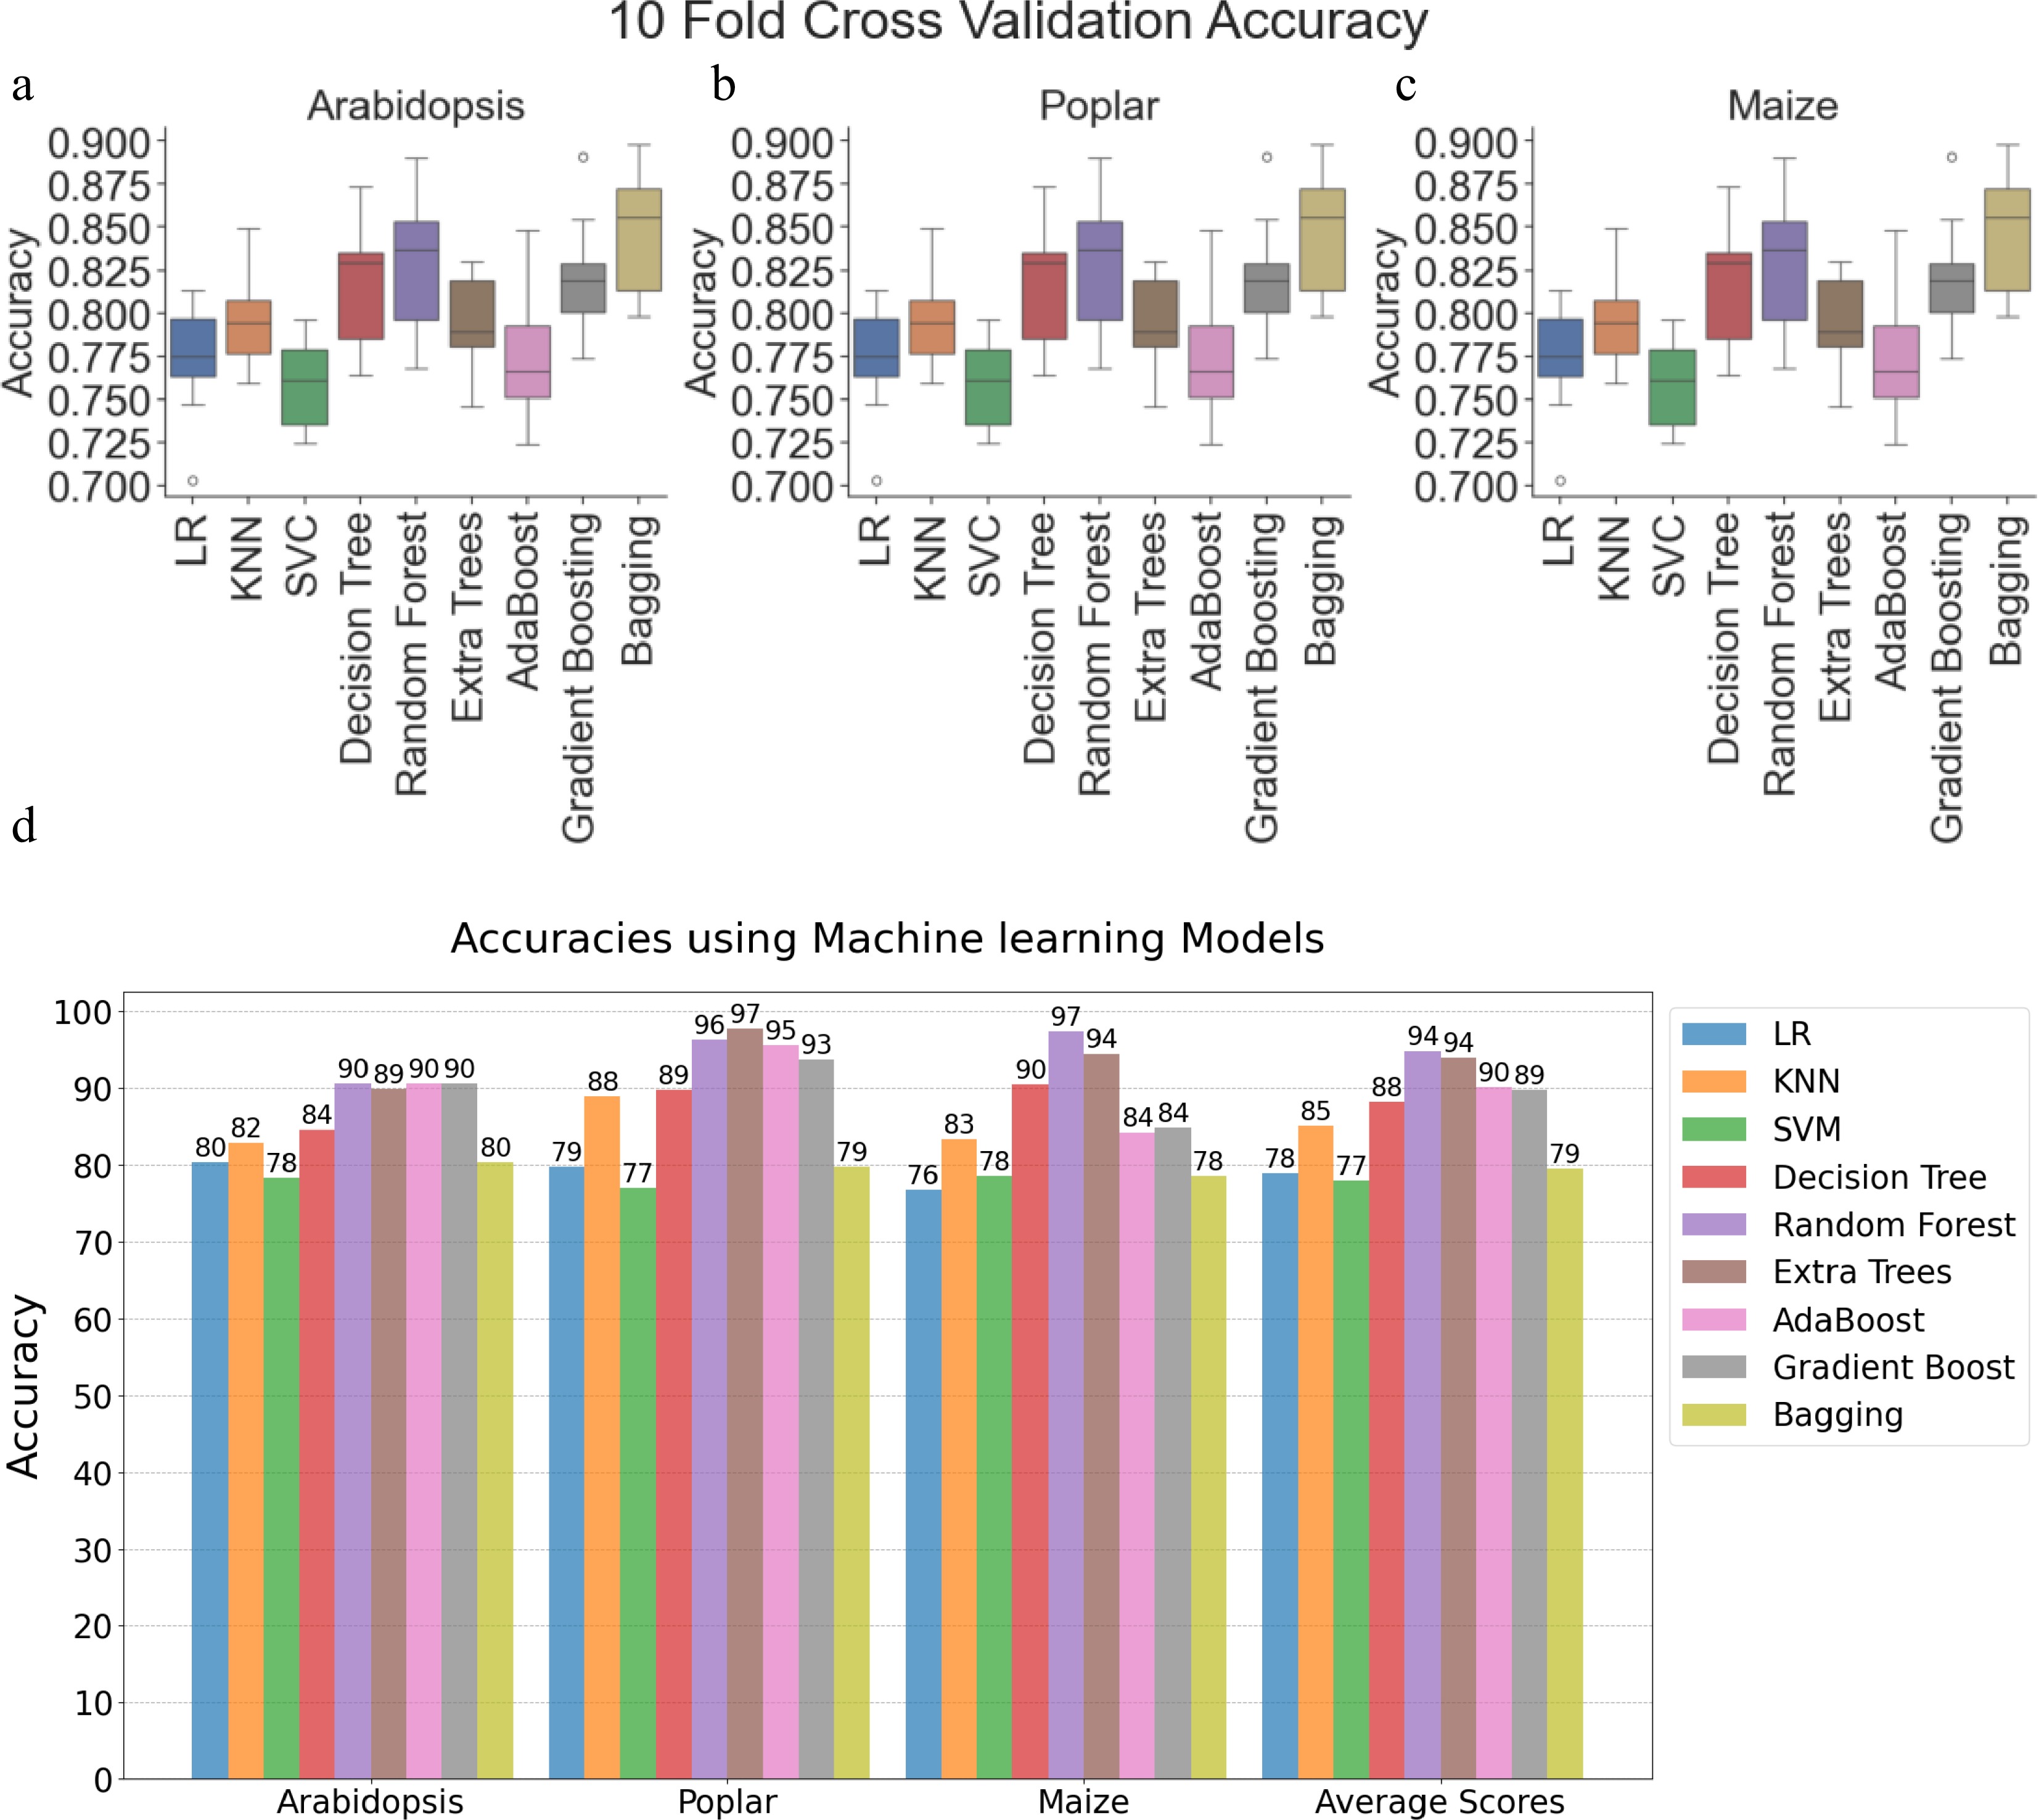
Figure 2.
Performance evaluation of machine learning models and convolutional neural networks on Arabidopsis, poplar, and maize datasets. Boxplots showing 10-fold cross-validation accuracies for Logistic Regression, K-Nearest Neighbors (KNN), Support Vector Classifier (SVC), Decision Tree, Random Forest, Extremely Randomized Trees (ExtraTrees), AdaBoost, Gradient Boosting, and Bagging on training data for (a) Arabidopsis, (b) poplar, and (c) maize. (d) Clustered bar chart comparing model accuracies within and across species using holdout test data (20% of training data). Each bar corresponds to a specific model's performance. LR: Logistic Regression, SVM: Support Vector Machine, KNN: K-Nearest Neighbor.
-
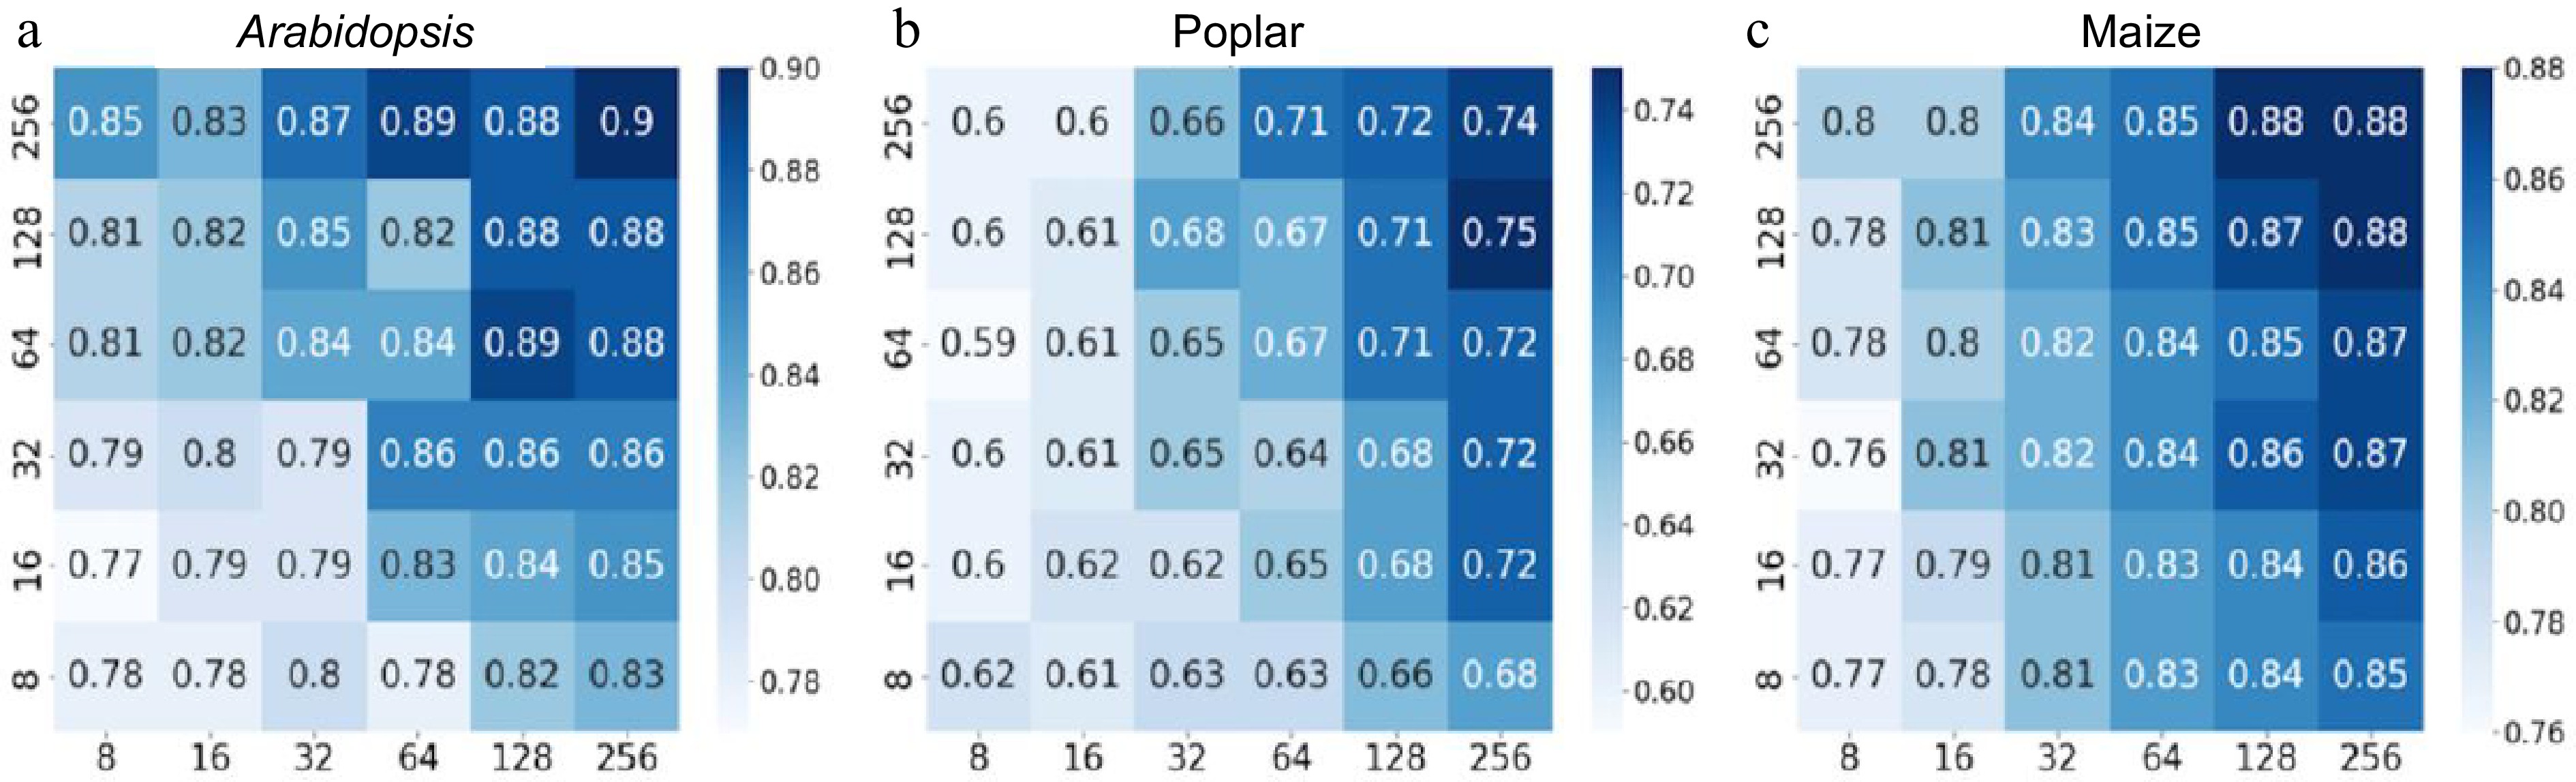
Figure 3.
Heatmaps depicting accuracy values of convolutional neural networks (CNN) with varying numbers of kernels in the first and second layers. The y-axis represents the number of kernels in the first layer of the CNN, whereas the x-axis represents the number of kernels in the second layer. Binary cross-entropy was used as the loss function for the CNN, and the performance was evaluated on a 20% holdout test set of the Arabidopsis, poplar, and maize training data. The scale bars represent a series of accuracy values. (a) CNN accuracy on Arabidopsis holdout data. (b) CNN accuracy on poplar holdout data. (c) CNN accuracy on maize holdout data.
-
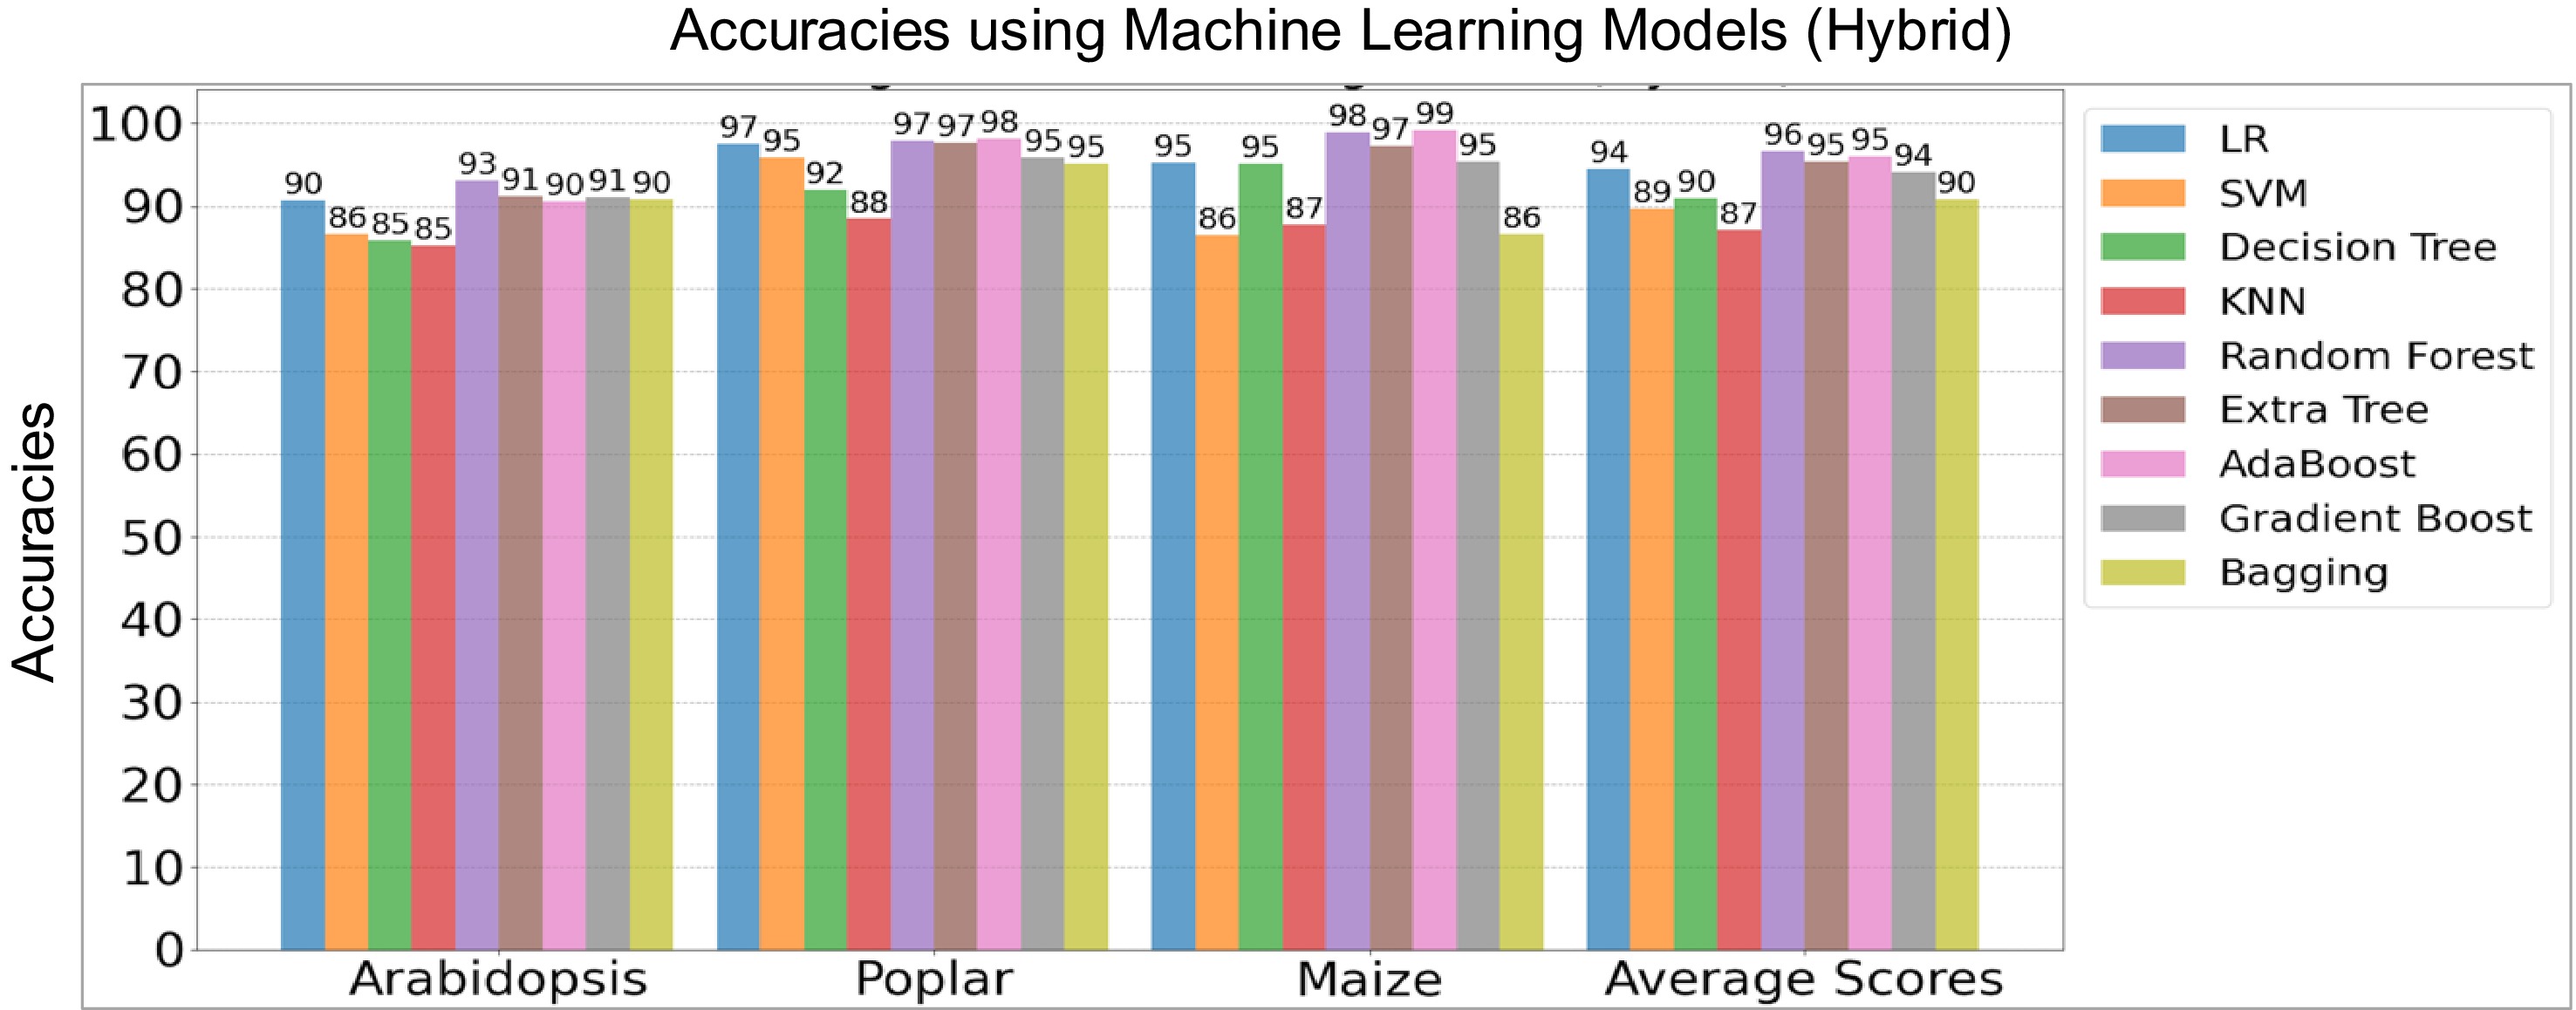
Figure 4.
Performance comparison of hybrid machine learning (ML) and deep learning (DL) models on the holdout test data sets of three species. The y-axis denotes model accuracies for Arabidopsis, poplar, and maize, including average scores while the x-axis lists the species, including average scores of three species. LR, Logistic Regression, SVM, Support Vector Machine, and KNN, K-Nearest Neighbors.
-
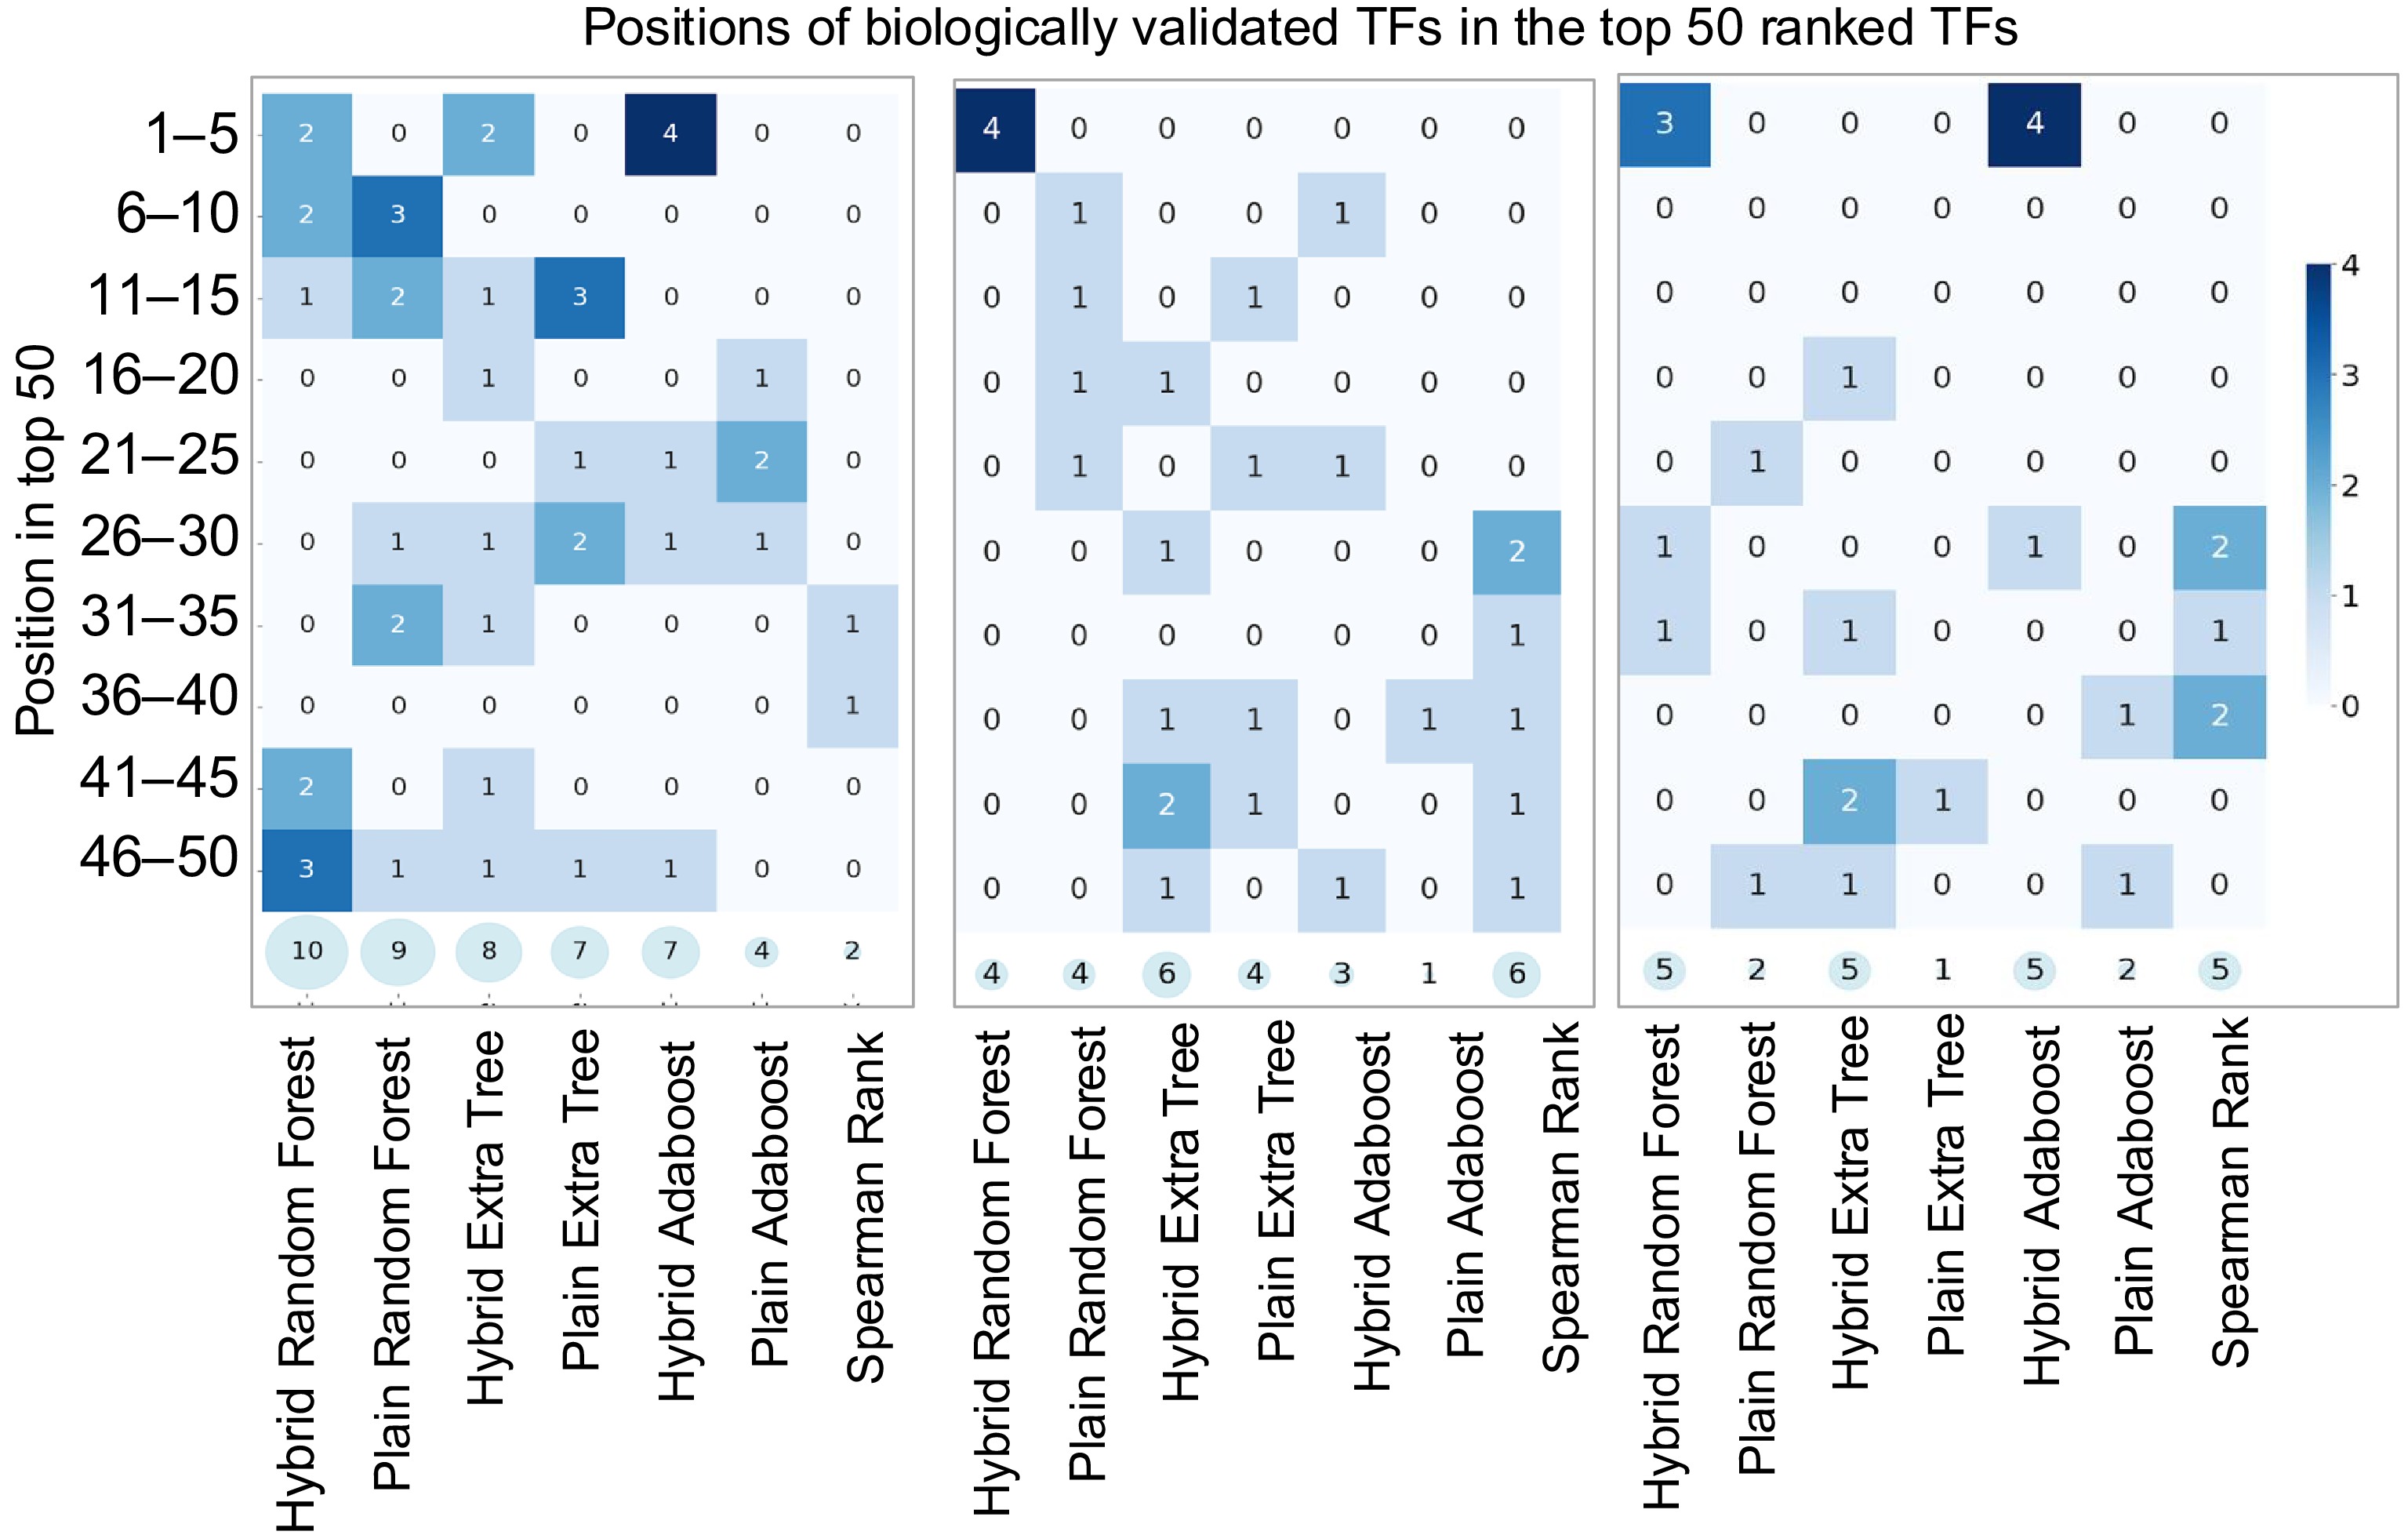
Figure 5.
Heatmaps illustrating model performance on Arabidopsis, Poplar, and Maize Transcriptomic Test Datasets. The x-axis lists models, while the y-axis groups correct predictions within ranked intervals (e.g., 1–5, 6–10, …, 45–50). Darker scheme color indicates higher accuracy, and semi-transparent circles at the bottom of each plot display the total correct predictions in the top 50 genes.
-
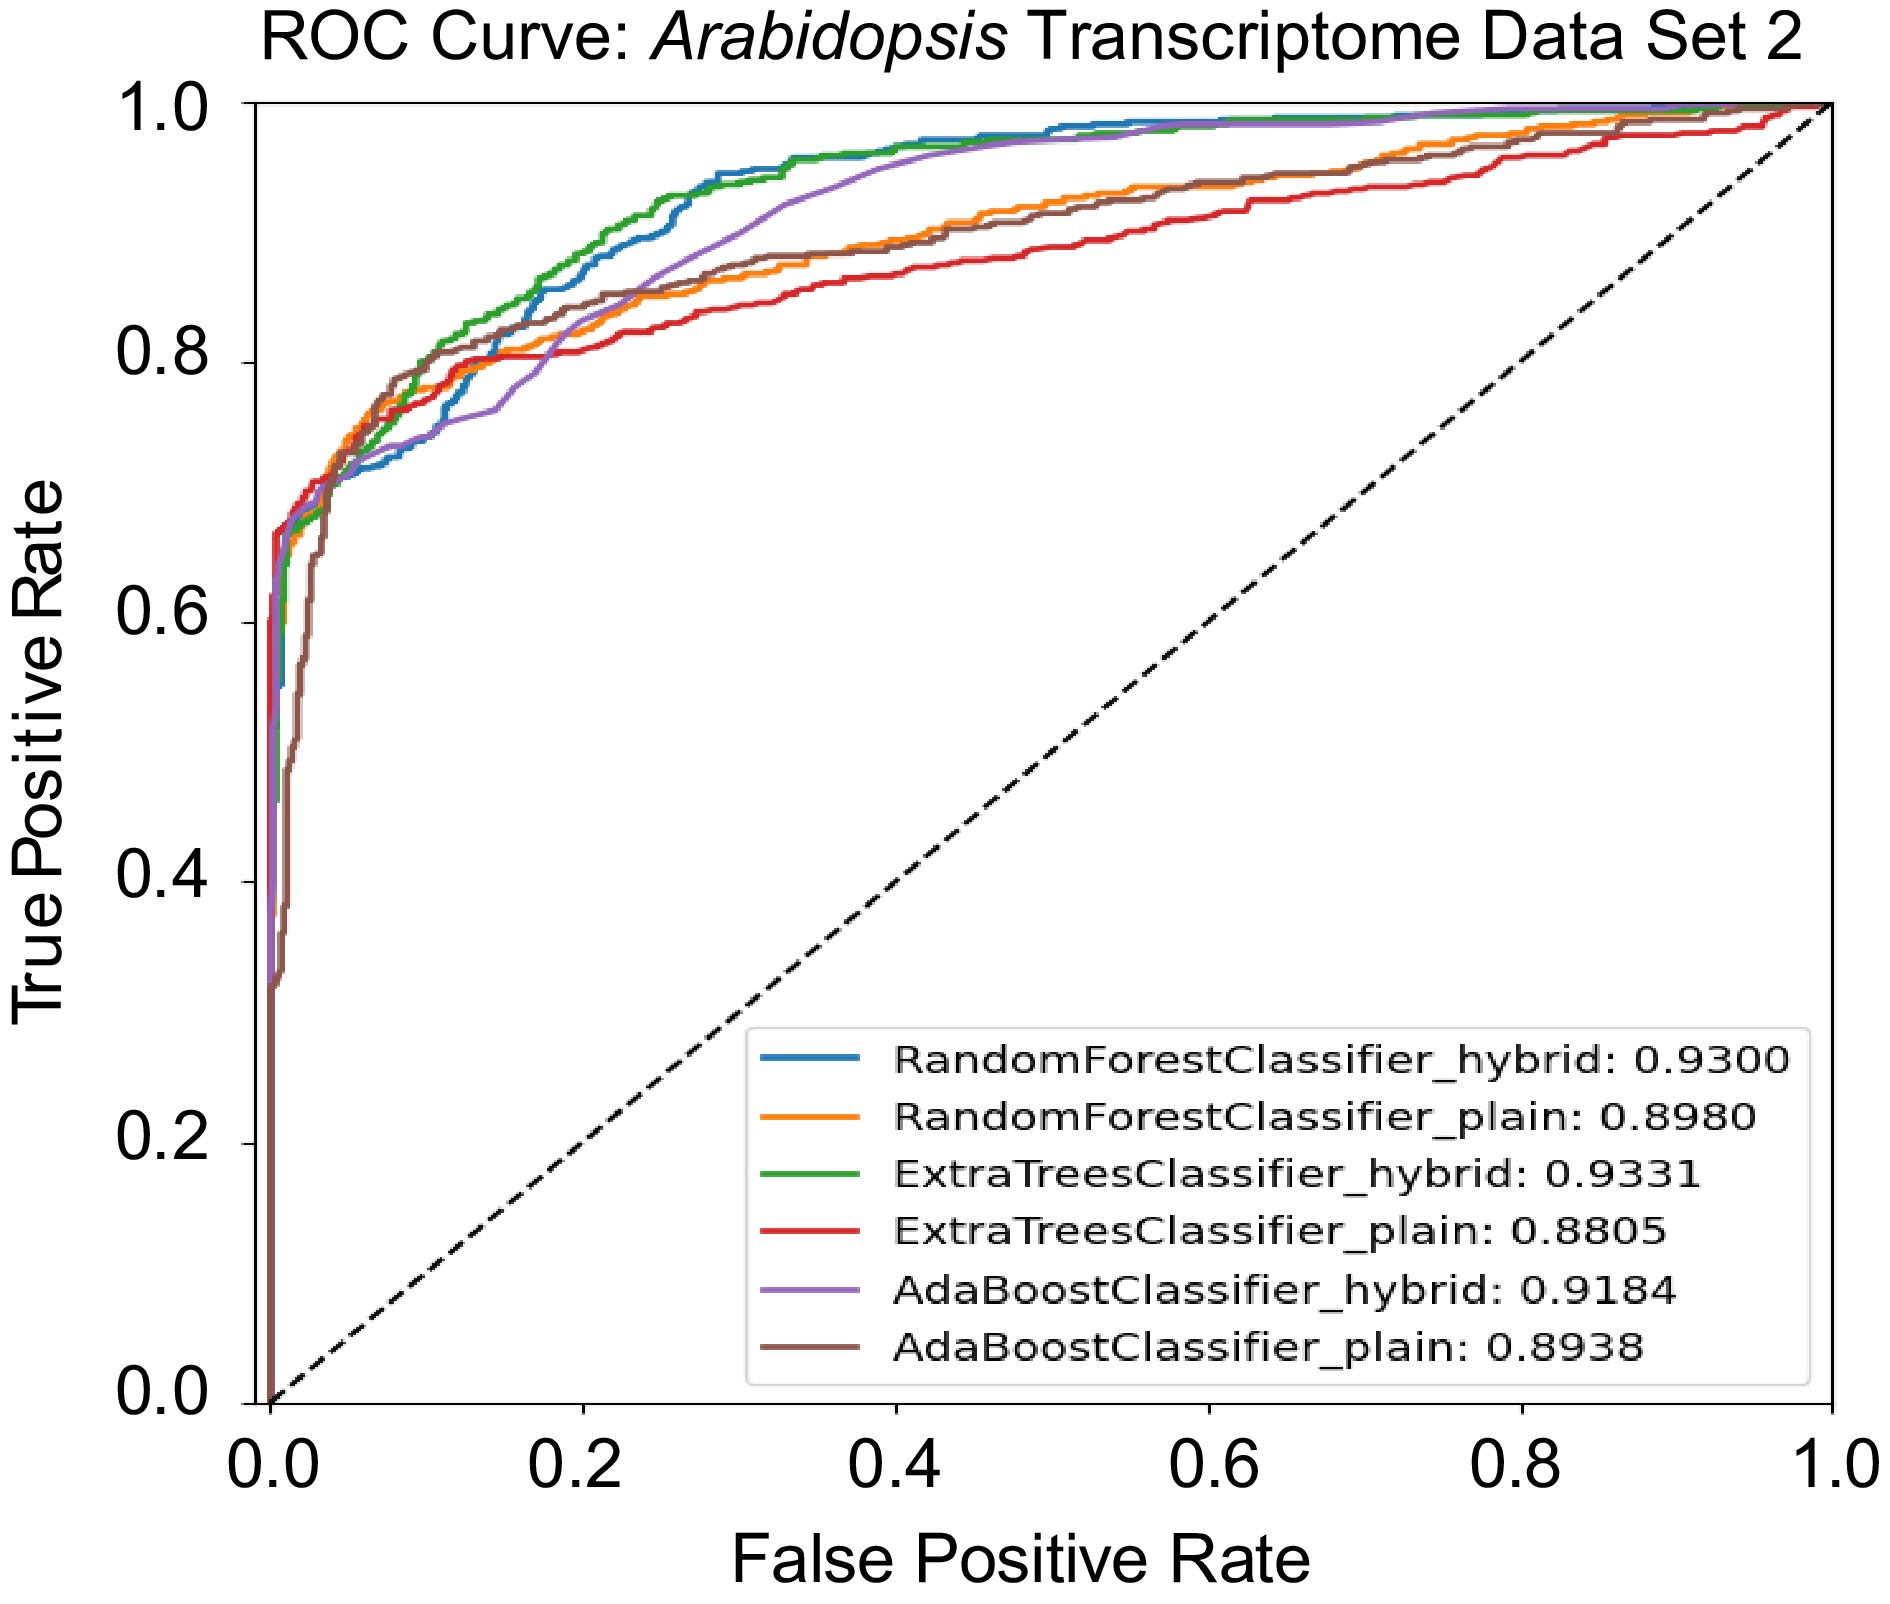
Figure 6.
Receiver operating characteristic (ROC) curves comparing the performance of hybrid and plain models on the Arabidopsis Transcriptomic Test Data Set 2.
-
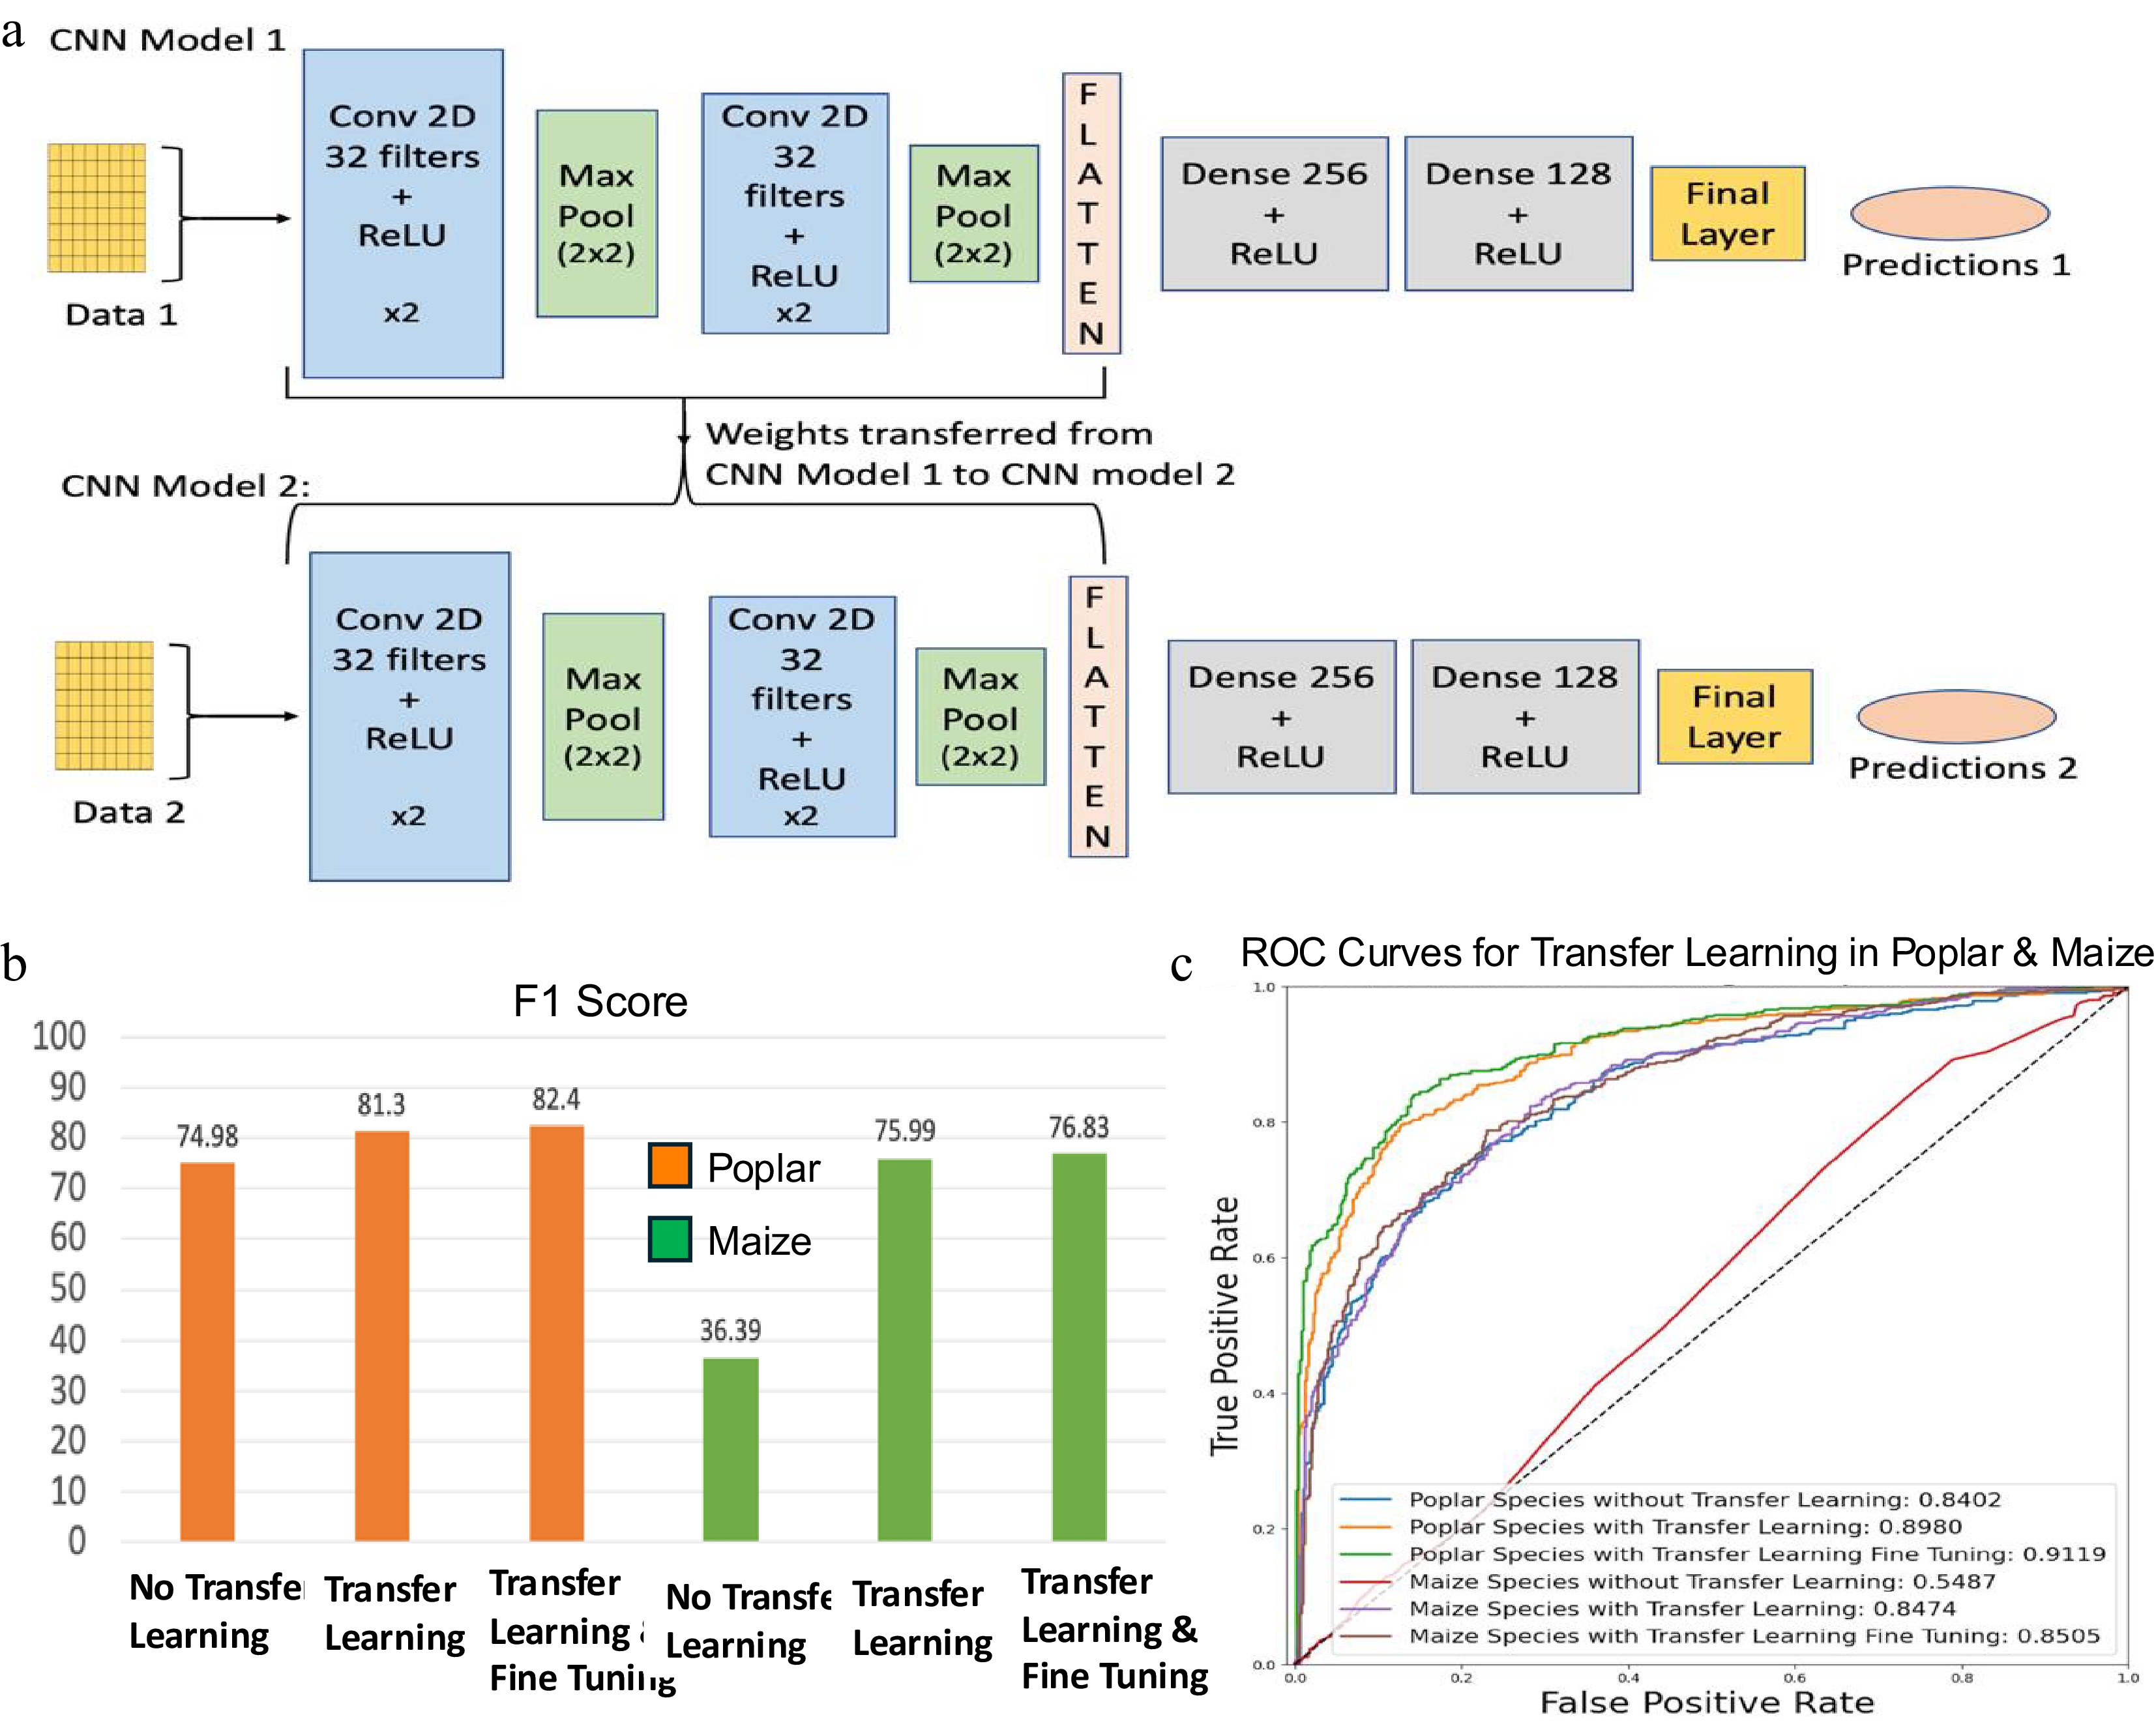
Figure 7.
Transfer learning framework using convolutional neural networks (CNN) and its performance evaluation. (a) Overview of CNN-based transfer learning architecture. CNN Model 1 is trained on a well-characterized species (e.g., Arabidopsis), and its learned convolutional layer parameters are transferred to CNN Model 2, which is fine-tuned on a smaller dataset from a less-characterized species (e.g., Poplar or Maize). Conv: Convolutional layer; ReLU: Rectified Linear Unit. (b) F1-scores assessing the performance of CNN models for poplar and maize, with and without transfer learning and fine-tuning. (c) Receiver operating characteristic (ROC) curves assessing the performance of CNN models for poplar and maize, with and without transfer learning and fine-tuning.
-
(a) Training data Species Number of
genesExpression samples Training data Total Positive pairs Negative pairs Arabidopsis thaliana 22,093 (Compendium Data Set 1) 1,253 2,462 1,231 1,231 Populus trichocarpa 34,699 (Compendium Data Set 2) 743 4,214 2,107 2,107 Zea mays (B73) 39,756 (Compendium Data Set 3) 1,626 16,900 8,450 8,450 (b) Test data Species TFs Targets Expression samples Total pairs Arabidopsis Transcriptomic
Test Data Set 11,415 20 1,253 28,300 Arabidopsis Transcriptomic
Test Data Set 2199 35 1,253 1,164 Poplar Transcriptomic Test
Data Set1,717 25 743 42,925 Maize Transcriptomic Test
Data Set2,555 38 1,626 97,090 Table 1.
Training and testing data sets. (a) Transcriptomic compendium, training, and test data sets from Arabidopsis thaliana, Populus trichocarpa, and Zea mays (B73 cultivar). (b) The test datasets collected from existing databases and literature for model evaluation.
-
(a) Fully connected layer Species FCN BCE FCN HINGE FCN MSE FCN MSLE FCN MAE FCN POISSON FCN HUBER FCN LOGCOSH Arabidopsis 87.42 84.58 87.02 85.4 89.25 87.62 87.42 87.42 Poplar 95.28 91.85 91.11 92.44 92.92 92.8 92.25 91.37 Maize 89.05 88.82 89.79 89.5 89.05 90.8 90.95 90.71 Average scores 90.58 88.42 89.31 89.11 90.41 90.41 90.21 89.83 (b) Convolutional neural network Species CNN BCE CNN HINGE CNN MSLE CNN MSE CNN MAE CNN POISSON CNN HUBER CNN LOGCOSH ResNet 50 Mobile Net Arabidopsis 93.5 91.48 92.29 91.48 91.88 92.69 91.47 92.08 81.93 74.03 Poplar 97.59 98.1 97.59 97.21 98.35 97.85 97.72 96.32 88.67 85.47 Maize 94.86 95.34 90.48 94.08 95.4 88.51 95.65 94.9 85.89 83.07 Average scores 95.32 94.97 93.45 94.26 95.21 93.02 94.95 94.43 85.5 80.86 Table 2.
Performance comparison of fully connected networks (FCN) and convolutional neural networks (CNN) on the holdout test set (20% of the Arabidopsis, poplar, and maize training data). (a) FCN accuracies using binary cross-entropy (BCE), hinge loss, mean squared error (MSE), mean squared logarithmic error (MSLE), mean absolute error (MAE), Poisson loss, Huber loss, and LogCosh loss. (b) Assessment of CNNs, including custom architectures and deep CNNs (ResNet-50, MobileNet), using the same loss functions.
-
Hybrid Random Forest Model Plain Random Forest Model Spearman Correlation Coefficient Rank TF Freq. Ref. Rank TF Freq. Ref. Rank Transcription Factor Freq. Ref. 1 AT3G08500_MYB83 20 [58] 1 AT4G36920_AP2 20 − 1 AT5G60100 6 − 2 AT1G71930_VND7 20 [62] 2 AT5G16560_KAN 20 − 2 AT4G13640 6 − 3 AT4G36920_AP2 20 − 3 AT2G20180_bHLH15 20 − 3 AT3G50700 6 − 4 AT2G20180_bHLH15 20 − 4 AT5G11260_HY5 20 − 4 AT1G64530 6 − 5 AT5G11260_HY5 20 − 5 AT2G44730 20 − 5 AT1G20693 6 − 6 AT5G16560_KAN 20 − 6 AT1G71930_VND7 17 [62] 6 AT1G04250 6 − 7 AT1G24260_SEP3 20 − 7 AT3G08500_MYB83 17 [58] 7 AT5G37020_ARF8 5 − 8 AT1G32770_SND1 19 [59] 8 AT5G12870_MYB46 16 [58] 8 AT4G31060 5 − 9 AT1G14350_FLP 19 − 9 AT1G66140_ZFP4 14 − 9 AT3G58680_MBF1B 5 − 10 AT5G12870_MYB46 18 [58] 10 AT1G24260_SEP3 12 − 10 AT3G23210 5 − 11 AT2G02820_MYB88 18 − 11 AT3G13890_MYB26 12 [64] 11 AT3G21175 5 − 12 AT4G23810_WRKY53 16 − 12 AT2G02820_MYB88 11 − 12 AT2G34710_HB-14 5 − 13 AT3G27920_GL1 14 − 13 AT1G14350_FLP 11 − 13 AT2G01650 5 − 14 AT5G62380_VND6 10 [61] 14 AT1G32770_SND1 10 [59] 14 AT1G71692 5 − 15 AT1G24625_ZFP7 10 − 15 AT5G17300 8 − 15 AT1G67970 5 − 16 AT1G74930_ORA47 9 − 16 AT2G32370 6 − 16 AT1G49720_ABF1 5 − 17 AT2G43010_AtbHLH9 8 − 17 AT1G25340_MYB116 6 − 17 AT1G19270 5 − 18 AT5G13790_AGL15 7 − 18 AT1G25330_bHLH75 6 − 18 AT5G63280 4 − 19 AT3G24650_ABI3 6 − 19 AT4G27330 6 − 19 AT5G53200_TRY 4 − 20 AT4G18960_AG 6 − 20 AT2G18060 6 − 20 AT5G46910 4 − 21 AT3G02310_AGL4 6 − 21 AT2G40220_ABI4 6 − 21 AT5G41920_GRAS-28 4 − 22 AT1G69120_AP1 6 − 22 AT1G23420_INO 6 − 22 AT5G13080 4 − 23 AT1G26310_CAL 6 − 23 AT4G35700 6 − 23 AT4G34610 4 − 24 AT2G44730 6 − 24 AT5G18450 6 − 24 AT4G17900 4 − 25 AT3G54340_AP3 5 − 25 AT2G44745 6 − 25 AT4G00050_bHLH16 4 − 26 AT1G69180_CRC 5 − 26 AT4G00220_LBD30 6 − 26 AT3G54620 4 − 27 AT5G10120_EIL4 5 − 27 AT3G27920_GL1 6 − 27 AT3G17609 4 − 28 AT1G23420_INO 5 − 28 AT1G09540_MYB61 6 − 28 AT3G16280 4 − 29 AT1G01060_LHY 5 − 29 AT2G44745_WRKY12 6 [57] 29 AT3G02830_ZFN1 4 − 30 AT5G57520_ZFP2 5 − 30 AT4G00220 6 − 30 AT2G43000 4 − 31 AT2G40220_ABI4 4 − 31 AT2G18060_VND1 6 [60] 31 AT2G40740_WRKY55 4 − 32 AT5G15800_AGL2 4 − 32 AT1G09540 6 − 32 AT2G37630_MYB91 4 − 33 AT2G45650_AGL6 4 − 33 AT1G12610 6 − 33 AT2G16720_MYB7 4 [56] 34 AT2G16910_AMS 4 − 34 AT5G62380_VND6 6 [61] 34 AT1G70000 4 − 35 AT1G25340_MYB116 4 − 35 AT3G06120_bHLH45 6 − 35 AT1G22070 4 − 36 AT1G12610_DDF1 4 − 36 AT4G09960_STK 5 − 36 AT1G17460_TRFL3 4 − 37 AT1G47870_E2FC 4 [63] 37 AT3G30530 5 − 37 AT1G12260_VND4 4 [60] 38 AT3G13960_GRF5 4 − 38 AT3G01530 5 − 38 AT1G04550 4 − 39 AT2G33880_HB3 4 − 39 AT1G61110 5 − 39 AT5G67480 3 − 40 AT5G62020_HSF6 4 − 40 AT2G42830_SHP2 5 − 40 AT5G66630 3 − 41 AT1G67100_LOB40 4 − 41 AT5G03790_LMI1 5 − 41 AT5G65410_hb-25 3 − 42 AT2G46770_NST1 4 [59] 42 AT1G15360_SHINE1 5 − 42 AT5G63080 3 − 43 AT5G20240_PI 4 − 43 AT1G66380_MYB114 5 − 43 AT5G61380_TOC1 3 − 44 AT4G27330_SPL 4 − 44 AT1G35490 5 − 44 AT5G60120 3 − 45 AT2G44745_WRKY12 4 [57] 45 AT5G23260_AGL32 5 − 45 AT5G58010 3 − 46 AT1G10480_ZFP5 4 − 46 AT2G46770_NST1 5 [59] 46 AT5G57620 3 − 47 AT2G45420_LBD18 3 − 47 AT5G15800_AGL2 5 − 47 AT5G56860_GNC 3 − 48 AT3G13890_MYB26 3 [64] 48 AT1G26310 5 − 48 AT5G54230 3 − 49 AT5G57620_MYB36 3 − 49 AT4G18960_AG 5 − 49 AT4G00180_YAB3 3 − 50 AT2G18060_VND1 3 [60] 50 AT5G53210_bHLH98 5 − 50 AT1G10200_WLIM1 3 − The ranking is based on the frequency with which each TF is predicted to regulate genes in the lignin biosynthesis pathway (BLP). TFs shown in red font present the known regulators of LBP, based on published literature. TFs in red font and yellow highlight are the known master regulators of LBP (e.g., MYB83 and MYB46). TFs in blue font act further upstream in the regulatory hierarchy, directly or indirectly influencing the expression of MYB83 and MYB46[66]. Table 3.
Comparison of the top 50 transcription factors (TFs) predicted to regulate the lignin biosynthesis pathway (LBP) by three methods: hybrid Random Forest, plain Random Forest, and a baseline method using Spearman's rank correlation.
-
No. Model Accuracy Precision Recall Specificity F1-score AUC score 1 Random Forest Classifier Hybrid 83.26 83.33 83.26 85.59 83.25 93.00 2 Random Forest Classifier Plain 84.55 86.19 84.54 95.20 84.37 89.80 3 Extra Trees Classifier Hybrid 85.15 85.38 85.15 89.19 85.12 93.31 4 Extra Trees Classifier Plain 84.03 85.60 84.03 94.51 83.85 88.05 5 AdaBoost Classifier Hybrid 81.20 81.33 81.20 84.39 81.18 91.84 6 AdaBoost Classifier Plain 84.98 85.23 84.97 89.19 84.95 89.38 Table 4.
Accuracy, precision, recall, specificity, F1-score, and area under the curve (AUC) score for Arabidopsis Transcriptomic Test Data Set 2. The data set contains 1,164 regulatory pairs, with 582 positive regulatory pairs and 582 negative regulatory pairs.
Figures
(7)
Tables
(4)