-
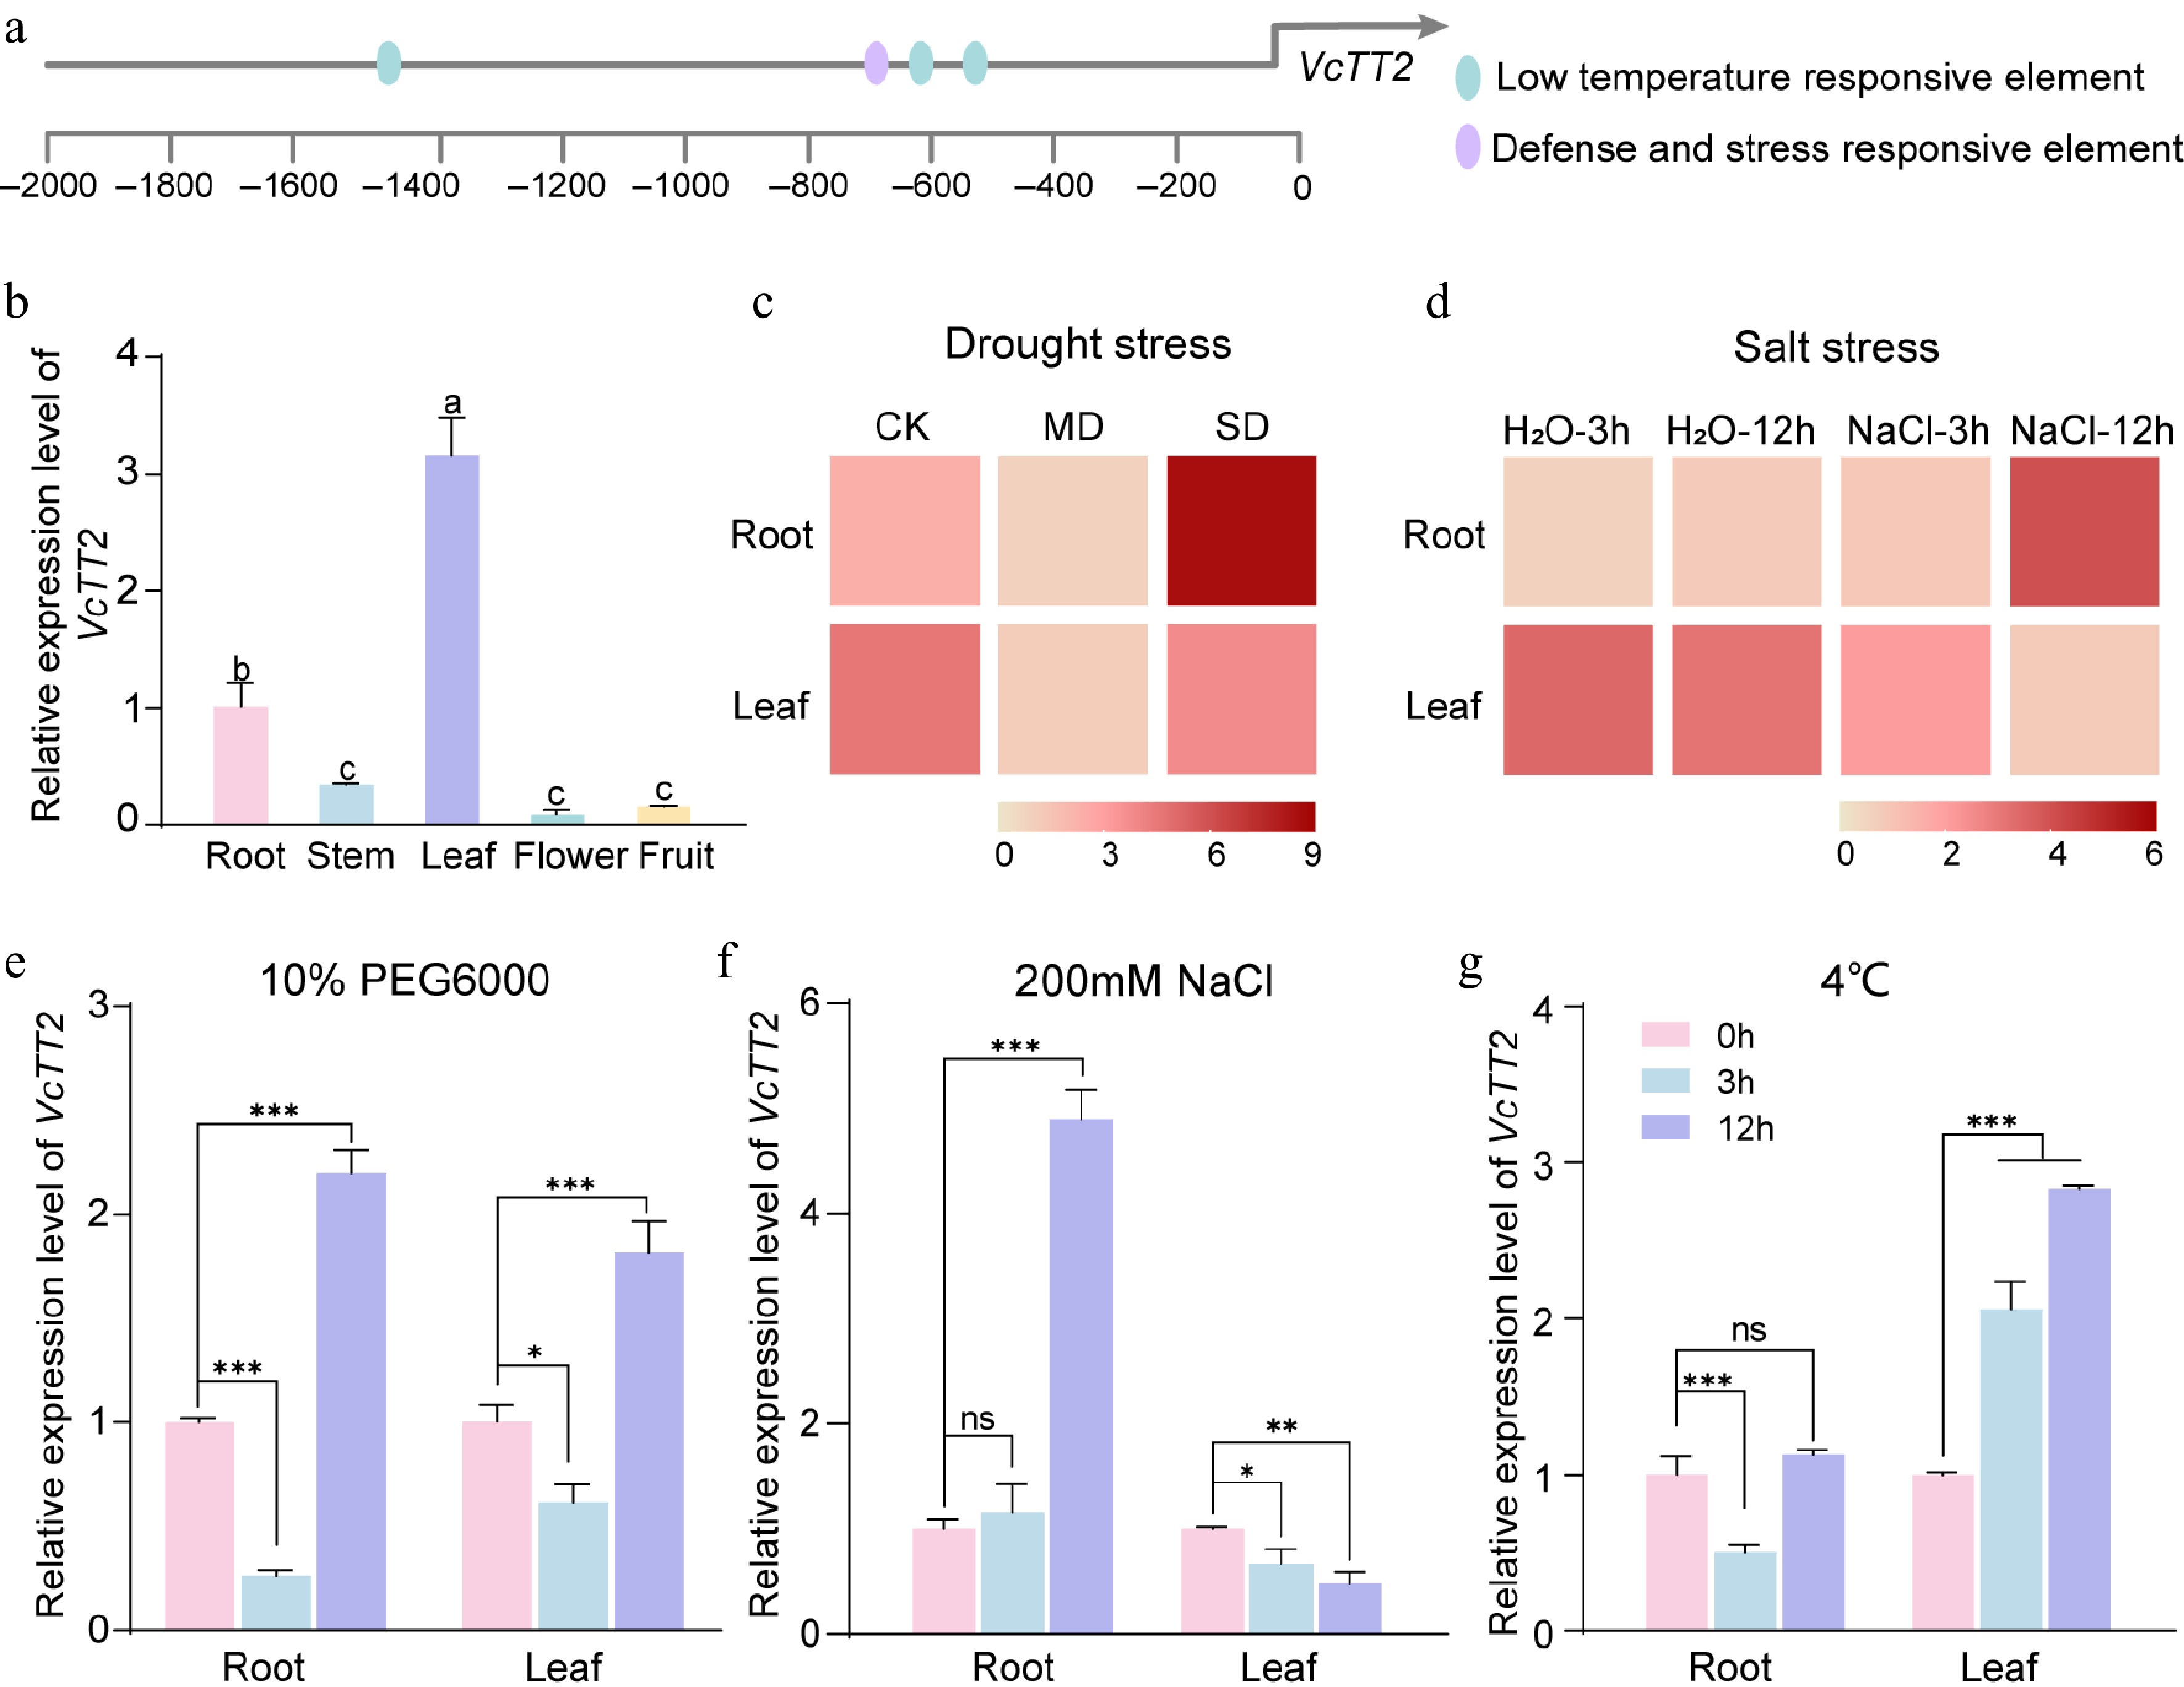
Figure 1.
VcTT2 responds to drought, salt, and low-temperature stress. (a) Schematic drawing depicting the cis-acting elements related to stress-responsiveness in the promoter of VcTT2. (b) RT-qPCR assay showing the relative expression levels of VcTT2 in various tissues of blueberry, including root, stem, leaf, flower and fruit. Error bars represent the standard deviation of three biological replicates. Different letters above the error bars indicate significant differences at the p < 0.05 level (one-way ANOVA). (c) Heatmap showing the expression profiles of VcTT2 in blueberry roots and leaves under different levels of drought stress. Normal watering treatment (75%−80% soil water content (SWC)) was used as control (CK), 55%−60% SWC as moderate stress (MD), and 30%−35% SWC as severe stress (SD). (d) Heatmap showing the expression profiles of VcTT2 in blueberry roots and leaves under salt stress at different time points. Salt stress was simulated with 200 mM NaCl treatment, and water treatment was used as control. RT-qPCR assay of relative expression levels of VcTT2 in blueberry leaves and roots under (e) drought stress, (f) salt stress, and (g) low temperature. Drought stress was simulated by 10% PEG6000 treatment, salt stress by 200 mM NaCl treatment, and low-temperature stress by 4 °C treatment. Asterisks denote statistical significance determined by Student's t-test, * p < 0.05, ** p < 0.01, *** p < 0.001.
-
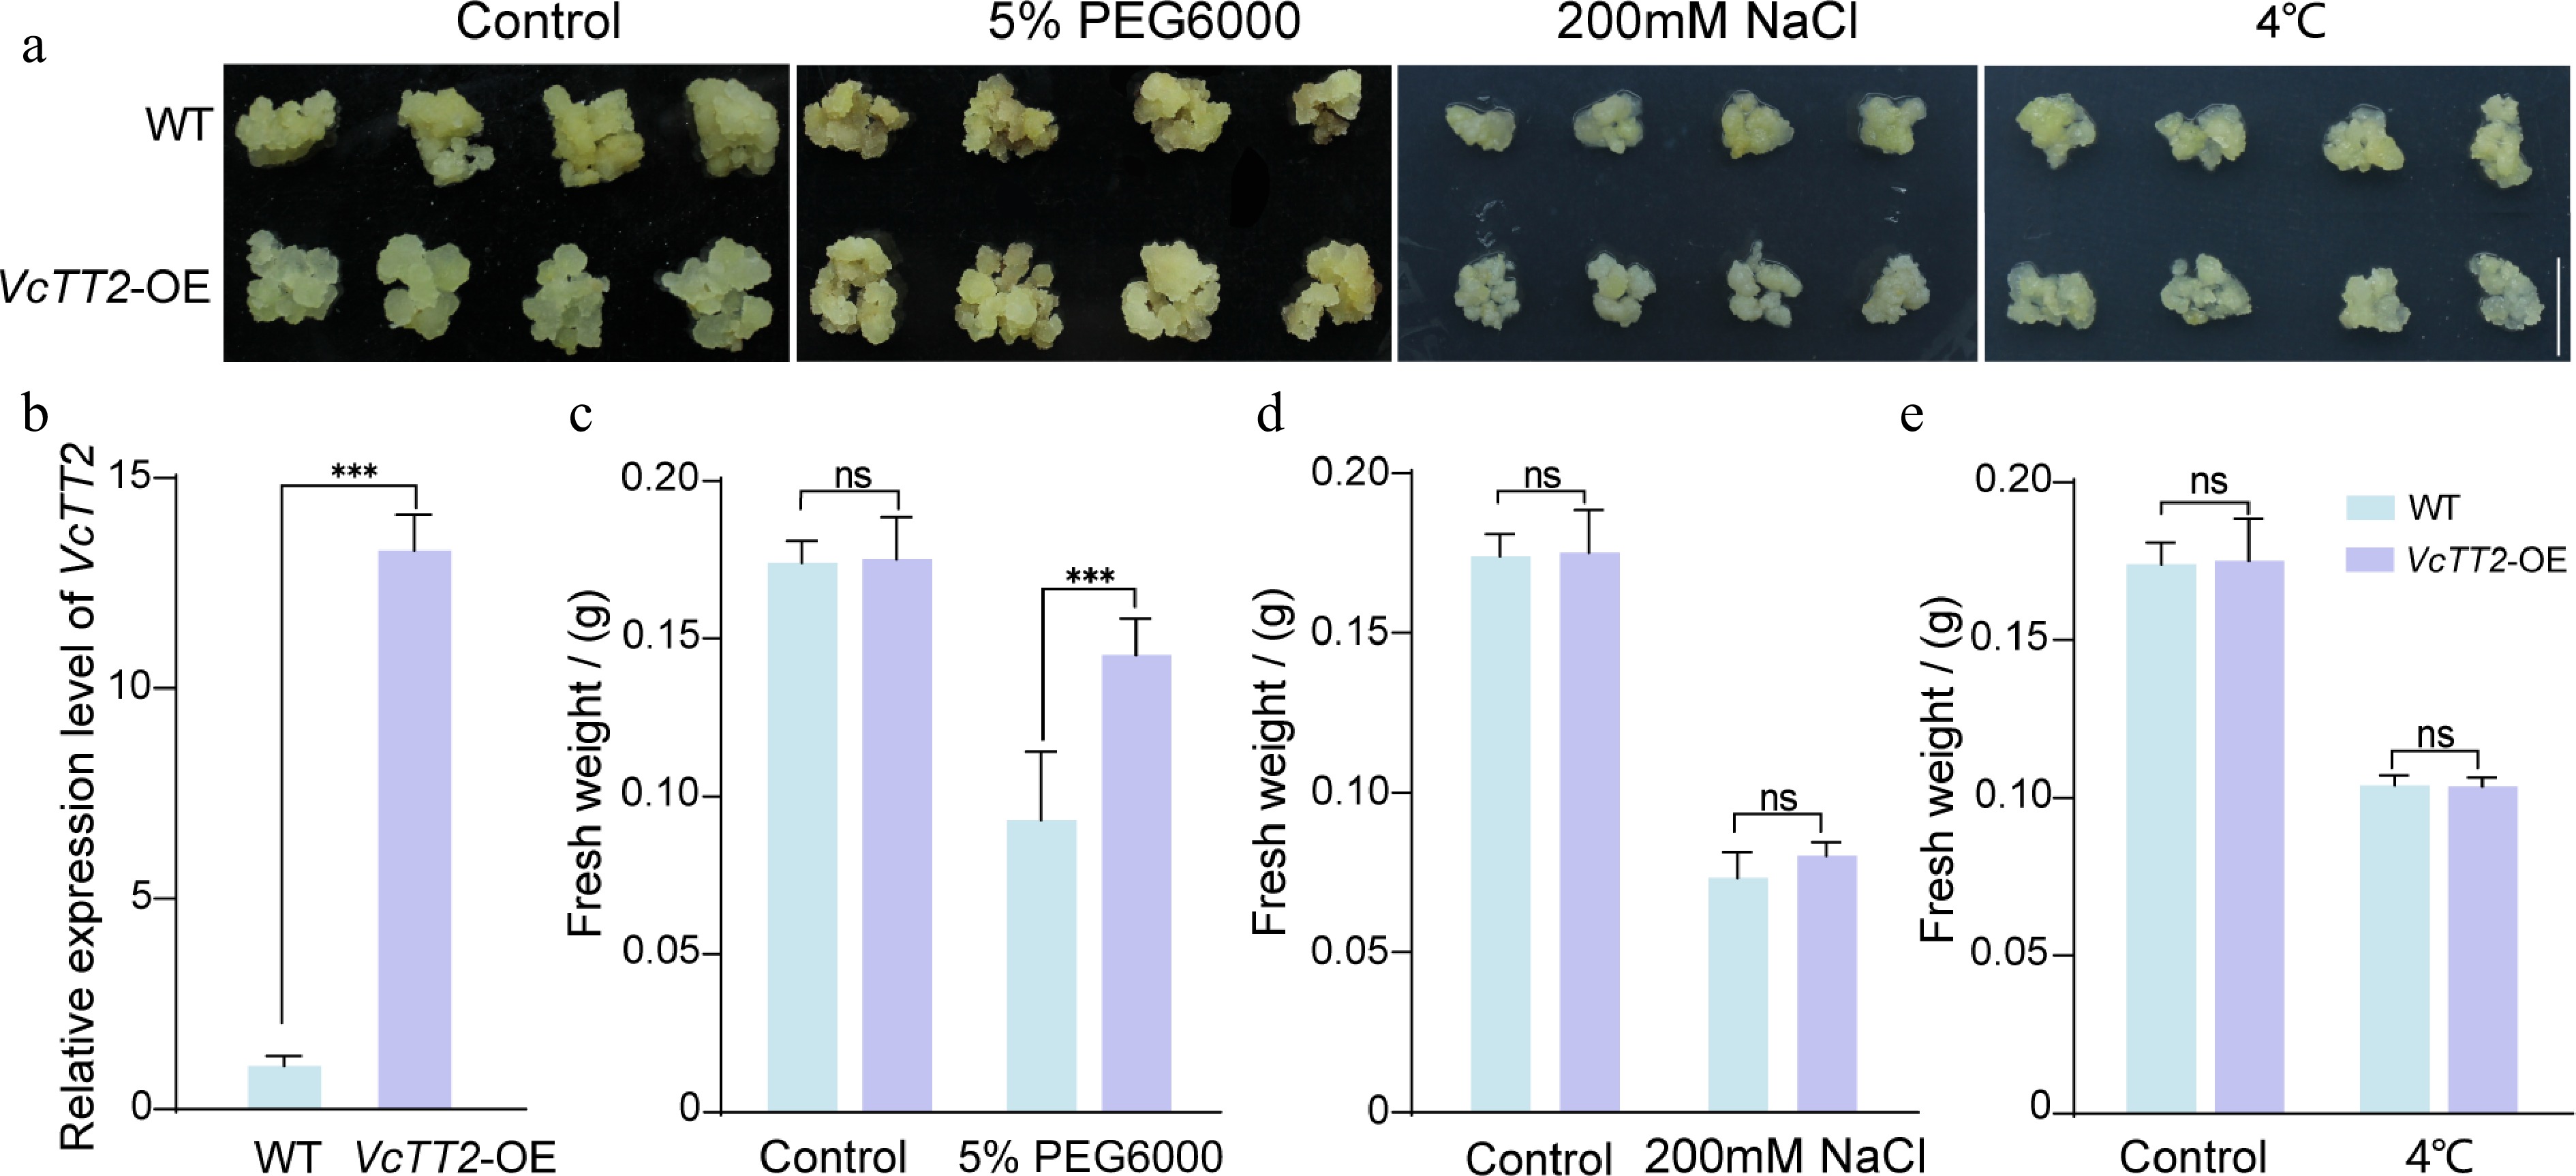
Figure 2.
Overexpression of VcTT2 enhances drought tolerance in blueberry calli. (a) Phenotypic comparison of wild-type (WT), and VcTT2-overexpressing (VcTT2-OE) blueberry calli under drought stress (5% PEG6000 treatment), salt stress (200 mM NaCl treatment), and low-temperature stress (4 °C treatment). WT and VcTT2-OE blueberry calli grown in normal conditions were used as controls. Scale bar = 1 cm. (b) RT-qPCR analysis of relative VcTT2 expression levels in WT and VcTT2-OE blueberry calli. Fresh weight of WT and VcTT2-OE calli following 10 d of (c) drought stress, (d) salt stress, and (e) low-temperature stress. Asterisks indicate statistical significance determined by Student's t-test, *** p < 0.001.
-
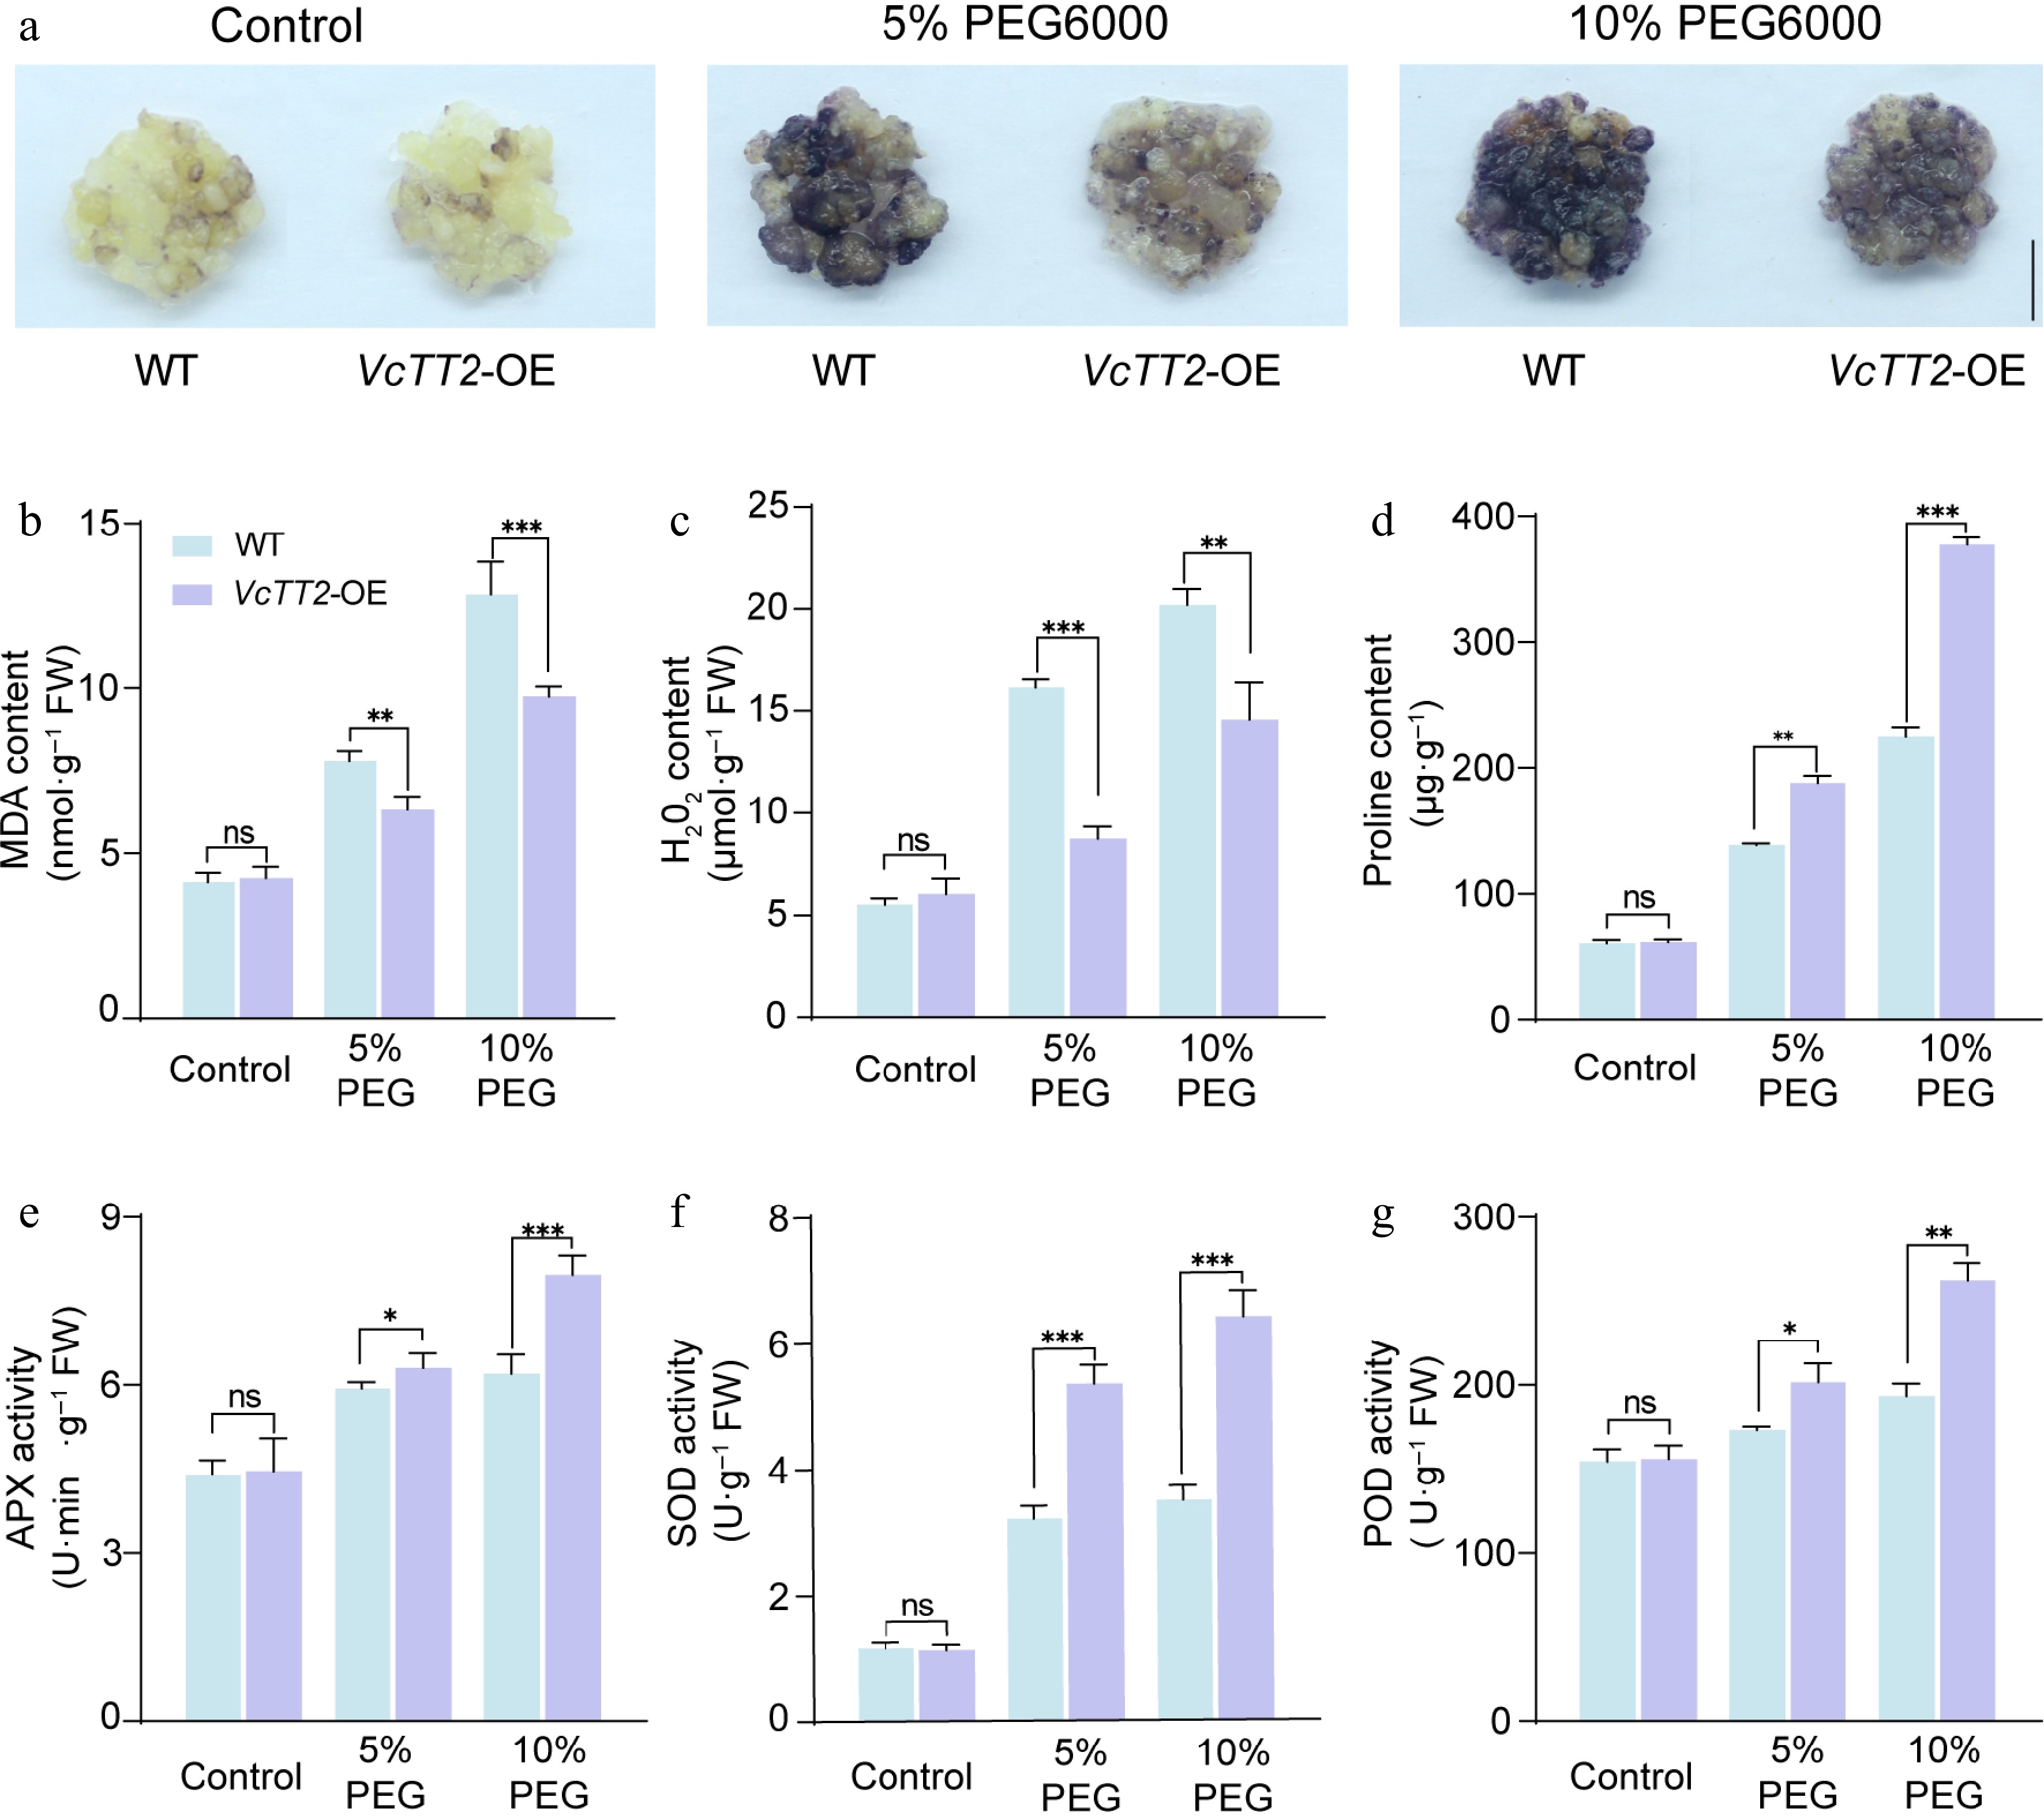
Figure 3.
Overexpression of VcTT2 enhances the ability of blueberry calli to scavenge reactive oxygen species (ROS). (a) NBT staining of wild-type (WT) and VcTT2-overexpressing (VcTT2-OE) blueberry calli under drought stress simulated by 5% and 10% PEG6000 treatments. WT and VcTT2-OE calli grown under normal conditions served as controls. Scale bar = 1 cm. Contents of (b) MDA, (c) H2O2, (d) proline, and activities of antioxidant enzymes (e) APX, (f) SOD, and (g) POD in WT and VcTT2-OE blueberry calli under drought stress as shown in (a). Asterisks indicate statistical significance determined by Student's t-test, * p < 0.05, ** p < 0.01, *** p < 0.001.
-
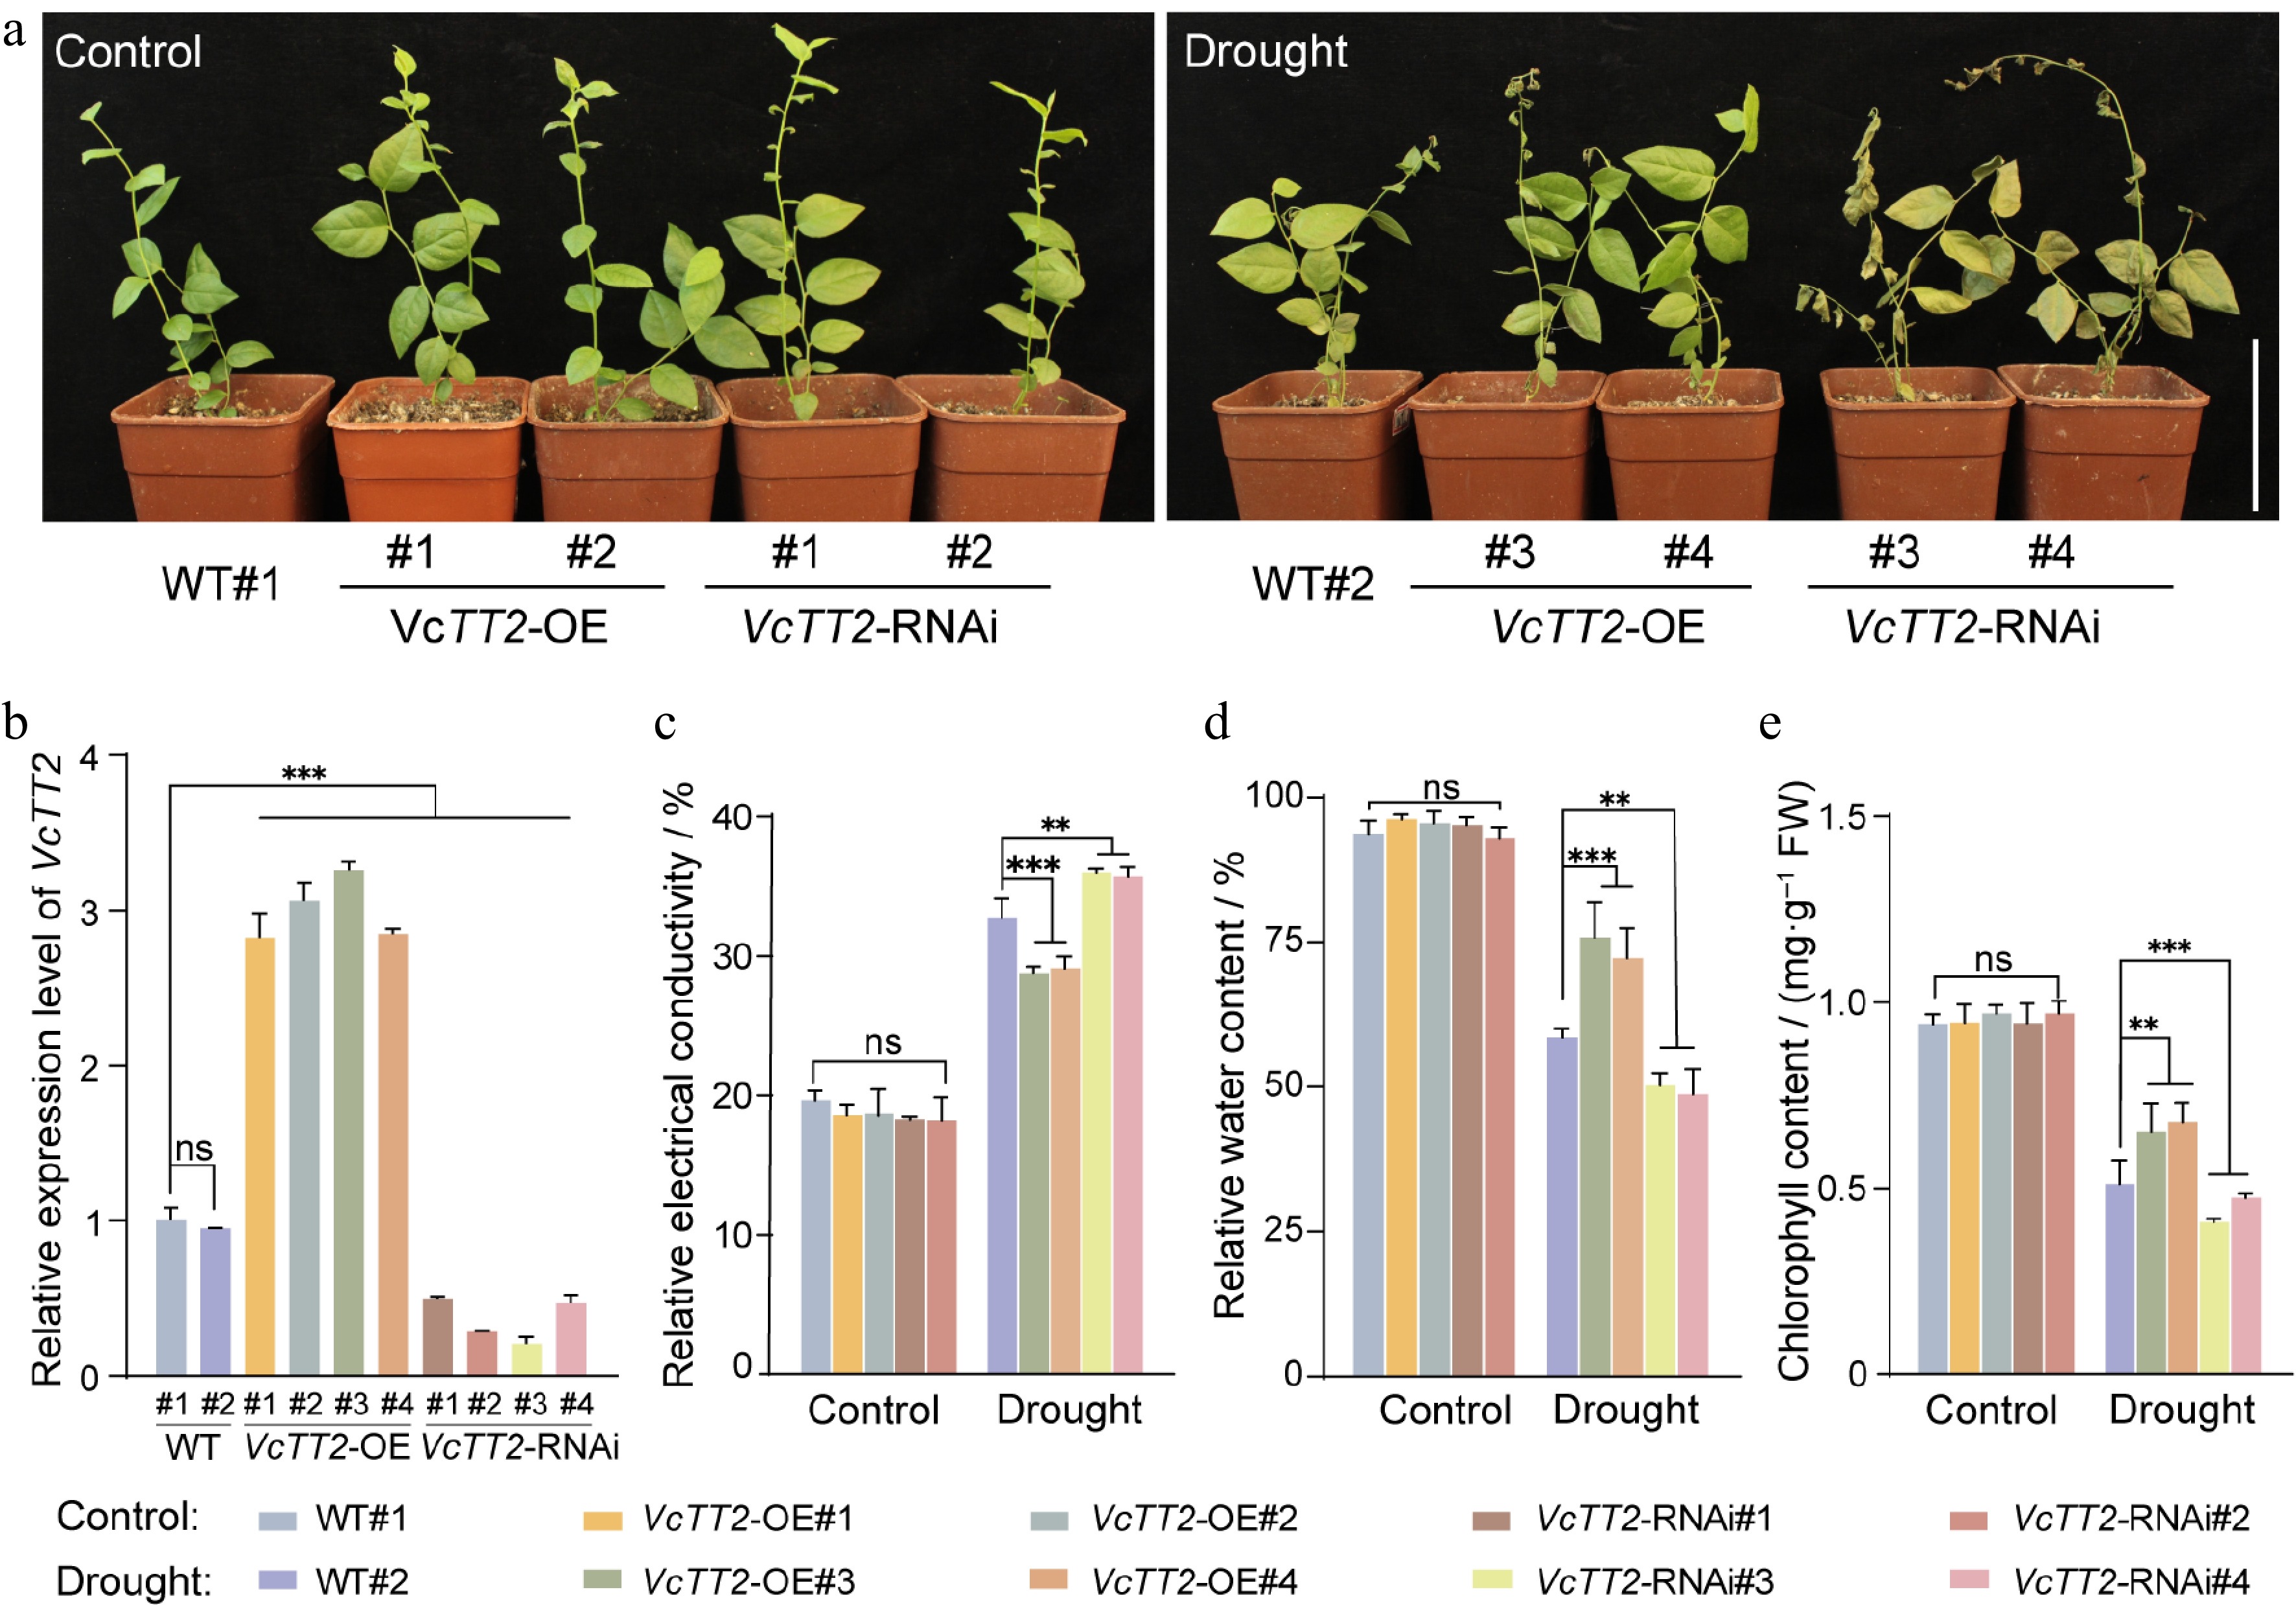
Figure 4.
VcTT2 positively regulates drought tolerance in blueberry seedlings. (a) Phenotypic comparison of wild-type (WT) and transgenic blueberry seedlings (VcTT2-OE and VcTT2-RNAi) after 20 days of natural drought treatment, with normal watering treatment used as the control. VcTT2-OE: VcTT2-overexpression; VcTT2-RNAi: VcTT2-suppression. Scale bar = 10 cm. (b) RT-qPCR analysis of relative VcTT2 expression levels in WT and transgenic blueberry seedlings. (c) Relative electrical conductivity, (d) relative water content, and (e) chlorophyll content of WT and transgenic blueberry seedlings under natural drought treatment, as shown in (a). Asterisks indicate statistical significance determined by Student's t-test, **p < 0.01, ***p < 0.001.
-
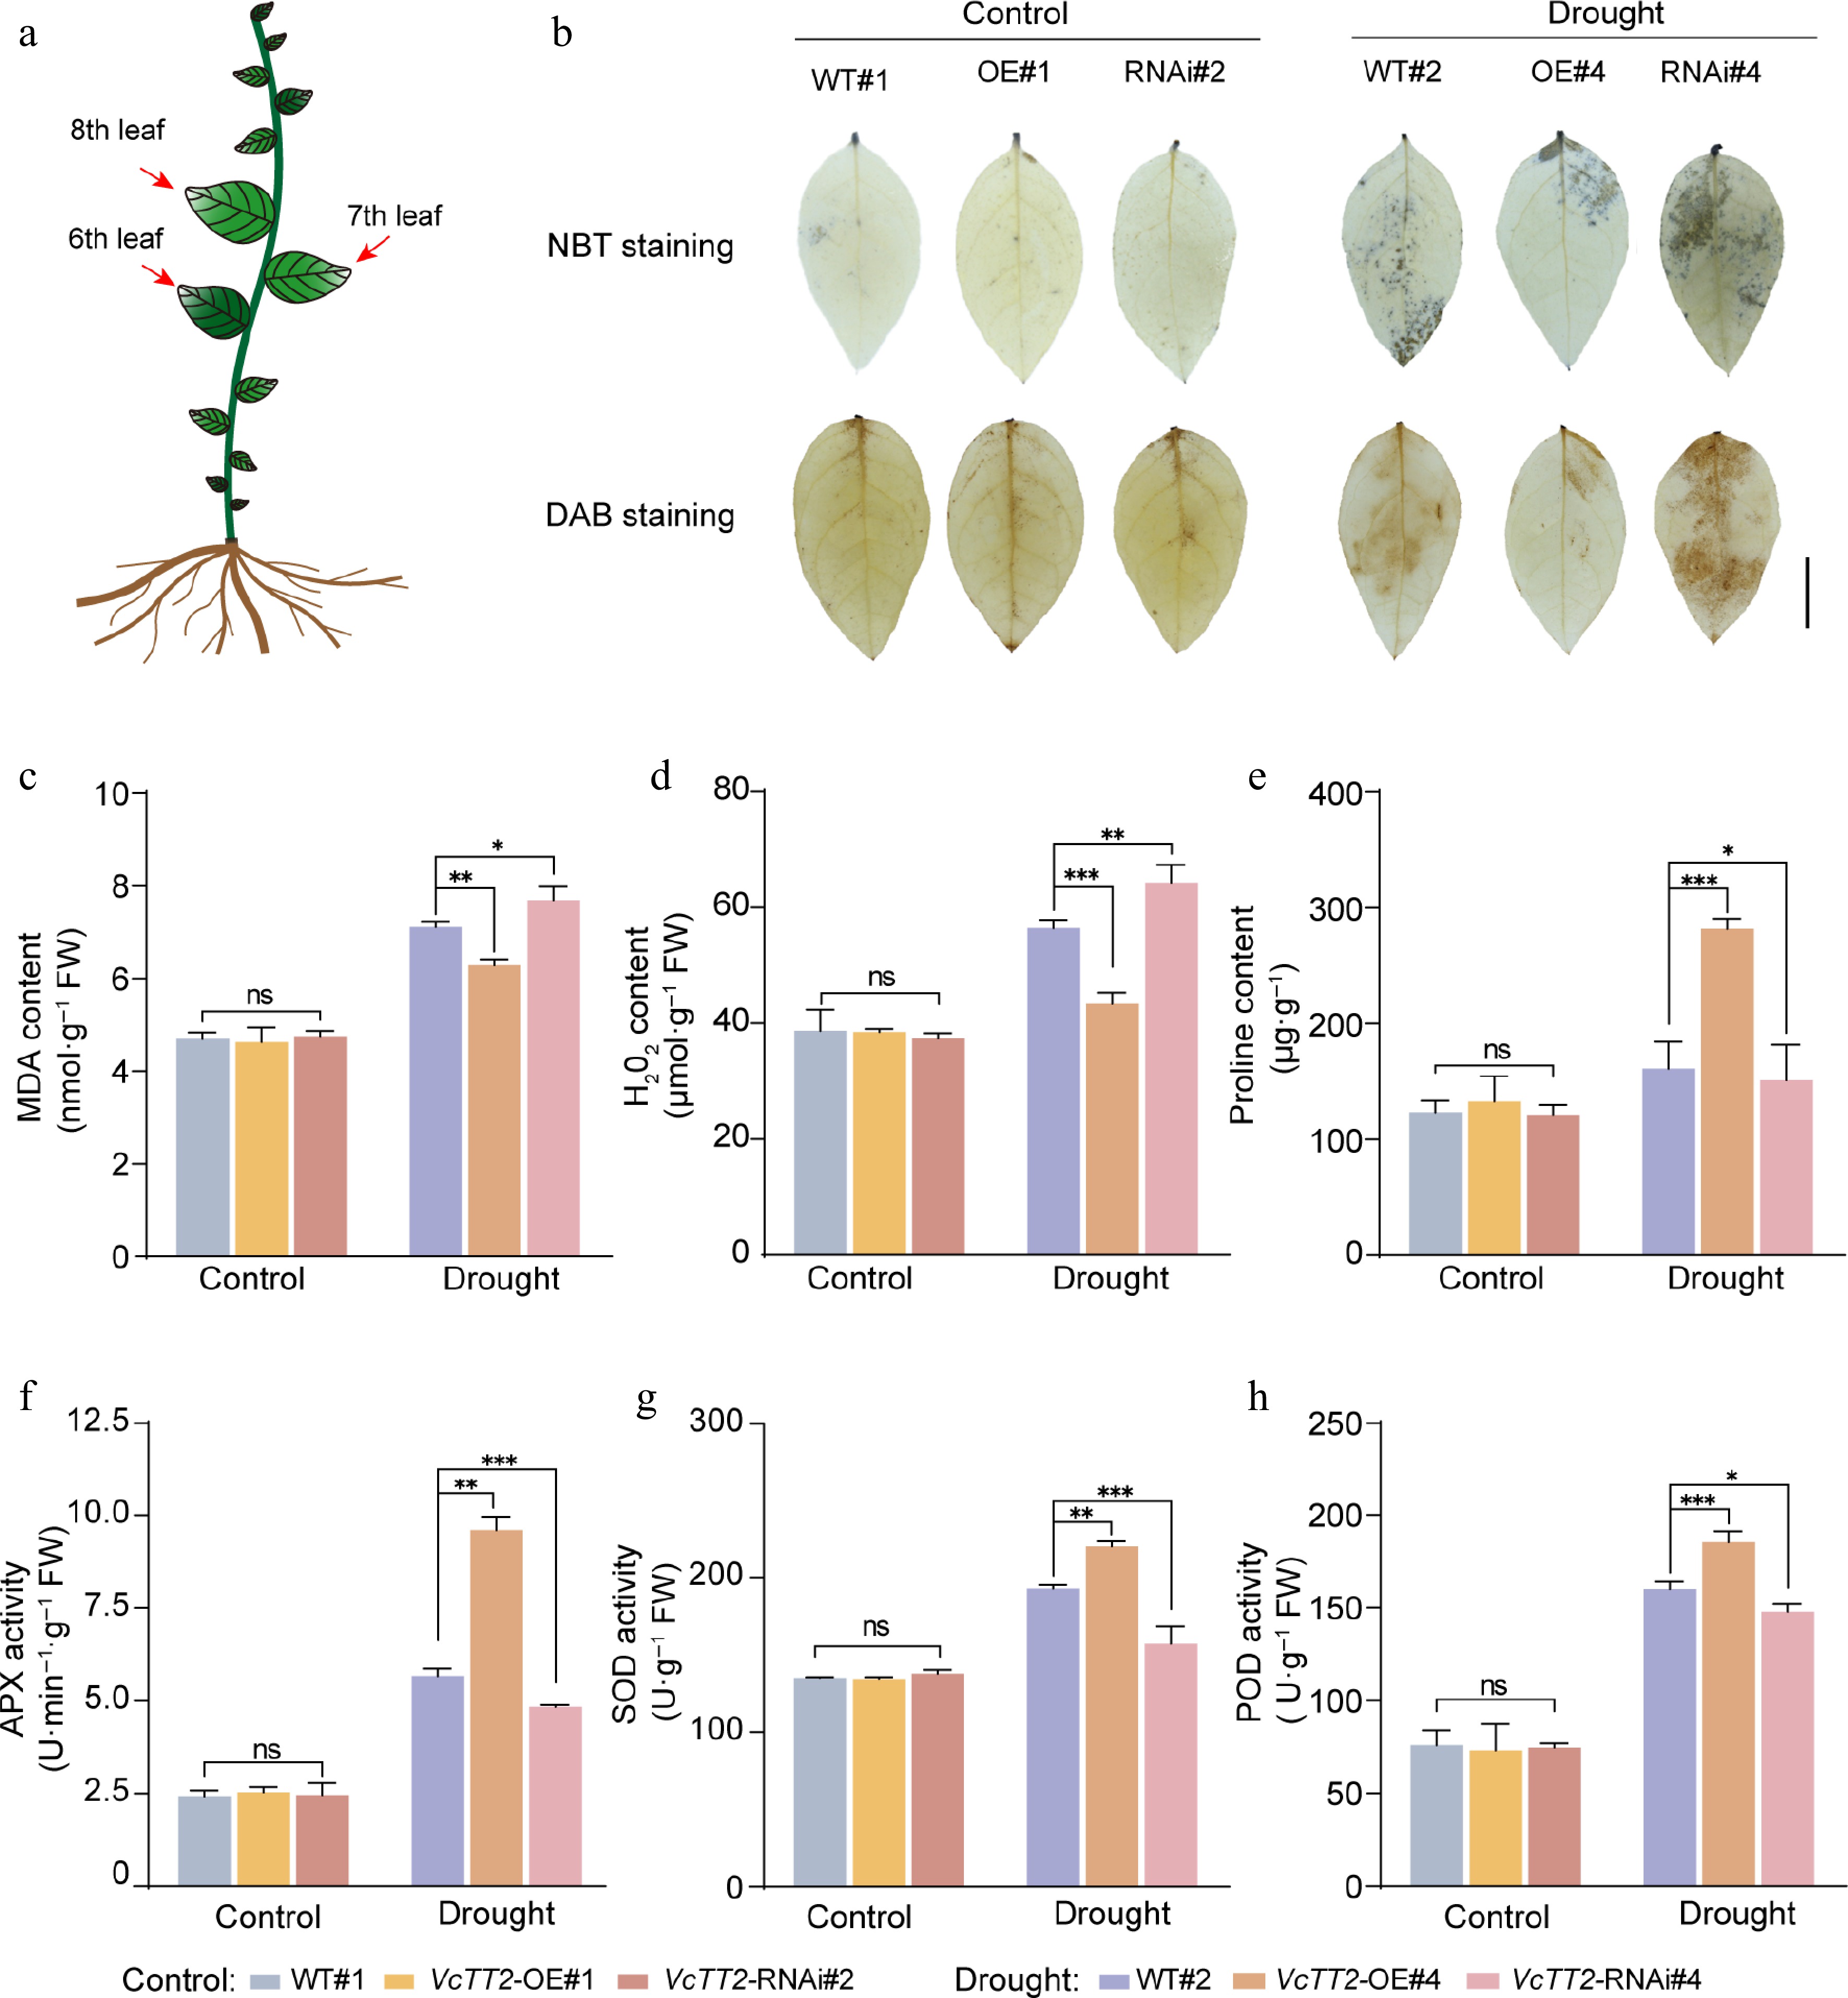
Figure 5.
VcTT2 positively regulates the ability of blueberry seedlings to scavenge ROS. (a) The red arrows indicate the experimentally sampled leaves. (b) DAB and NBT staining of leaves from wild-type (WT) and VcTT2-overexpressing (VcTT2-OE) blueberry seedlings after 20 d of natural drought treatment. Contents of (c) MDA, (d) H2O2, (e) proline, and activities of antioxidant enzymes (f) APX, (g) SOD, and (h) POD in leaves of WT and VcTT2-OE blueberry seedlings under drought stress, as shown in (a). Asterisks indicate statistical significance determined by Student's t-test, * p < 0.05, ** p < 0.01, *** p < 0.001.
-
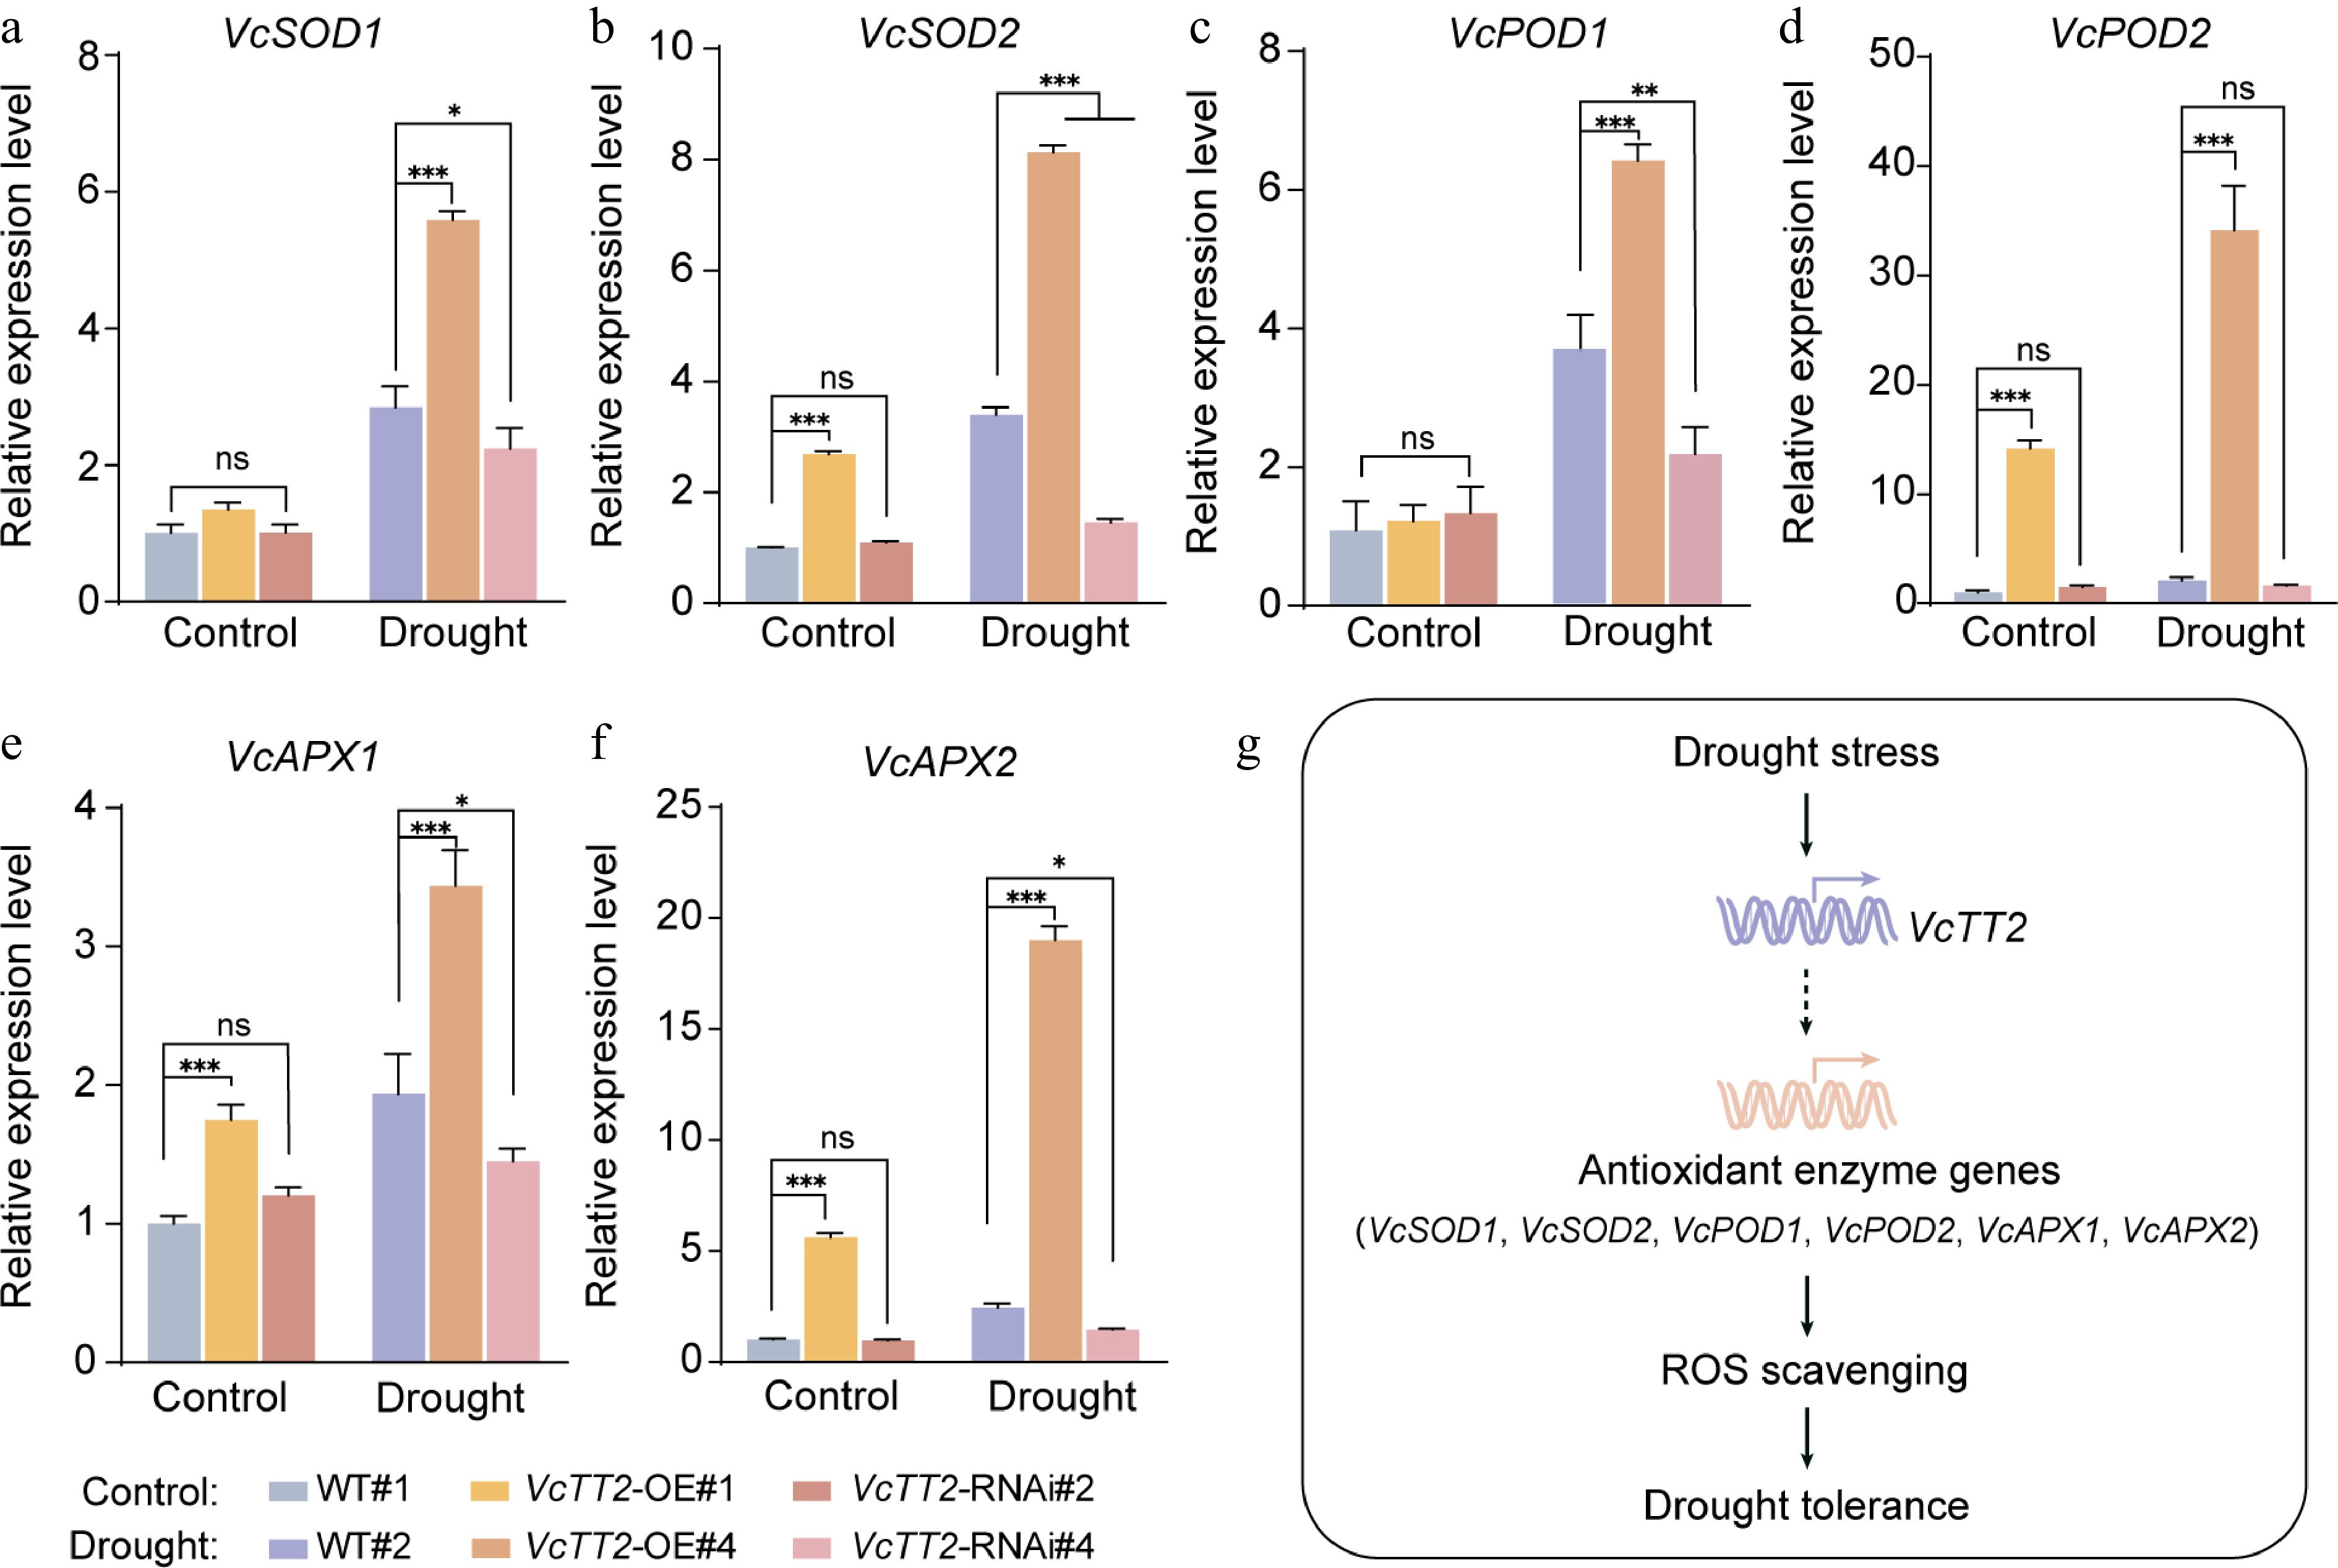
Figure 6.
VcTT2 promotes the expression of antioxidant enzyme genes under drought stress. RT-qPCR analysis of relative expression levels of (a) VcSOD1, (b) VcSOD2, (c) VcPOD1, (d) VcPOD2, (e) VcAPX1, and (f) VcAPX2 in leaves from wild-type (WT) and VcTT2-overexpressing (VcTT2-OE) blueberry seedlings after 20 d of natural drought treatment. Asterisks indicate statistical significance determined by Student's t-test, * p < 0.05, ** p < 0.01, *** p < 0.001. (g) The working model of VcTT2 regulation of blueberry drought tolerance. Black arrows indicate positive regulation.
Figures
(6)
Tables
(0)