-
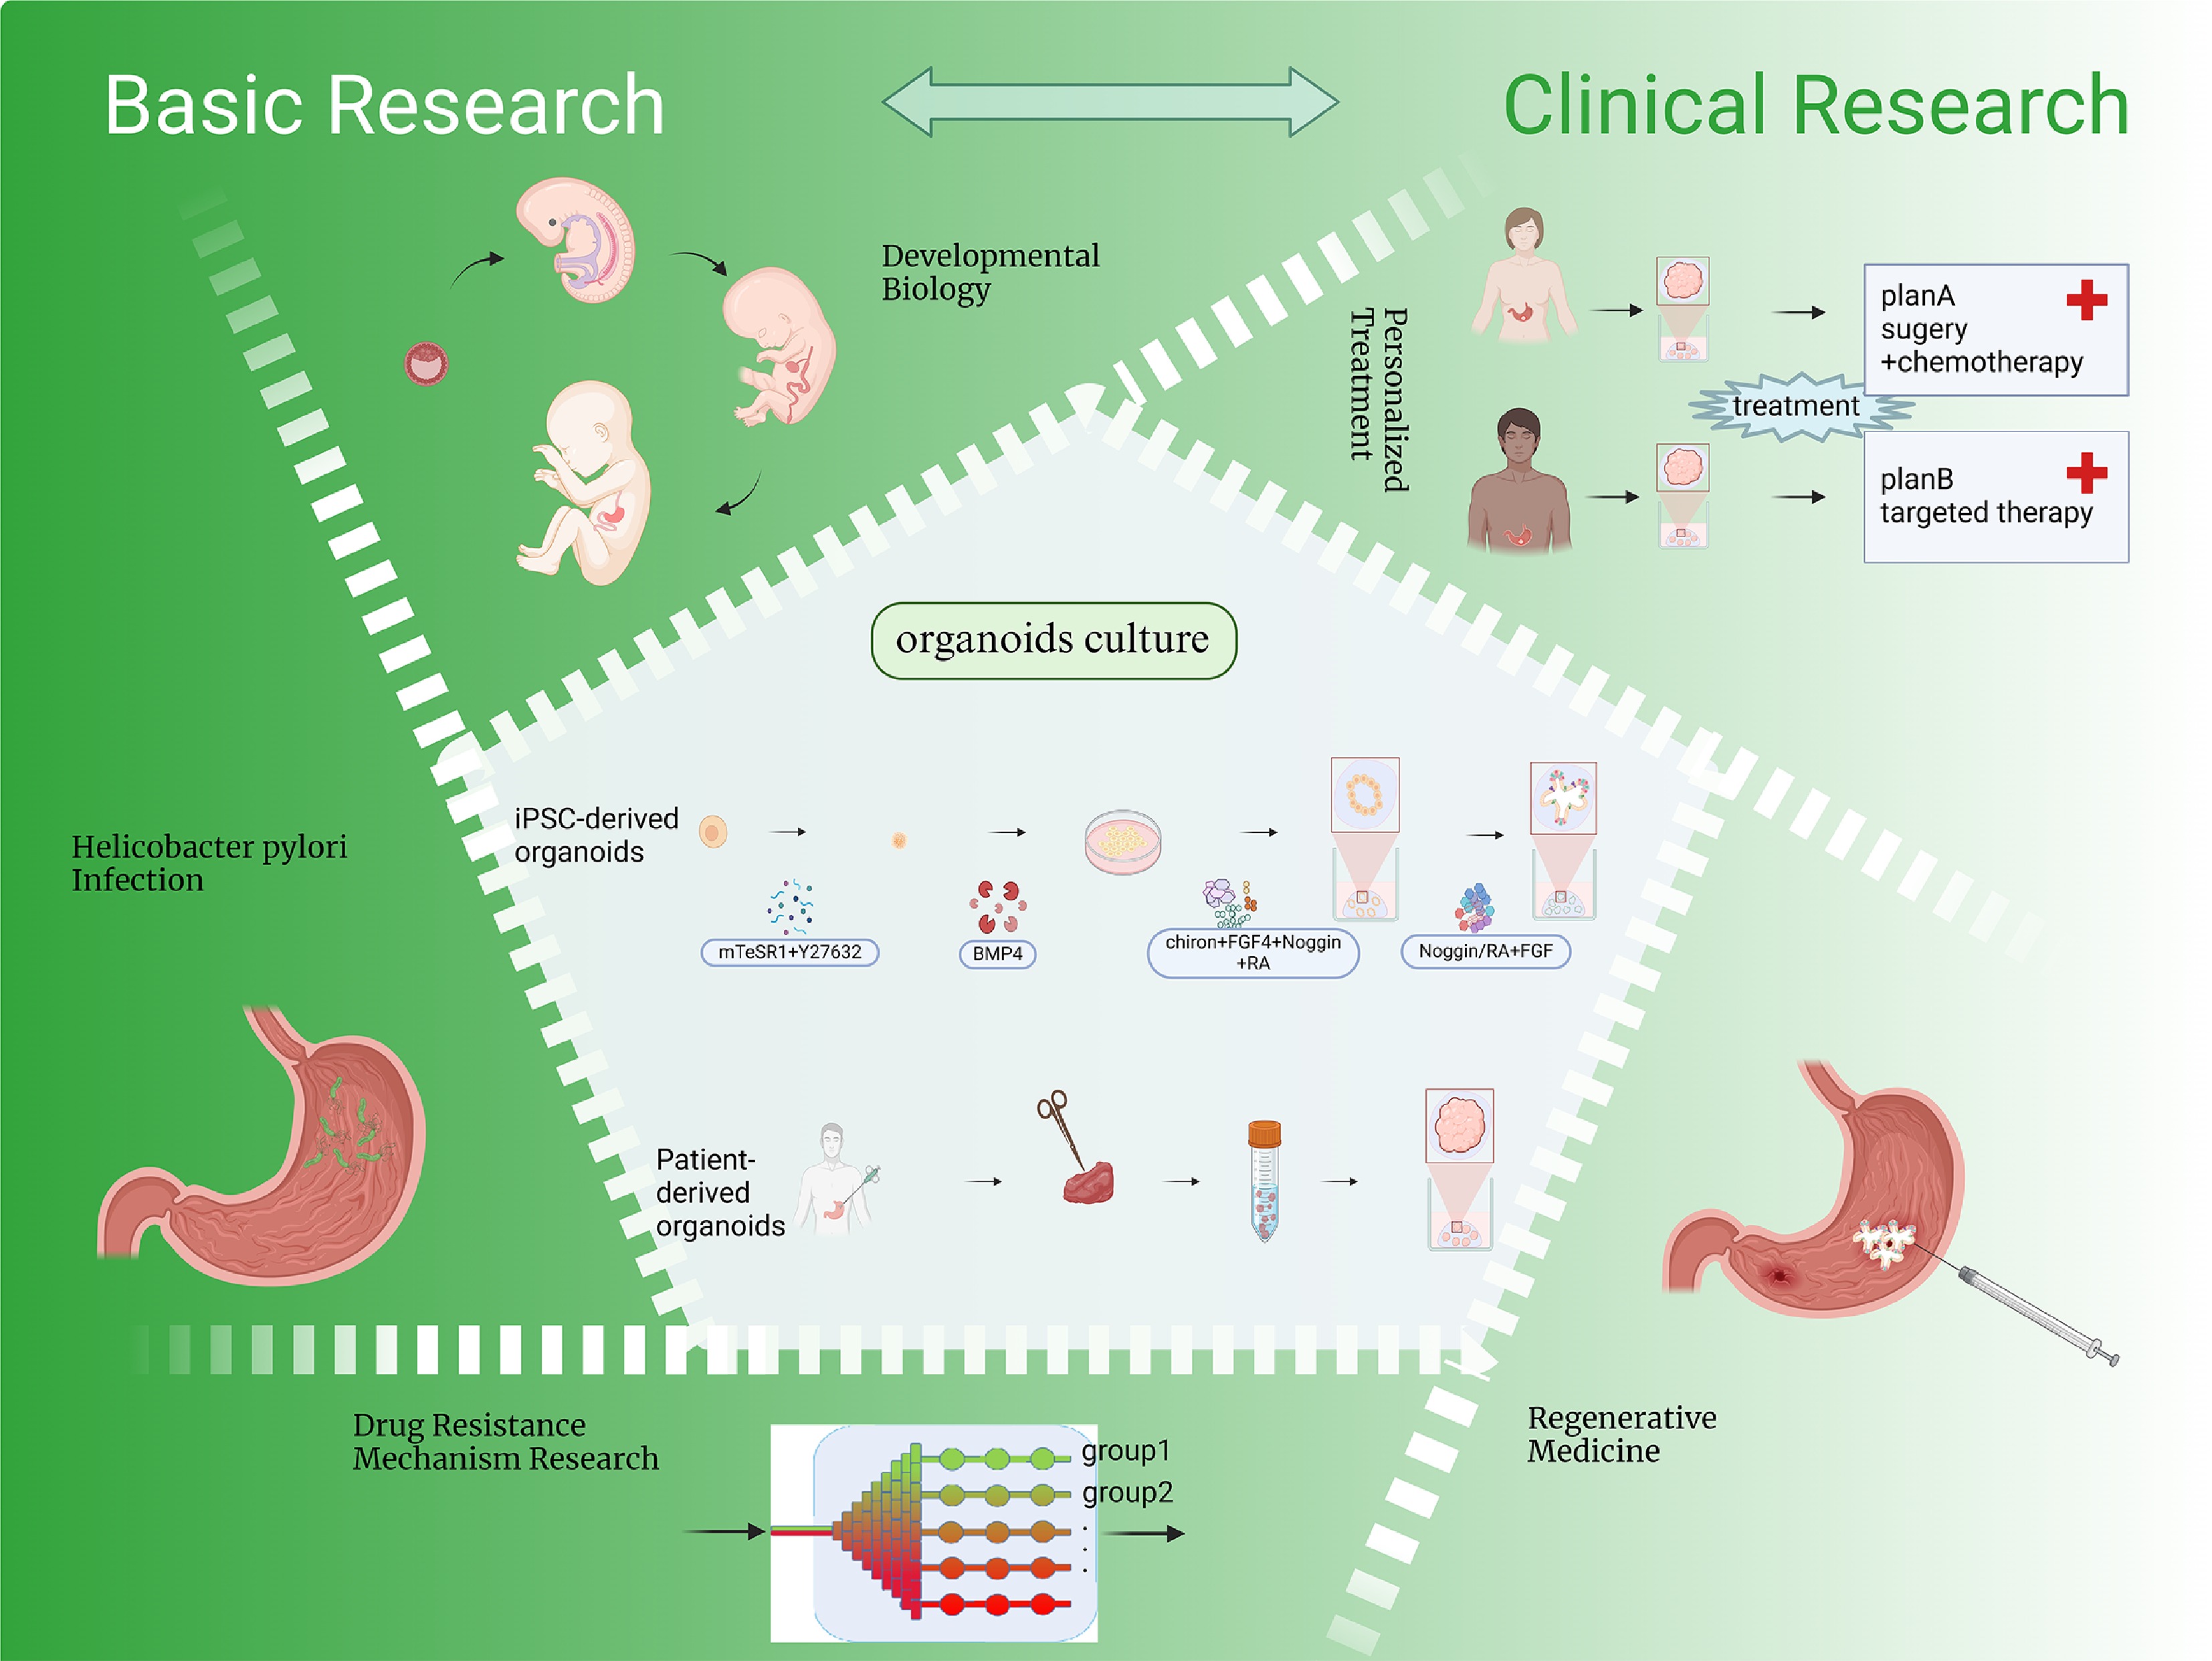
Figure 1.
Organoid generation and applications. The figure depicts the standard methodology for generating gastric organoids and highlights their applications in developmental biology, modeling of H. pylori infection, gastric cancer and drug resistance mechanism research, personalized treatment, and regenerative medicine. Created in BioRender. Chen, E. (2025)
https://BioRender.com/t04o468 . -
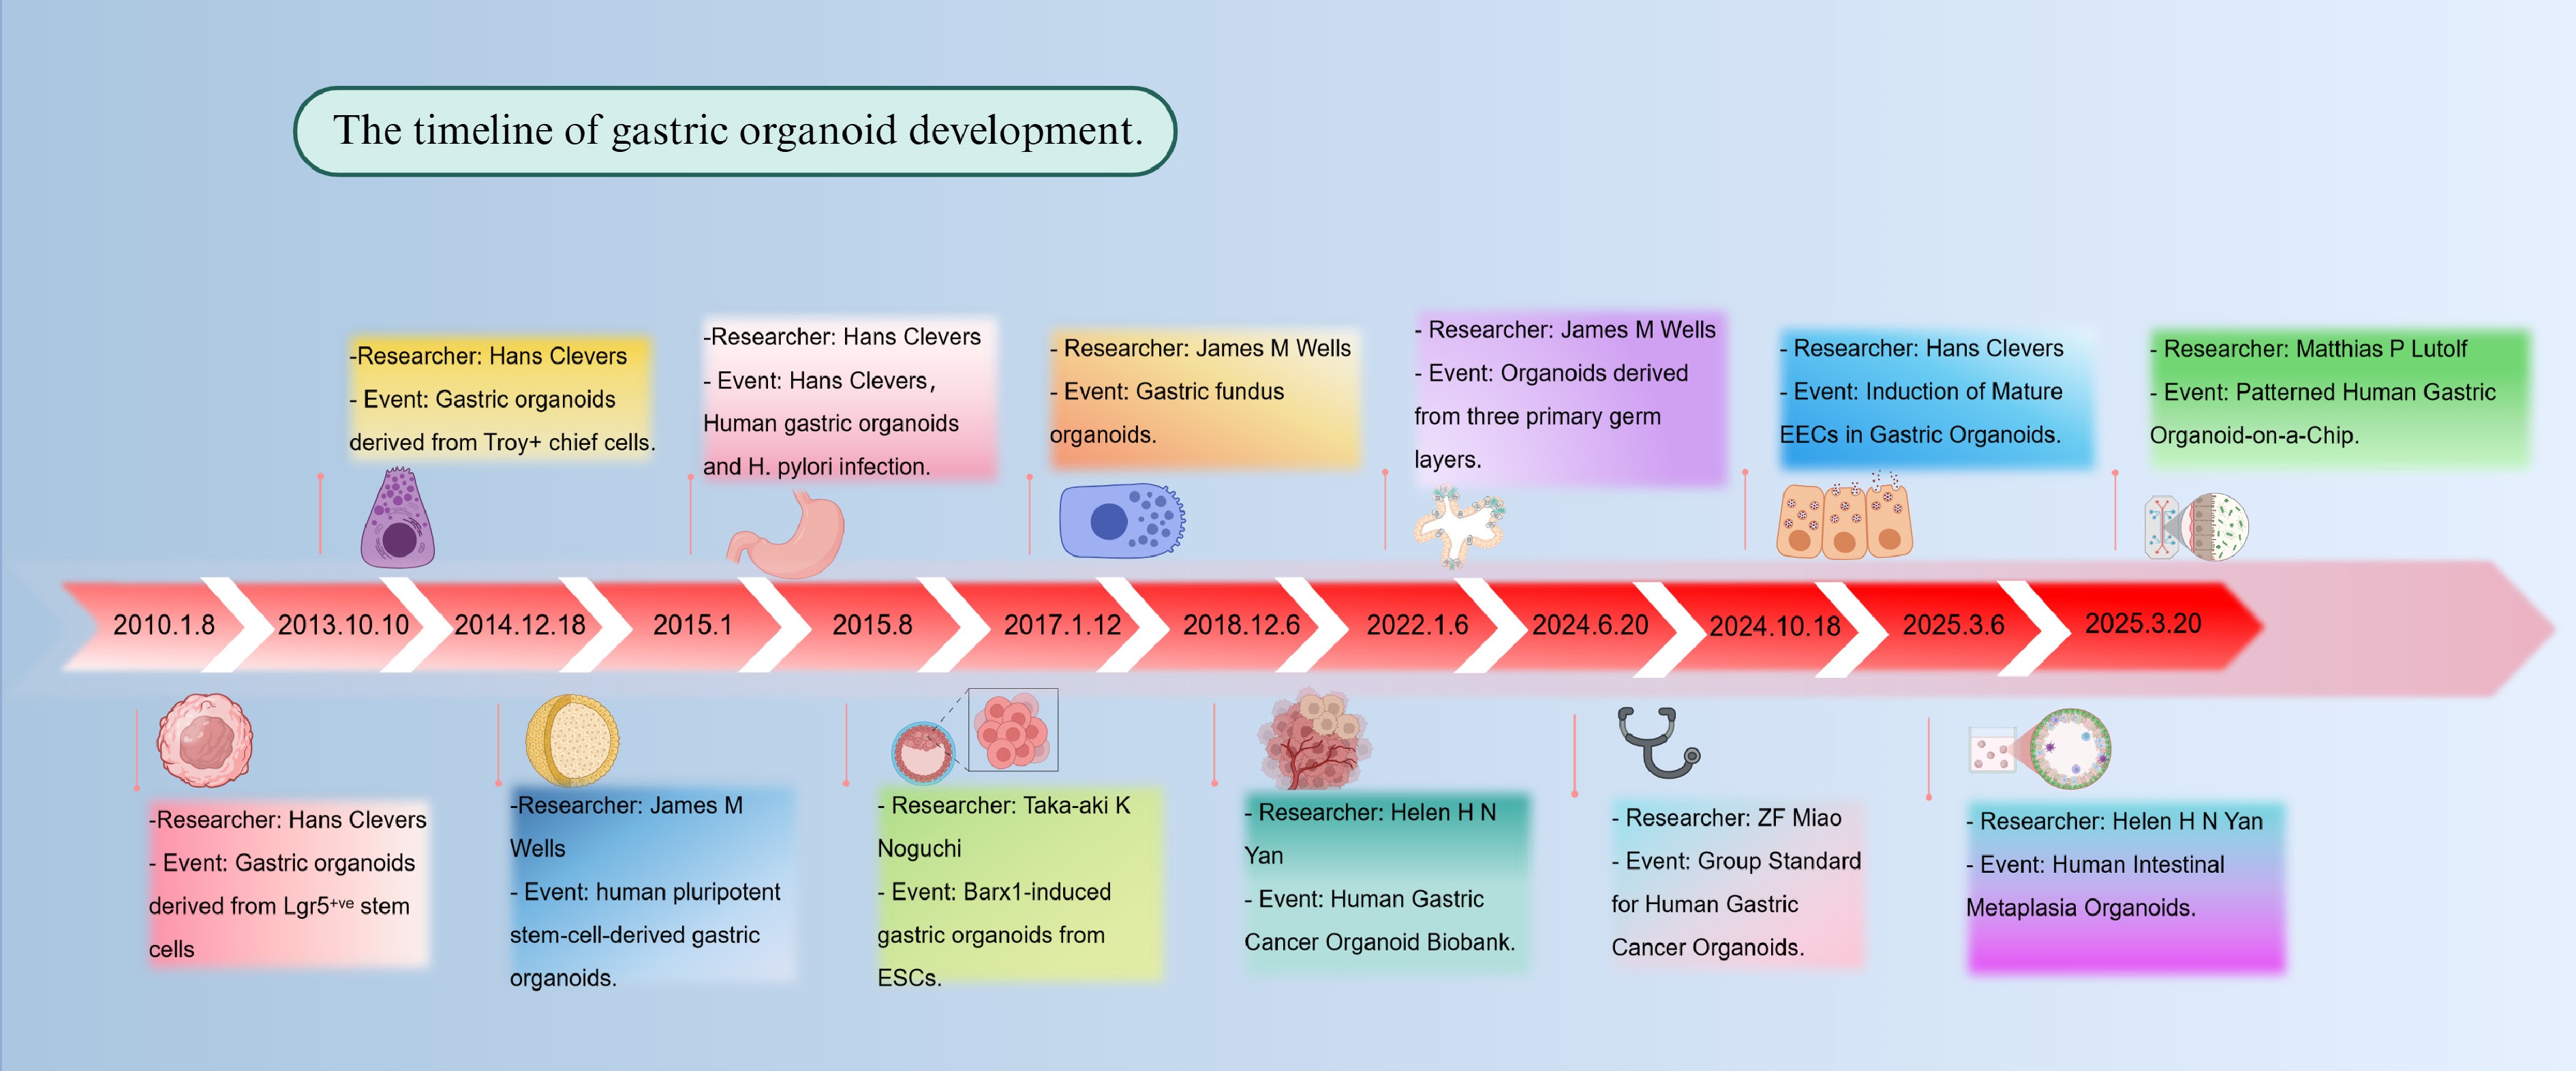
Figure 2.
Timeline of gastric organoid development. The figure illustrates the establishment of the first organoid and major milestones in the development and application of gastric organoid models from 2013 to 2025. Created in BioRender. Chen, E. (2025)
https://BioRender.com/9dh4twy . -
Organoids Co-cultured cells Co-culture ratio Culture method Publication year Ref. PDOs CTLs Not mentioned Mix in Matrigel 2021 [91] HuFGOs DCs, CTL Not mentioned Mix in Matrigel 2019 [55] PDOs PBMCs 1:5 Not mentioned 2021 [92 Mouse gastroid Macrophages Not mentioned Transwell 2019 [56] PDOs Macrophages 300:105 Co-cultured in the medium 2024 [65] HuFGOs DCs 80:105 Organoids in Matrigel, overlaid with DCs 2019 [93] HuFGOs DCs Not mentioned GOFlowChip 2021 [94] Mouse and human gastroid DCs Not mentioned Transwell 2022 [95] PDOs CAFs 2:1 Mix in Matrigel 2024 [40] TCs 1:5 Mix in Matrigel Mouse and human gastroid ILC2s Not mentioned Mix in Matrigel 2024 [96] The table outlines the types of co-cultured cells, their respective ratios, and the co-culture methods used, offering a concise overview of technical approaches in the field. Table 1.
Co-culture models of gastric organoids with various cell types in recent literature.
Figures
(2)
Tables
(1)