-
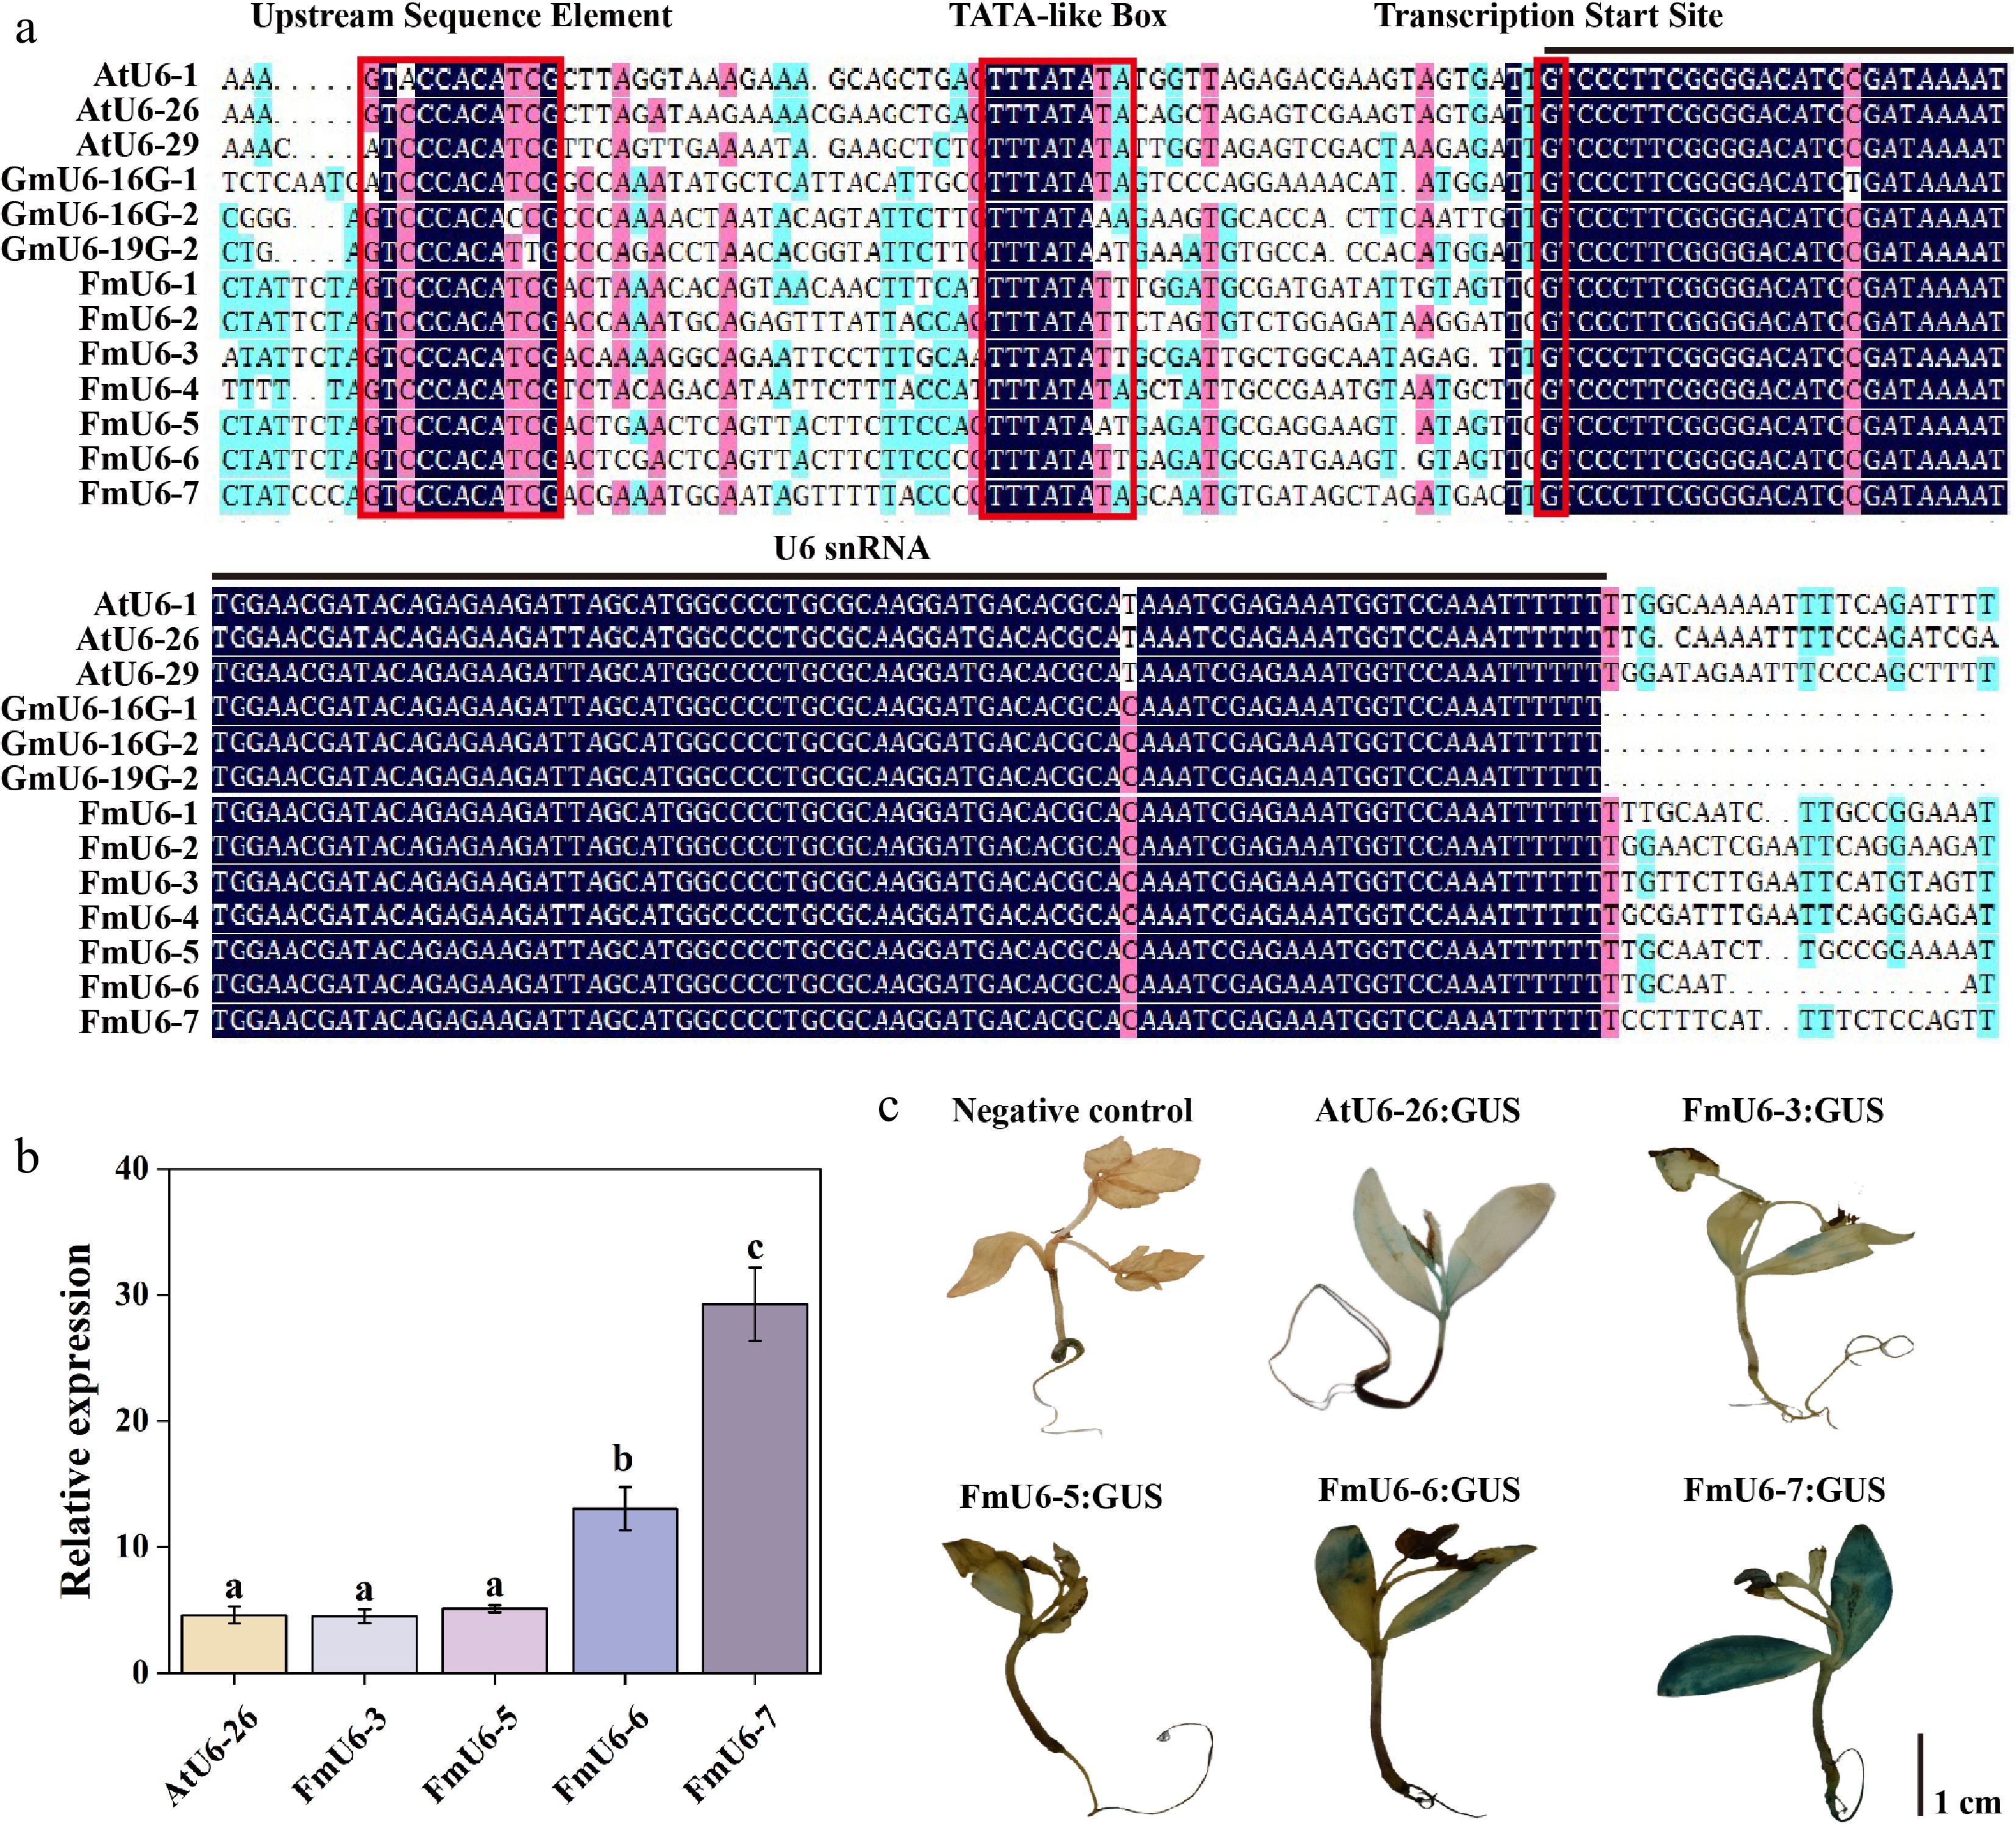
Figure 1.
Identification and activity validation of FmU6 promoters in F. mandshurica. (a) Multiple alignments of F. mandshurica, Arabidopsis, and soybean U6 gene and promoter sequences. The red boxes with solid lines indicate upstream sequence element (USE), TATA-like box, and the transcription start site. The black line shows the U6 snRNA transcript. (b) The relative expression levels of GUS driven by the promoters of AtU6-26, FmU6-3, FmU6-5, FmU6-6, and FmU6-7 in seedlings of F. mandshurica. Values represented mean ± SD (n = 3); different letters indicated significant differences (p < 0.05). (c) GUS staining driven by the negative control, promoters of AtU6-26, FmU6-3, FmU6-5, FmU6-6, and FmU6-7 in F. mandshurica seedlings. The scale bar represents 1 cm.
-
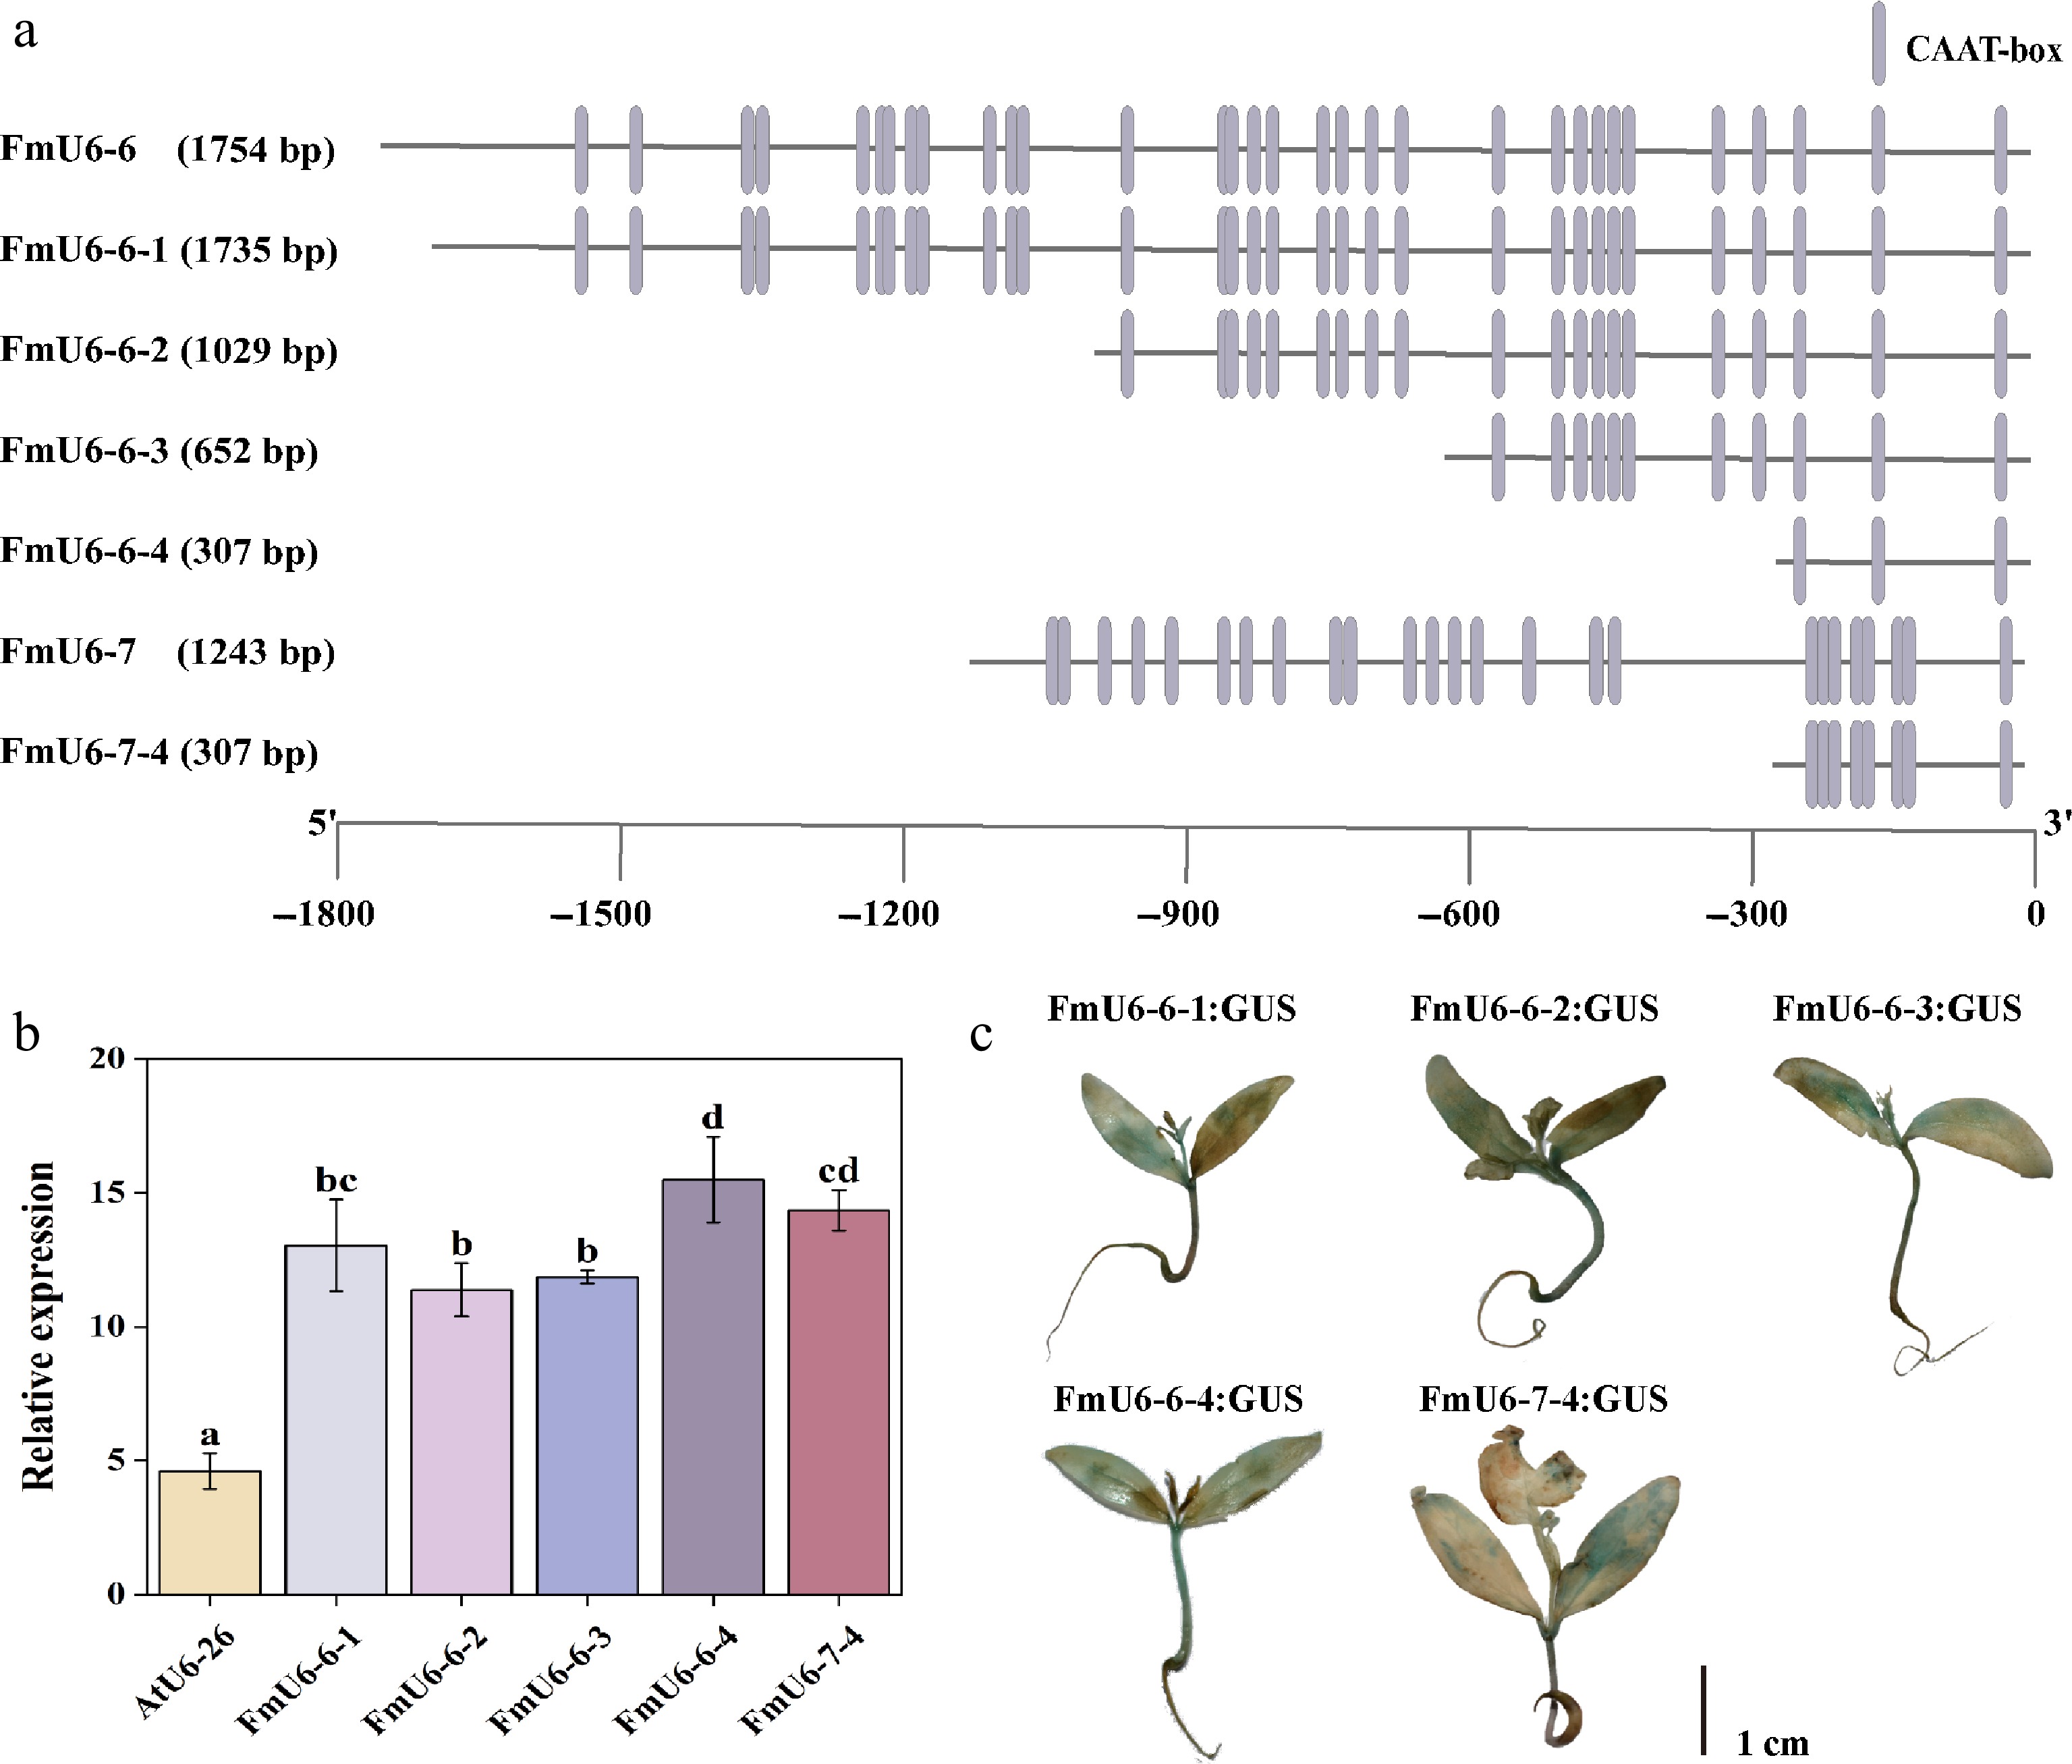
Figure 2.
Functional verification of FmU6 promoter fragments. (a) Truncation of FmU6-6 and FmU6-7 promoters. (b) The relative expression levels of GUS driven by the promoters of AtU6-26, FmU6-6-1, FmU6-6-2, FmU6-6-3, FmU6-6-4, and FmU6-7-4 in seedlings of F. mandshurica. Values represented mean ± SD (n = 3); different letters indicated significant differences (p < 0.05). (c) GUS staining in F. mandshurica seedlings. The scale bar represents 1 cm.
-
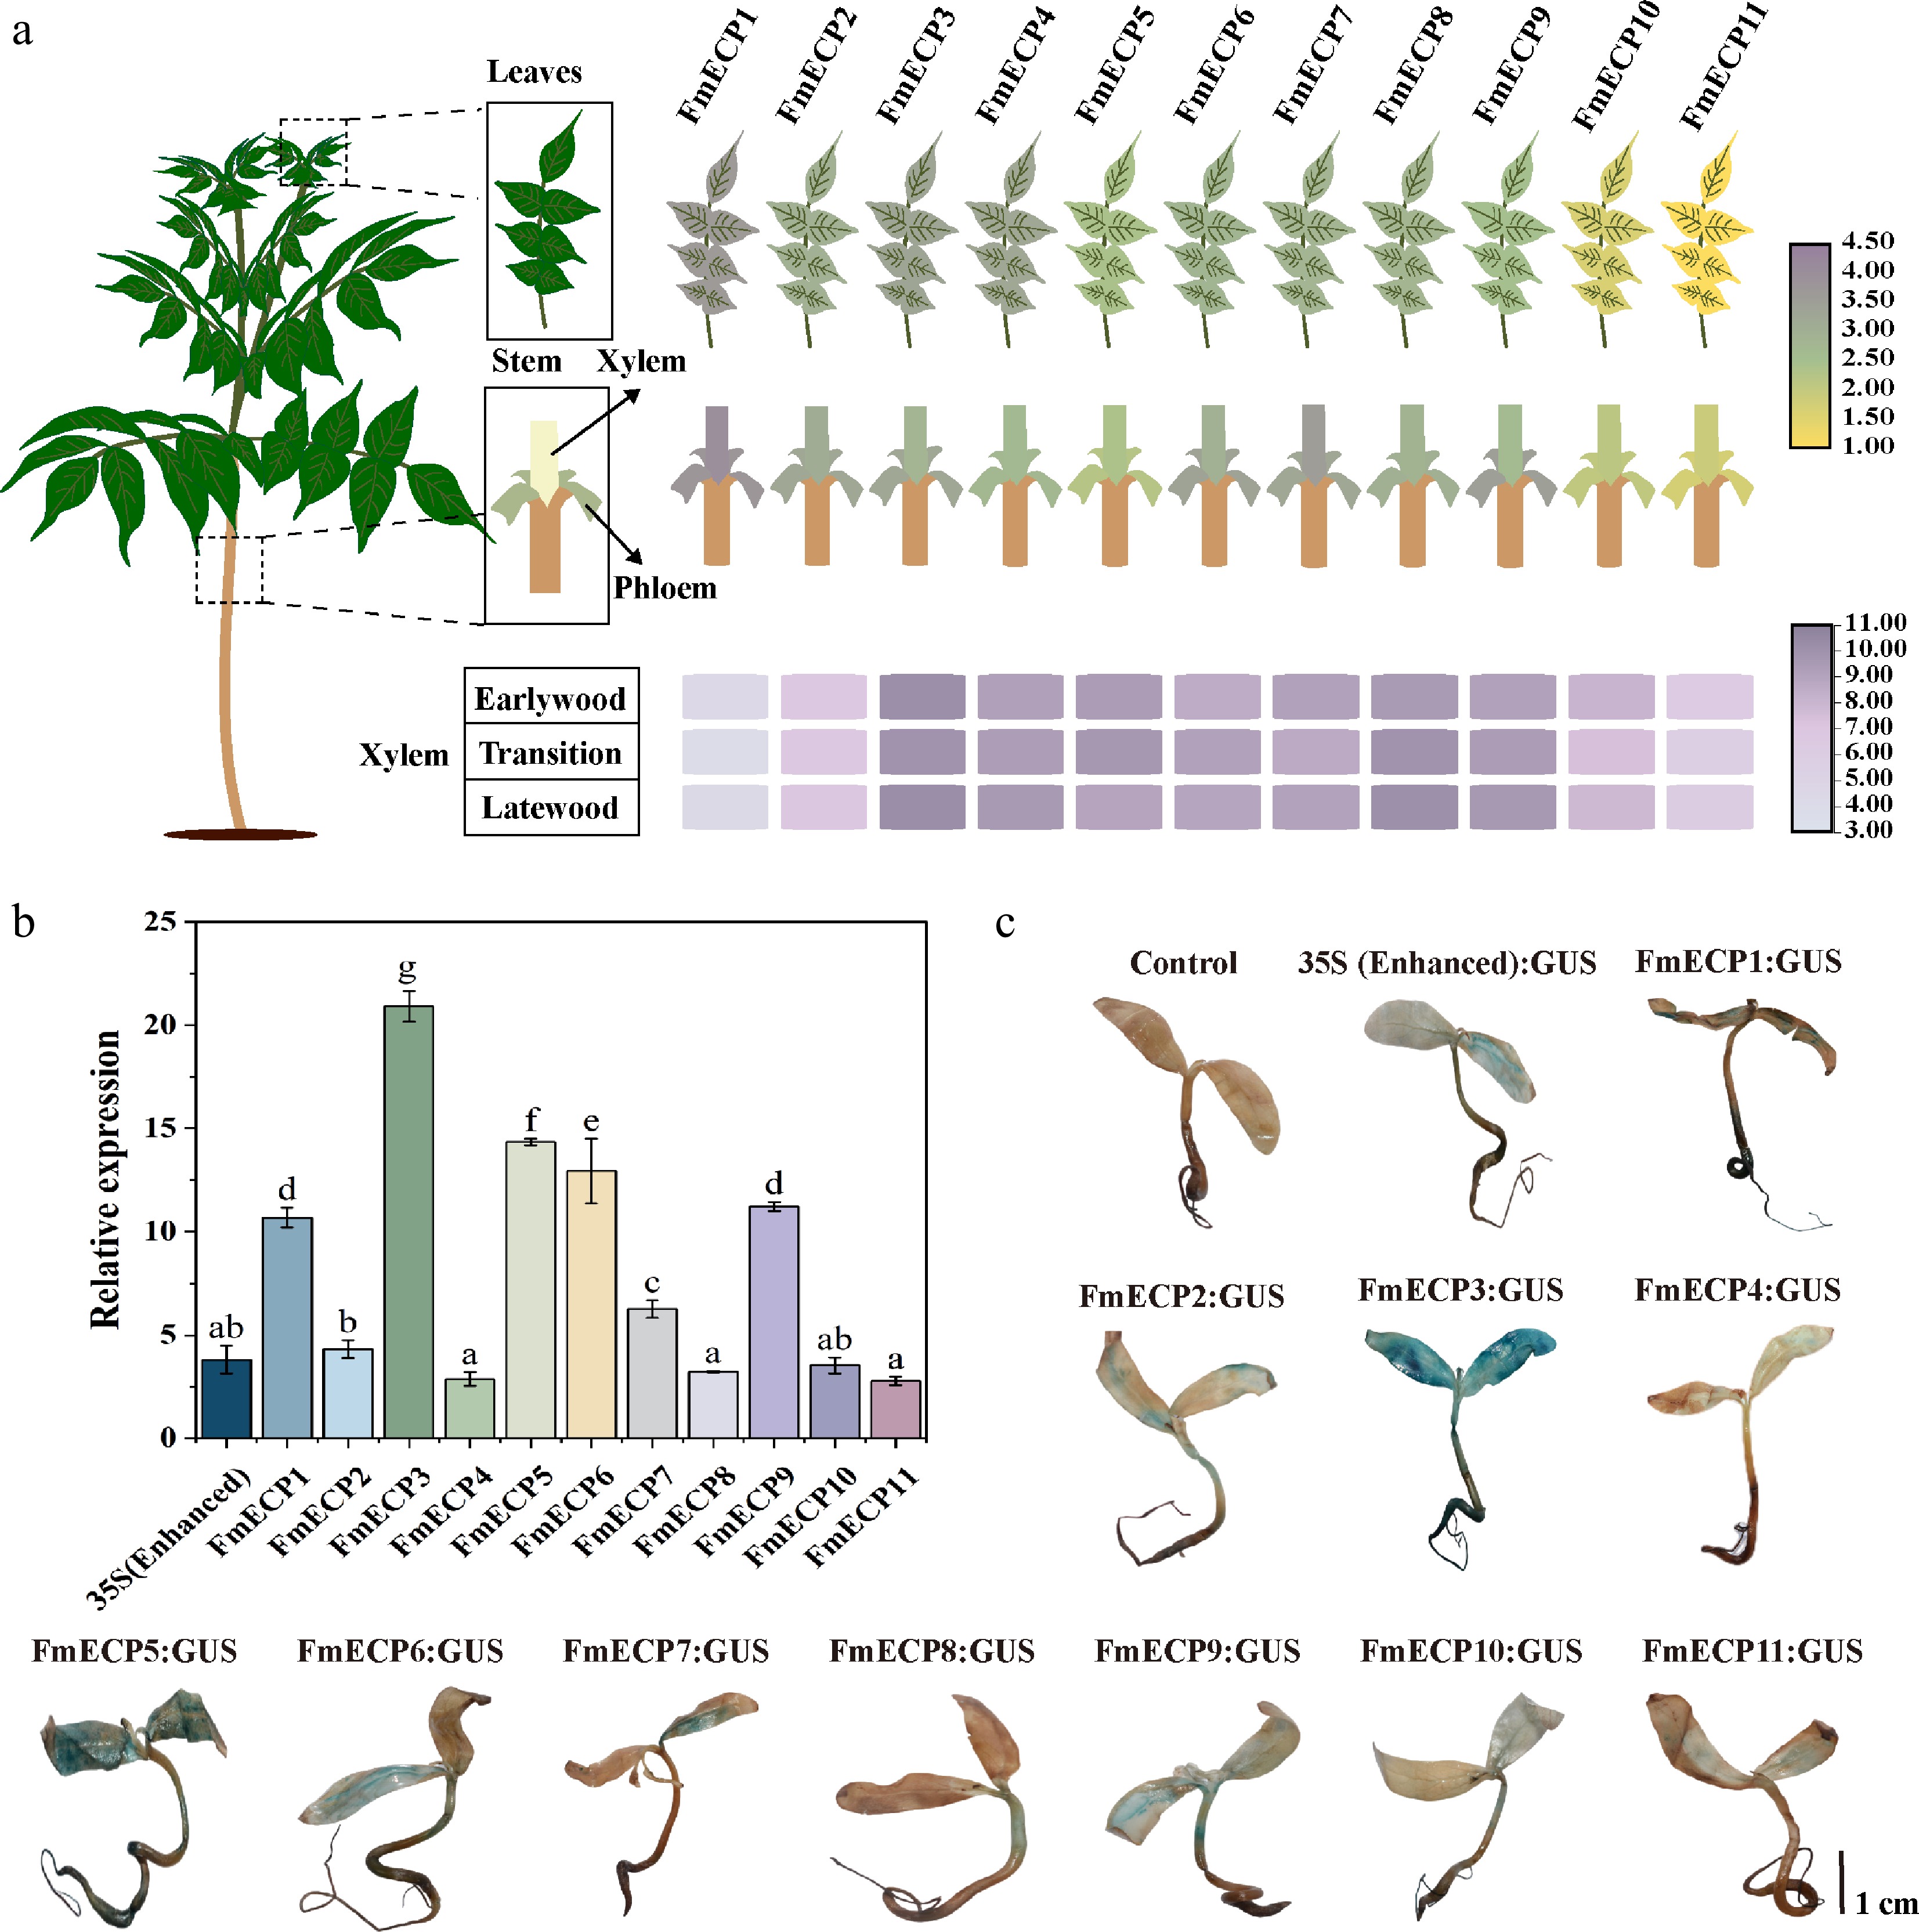
Figure 3.
Functional verification of FmECP promoters in F. mandshurica. (a) The expression profiles of genes driven by FmECP promoters, including the relative expression levels in leaves, xylem, phloem, earlywood, transition, and latewood. (b) The relative expression levels of GUS driven by 35S (enhanced) and FmECP promoters in seedlings of F. mandshurica. Values represented mean ± SD (n = 3); different letters indicated significant differences (p < 0.05). (c) GUS staining in F. mandshurica seedlings. The scale bar represents 1 cm.
-
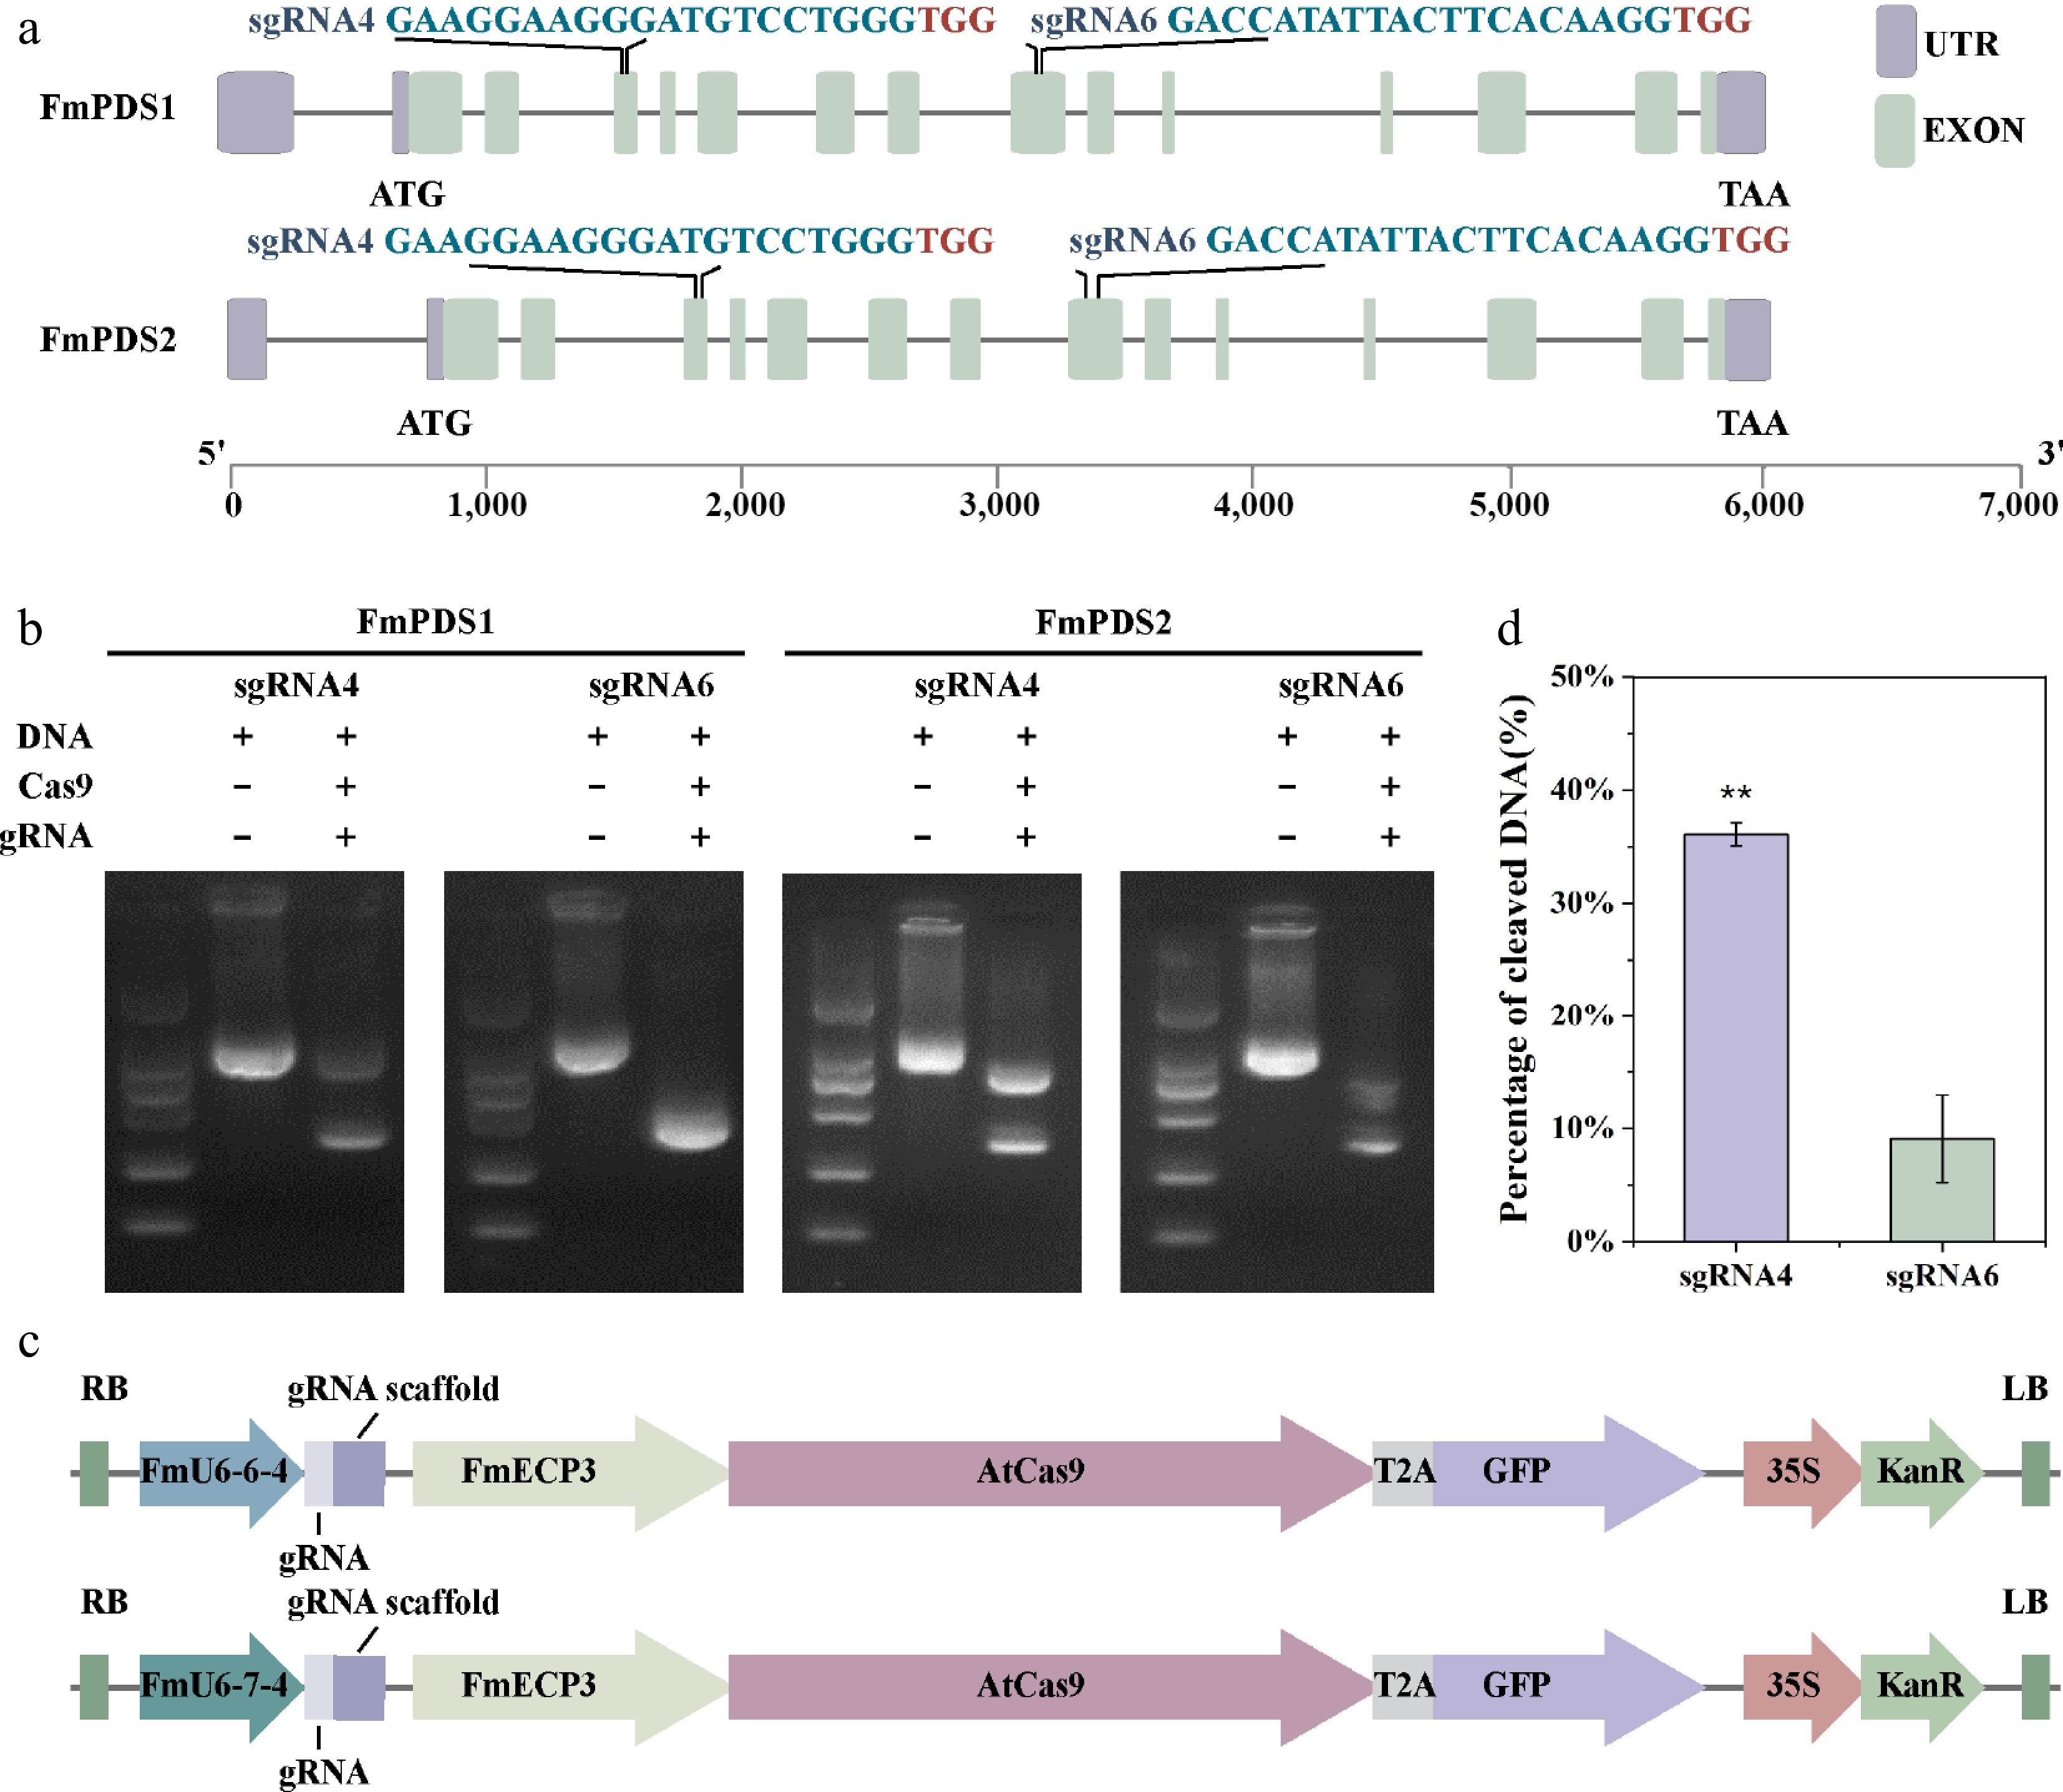
Figure 4.
SgRNA targeting sites in FmPDS1/2 and schematic structure of genome editing vectors. (a) Schematic position of the two gRNAs targeting FmPDS1/2 genes. The selected target sequences are blue, and the PAM sequences are red. The purple box indicates UTR; the green box represents exon; the grey line represents intron. (b) Determination of the cutting efficiency of different gRNA in vitro. (c) The CRISPR/Cas9 vector structure of F. mandshurica named pEgU6E3 and pEgU7E3, respectively. (d) Determination of cleaving efficiencies at the different target sites. Asterisks indicate levels of significance (t-test; **p < 0.01).
-
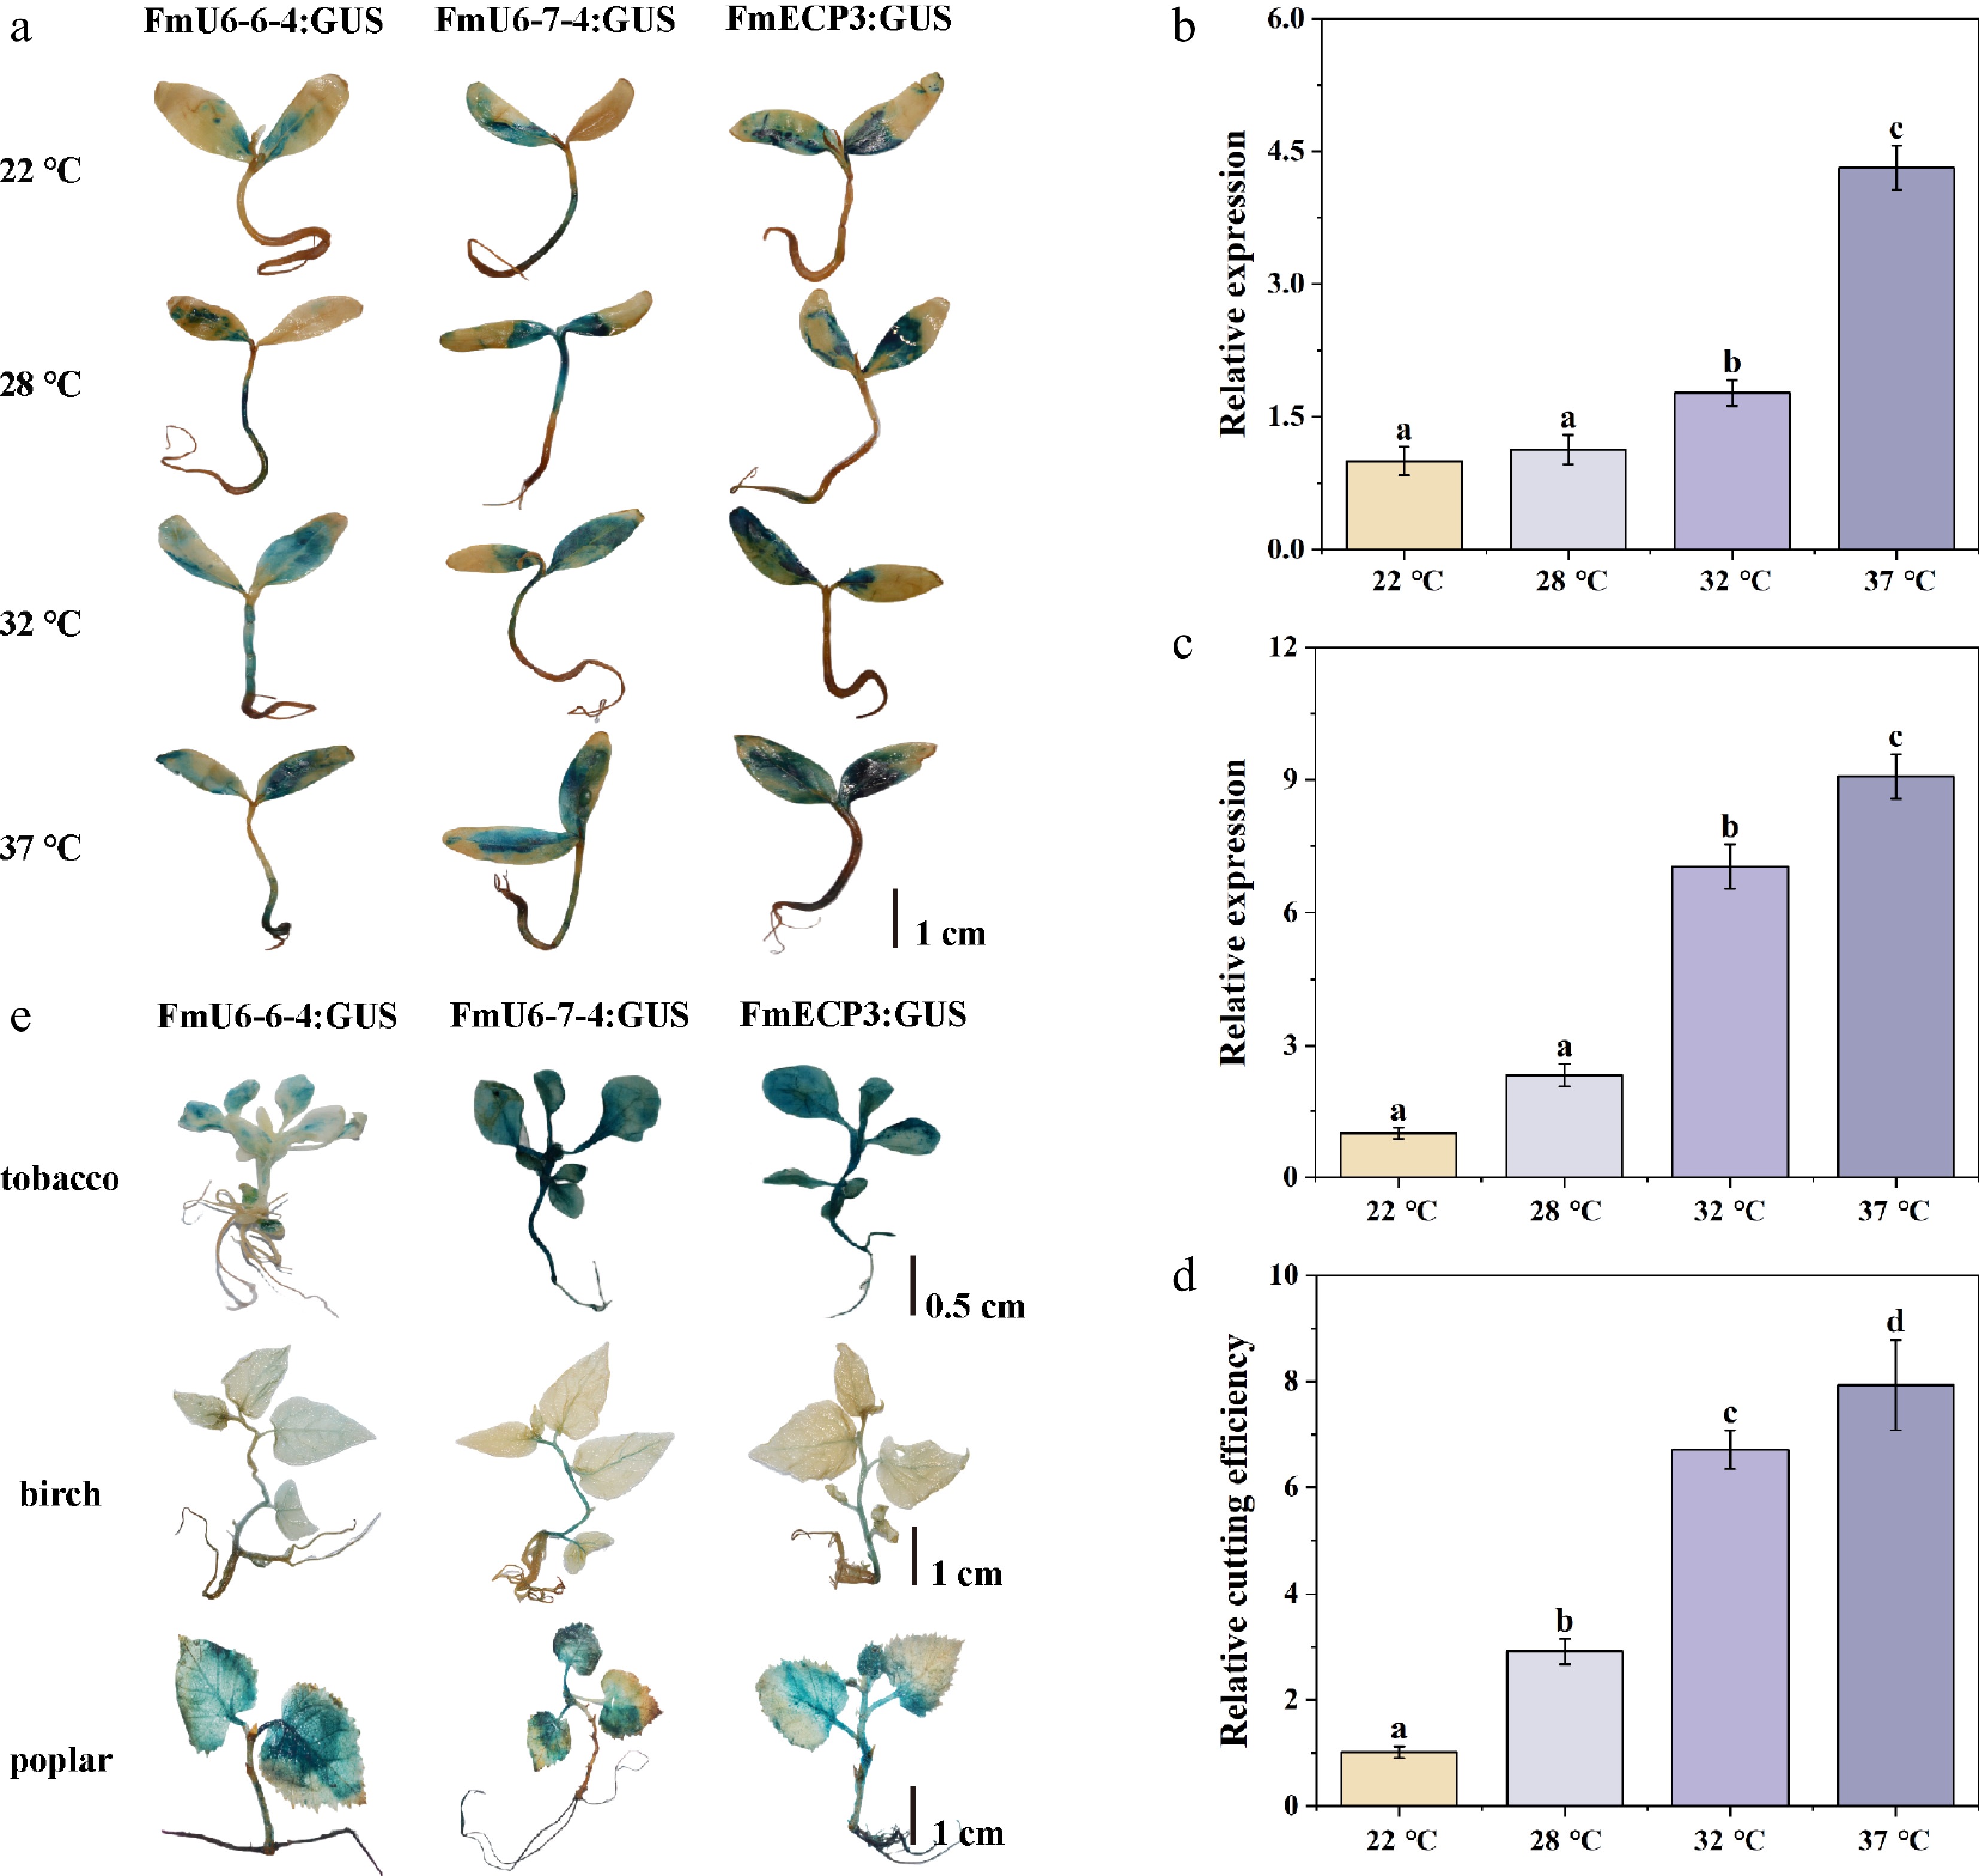
Figure 5.
Temperature effect on CRISPR-Cas9-mediated genome editing. (a) The staining of GUS driven by FmU6-6-4, FmU6-7-4, and FmECP3 promoters under different temperature (22, 28, 32, 37 °C) treatments in F. mandshurica seedlings. The scale bar represents 1 cm. (b) The relative expression level of gRNA driven by FmU6-7-4 promoter. (c) Cas9 driven by FmECP3 promoter in seedlings of F. mandshurica under different temperature treatments. (d) Determination of the cutting efficiency under different temperature treatments. Values represented mean ± SD (n = 3); different letters indicated significant differences (p < 0.05). (e) GUS staining in tobacco, birch, and poplar seedlings. GUS was under the control of promoters of FmU6-6-4, FmU6-7-4, and FmECP3. The scale bar represents 1 cm.
-
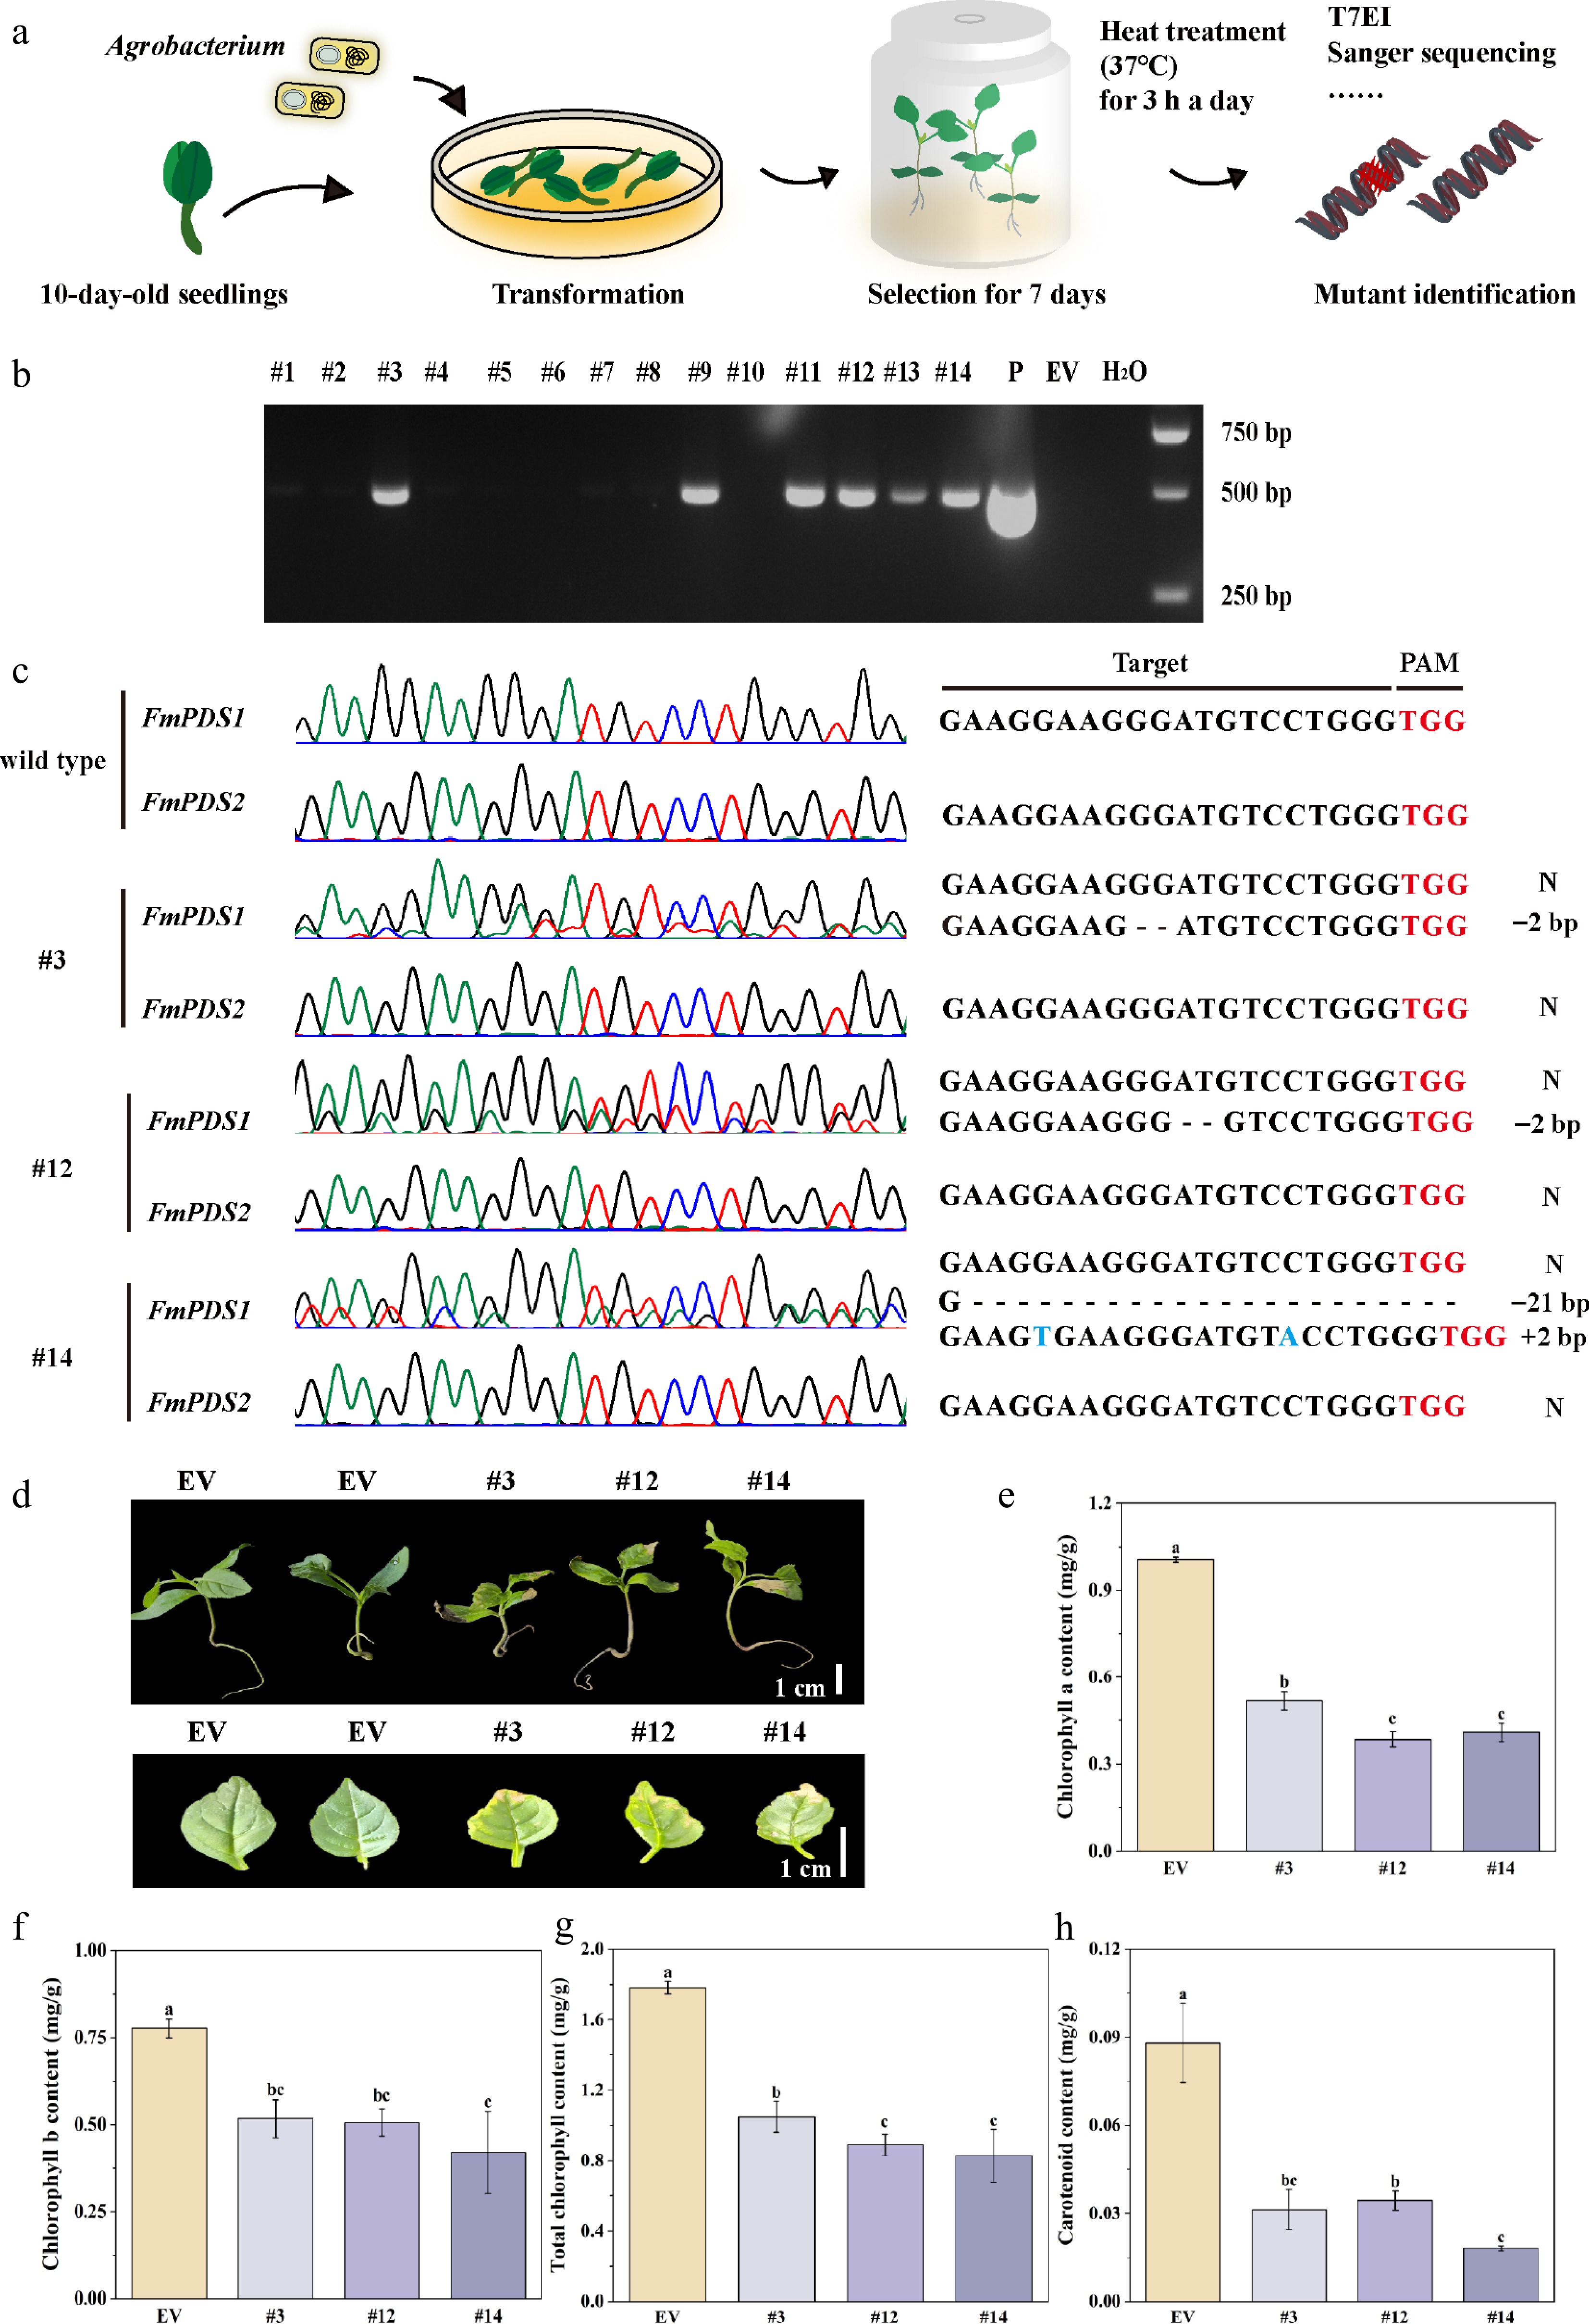
Figure 6.
Transient transformation mediated CRISPR/Cas9 system in F. mandshurica. (a) Flow chart of the CRISPR/Cas9 system in F. mandshurica mediated by transient transformation. (b) PCR assay of the genomic DNA of six transgene-positive seedlings (#3, #9, #11, #12, #13, #14). P, plasmid; EV, empty vector. (c) Sanger sequencing results of FmPDS1 and FmPDS2 in mutations. N, without mutation. +, insertion, –, deletion. (d) Phenotypes of mutations, including the whole plant and true leaf. The scale bar represents 1 cm. (e) Statistics of chlorophyll a. (f) Chlorophyll b. (g) Total chlorophyll content. (h) Carotenoid content. Values represented mean ± SD (n = 3); different letters indicated significant differences (p < 0.05).
-
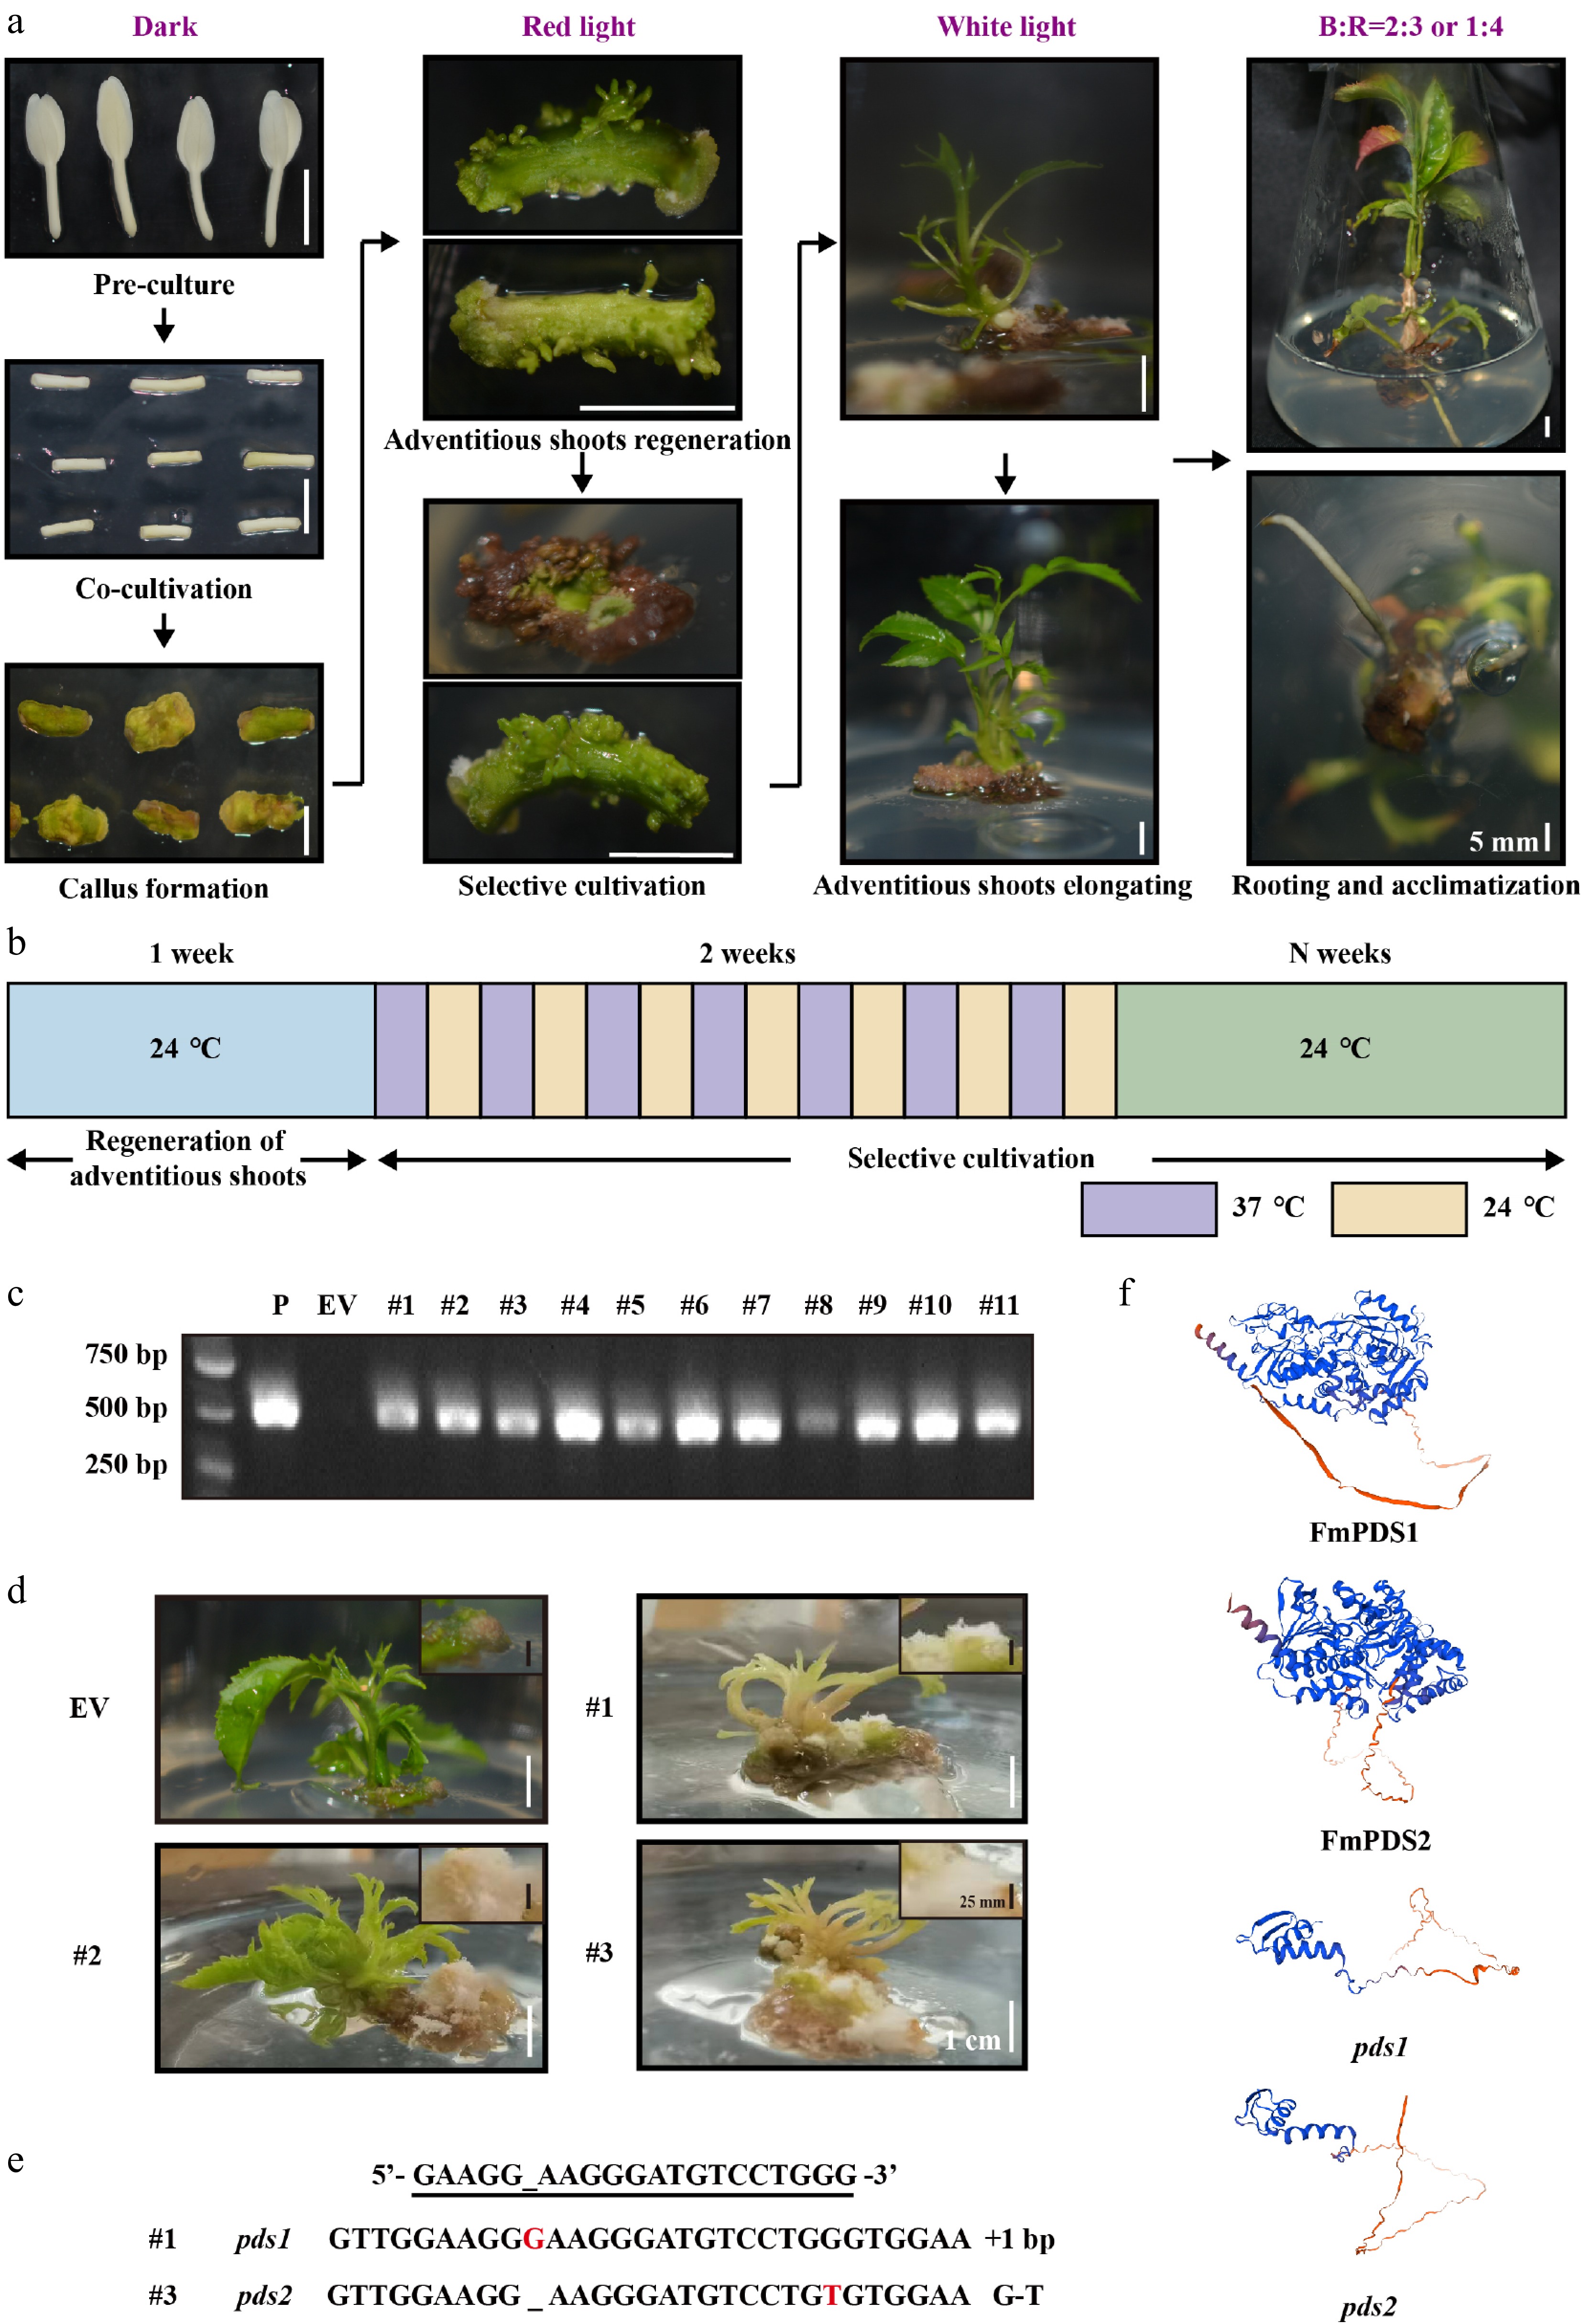
Figure 7.
CRISPR/Cas9 genome editing of FmPDS1/2 genes in F. mandshurica. (a) Agrobacterium-mediated genetic transformation process of F. mandshurica with hypocotyl explants. The scale bar represents 5 mm. (b) Schematic diagram of high temperature (37 °C) and room temperature (24 °C) alternating culture during selective cultivation. (c) PCR assay of the genomic DNA of seedlings. P, plasmid; EV, empty vector. (d) Bleaching phenotype of FmPDS gene-mutated plants of F. mandshurica. EV, non-edited plants. The white scale bar represents 1 cm. The callus was enlarged in the upper right corner. The black scale bar represents 25 mm. (e) Sanger sequencing results of mutations (#1 and #3). +, insertion; G-T, G substituted by T. (f) The 3D structures of FmPDS1, FmPDS2, pds1 mutation in #1, and pds2 mutation in #3.
-
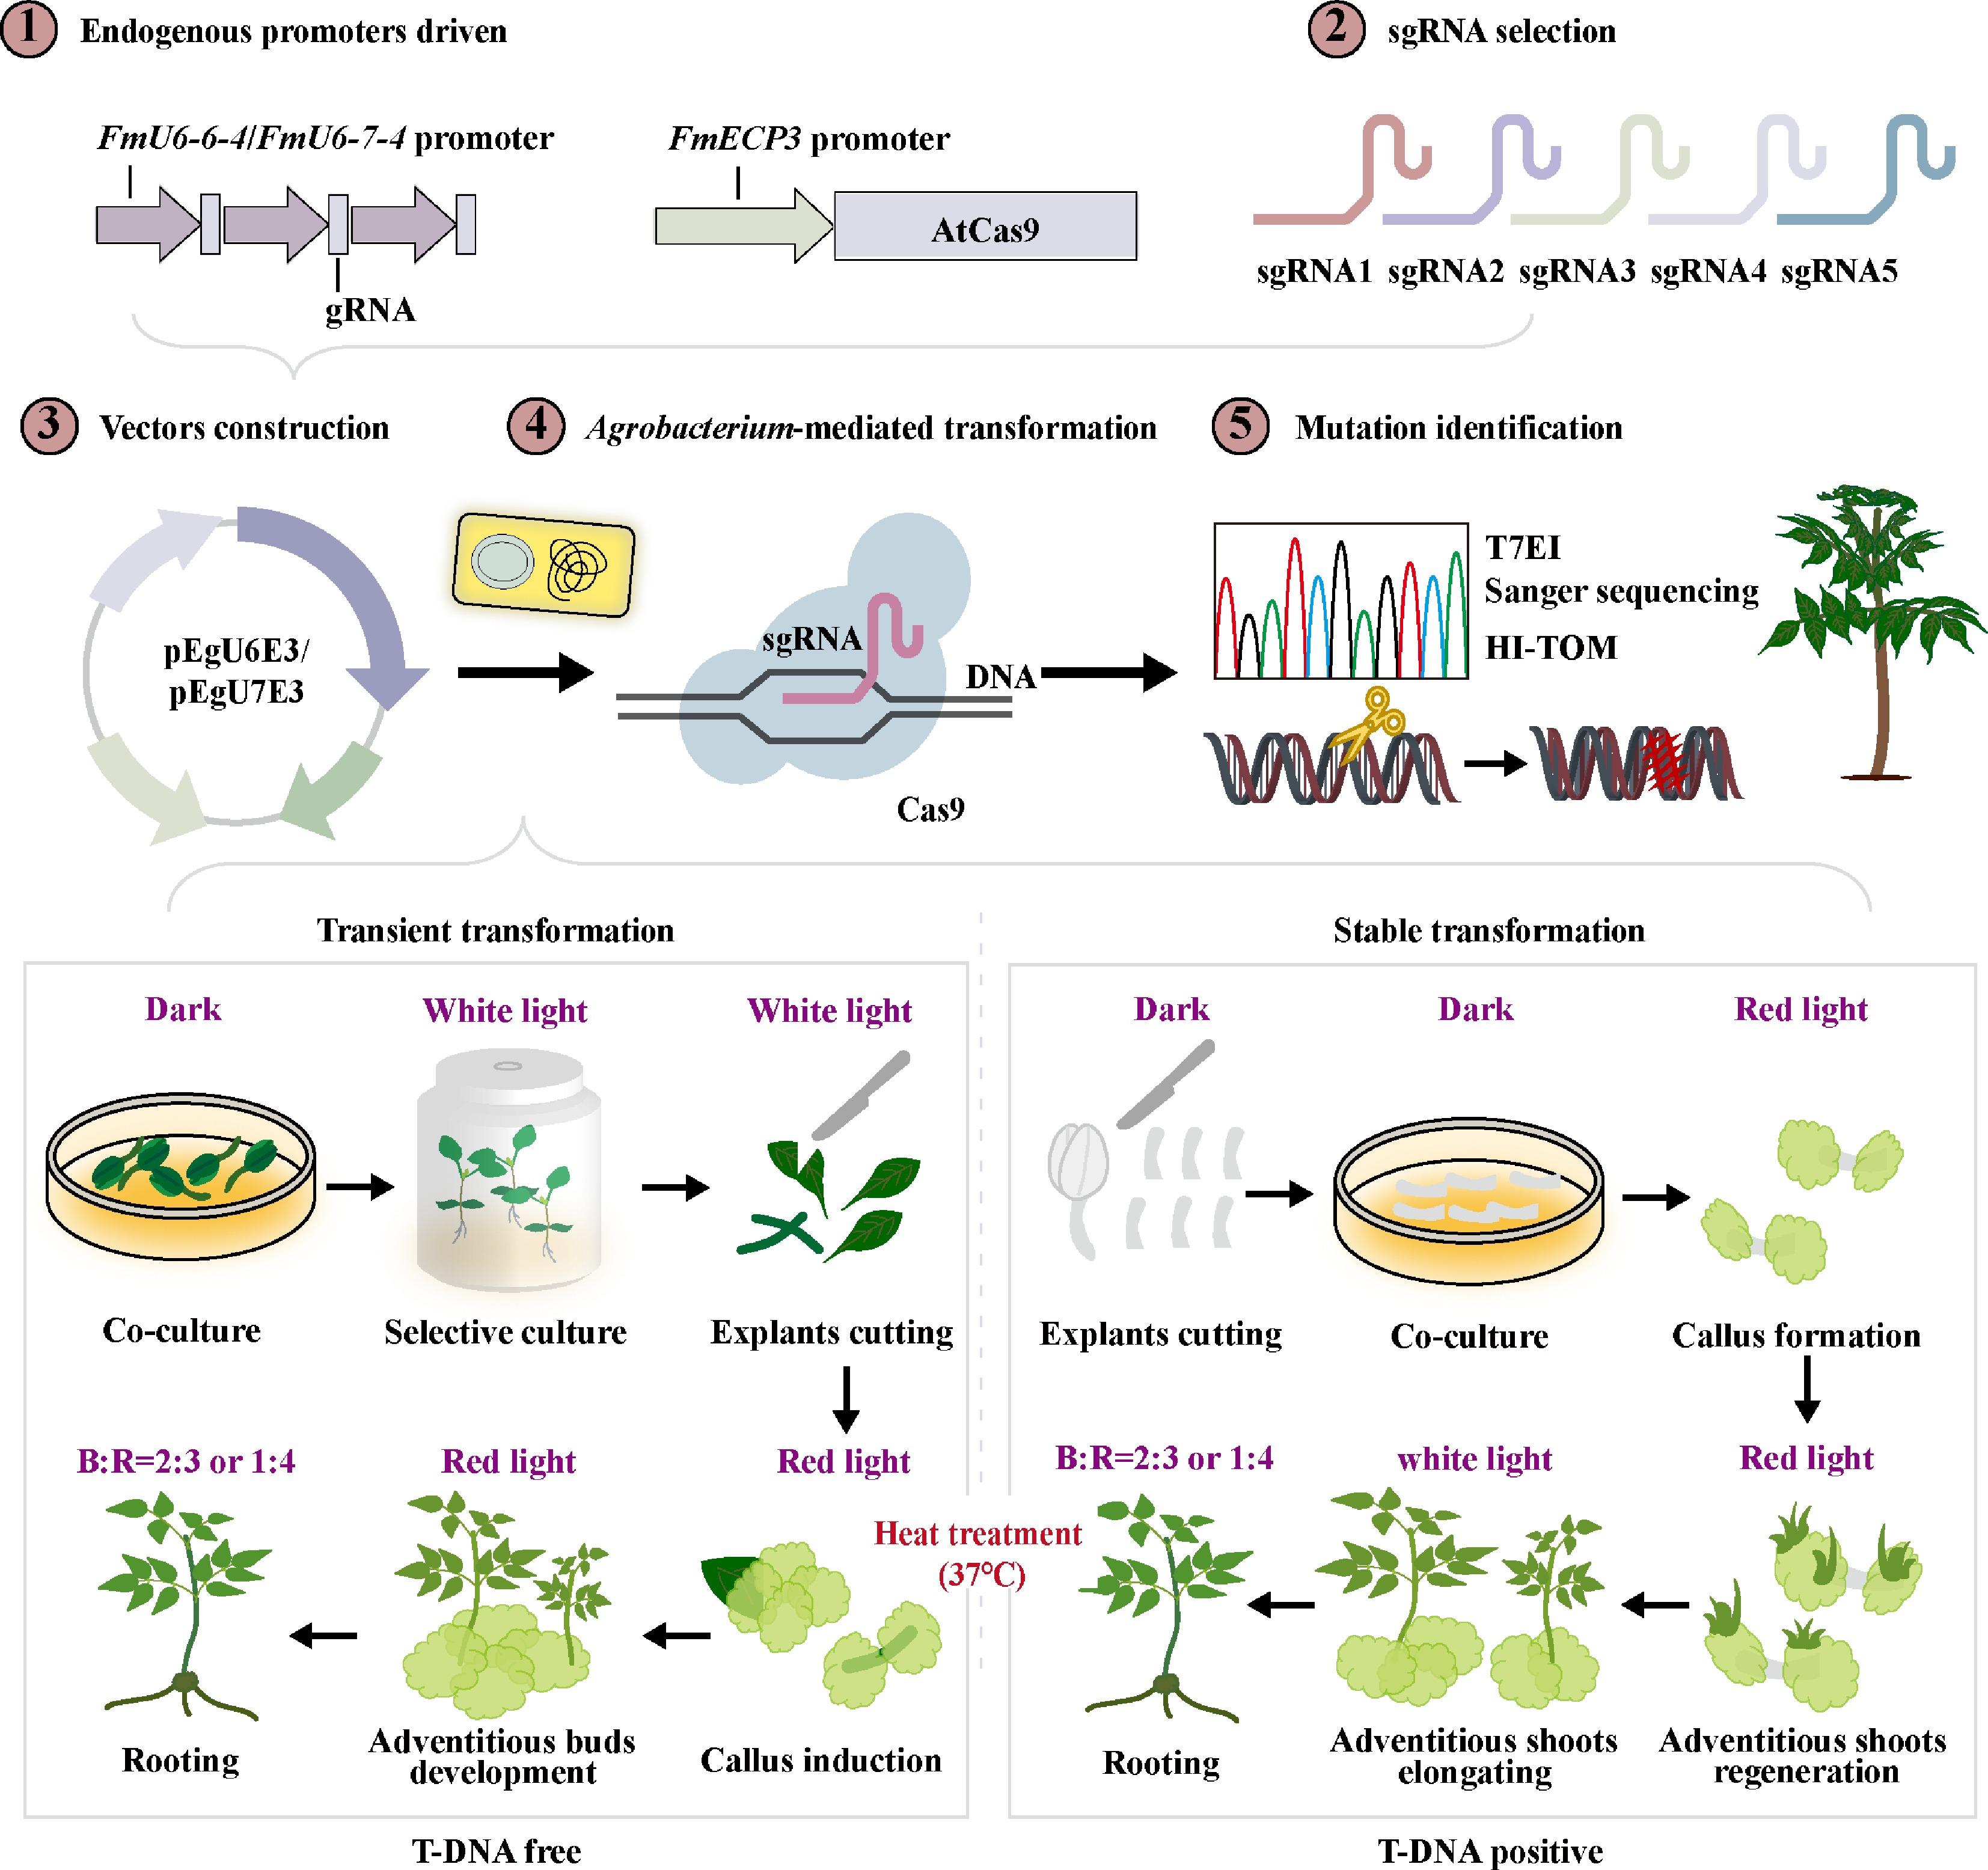
Figure 8.
A generalized road map of CRISPR/Cas9-mediated genome editing in F. mandshurica. These practices all involve the identification and screening of endogenous promoters, sgRNA design, vector construction, Agrobacterium-mediated transformation, and mutation detection. Among them, transformation is categorized into transient and stable forms, depending on whether the T-DNA integrates into the mutant genome. Furthermore, various combinations of light quality and heat treatments are incorporated into the transformation process to increase transformation and editing efficiencies.
Figures
(8)
Tables
(0)