-
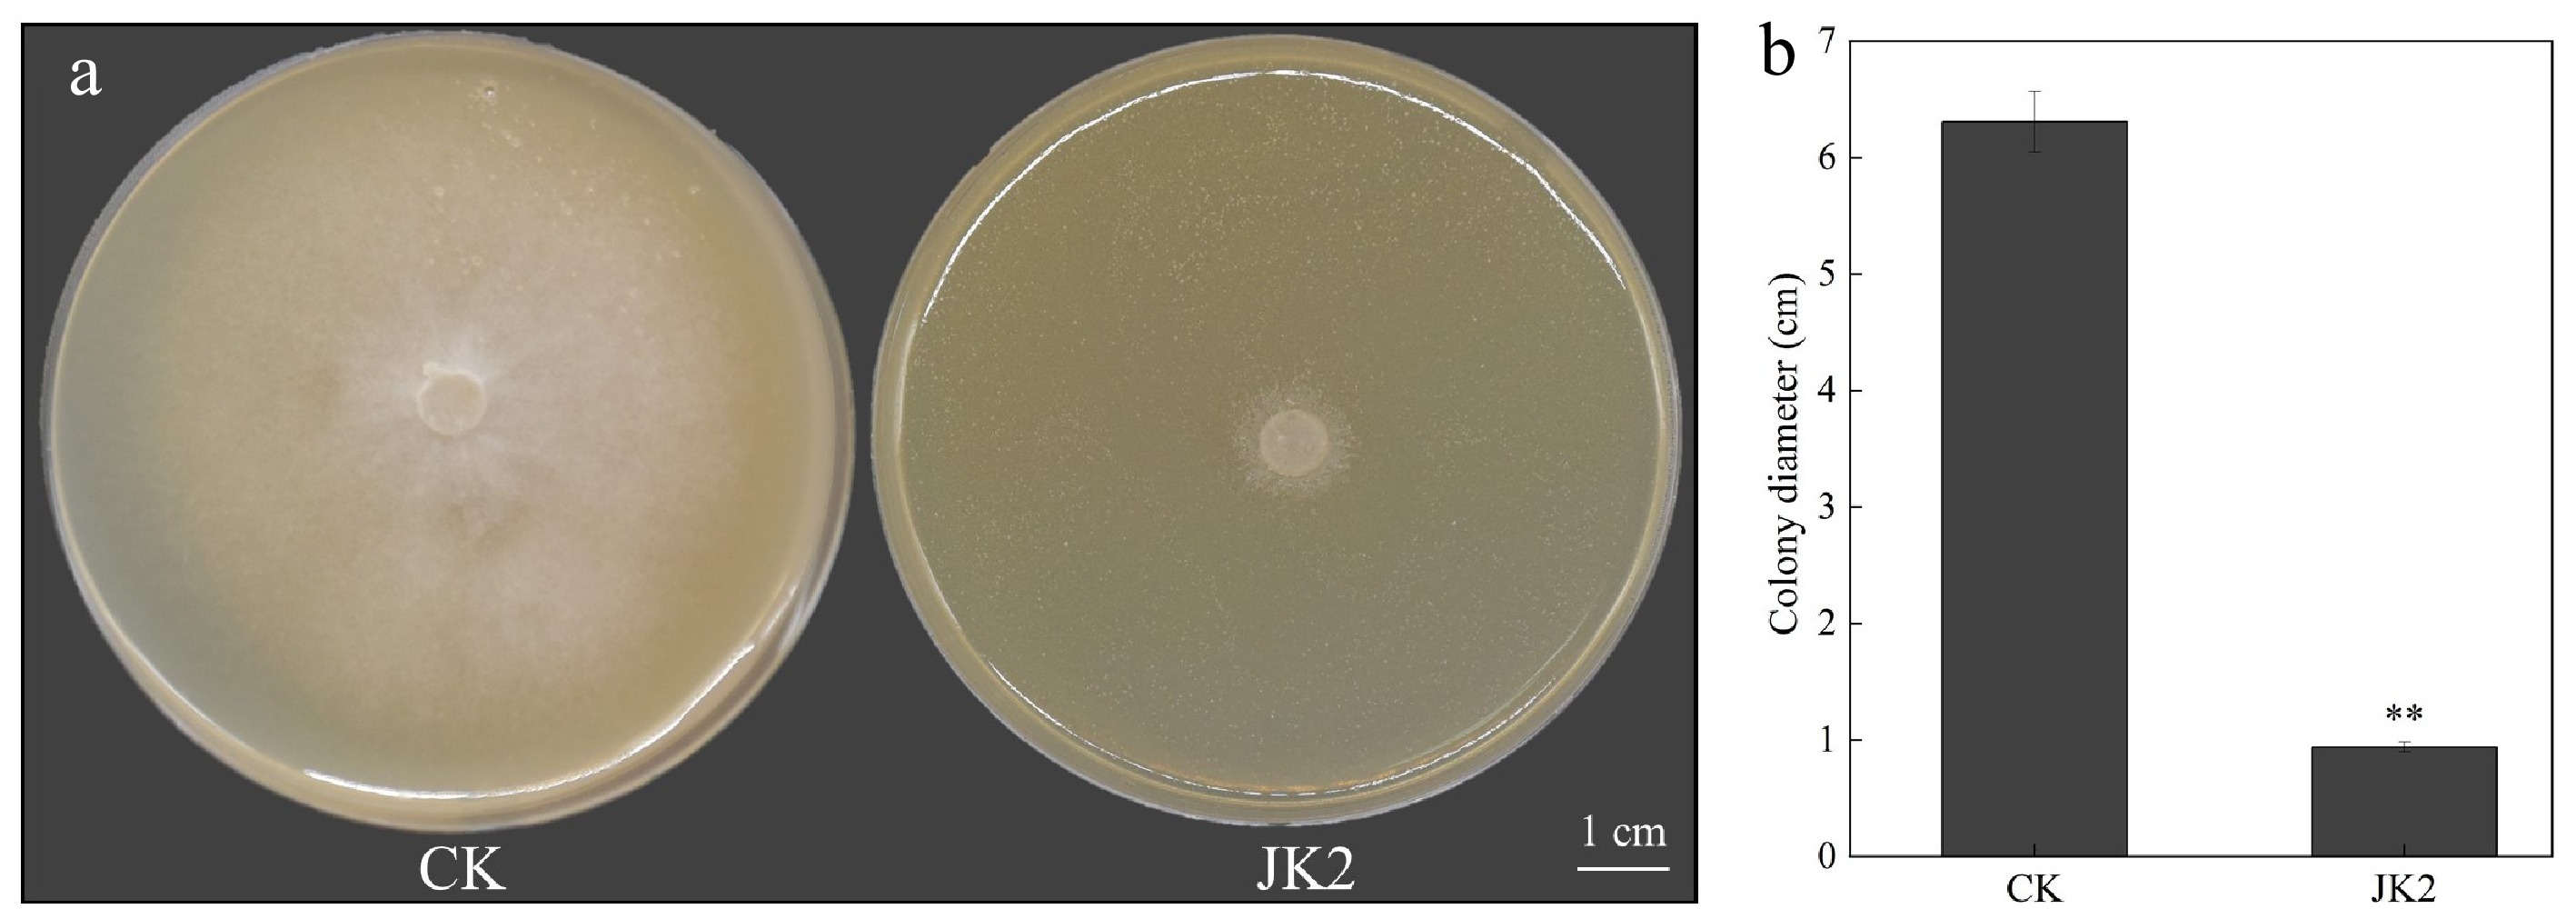
Figure 1.
Effect of strain JK2 on P. capsici in vitro. (a) Antifungal activity of JK2 against P. capsici in vitro. (b) Diameter of P. capsici after treatment with JK2 suspension. All experiments were repeated three times. Data represents means ± SD for three independent replicates. The statistical analyzes were performed using Duncan's multiple comparison (**, 0.001 < p < 0.01).
-
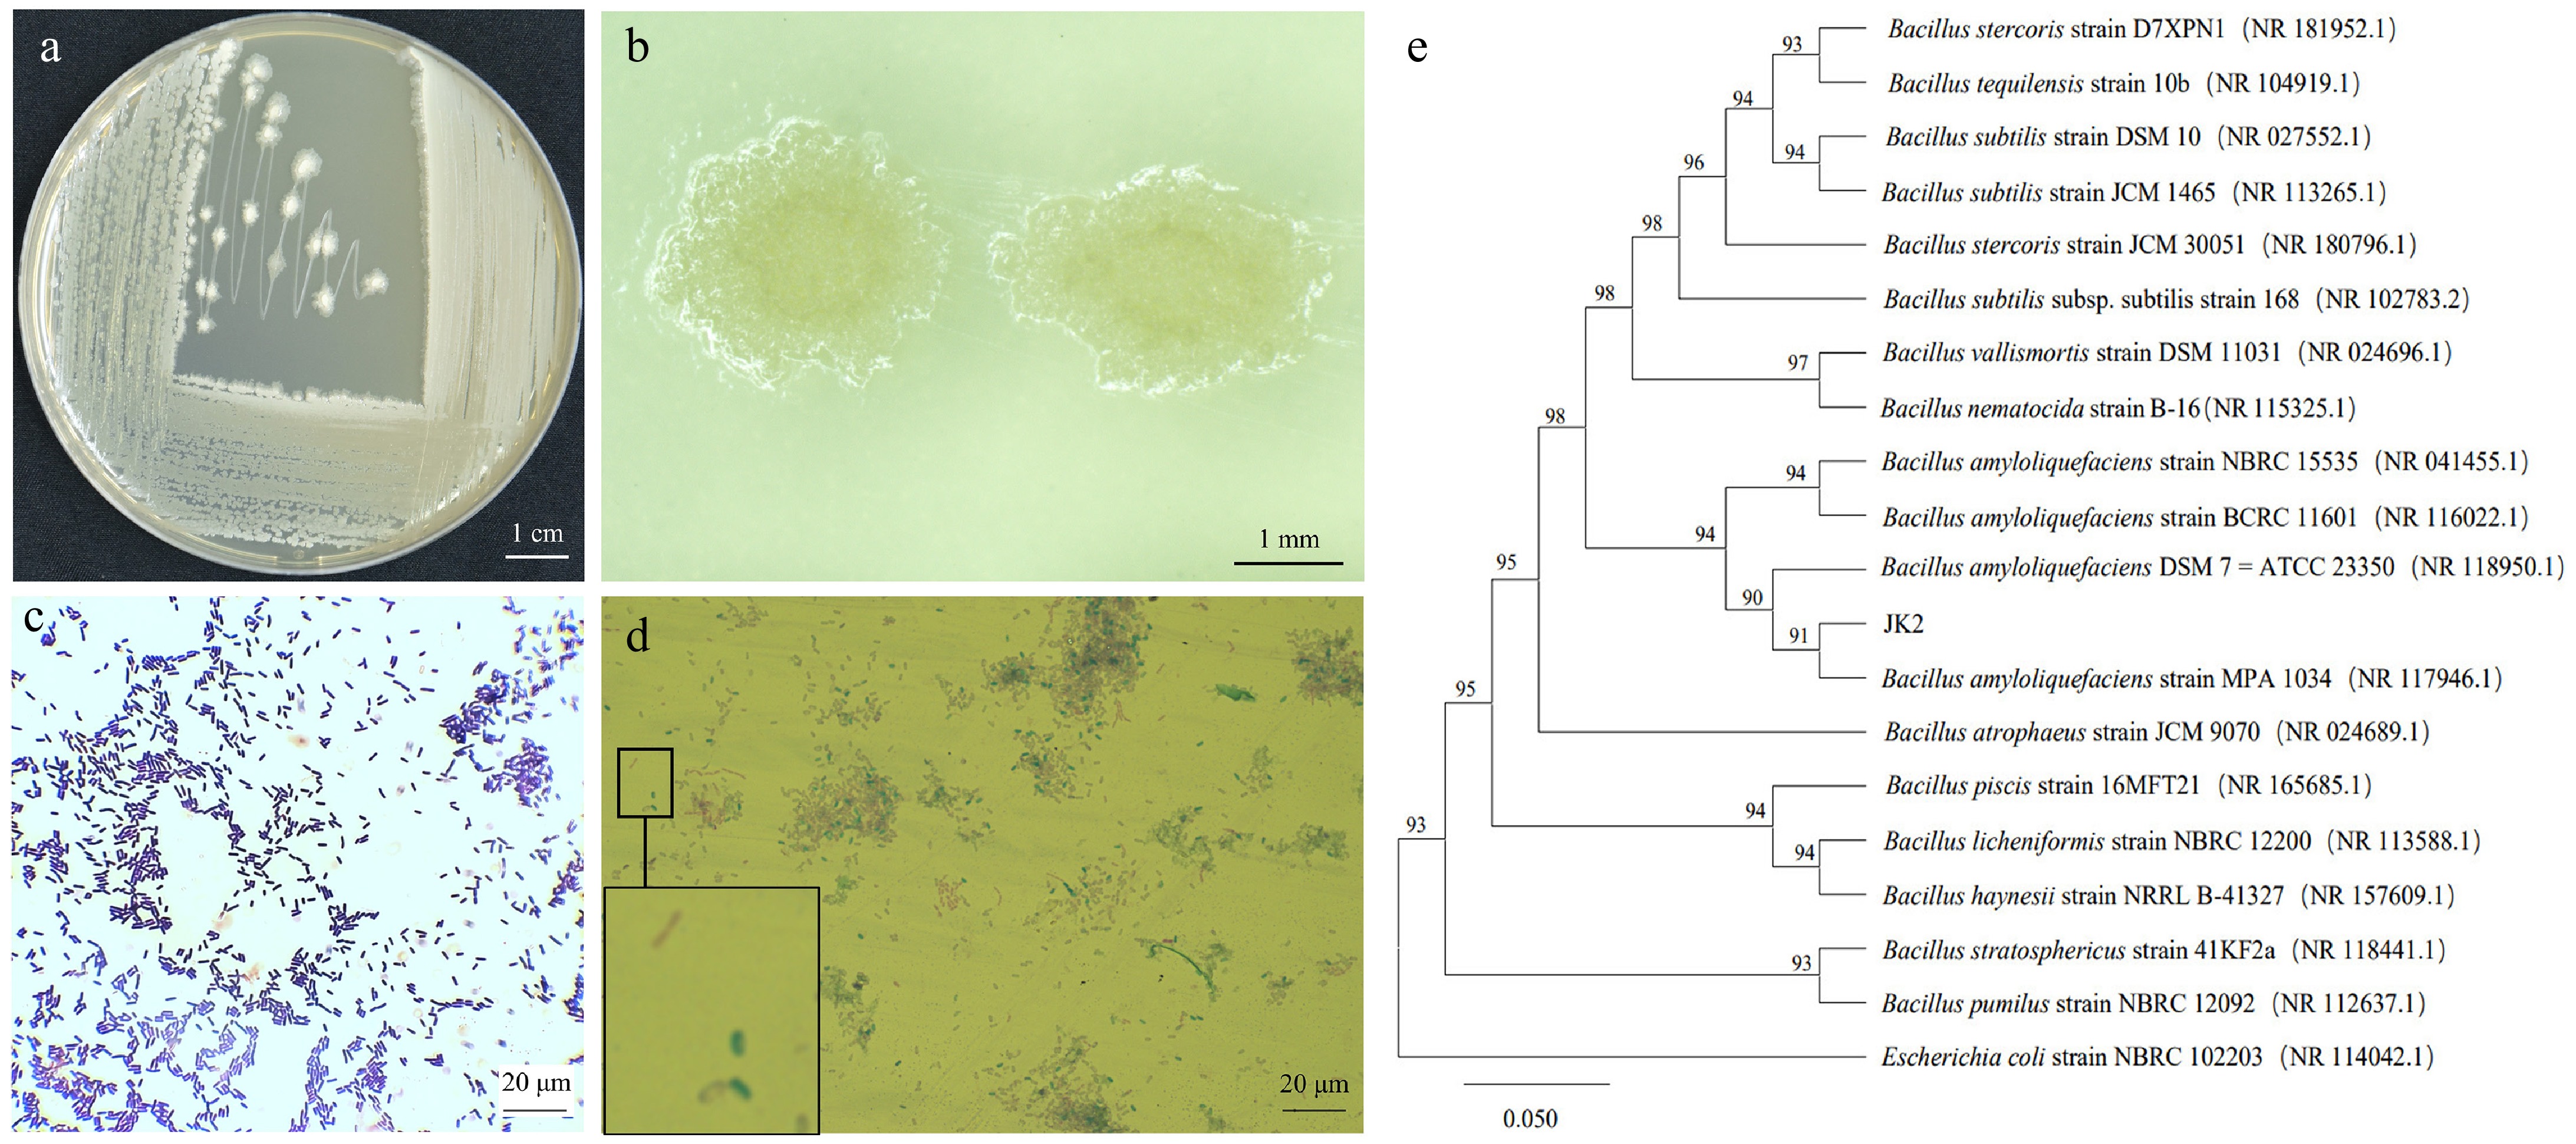
Figure 2.
Morphology and phylogenetic tree of antagonistic bacteria strain JK2. (a) Colony morphology of JK2 on LB medium. (b) Stereoscopic microscopic observation of JK2 single colony. (c) Microscopic observation of JK2 gram staining. (d) Microscopic observation of JK2 spore staining. (e) Phylogenetic tree of JK2 based on 16S rDNA sequence and closely related species constructed by the neighbor-joining method. The number at the nodes indicates the level of bootstrap support (%) based on 1,000 replicates. The scale bar at the bottom indicates the genetic distance. GenBank accession numbers analyzed here are shown in parentheses.
-
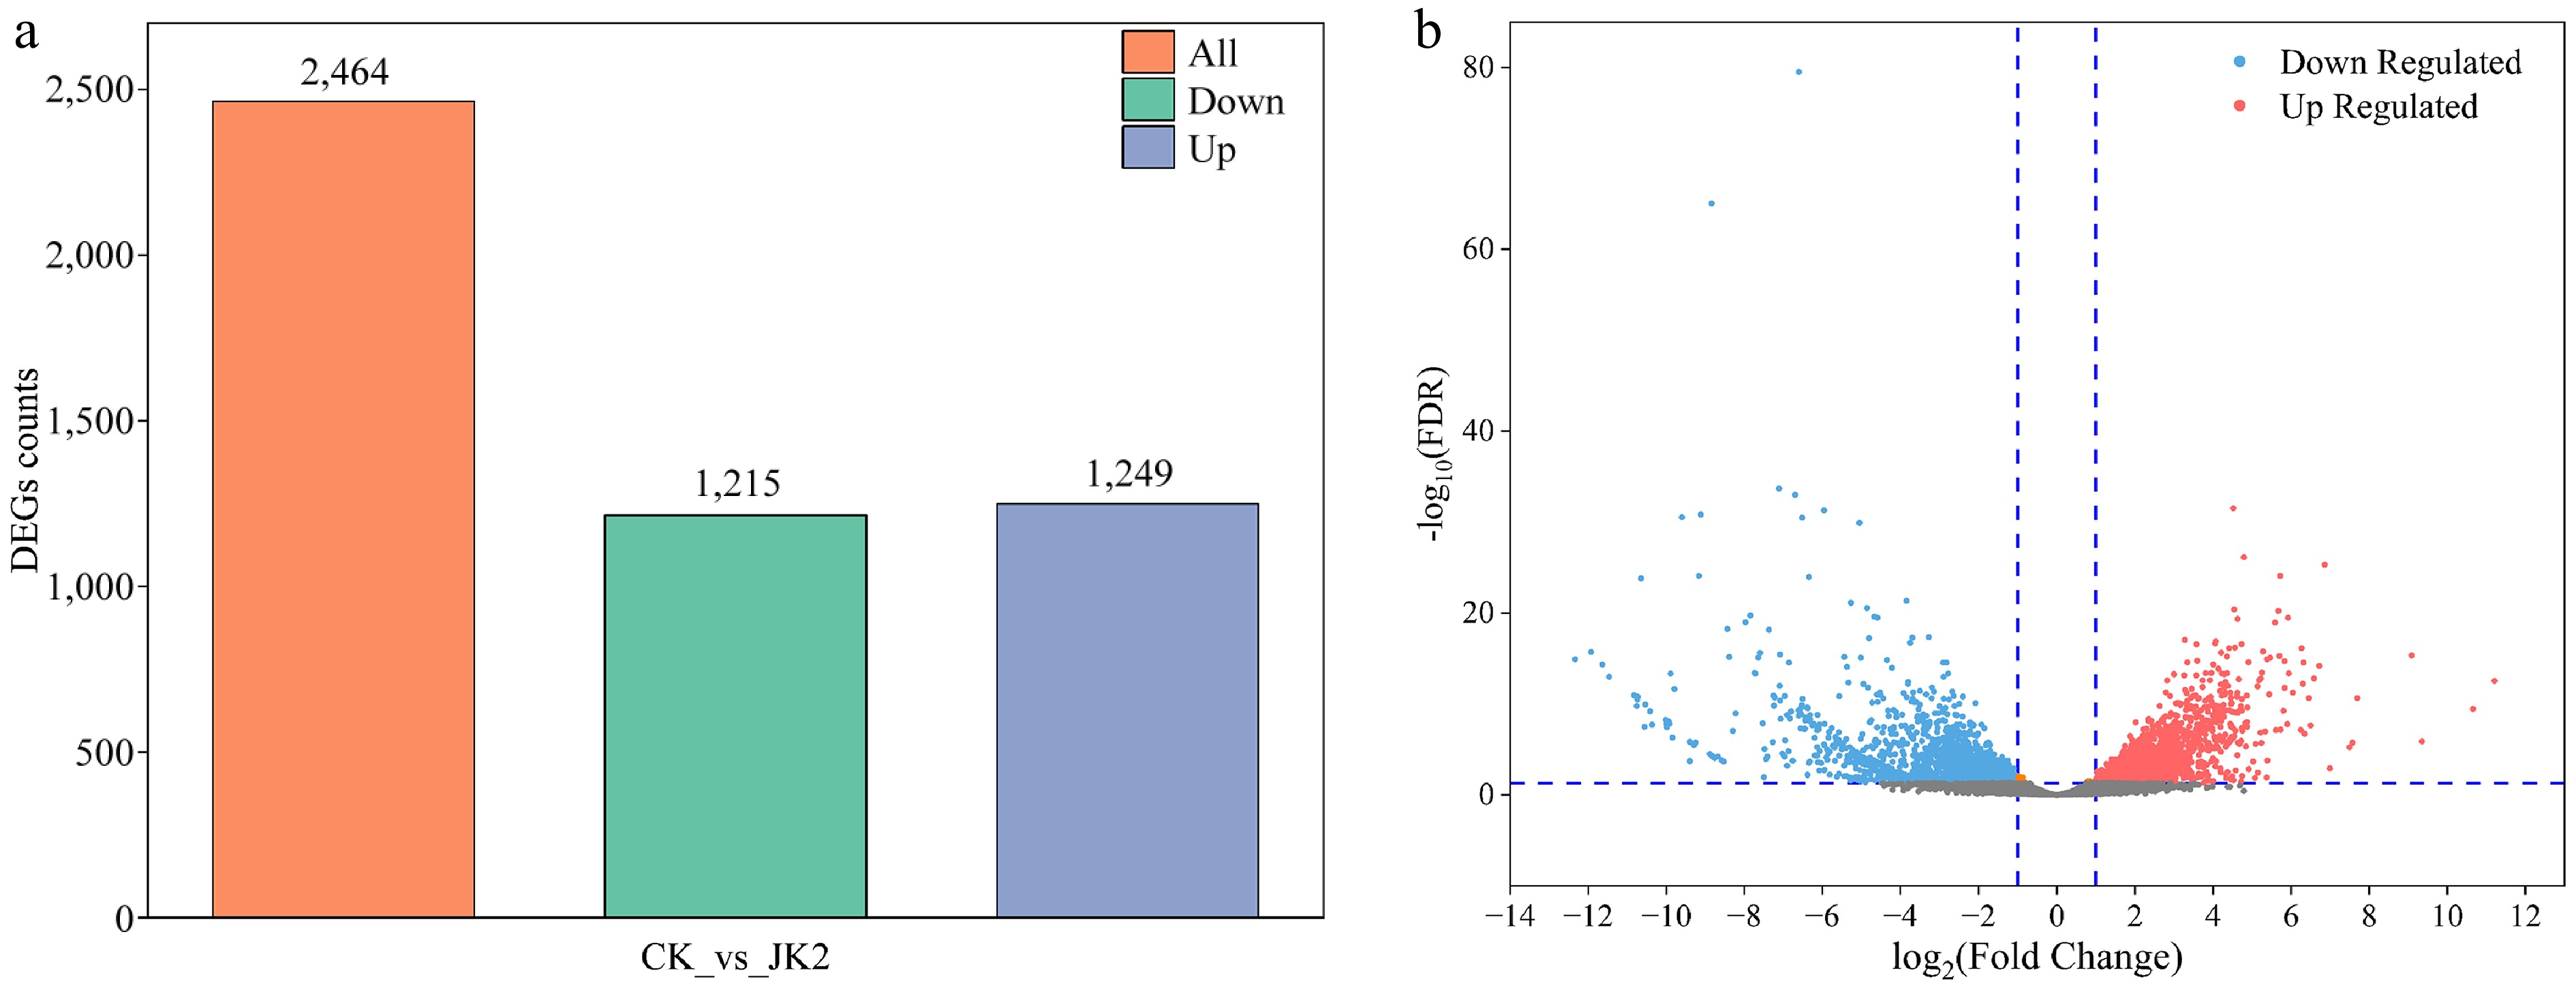
Figure 3.
Overview of transcriptome analysis of P. capsici after application of strain JK2. (a) Bar graph of up- and down-regulated genes from pairwise comparisons. (b) Volcano map of DEGs for CK vs JK2. The red dots represent up-regulated differential genes, the blue dots represent down-regulated differential genes, and the gray dots represent non-differentially expressed genes. CK: P. capsici cultured without strain JK2; JK2: P. capsici co-cultured with strain JK2.
-
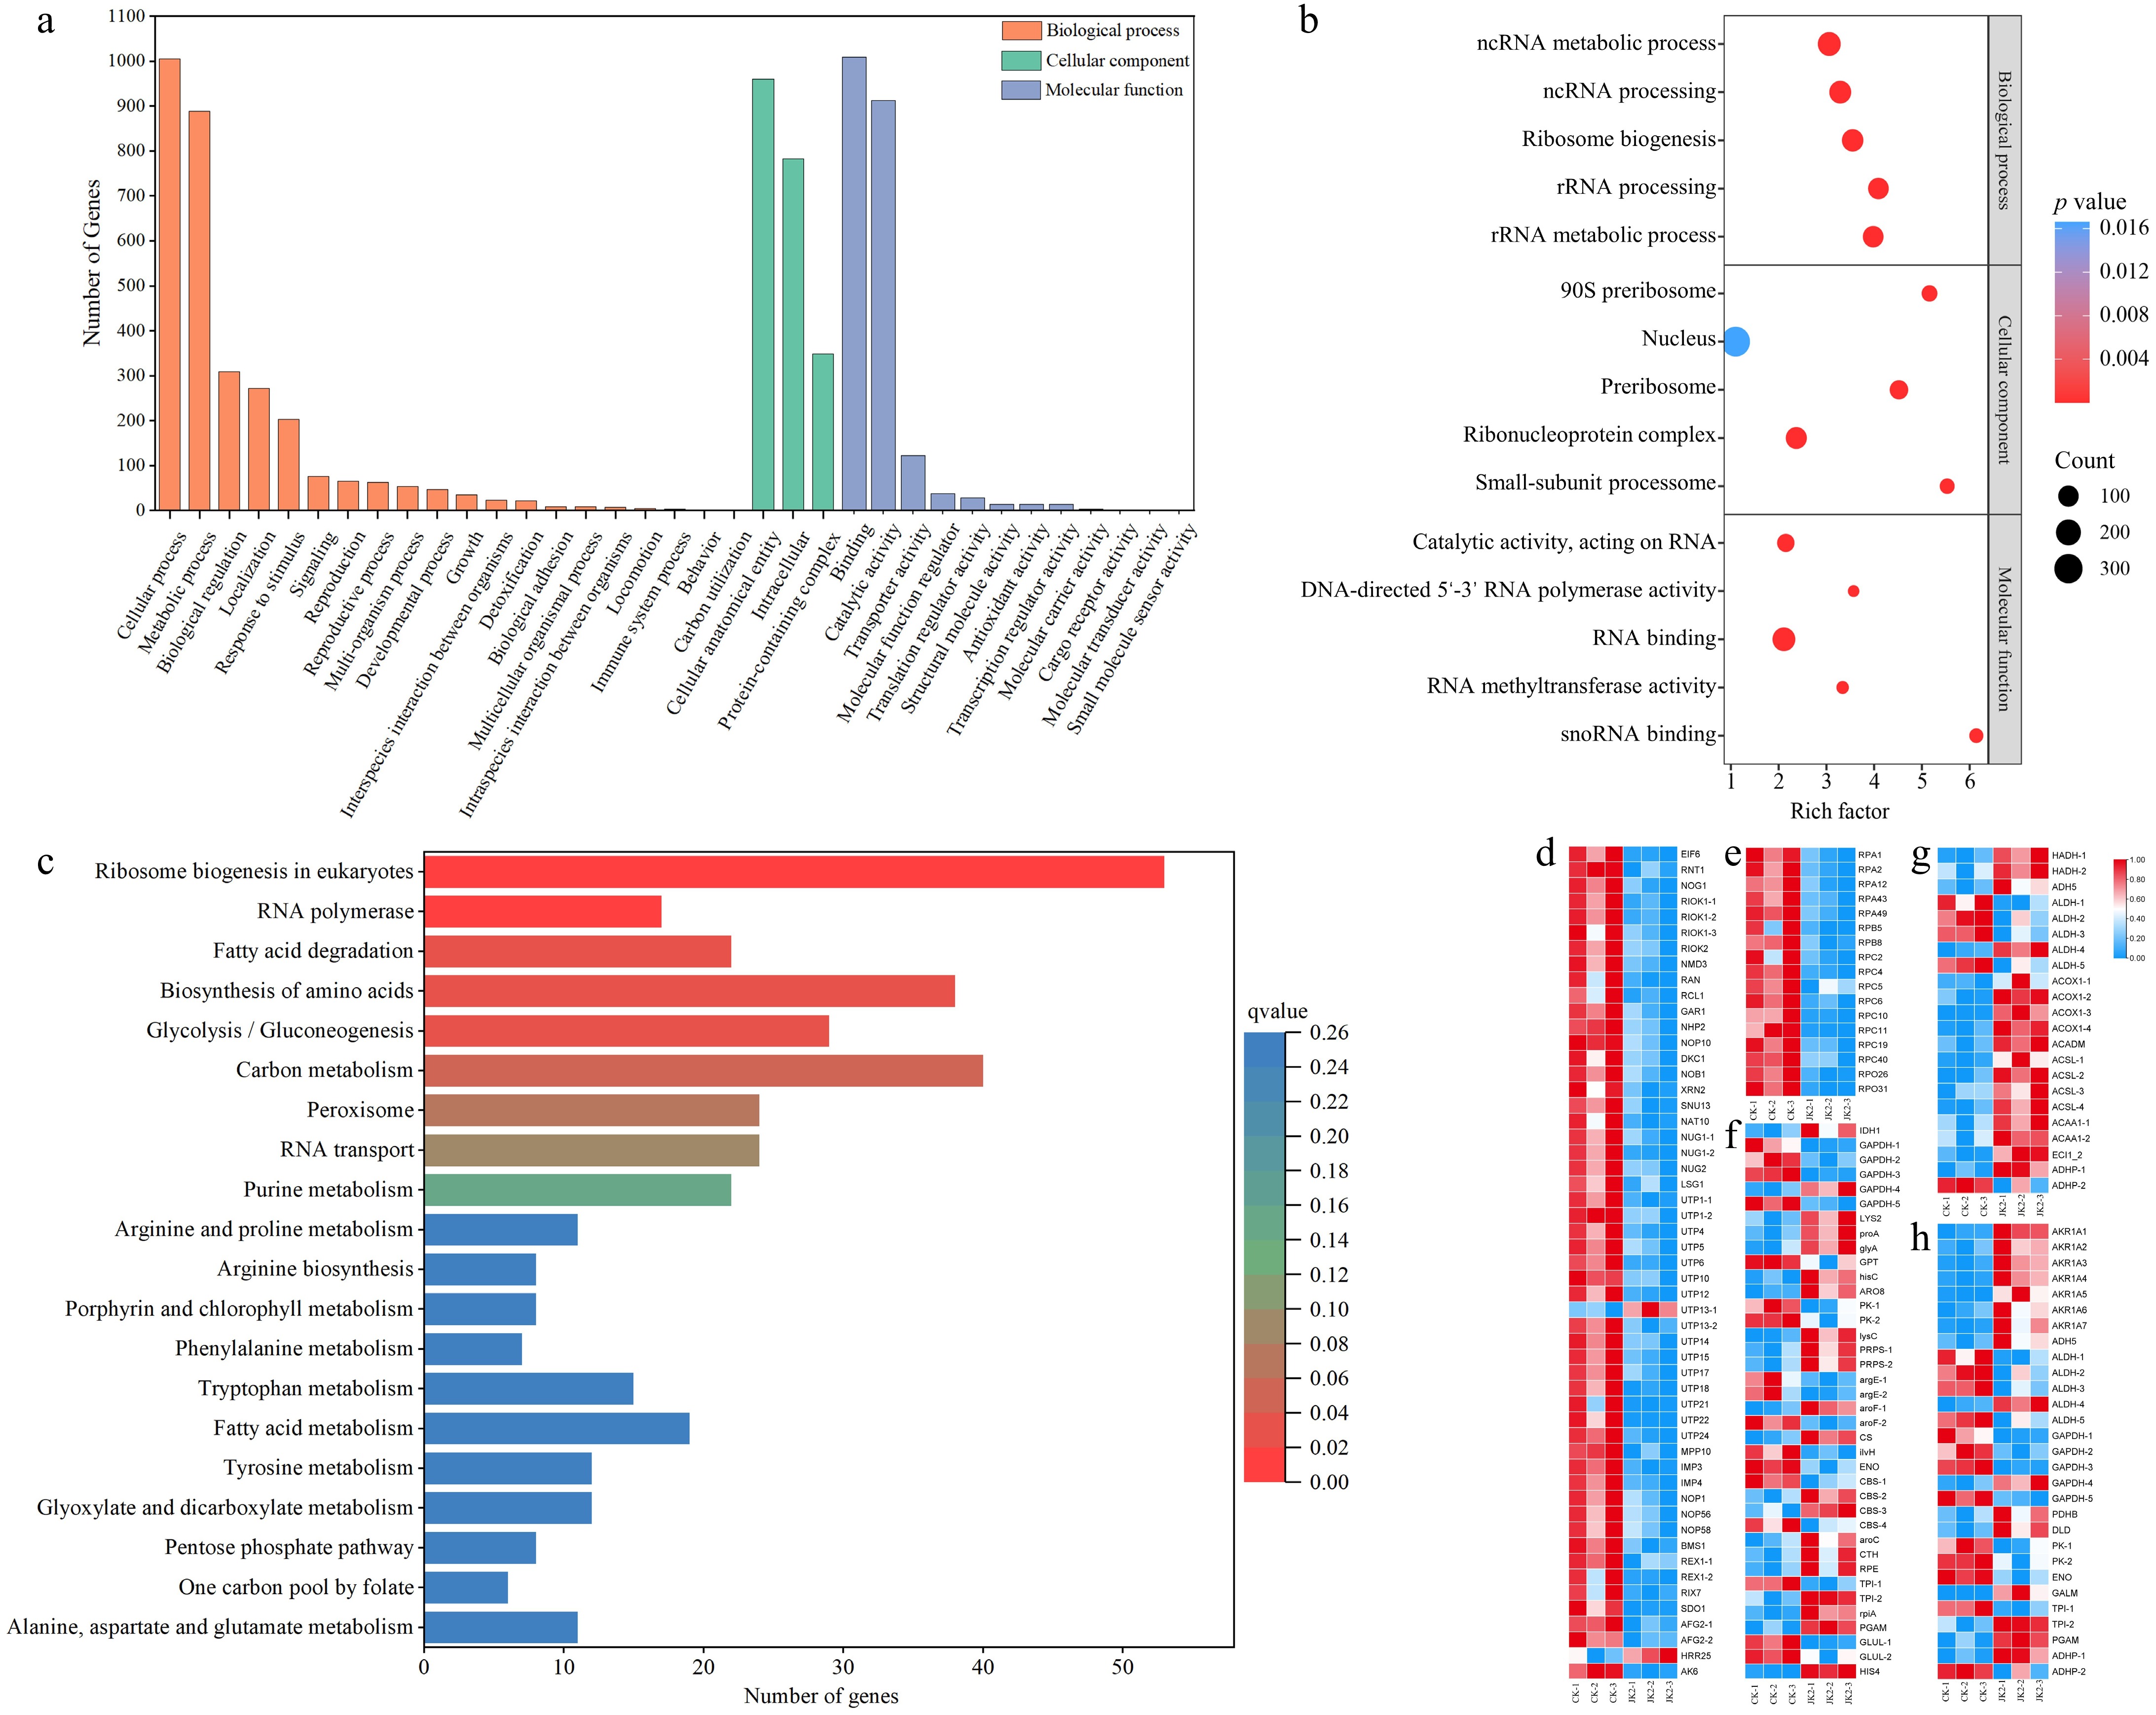
Figure 4.
GO functional classification, KEGG classification of DEGs for CK vs JK2, and Heatmap of the KEGG pathway. (a) Histogram of GO functional classification. The DEGs were assigned to three categories: biological process, cellular component, and molecular function. (b) GO functional classification map of the first five terms with small q value in biological process, molecular function, and cellular component. The color of the points reflects the p value, and the red indicates the more significant enrichment. The size of the dots represents the count of DEGs enriched. (c) Histogram of KEGG classification. (d) Heatmap of DEGs in ribosome biogenesis in eukaryotes pathway (ko03008). (e) Heatmap of DEGs in RNA polymerase pathway (ko03020). (f) Heatmap of DEGs in fatty acid degradation pathway (ko00071). (g) Heatmap of DEGs in amino acid biosynthesis pathway (ko01230). (h) The heatmap of DEGs in glycolysis/gluconeogenesis pathway (ko00010).
-
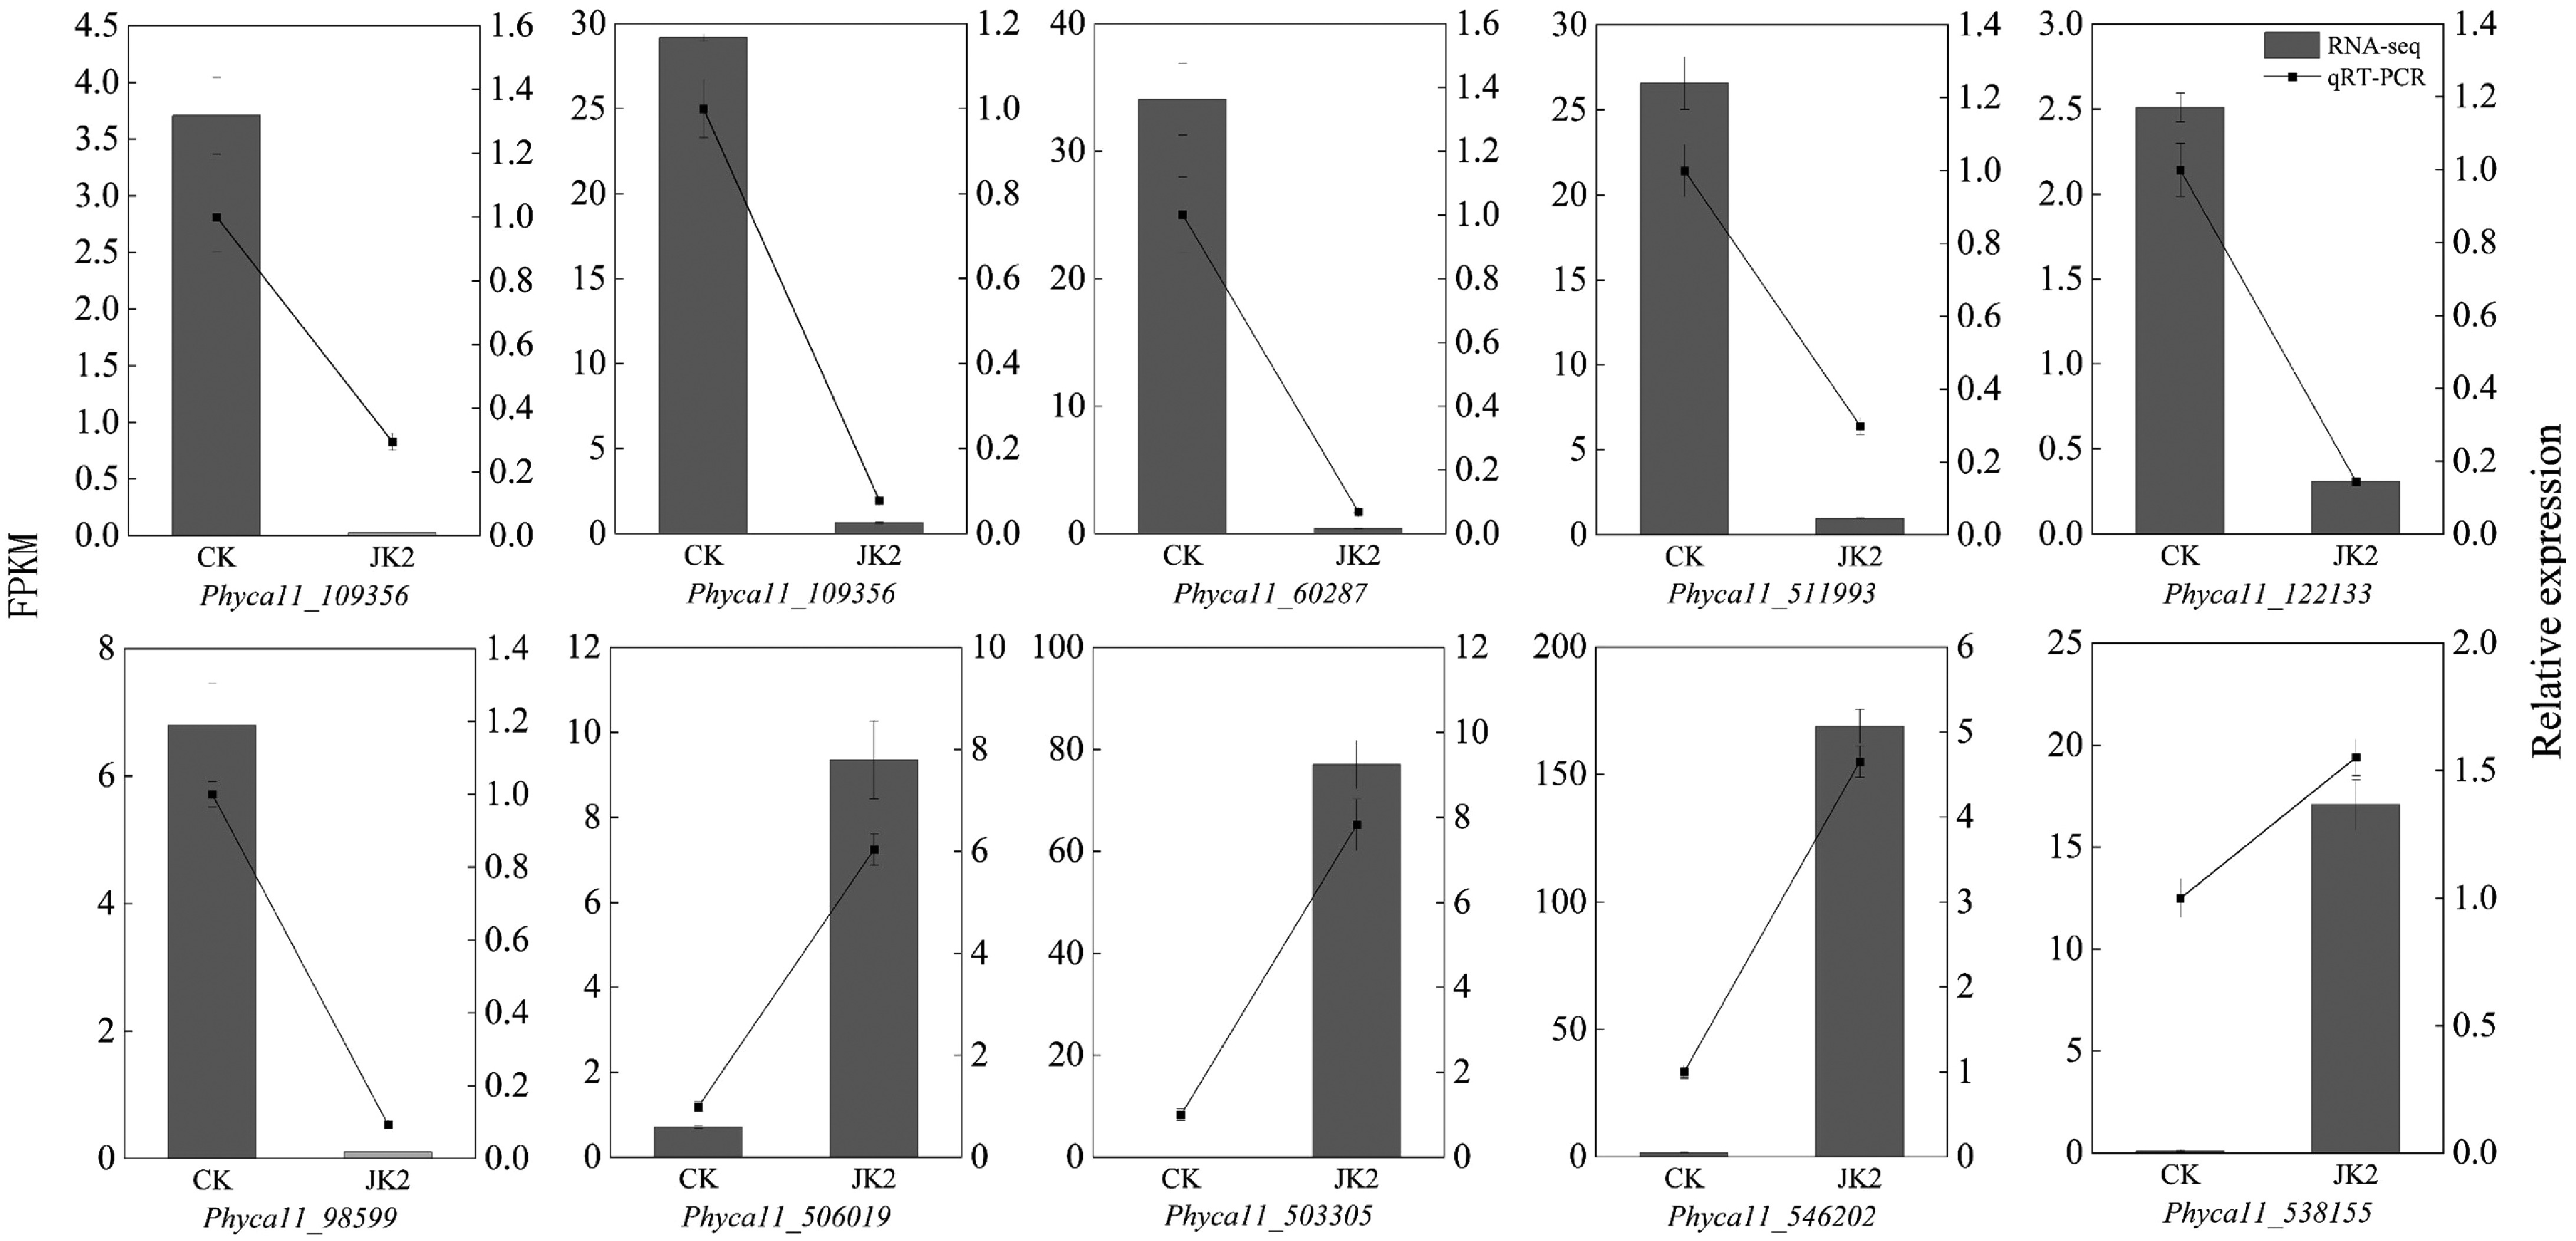
Figure 5.
RT-qPCR validation of DEGs in transcriptome sequencing. The bar graph represents the transcriptome data, and the line graph represents the RT-qPCR results.
-
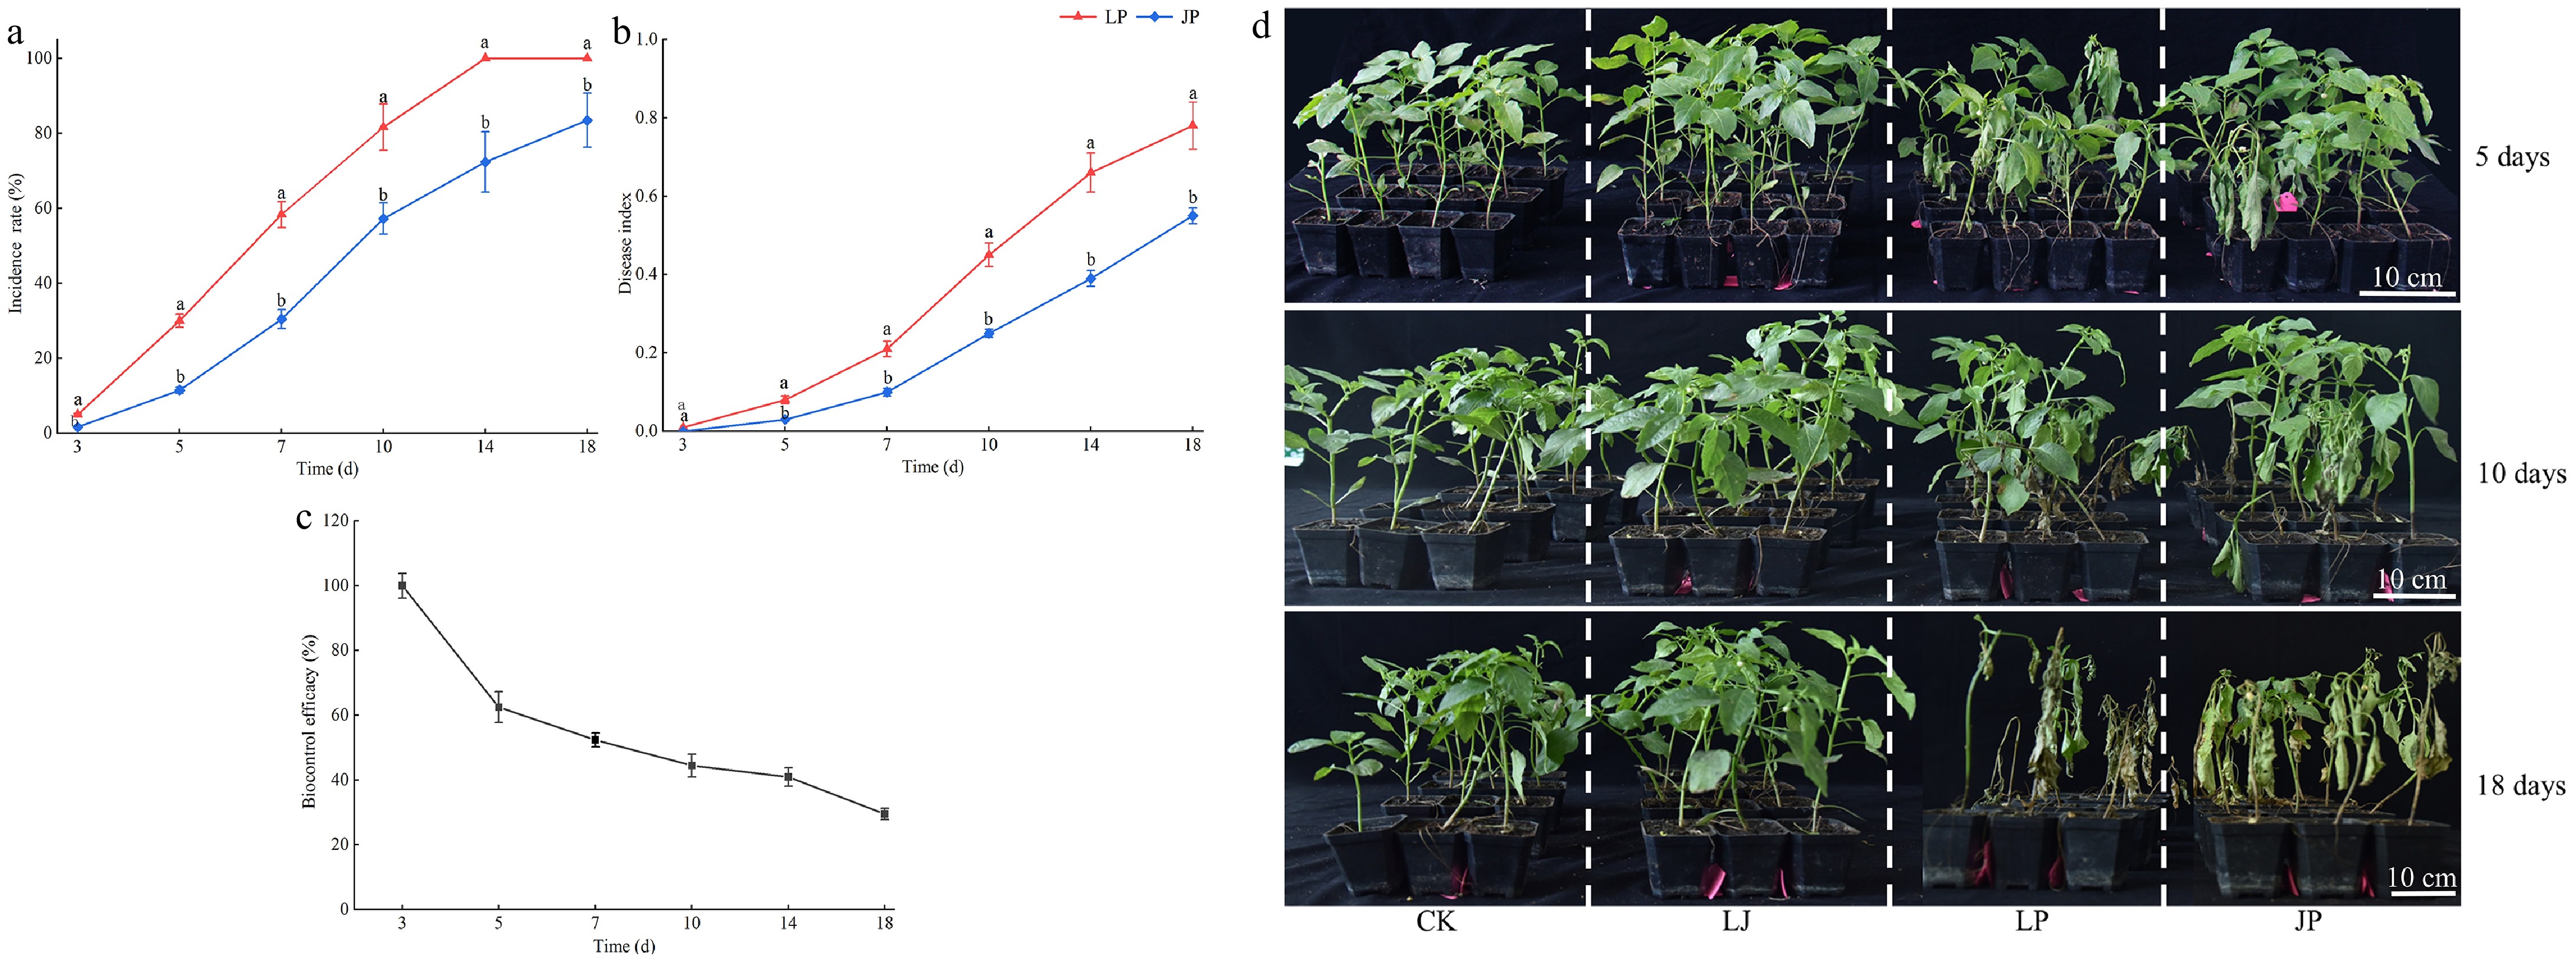
Figure 6.
Control activity of JK2 against P. capsici on pepper seedlings. Twenty mL of JK2 suspension was poured into the roots of the pepper plants, 10 mL P. capsici spore suspension was inoculated 24 h later. (a) Incidence rate of JK2 treated peppers at 3, 5, 7, 10, 14, and 18 d after inoculation with P. capsici. (b) Disease index of JK2 treated peppers at 3, 5, 7, 10, 14, and 18 d after inoculation with P. capsici. (c) Biocontrol efficacy of JK2 treated peppers at 3, 5, 7, 10, 14, and 18 d after inoculation with P. capsici. (d) Disease symptoms on pepper seedlings at 5, 10, and 18 d after inoculation with P. capsici. Data represents means ± SD for three independent replicates. Different lowercase letters in the line chart at the same time indicates significant difference by Duncan's multiple comparison (p < 0.05). CK: Inoculation with 20 mL of LB liquid culture medium; LJ: Inoculation with 20 mL of JK2 suspension; LP: Inoculation with 20 mL of LB liquid culture medium for 24 h, followed by inoculation with 10 mL P. capsici spore suspension; JP: Inoculation with 20 mL JK2 spore suspension for 24 h, followed by inoculation with 10 mL P. capsici spore suspension.
-
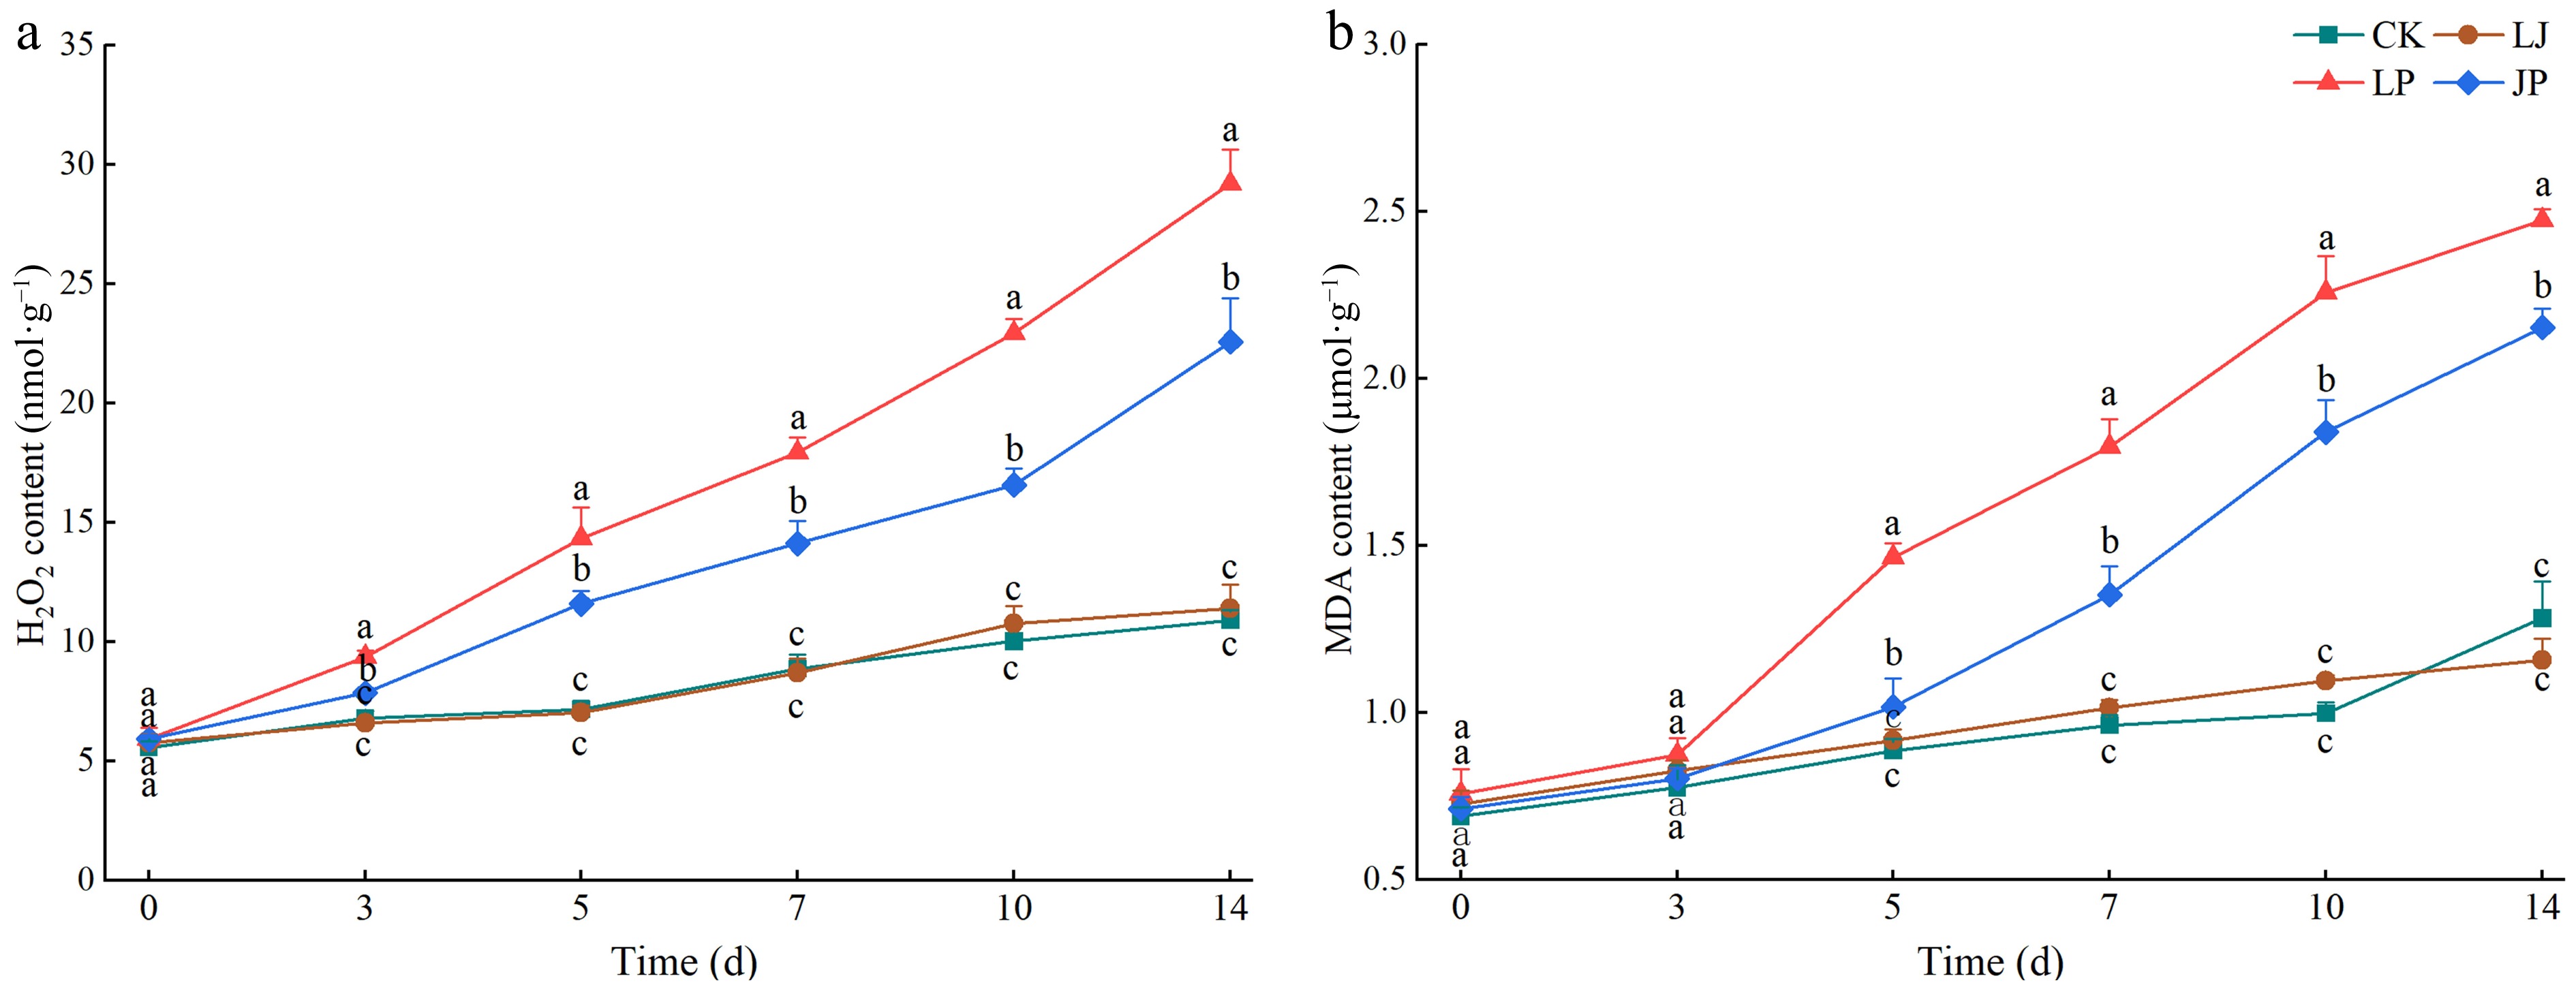
Figure 7.
Effect of JK2 on H2O2 and MDA content in pepper leaves inoculated with P. capsici. (a) H2O2 content at 3, 5, 7, 10, 14, and 18 d after inoculation with P. capsici. (b) MDA content at 3, 5, 7, 10, 14, and 18 d after inoculation with P. capsici. Data represents means ± SD for three independent replicates. Different lowercase letters in the line chart at the same time indicates significant differences across treatments by Duncan's multiple comparison (p < 0.05).
-
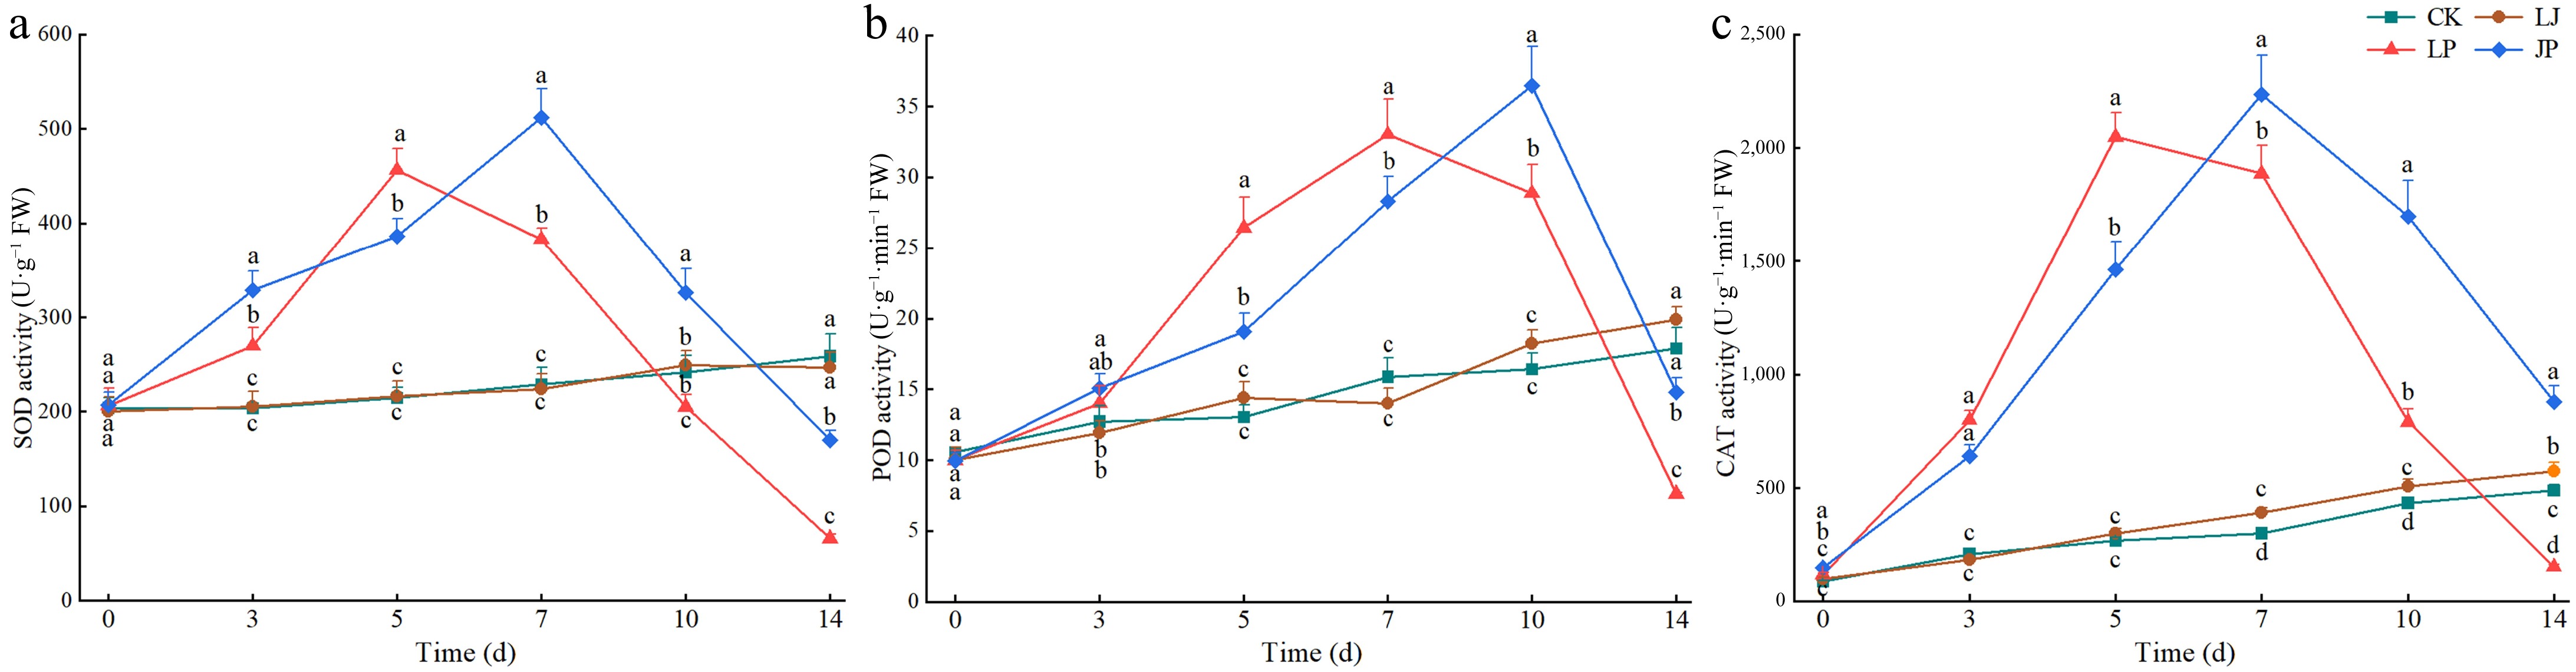
Figure 8.
Effect of antioxidant enzyme activities in pepper leaves inoculated with P. capsici. (a) SOD activity at 3, 5, 7, 10, 14, and 18 d after inoculation with P. capsici. (b) POD activity at 3, 5, 7, 10, 14, and 18 d after inoculation with P. capsici. (c) CAT activity at 3, 5, 7, 10, 14, and 18 d after inoculation with P. capsici. Data represents means ± SD for three independent replicates. Different lowercase letters in the line chart at the same time indicates significant differences across treatments by Duncan's multiple comparison (p < 0.05).
Figures
(8)
Tables
(0)