-
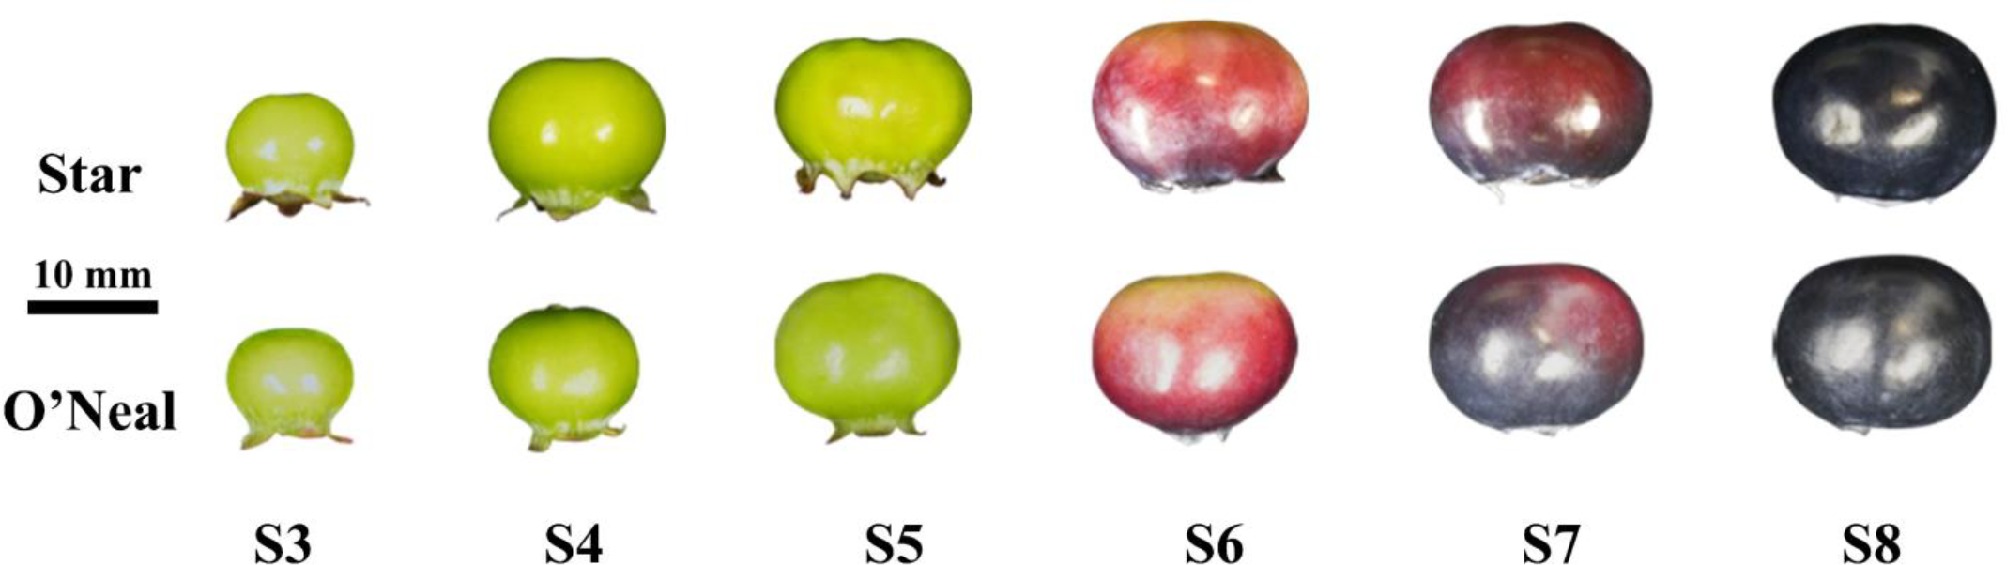
Figure 1.
'O'Neal' and 'Star' fruits at different developmental stages.
-
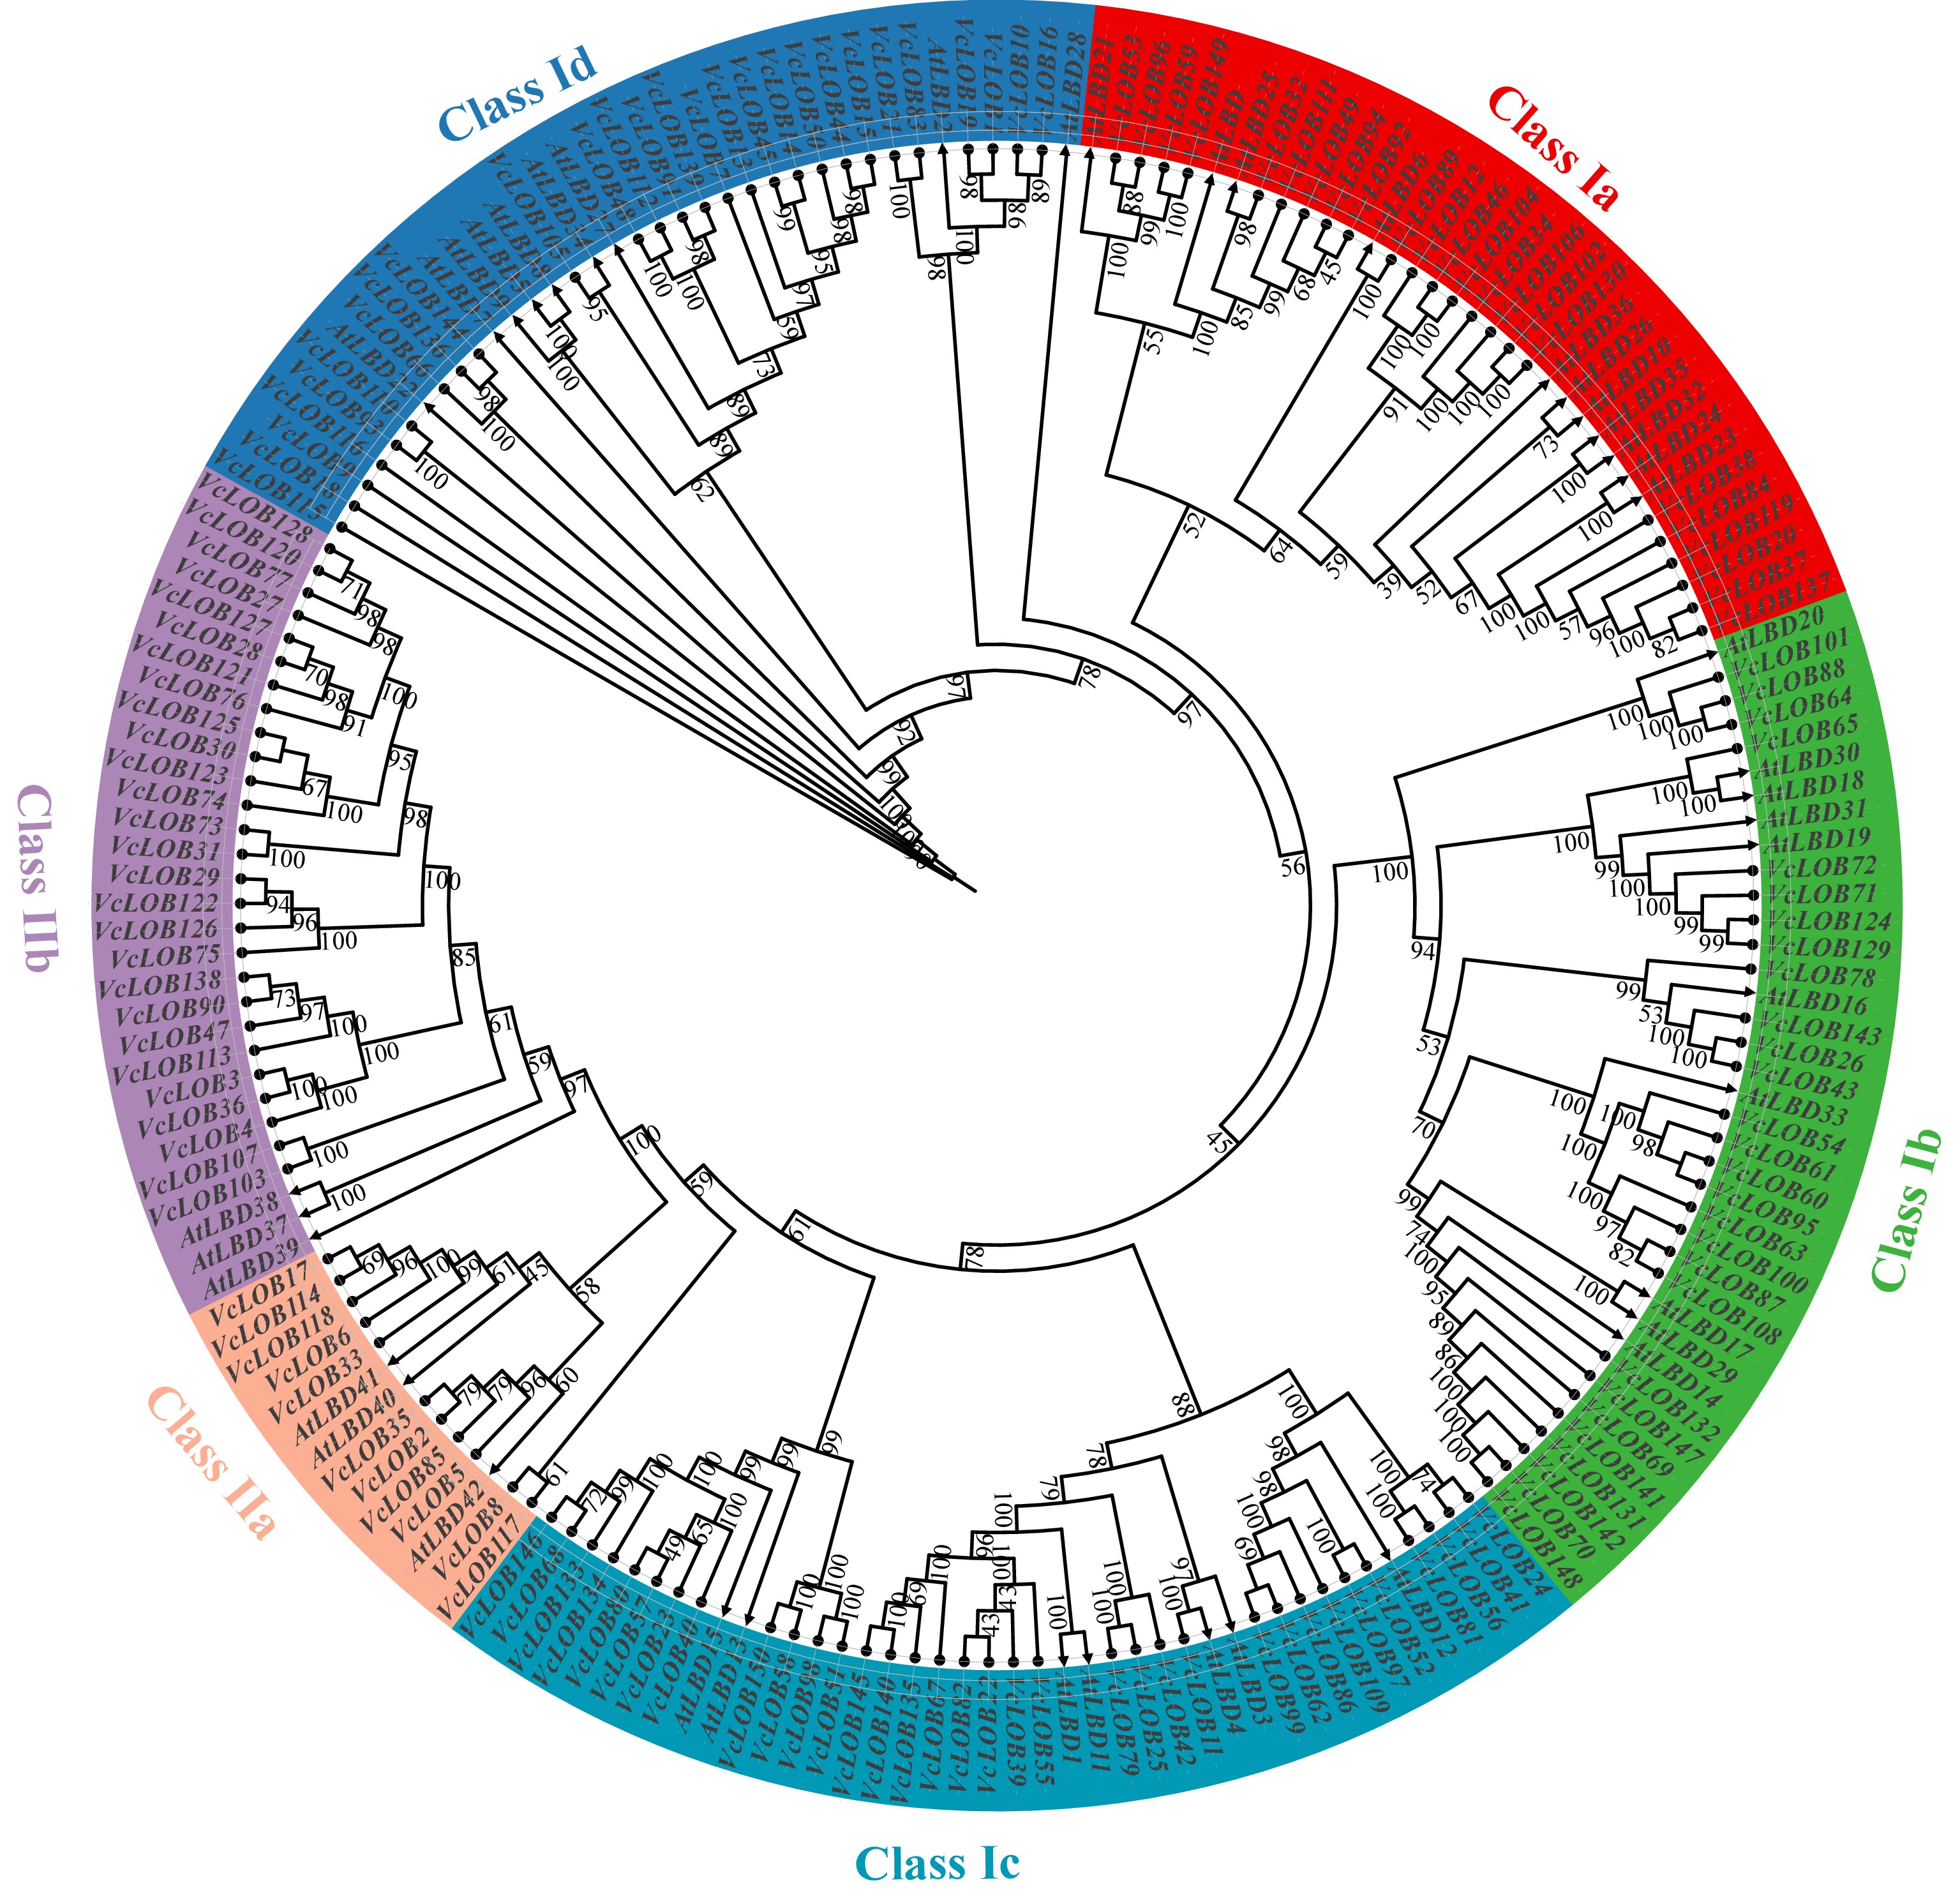
Figure 2.
Phylogenetic tree of LOB proteins in blueberry and Arabidopsis thaliana. LOB proteins of blueberry and Arabidopsis are marked with circles and triangles, respectively. The digits on the branches represent bootstrap values for 1,000 replicates.
-
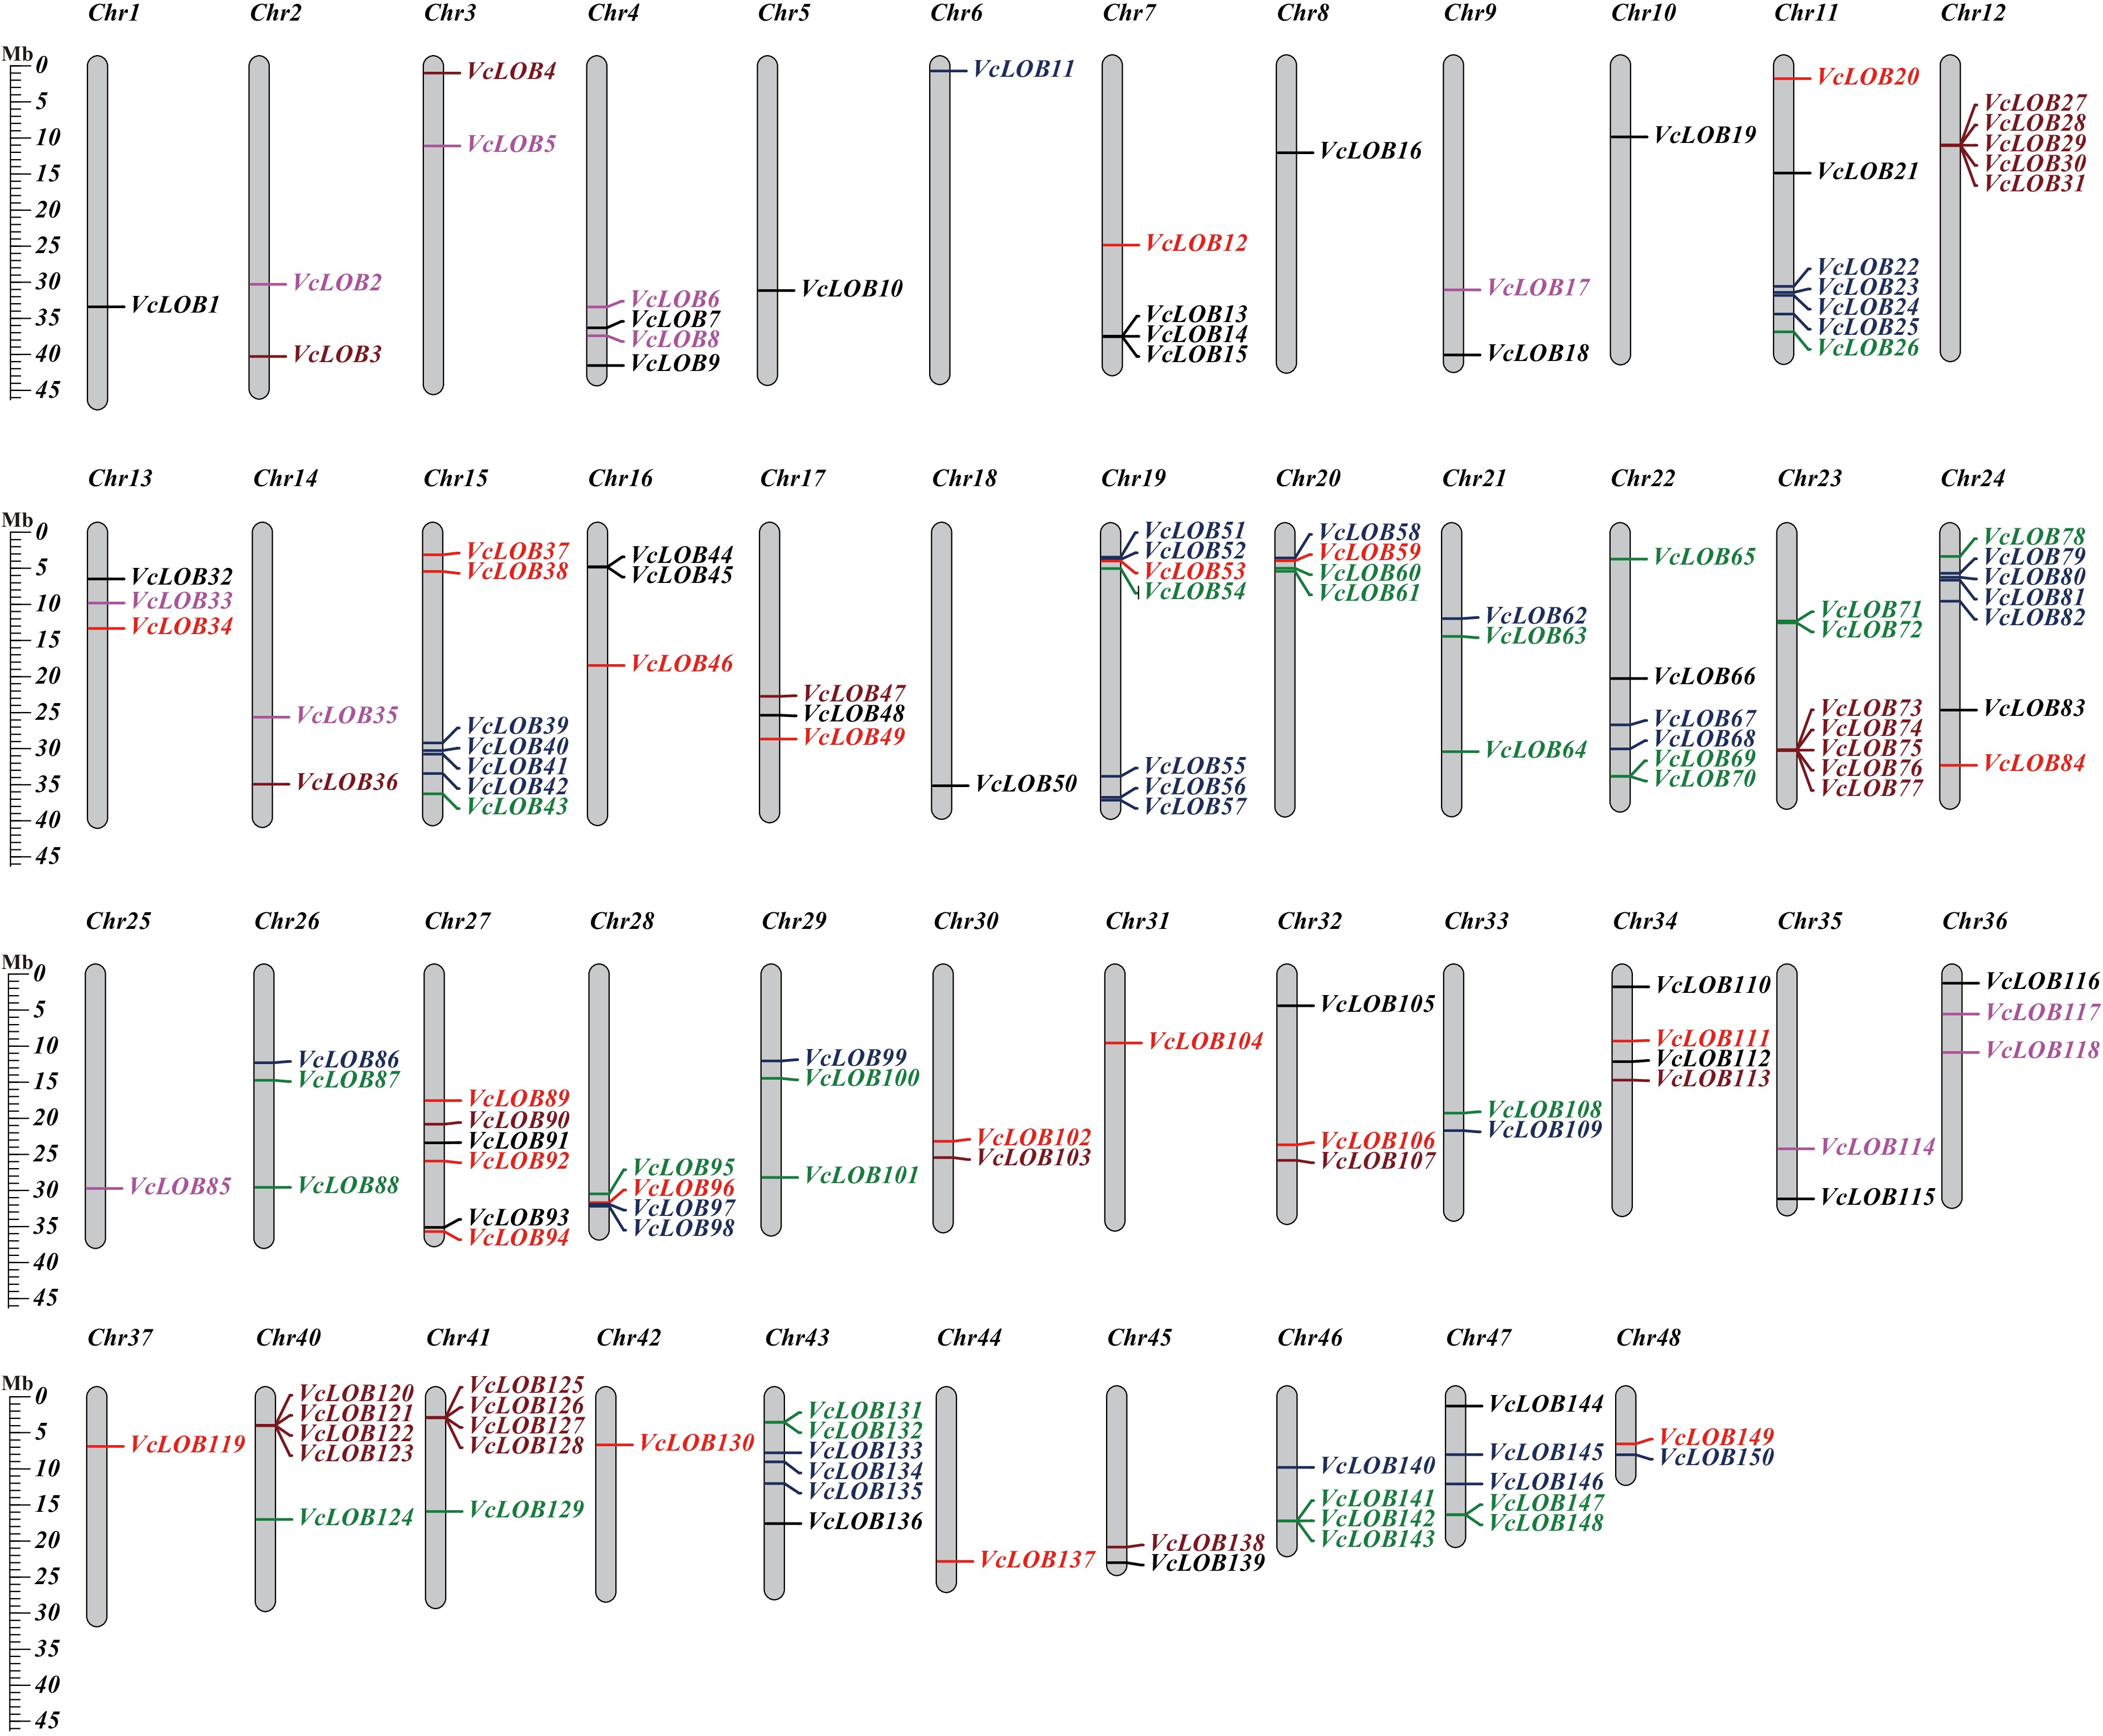
Figure 3.
VcLOB gene distribution on 48 blueberry chromosomes. Class Ia, Class Ib, Class Ic, Class Id, Class IIa, and Class IIb genes are shown in black, red, green, blue, brown, and purple, respectively.
-
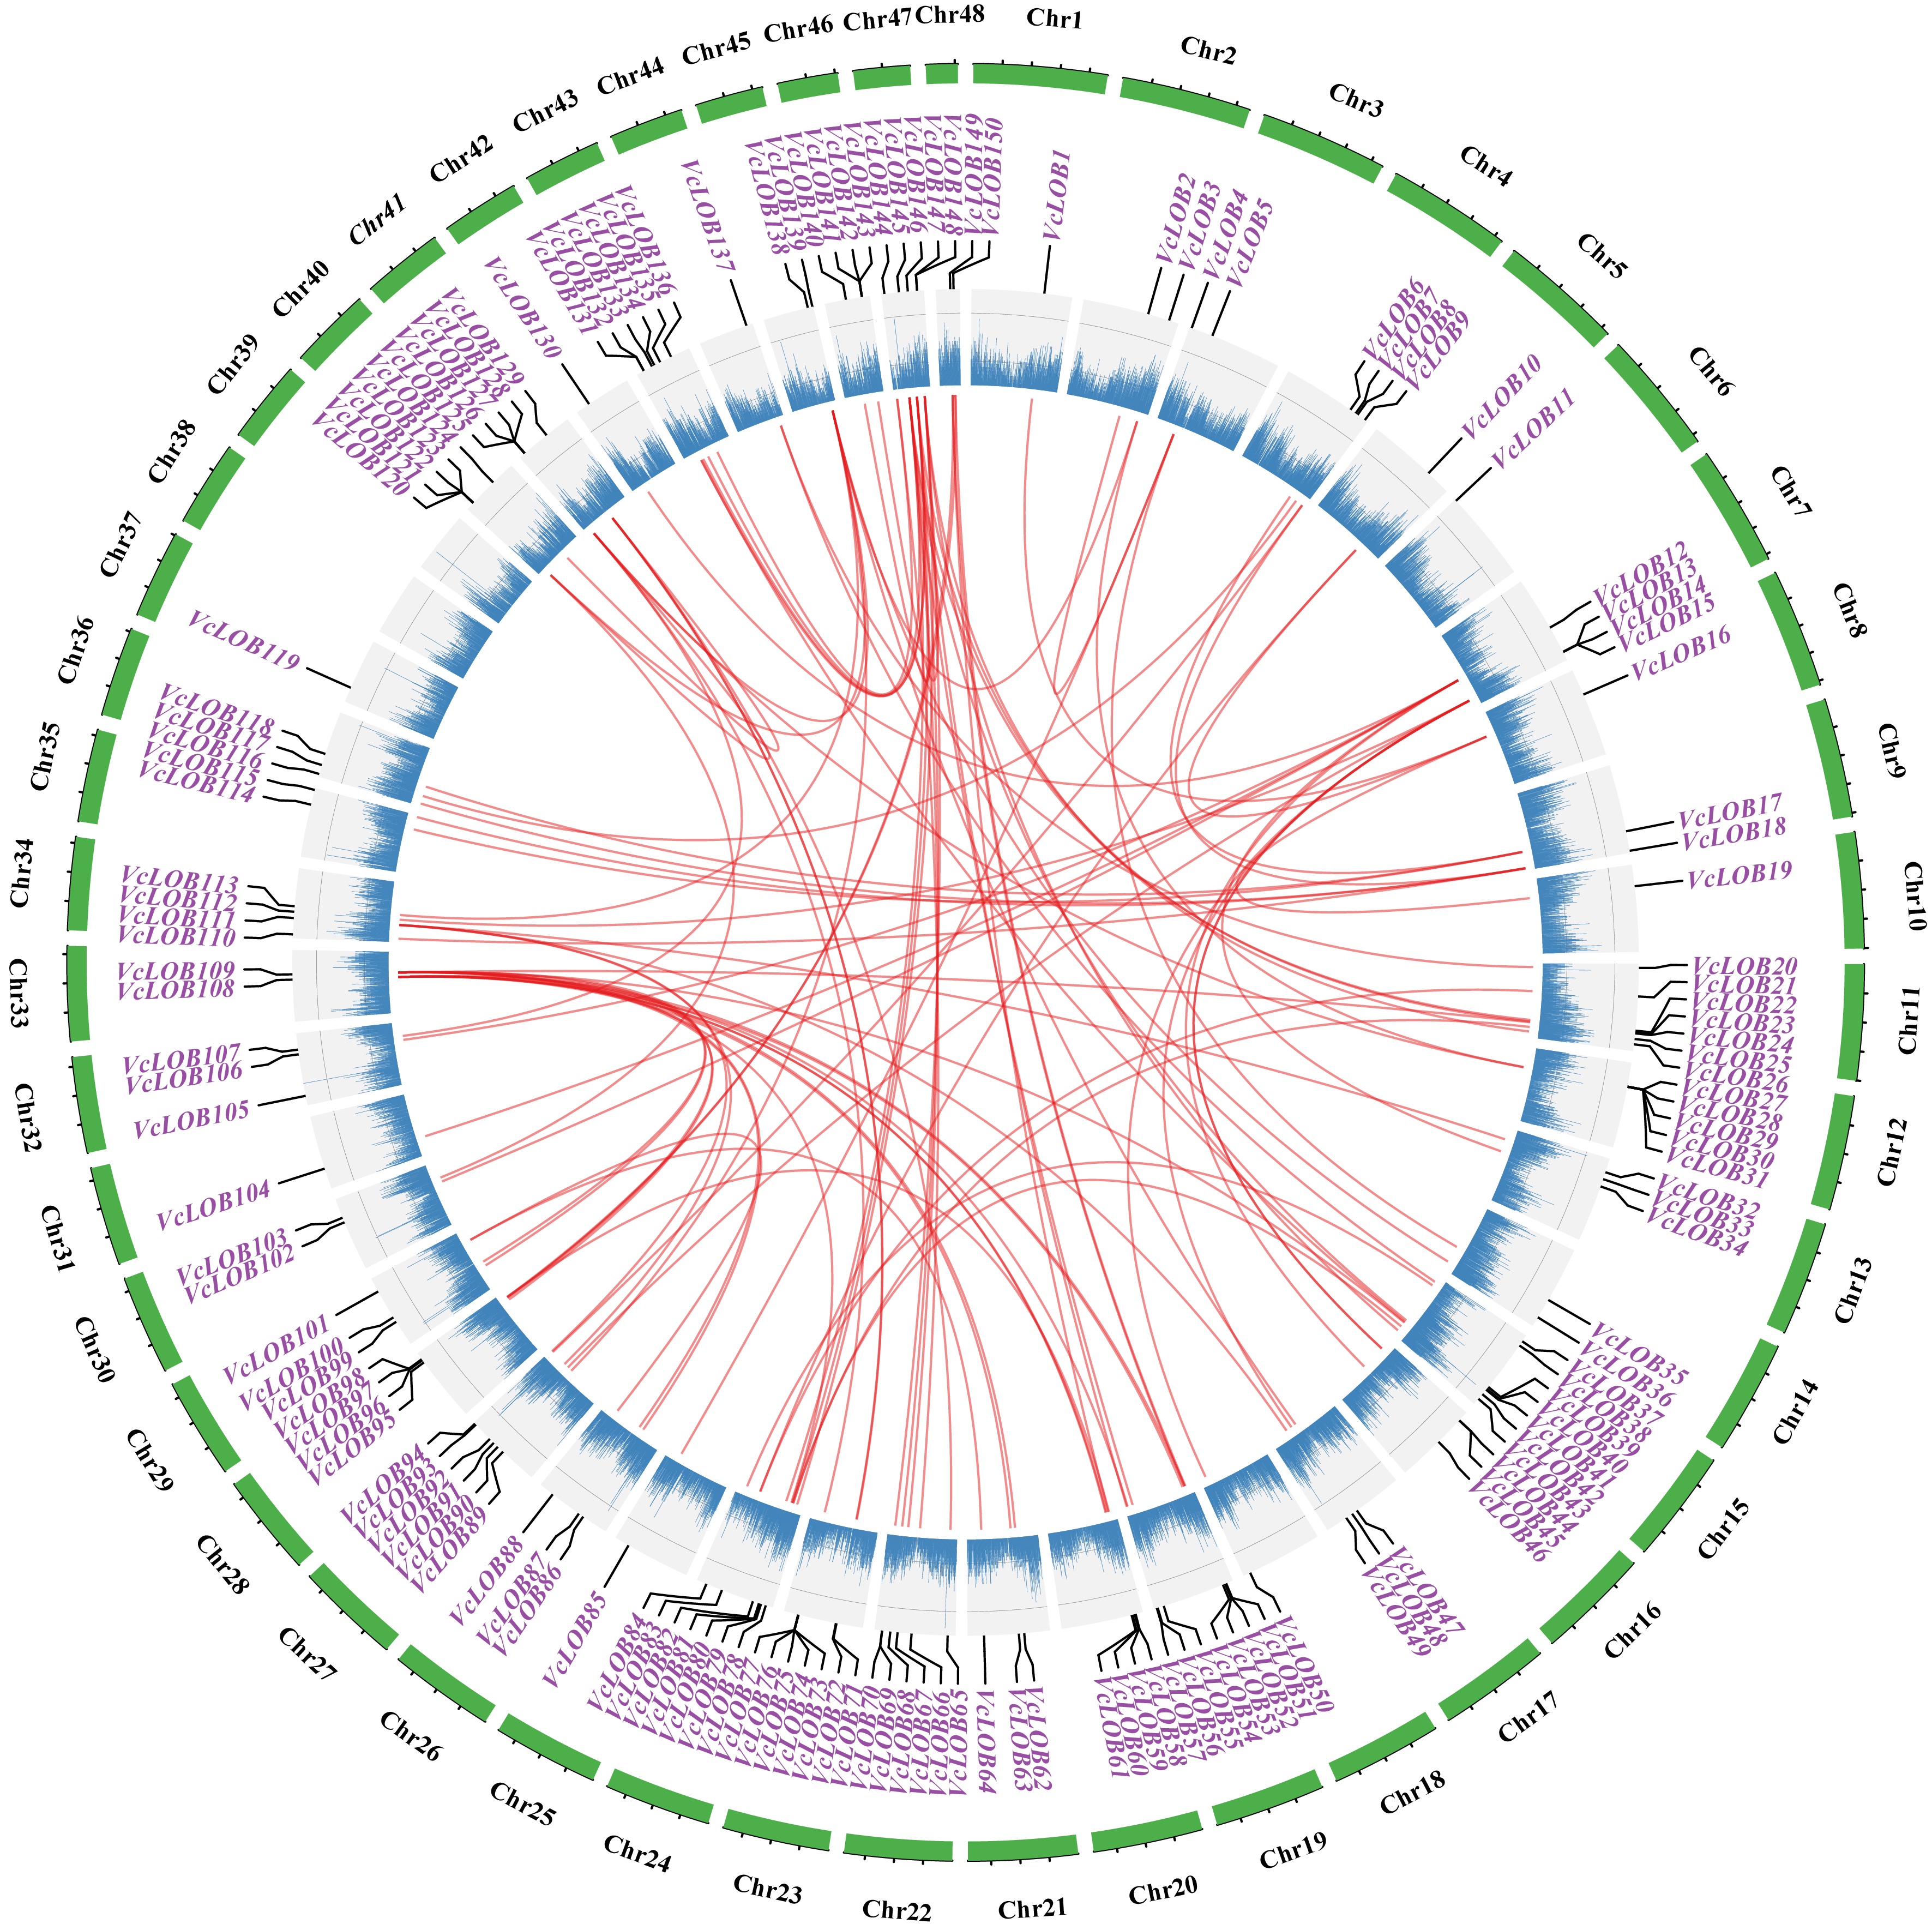
Figure 4.
Collinearity analysis of 150 VcLOB genes in blueberry genome. Red represents gene pairs, and blue scatter represents the gene frequency on the chromosome.
-
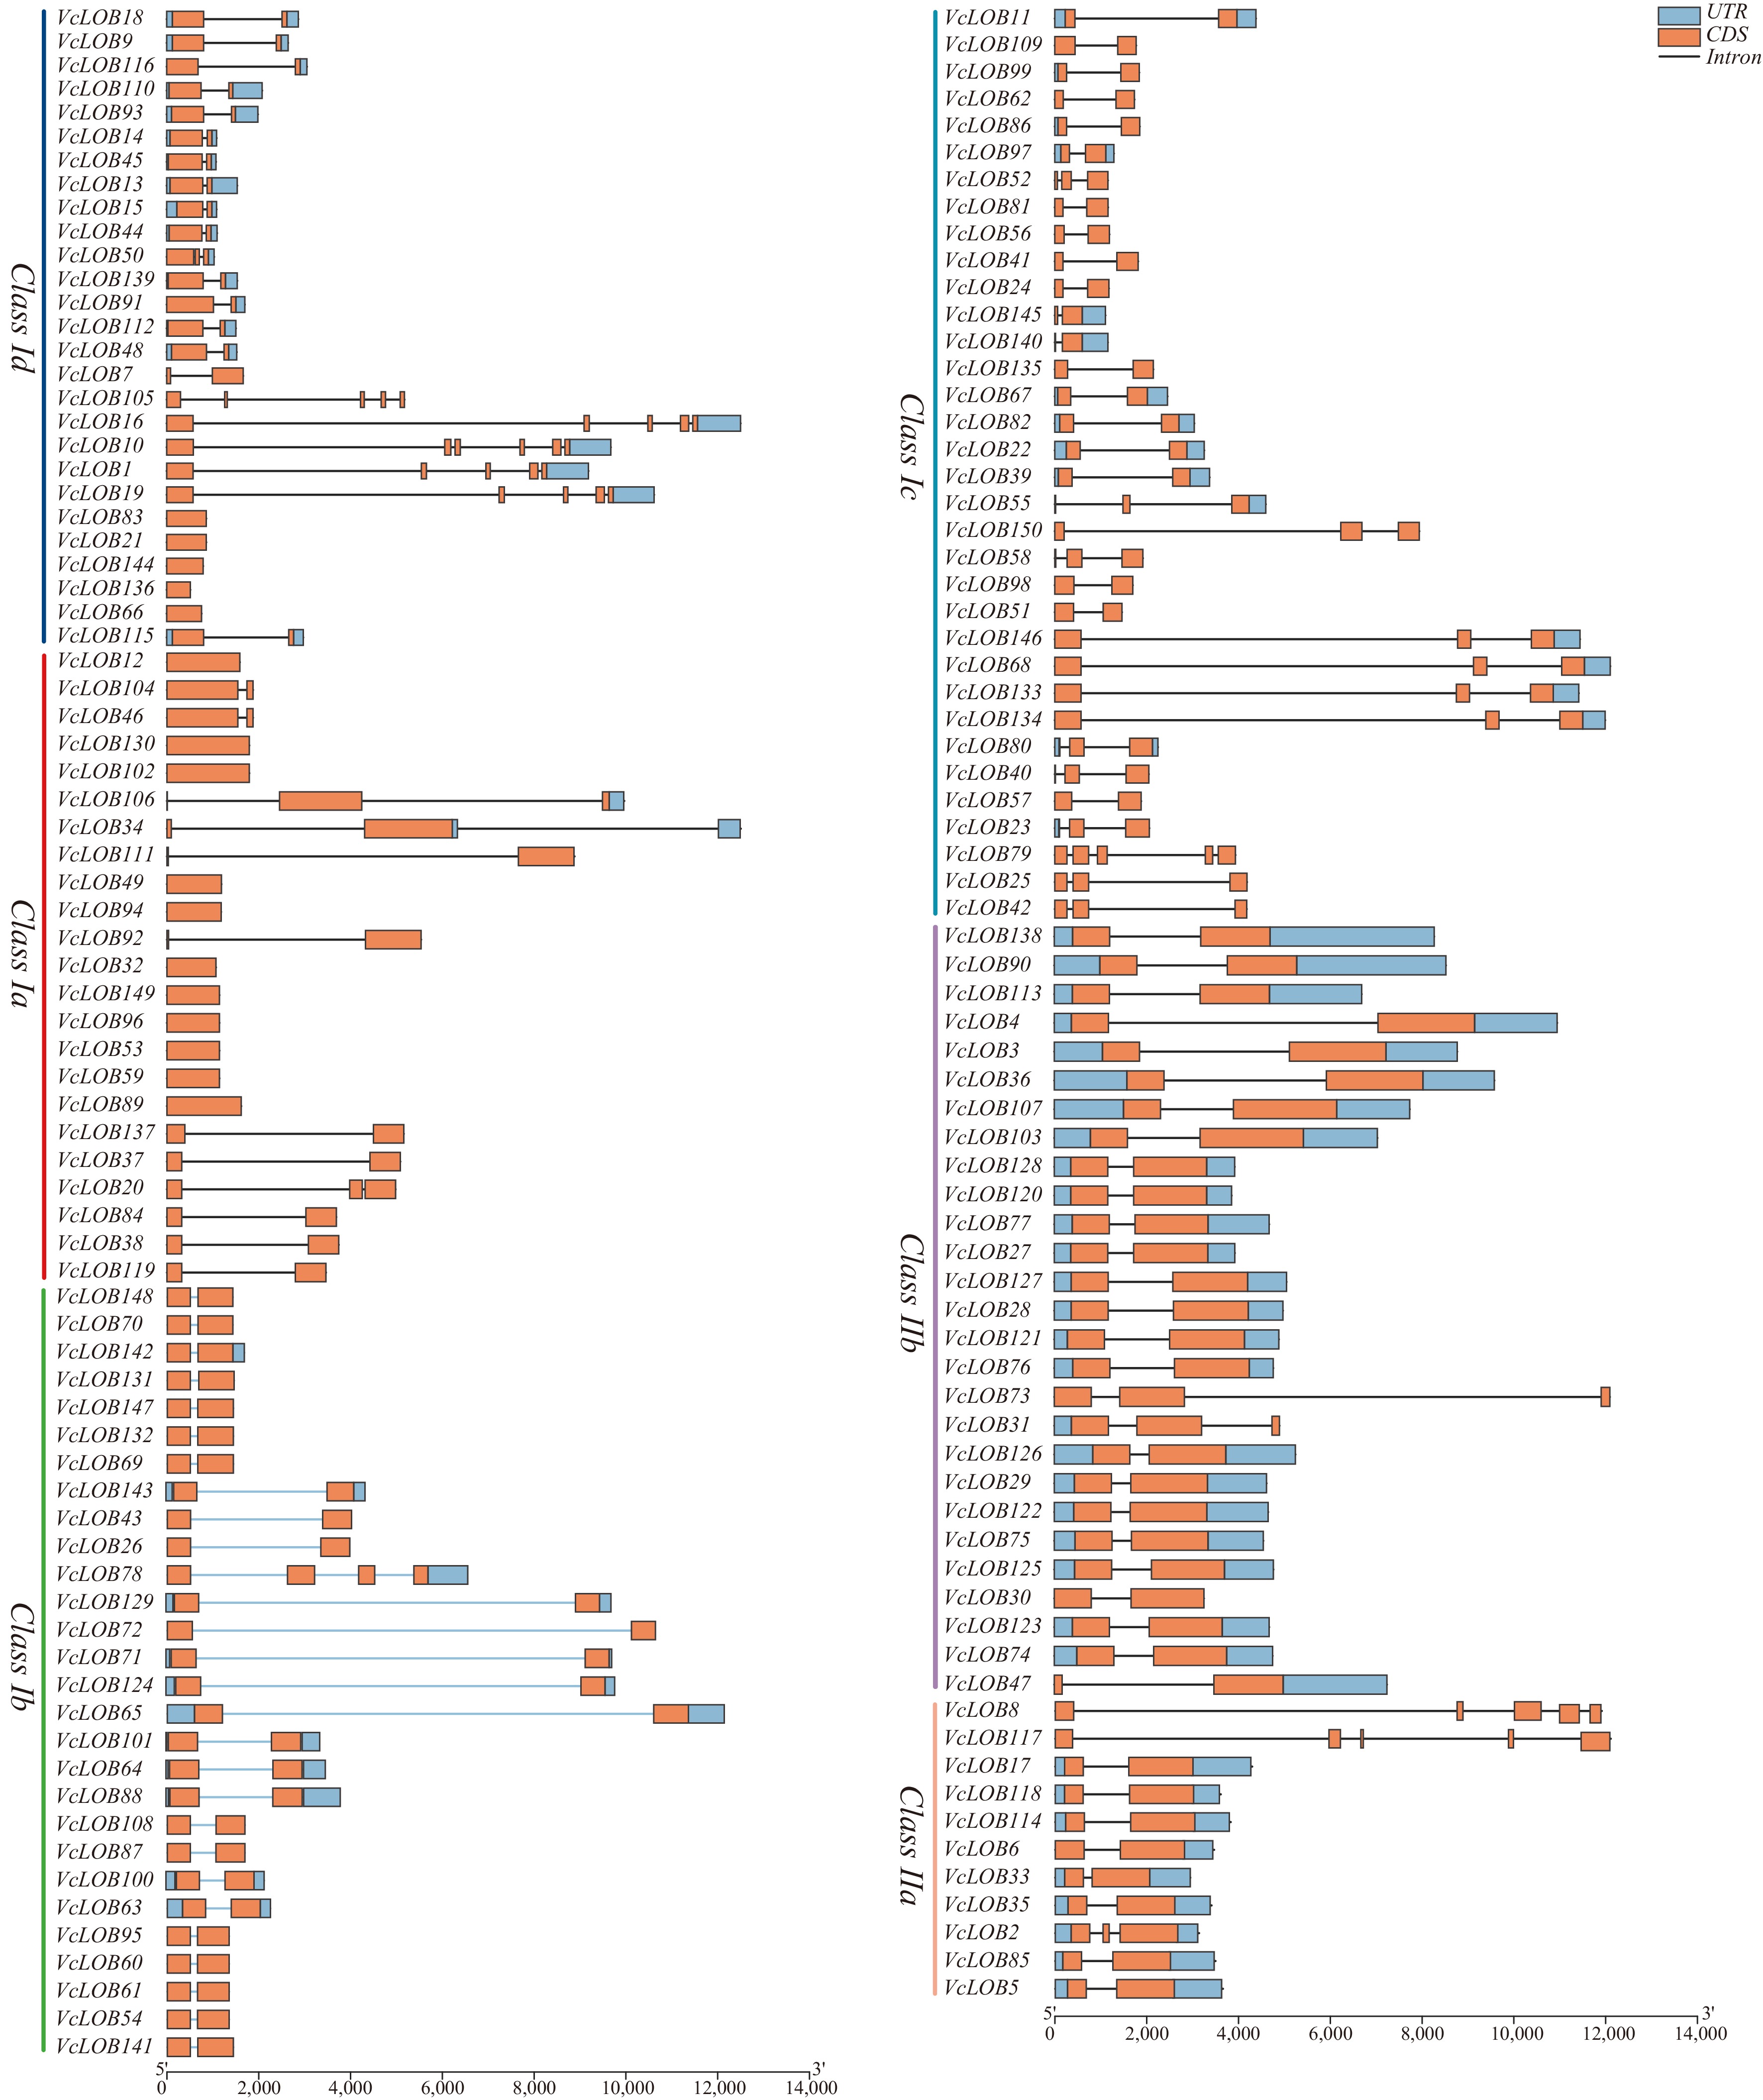
Figure 5.
Gene structure analysis of 150 VcLOB genes.
-
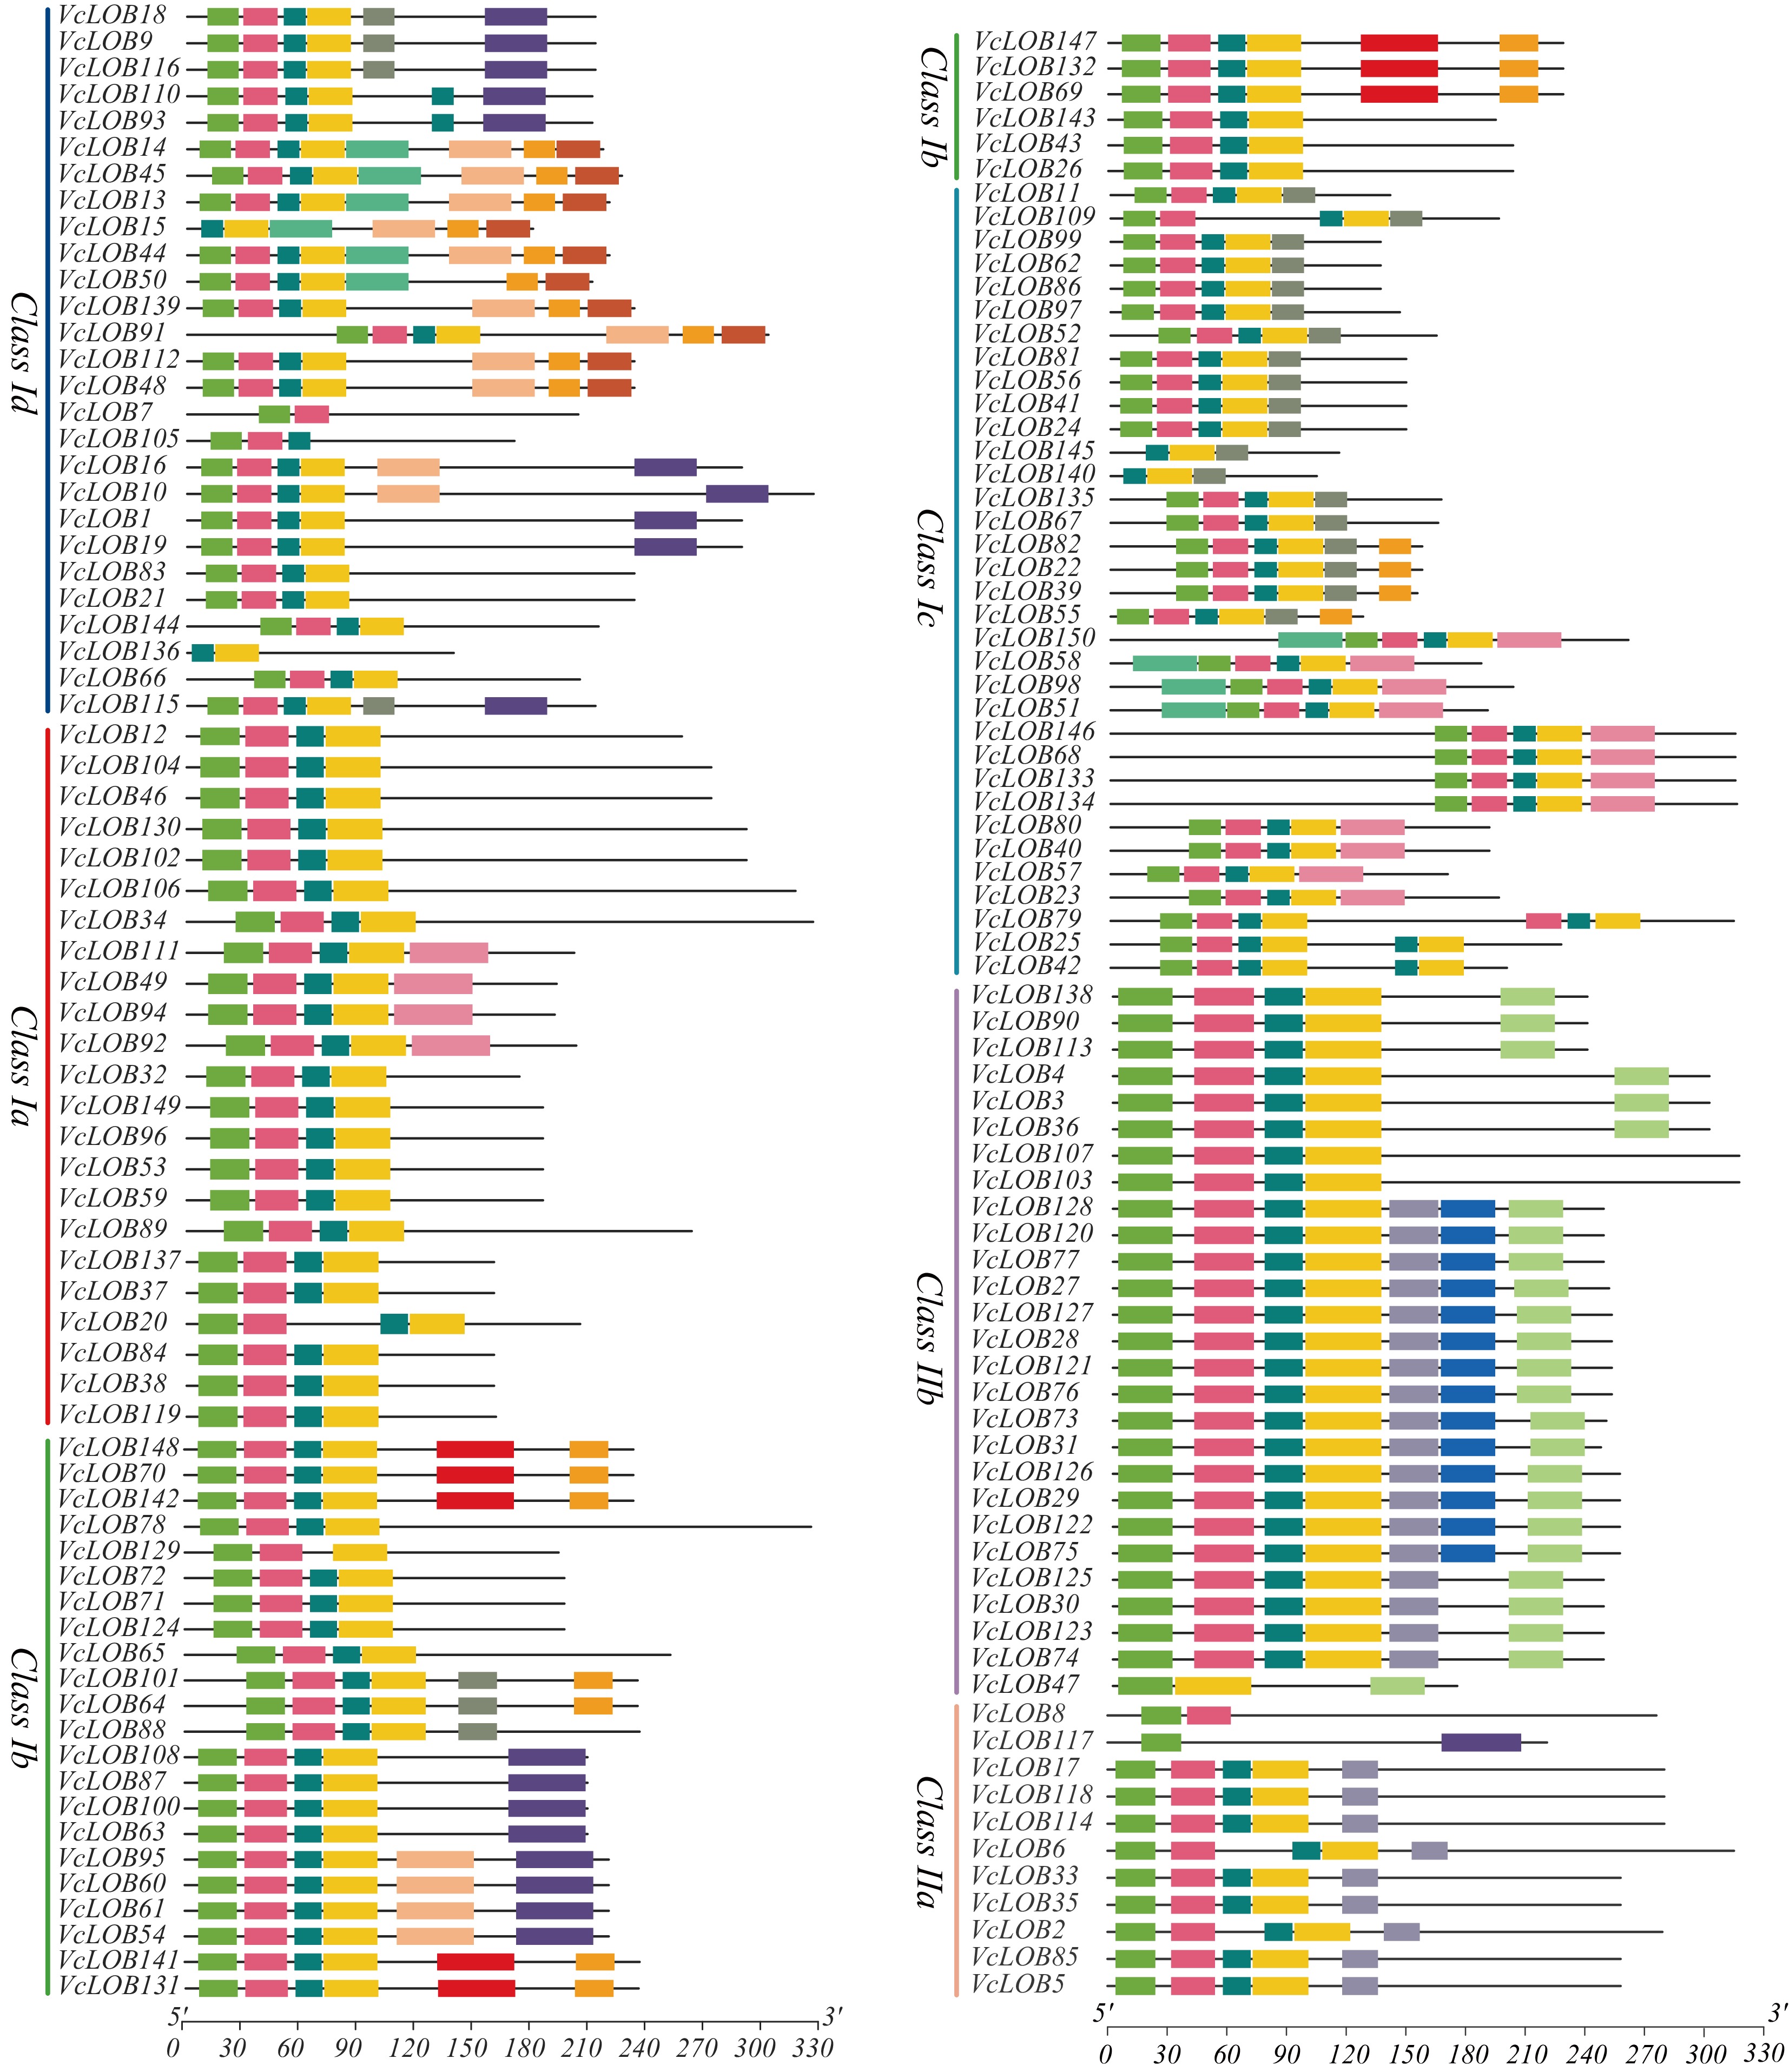
Figure 6.
Conserved motif analysis of 150 VcLOB proteins.
-
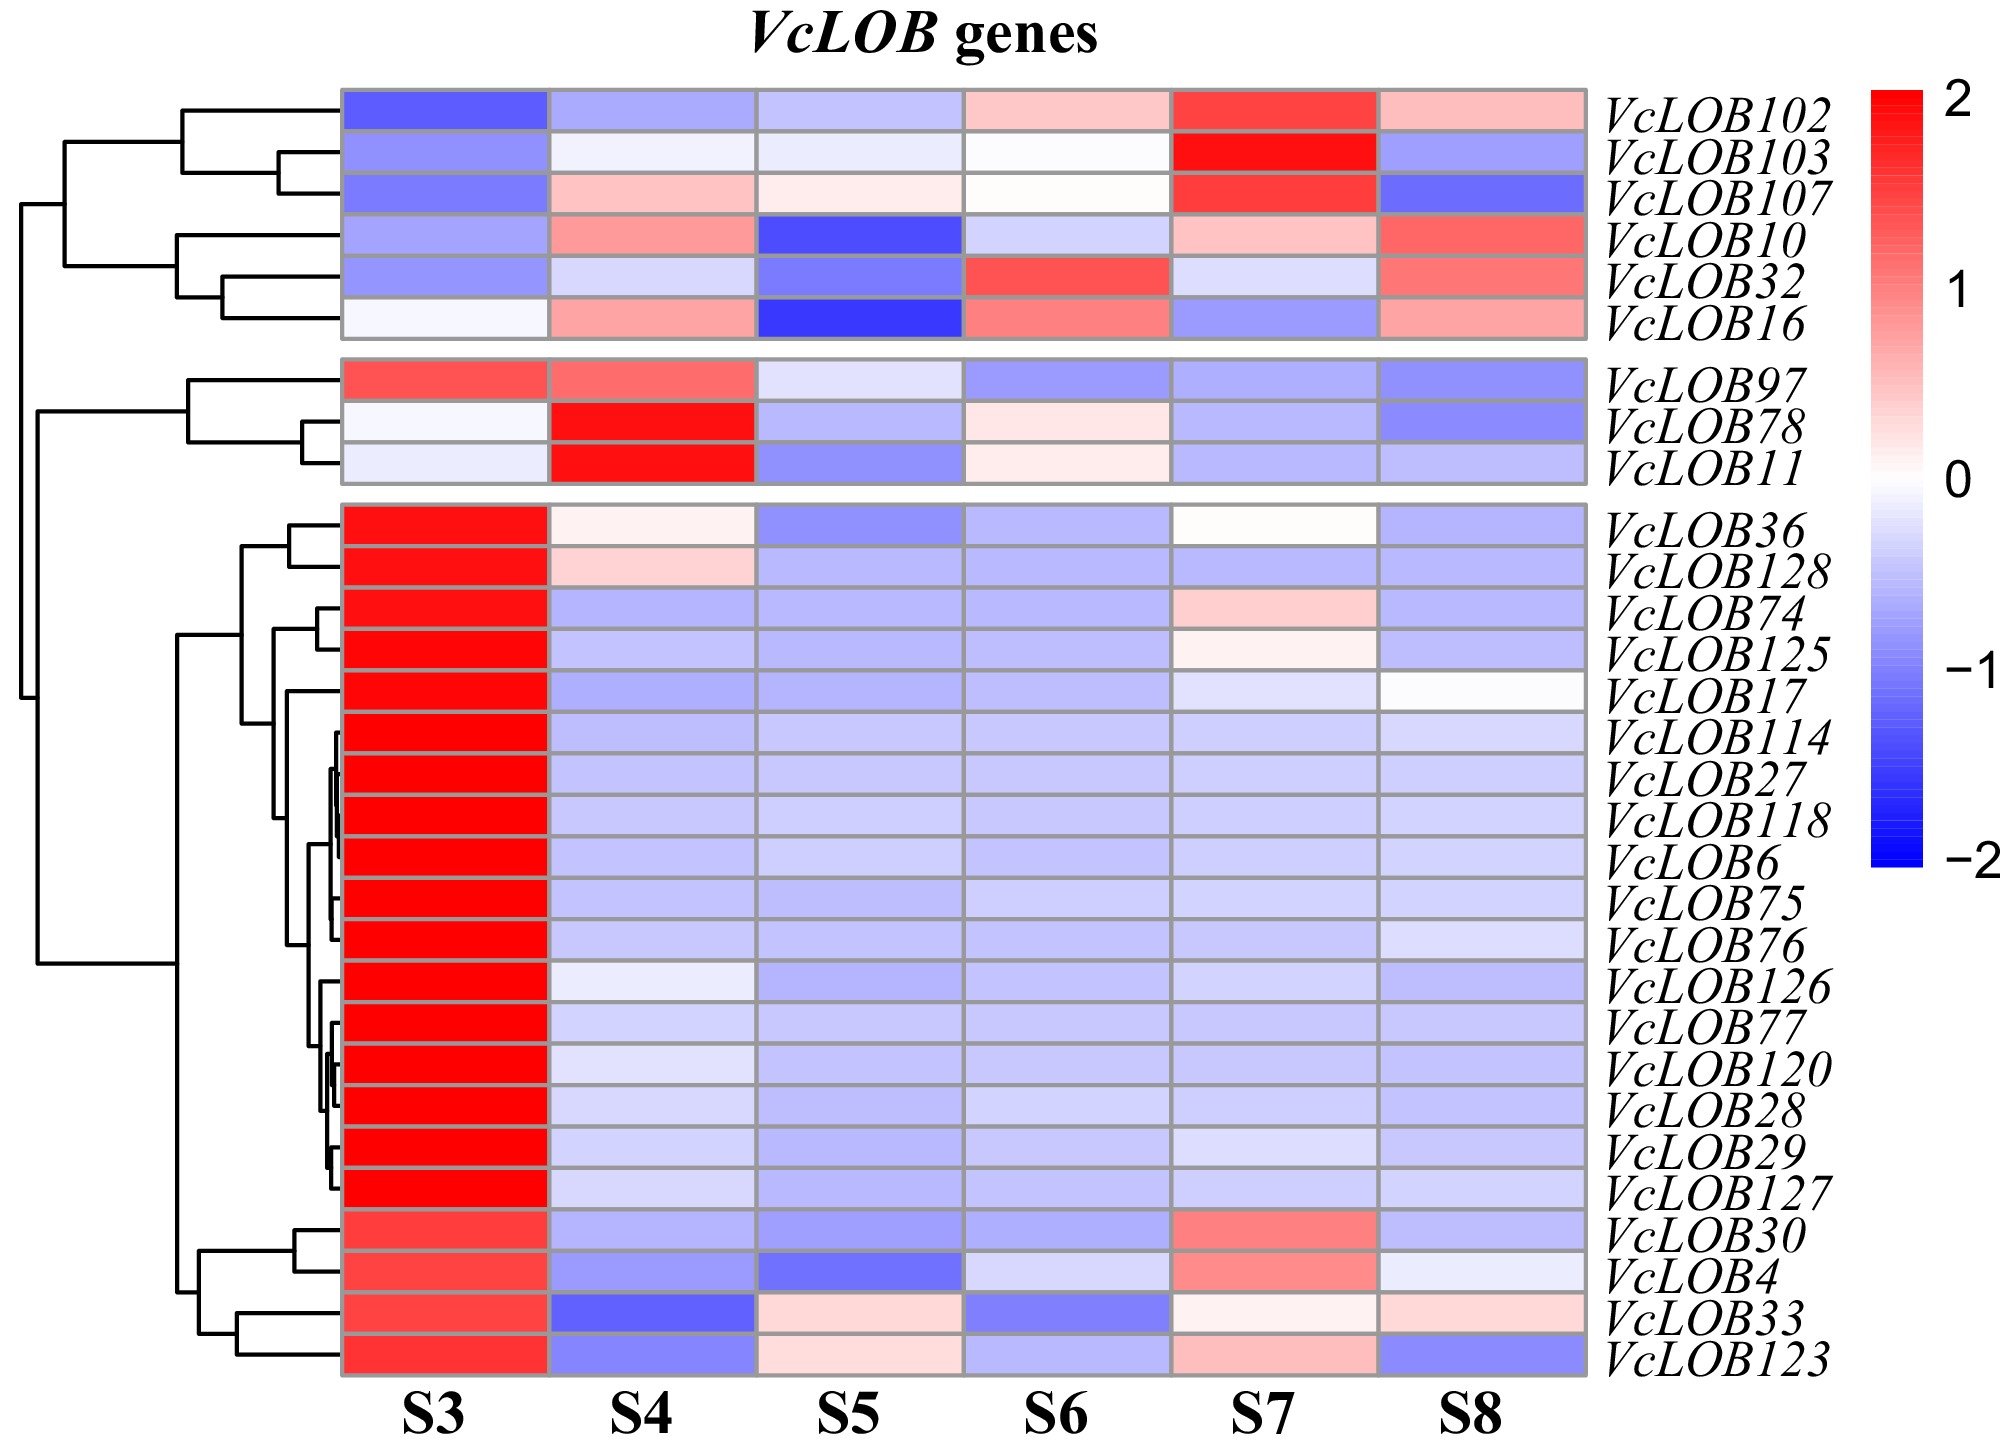
Figure 7.
TPM ratio heatmap of 30 VcLOB genes between 'O'Neal' and 'Star' blueberry fruits during the ripening process.
-
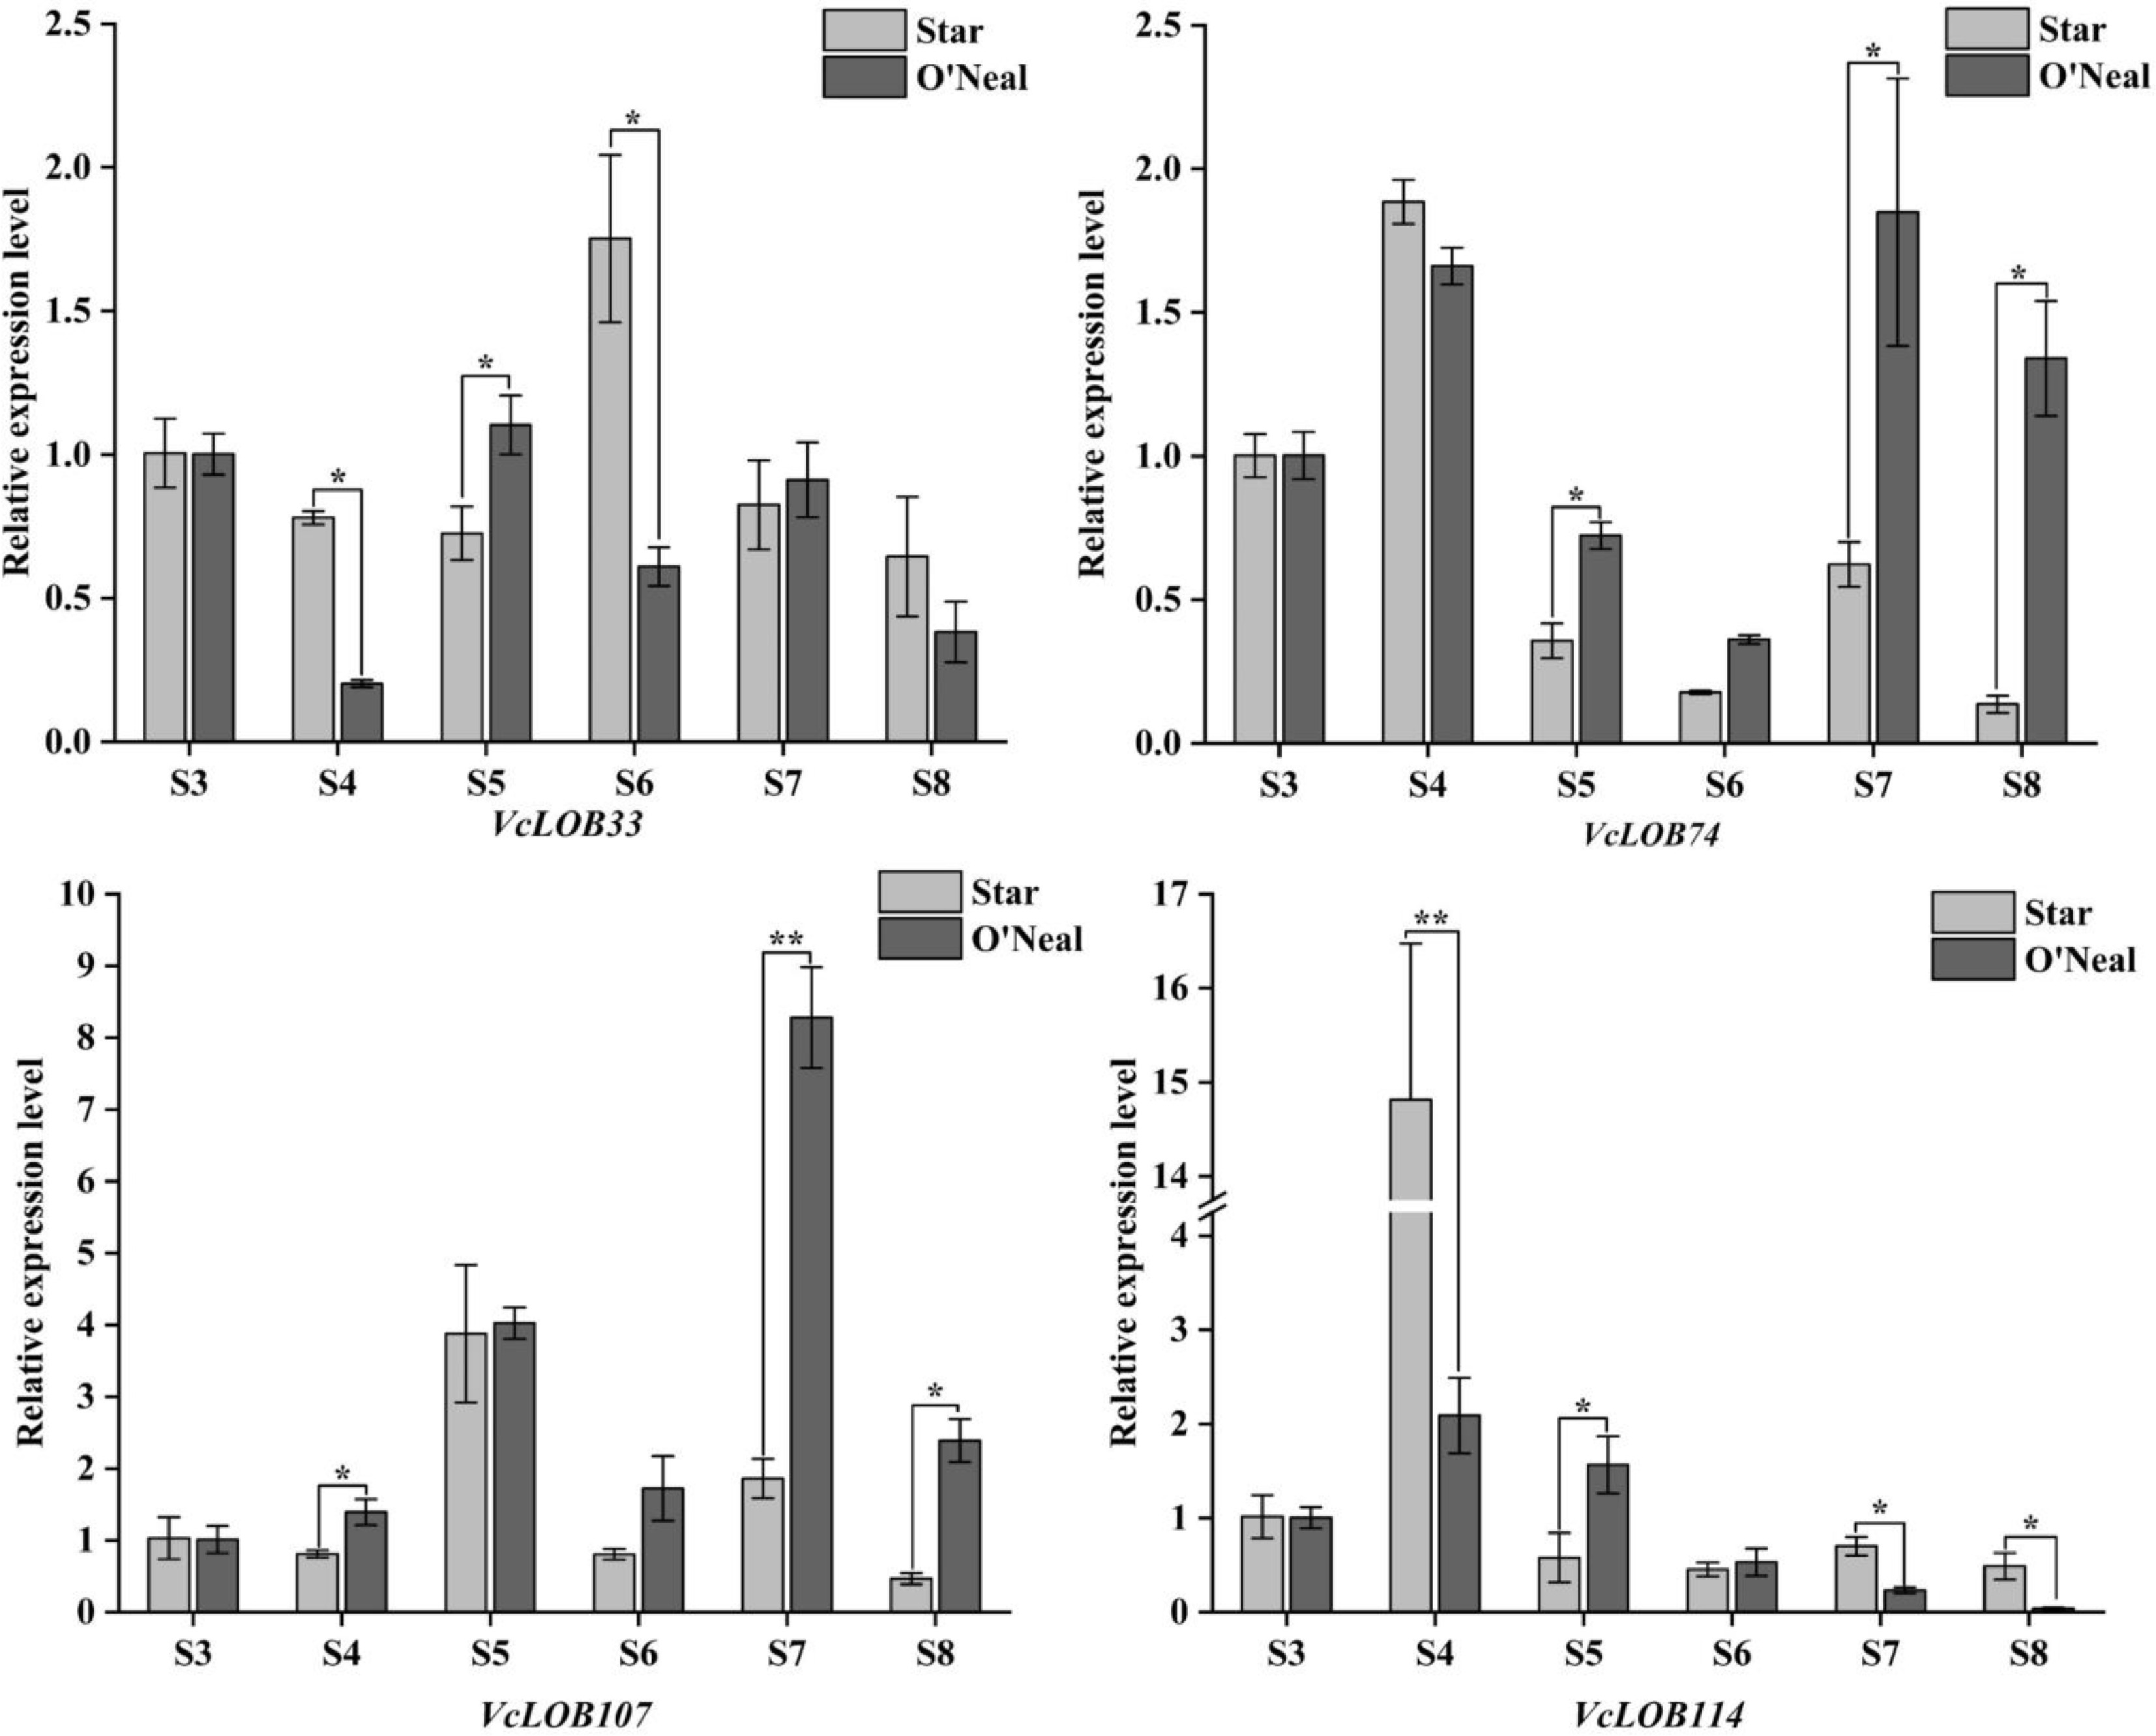
Figure 8.
Relative expression of VcLOB genes during fruit development (t-test, * p < 0.05, ** p < 0.01).
-
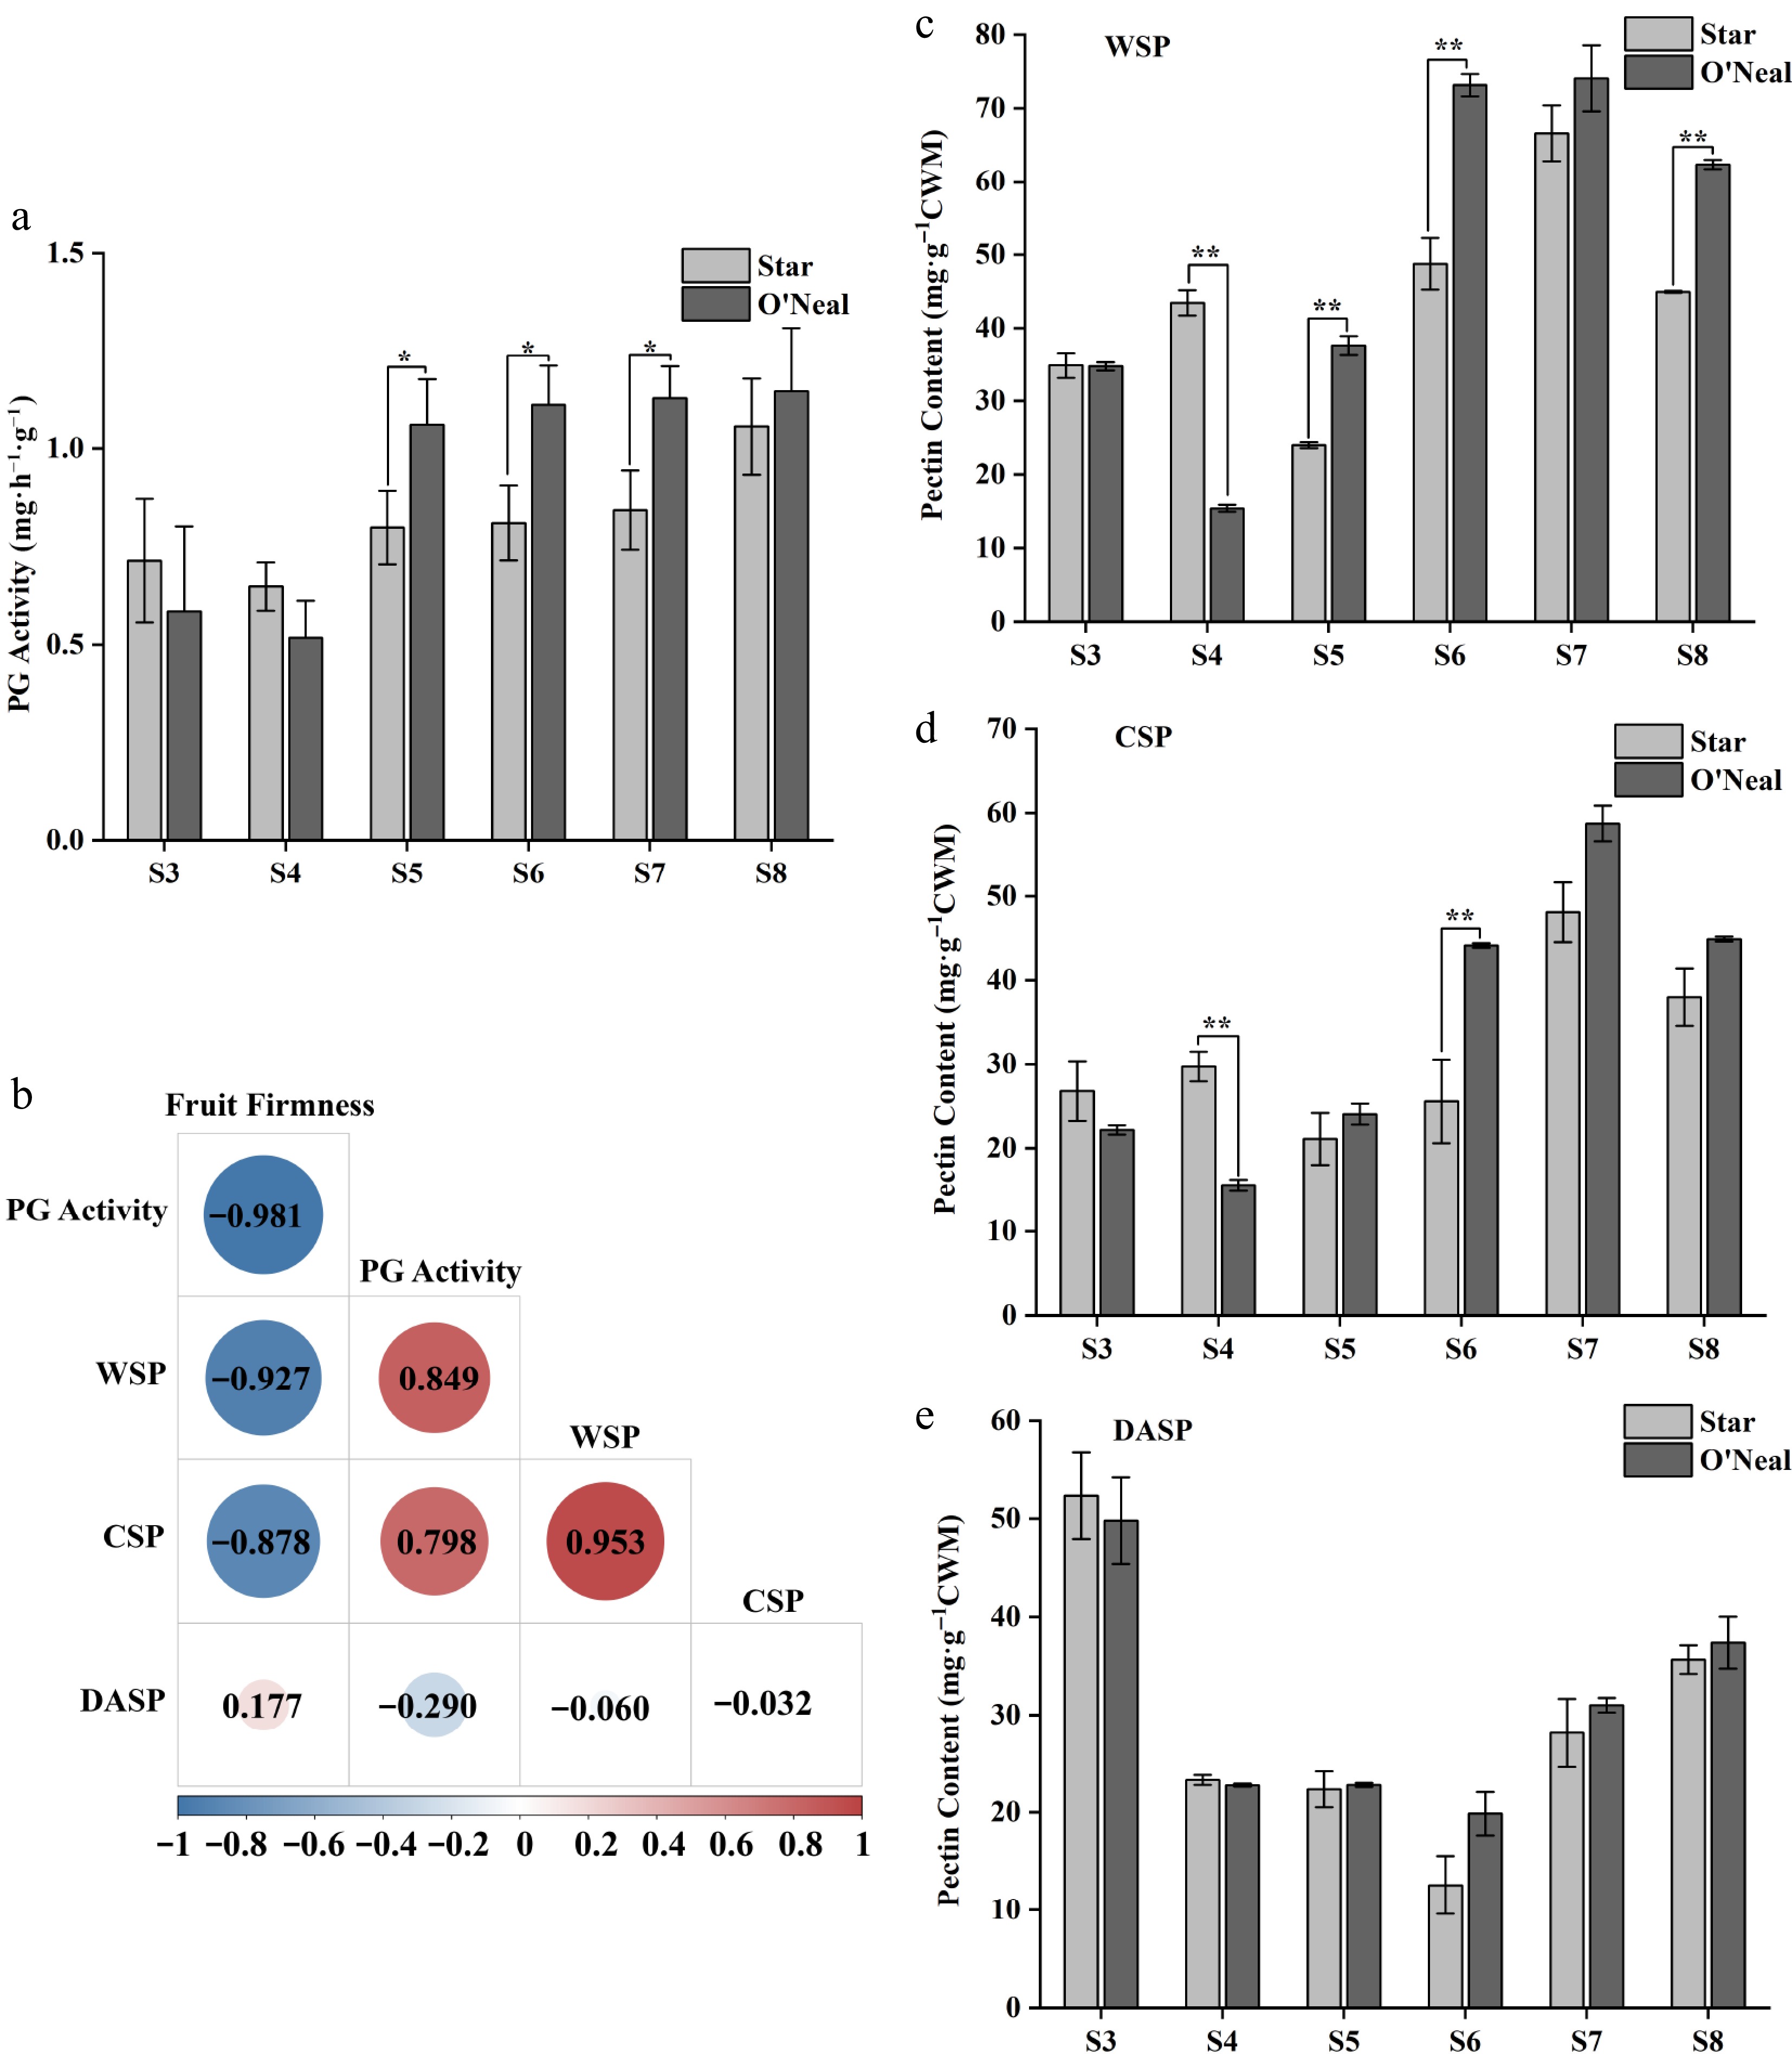
Figure 9.
PG activity, correlation between fruit firmness and physiological indicators, and pectin contents at different developmental stages of 'Star' and 'O'Neal' fruits. (t-test, * p < 0.05, ** p < 0.01).
-
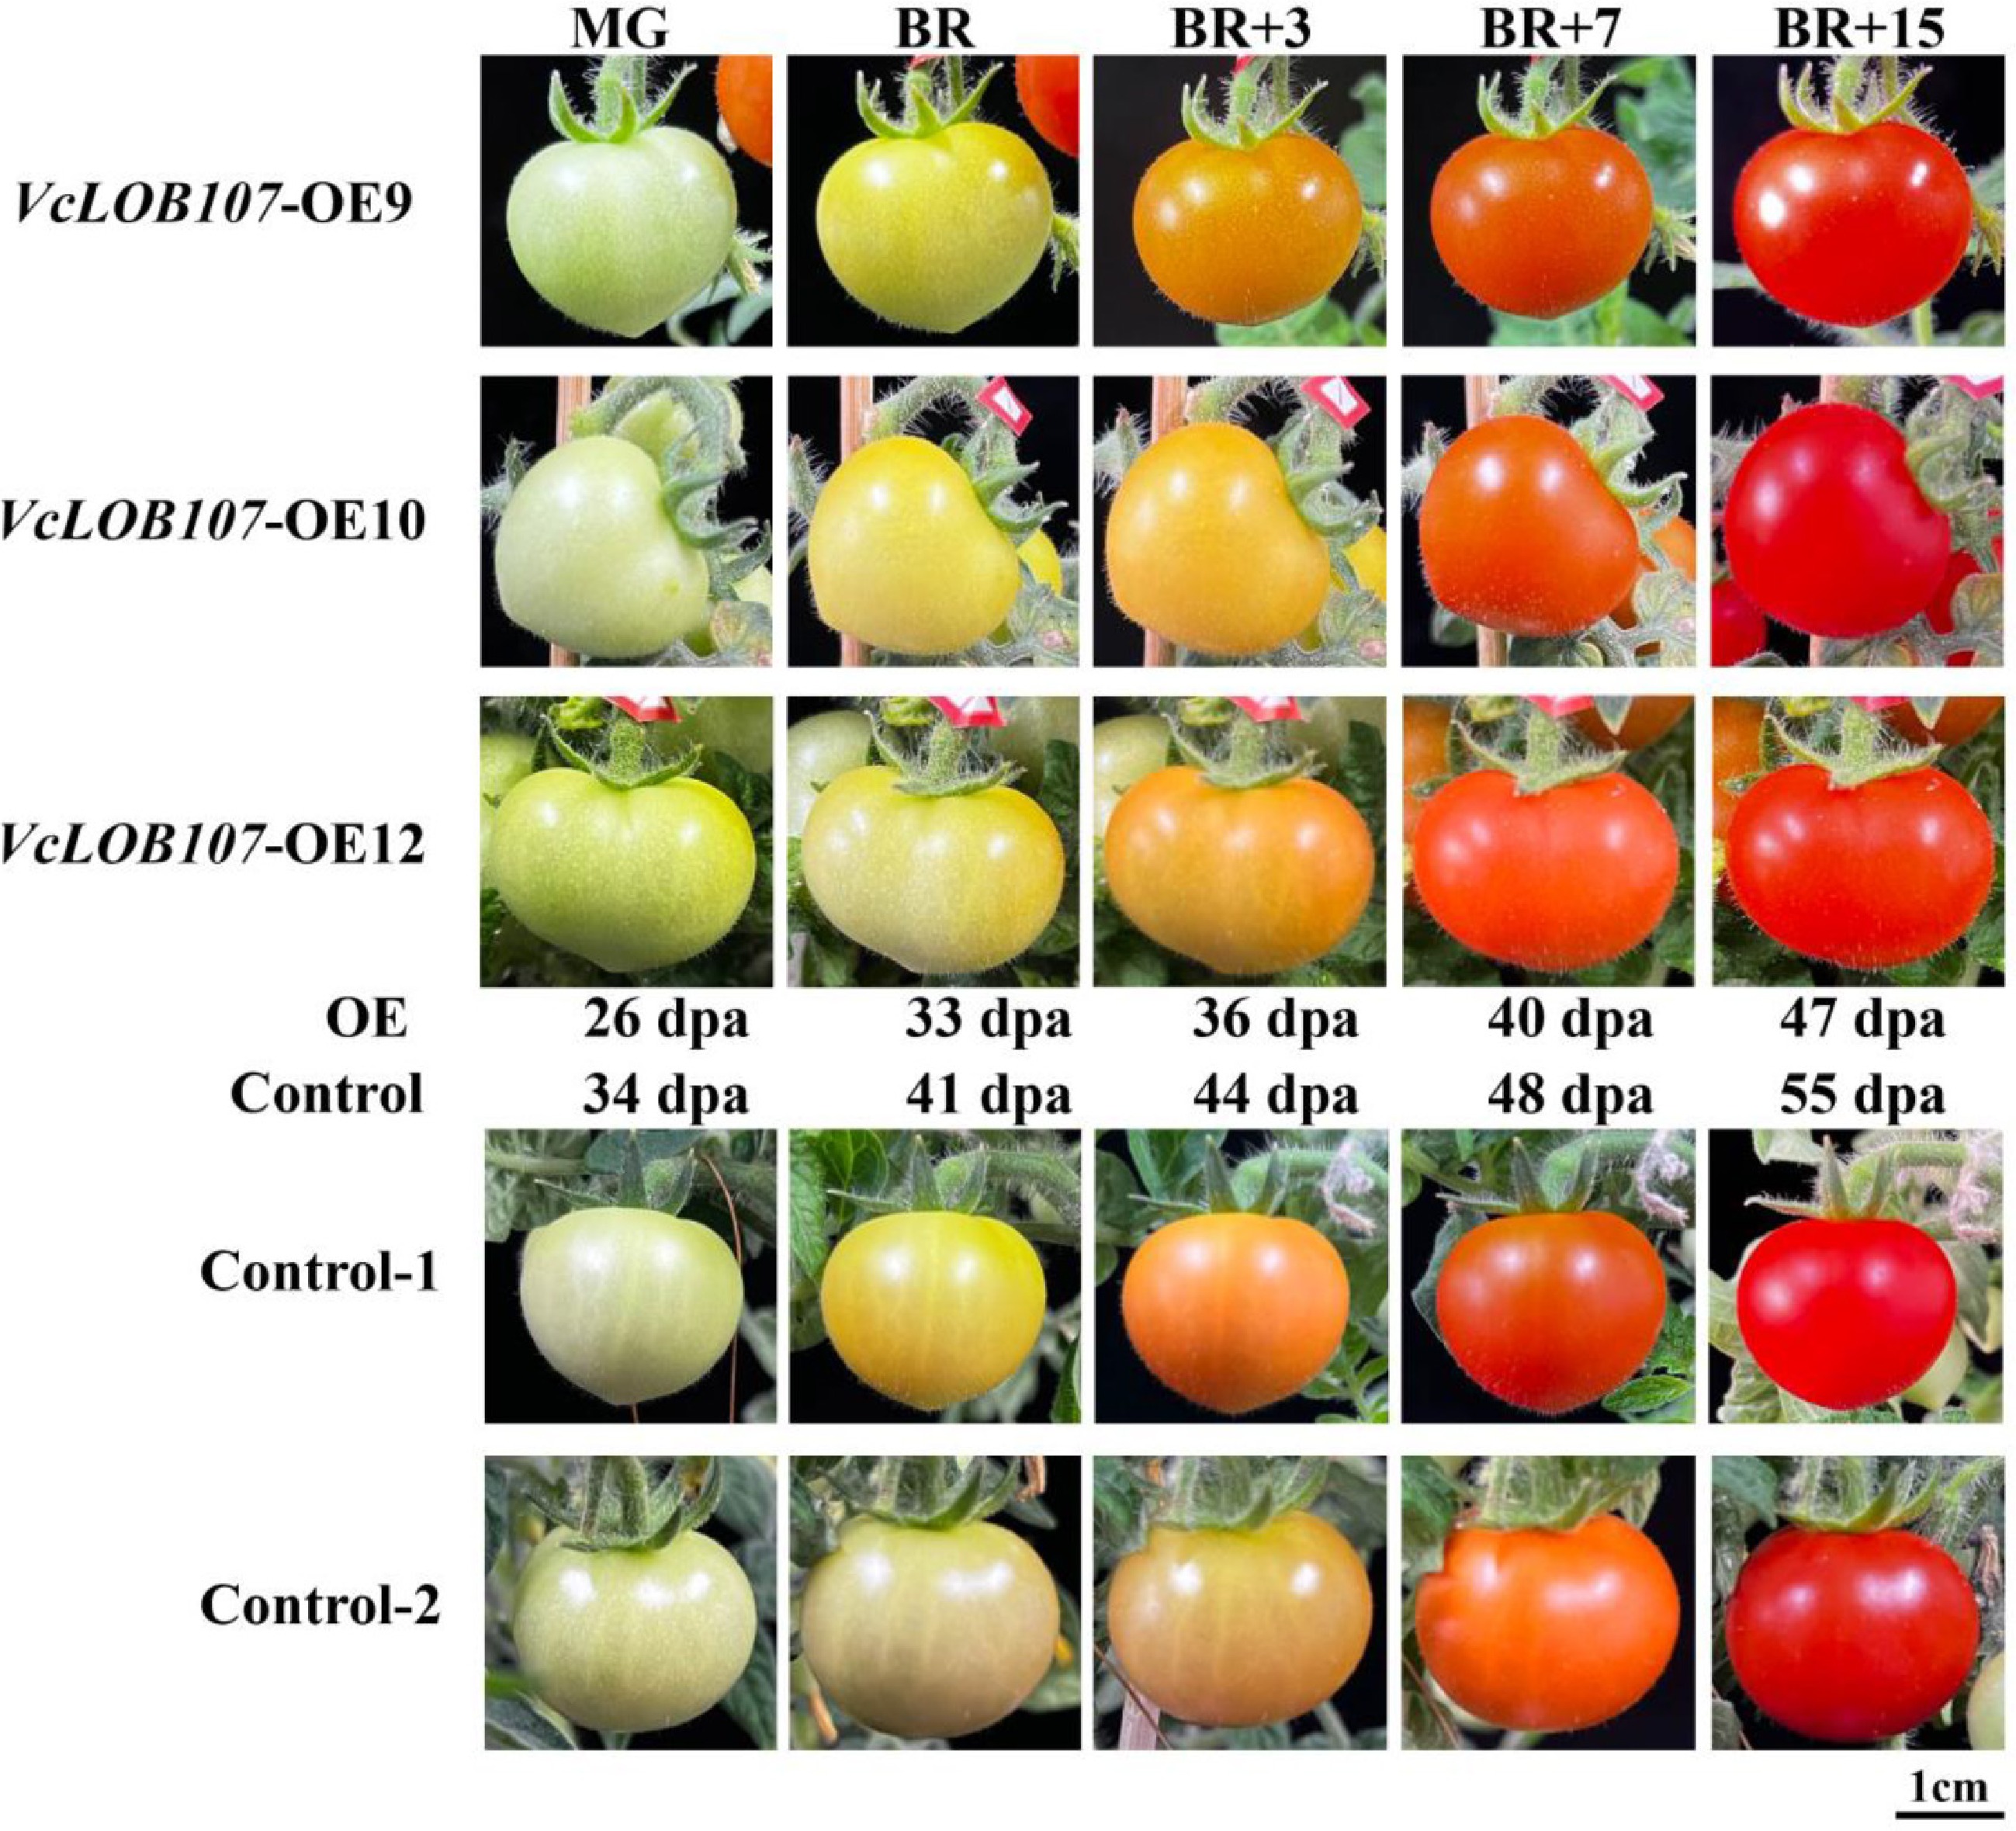
Figure 10.
Fruit phenotype alteration of the overexpressed tomato. MG: mature green, BR: breaker stage, BR+3: 3 d after breaker stage, BR+7: 7 d after breaker stage, BR+15: 15 d after breaker stage. dpa: days post-anthesis.
-
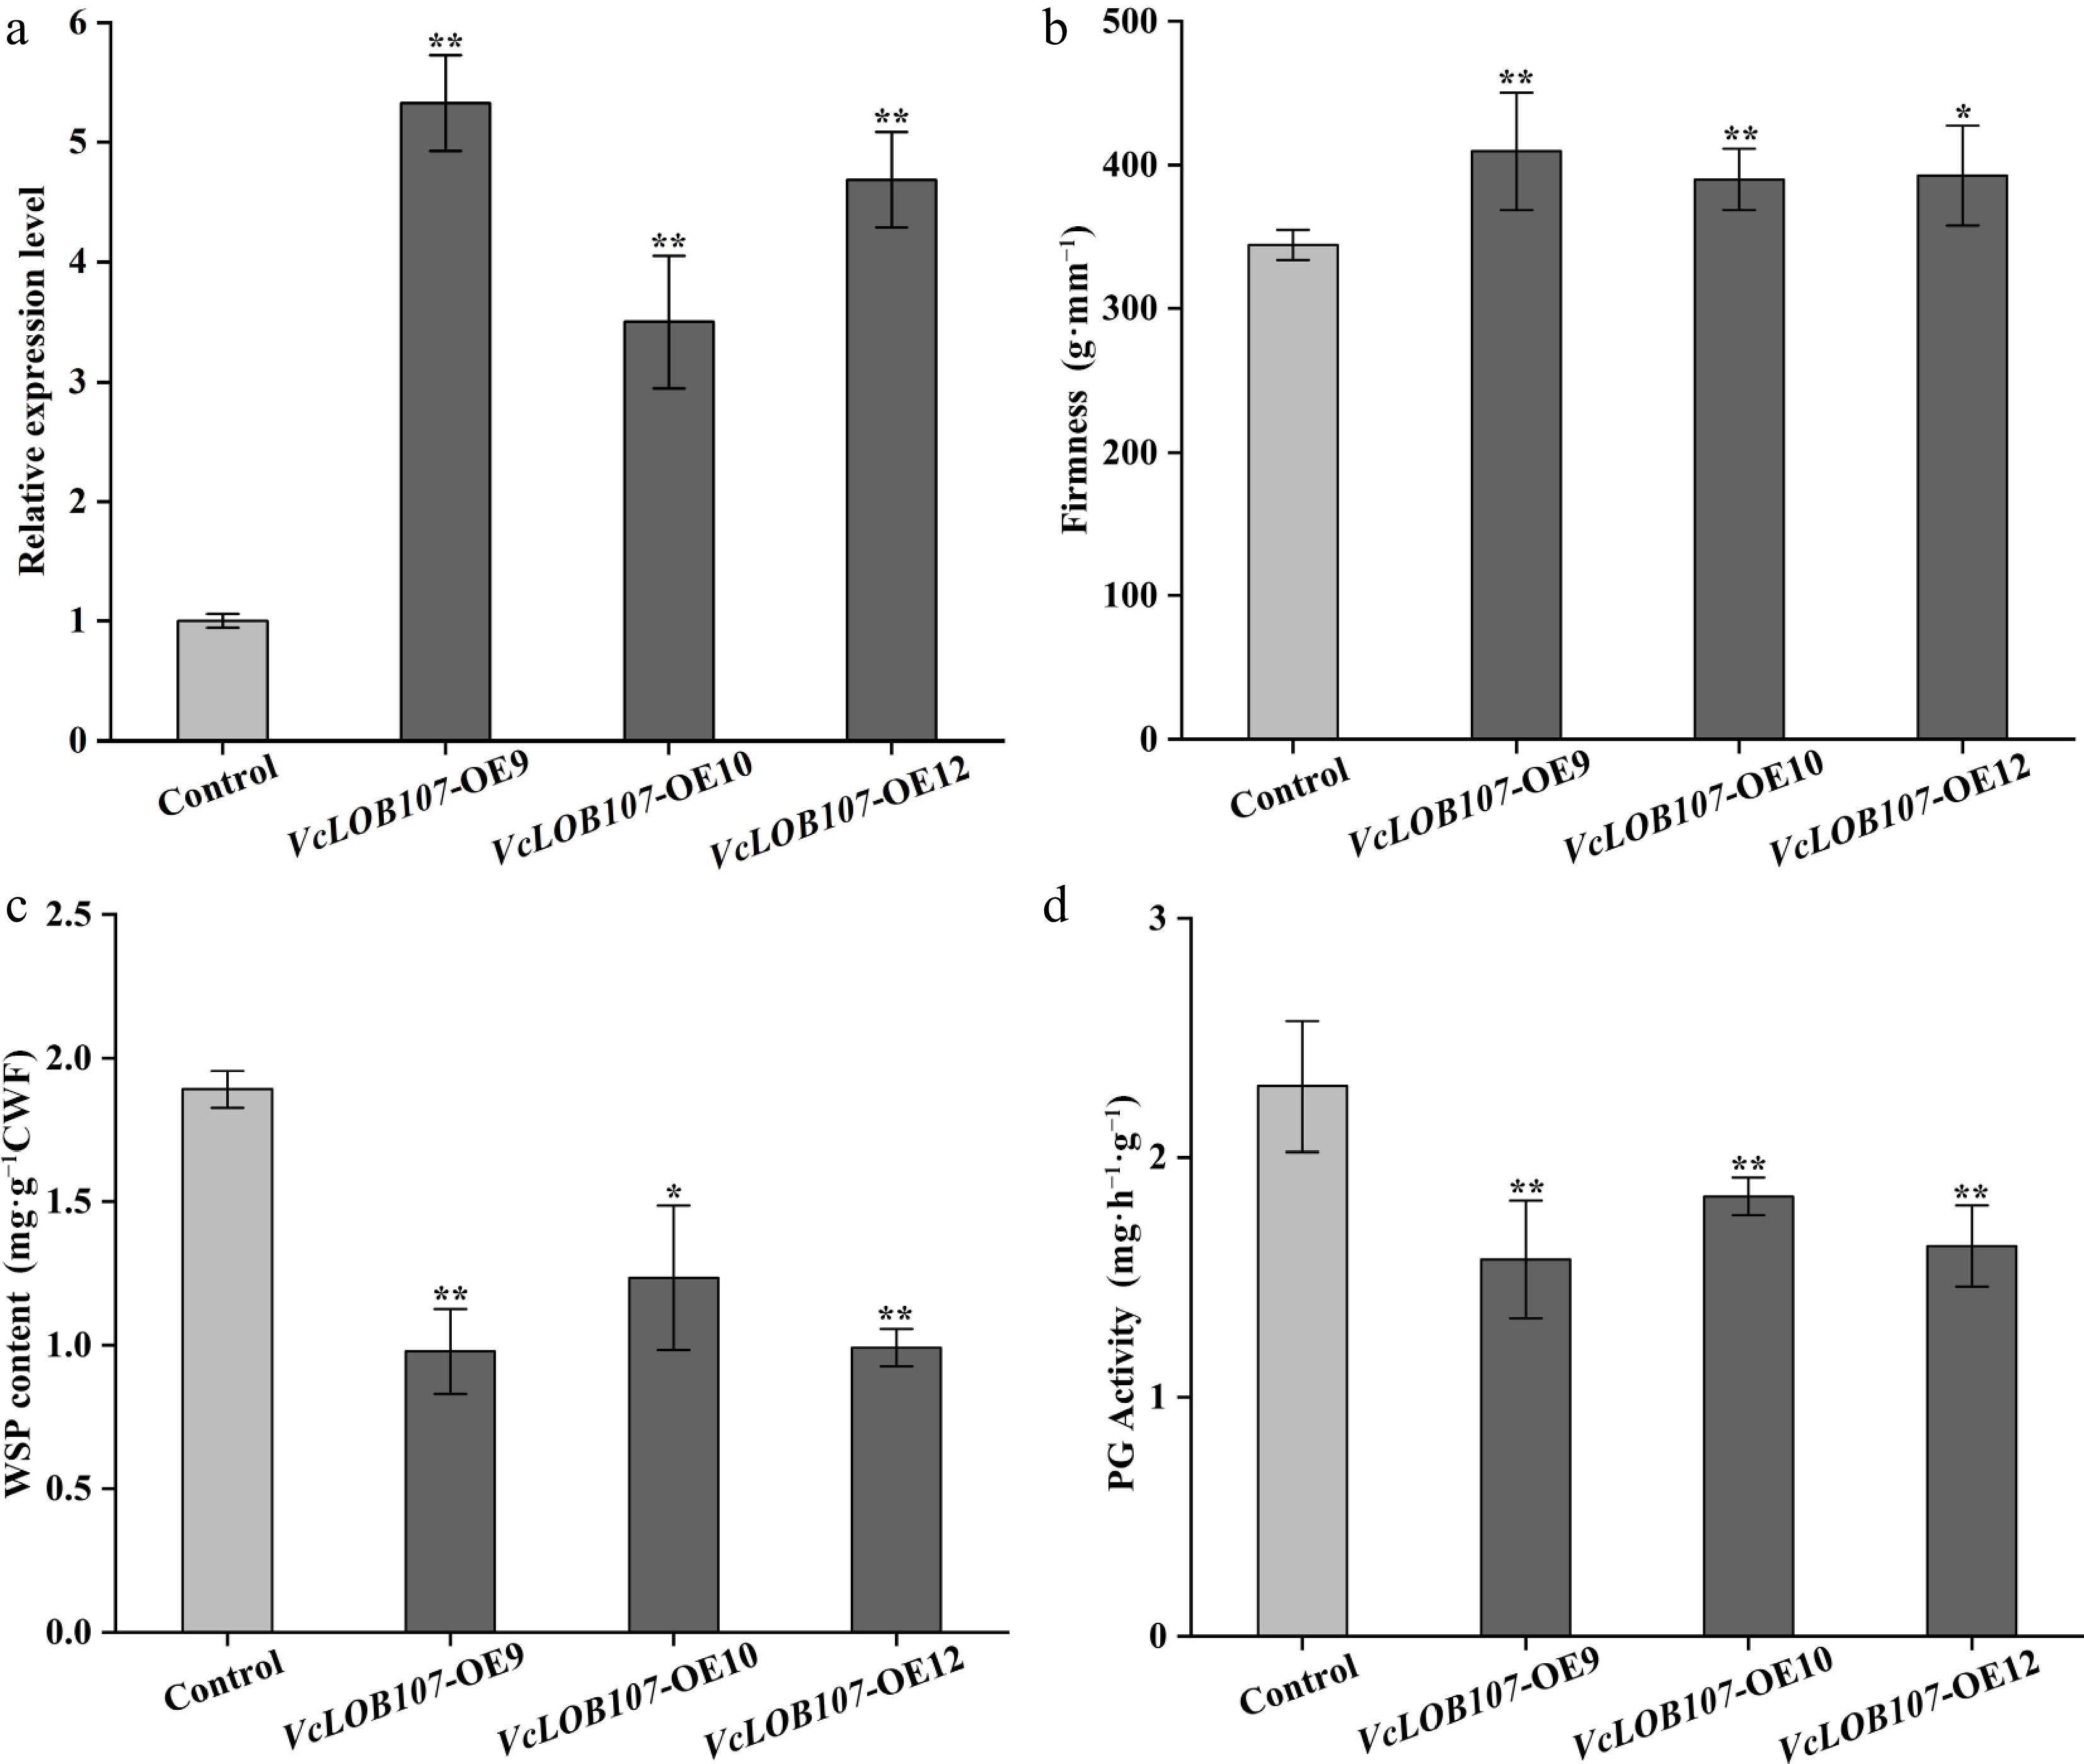
Figure 11.
VcLOB107 expression, fruit firmness, WSP content, and PG activities in the overexpressed tomato fruits (measured at 15 d after breaker stage). (t-test, * p < 0.05, ** p < 0.01).
Figures
(11)
Tables
(0)