-
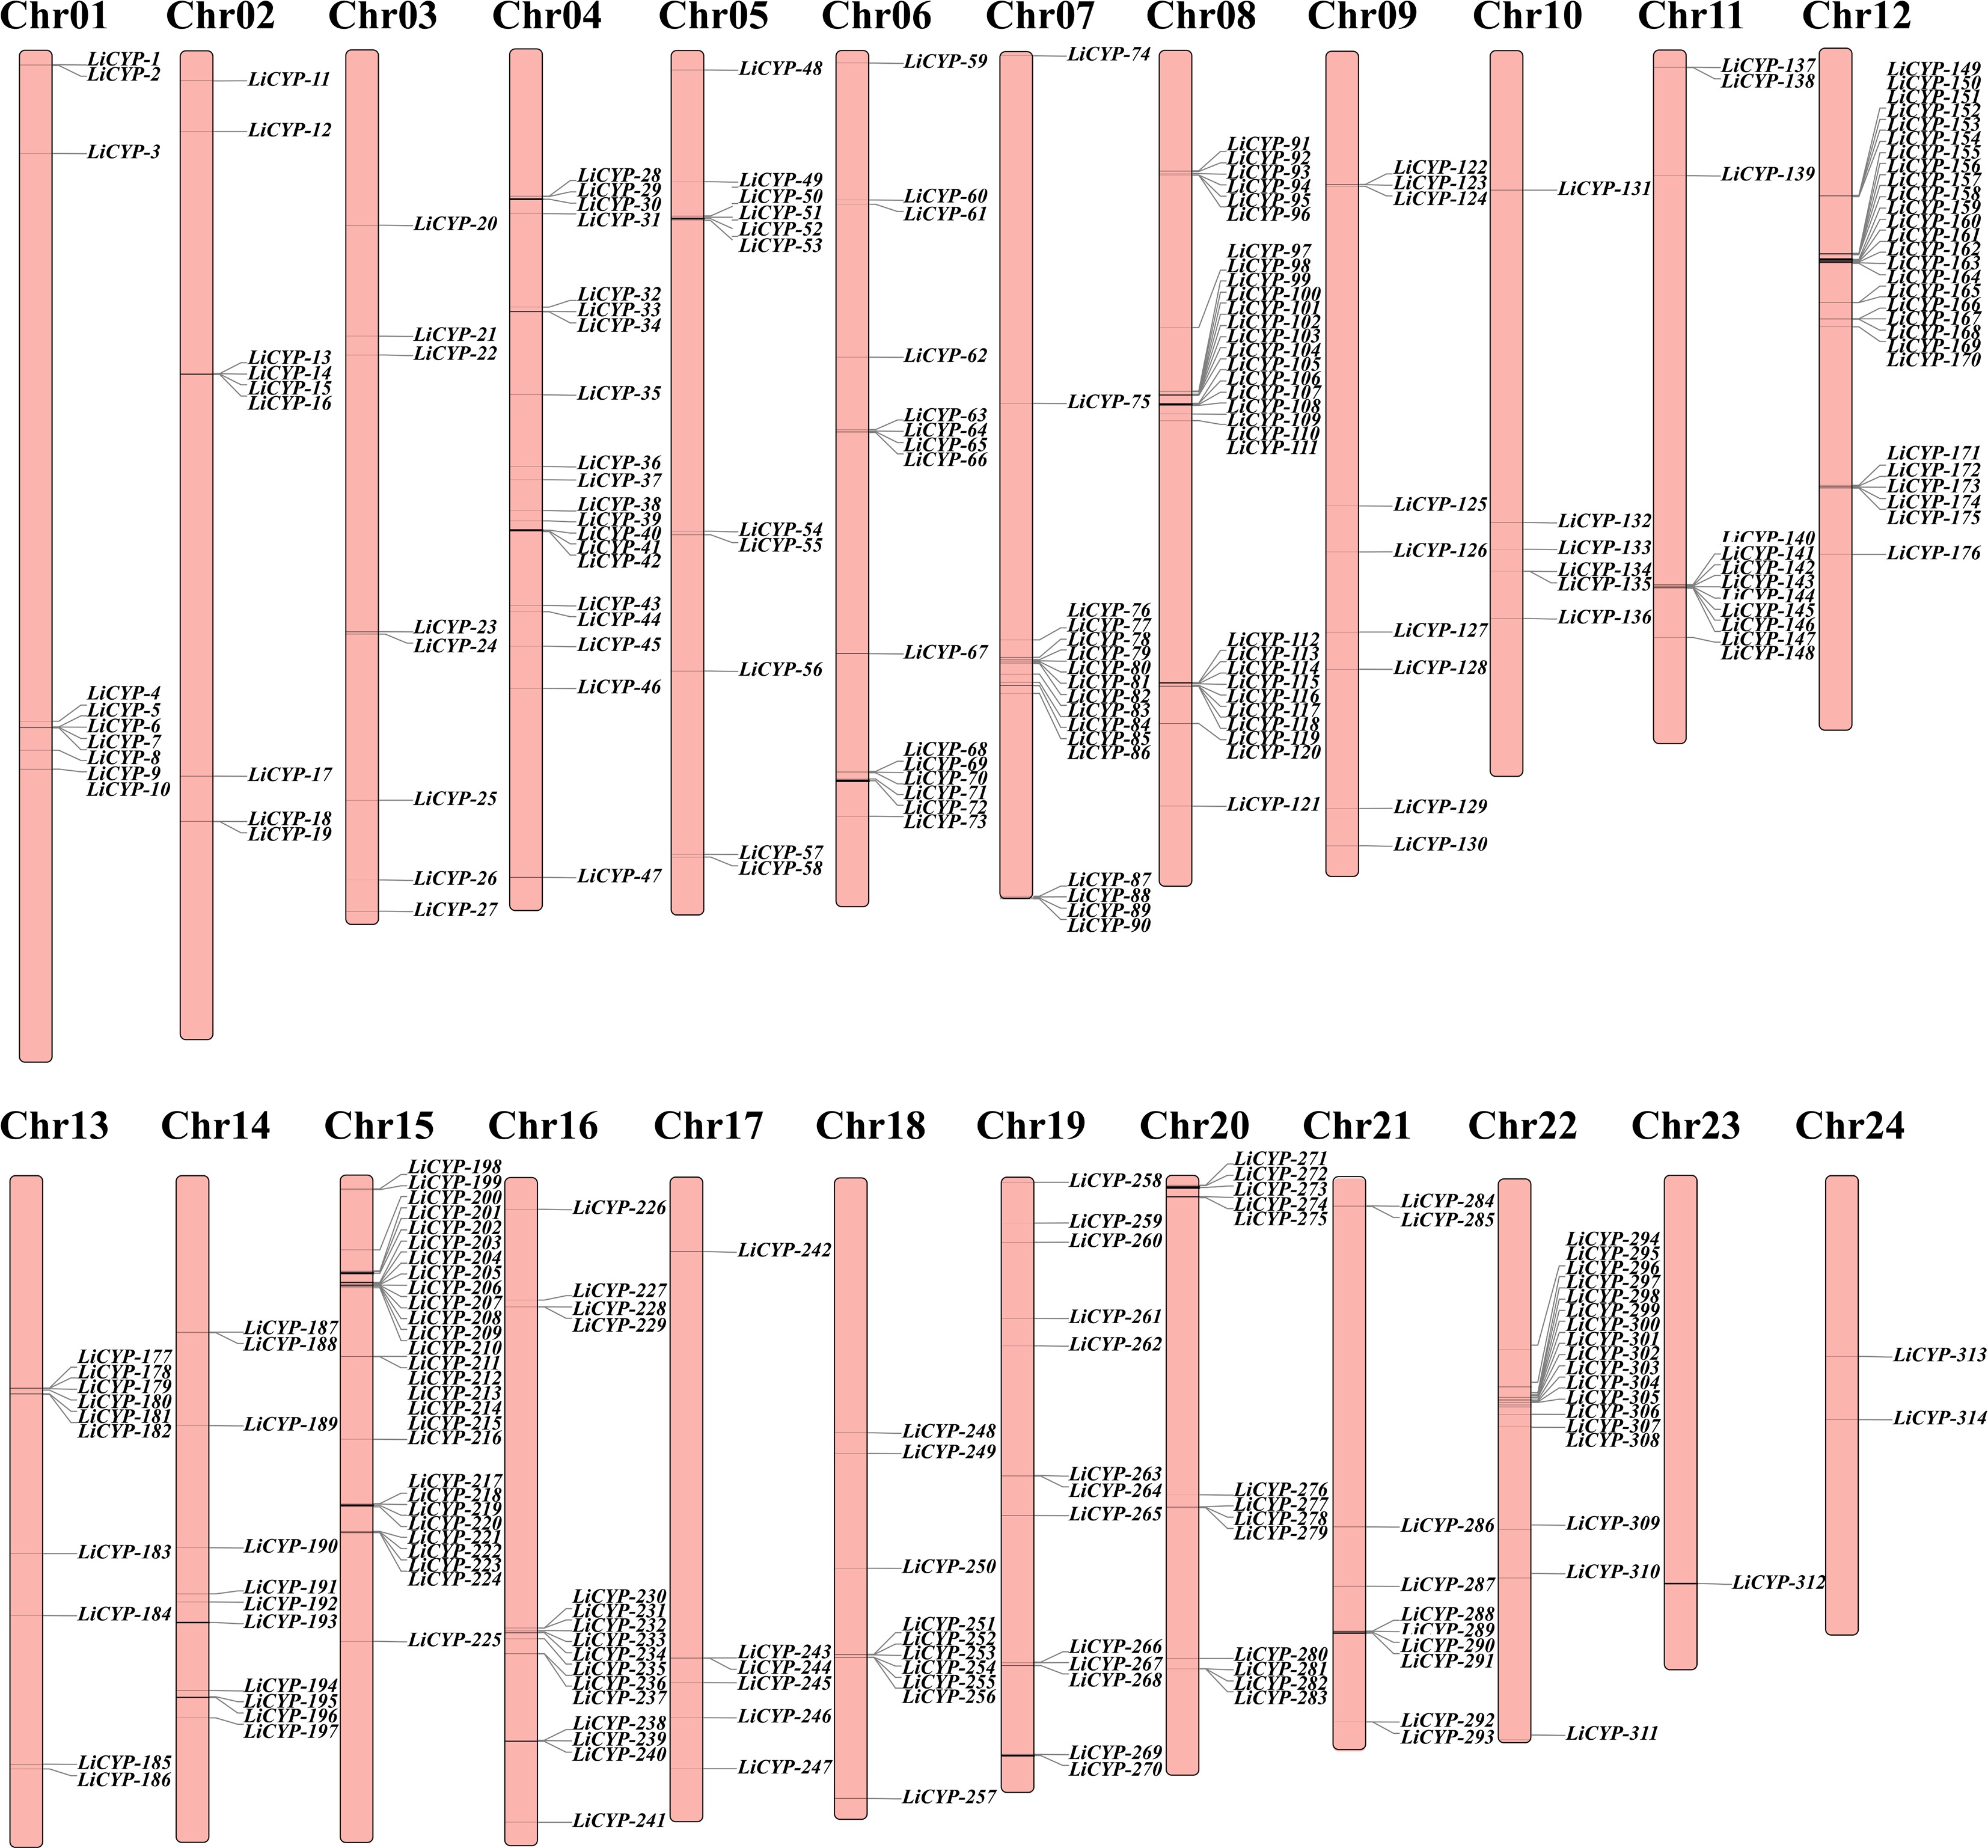
Figure 1.
Chromosome location and distribution of LiCYP450 family members.
-
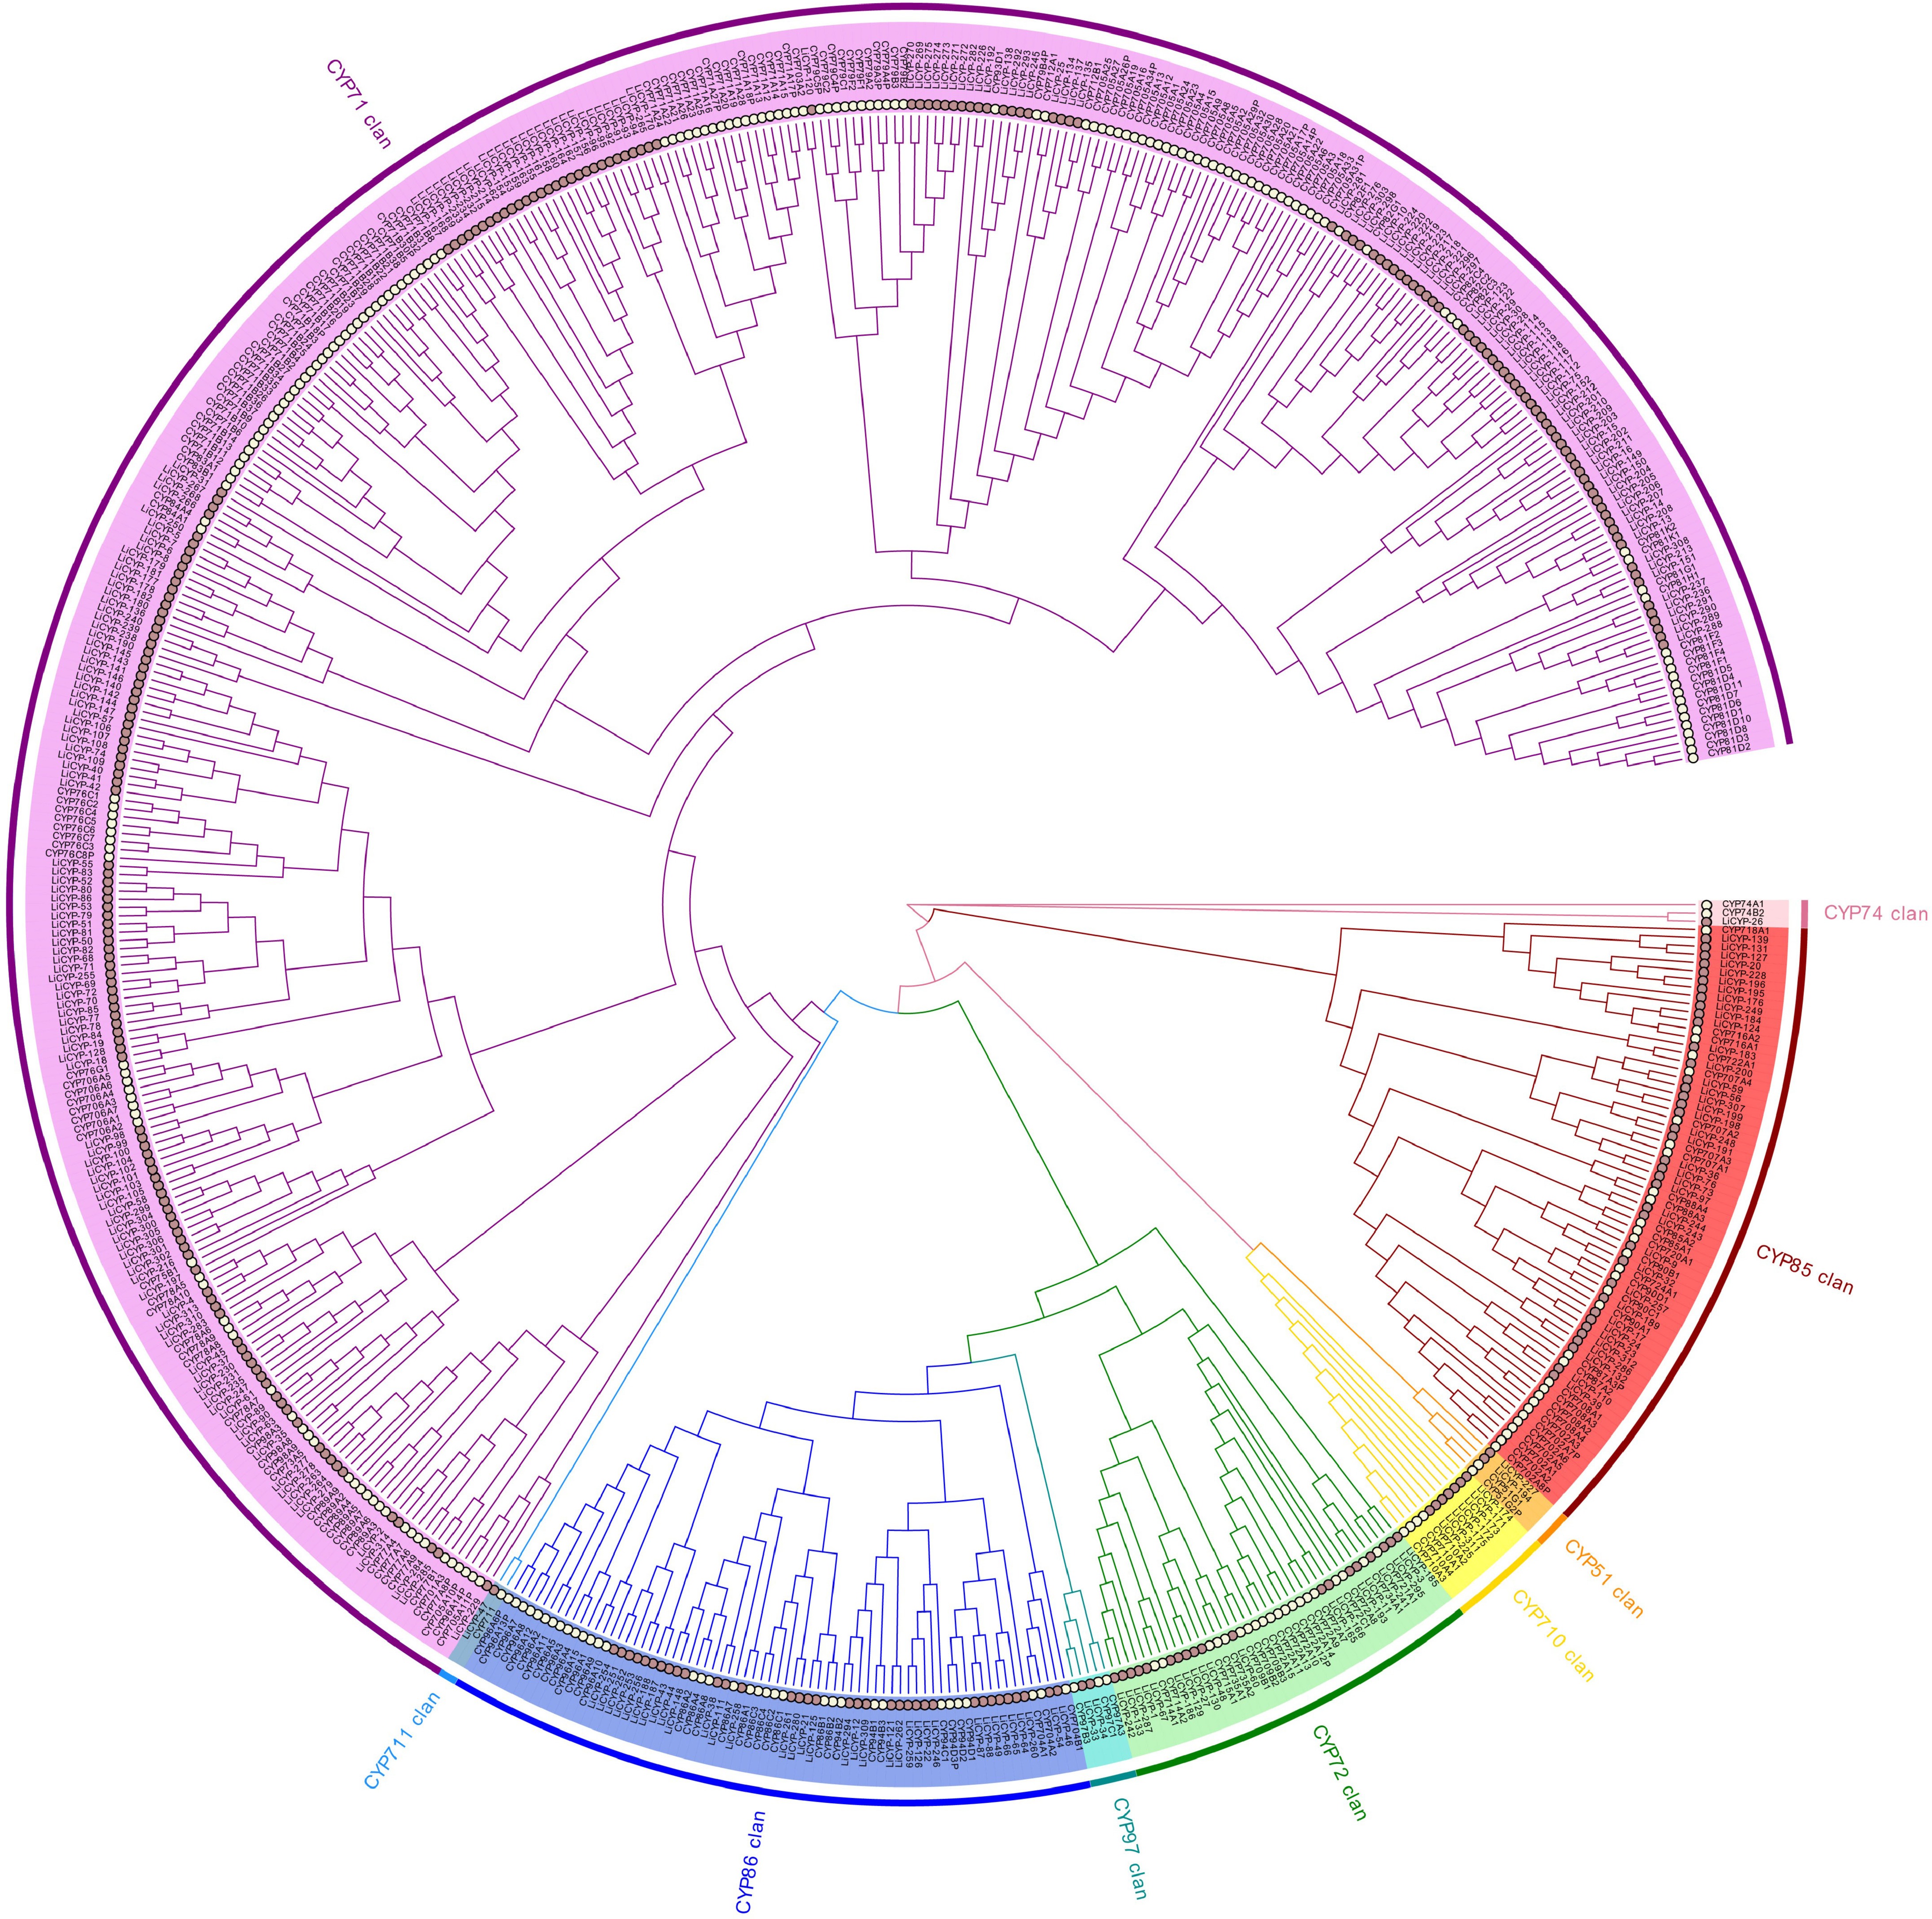
Figure 2.
Phylogenetic relationships between L. indica and A. thaliana CYP450 protein.
-
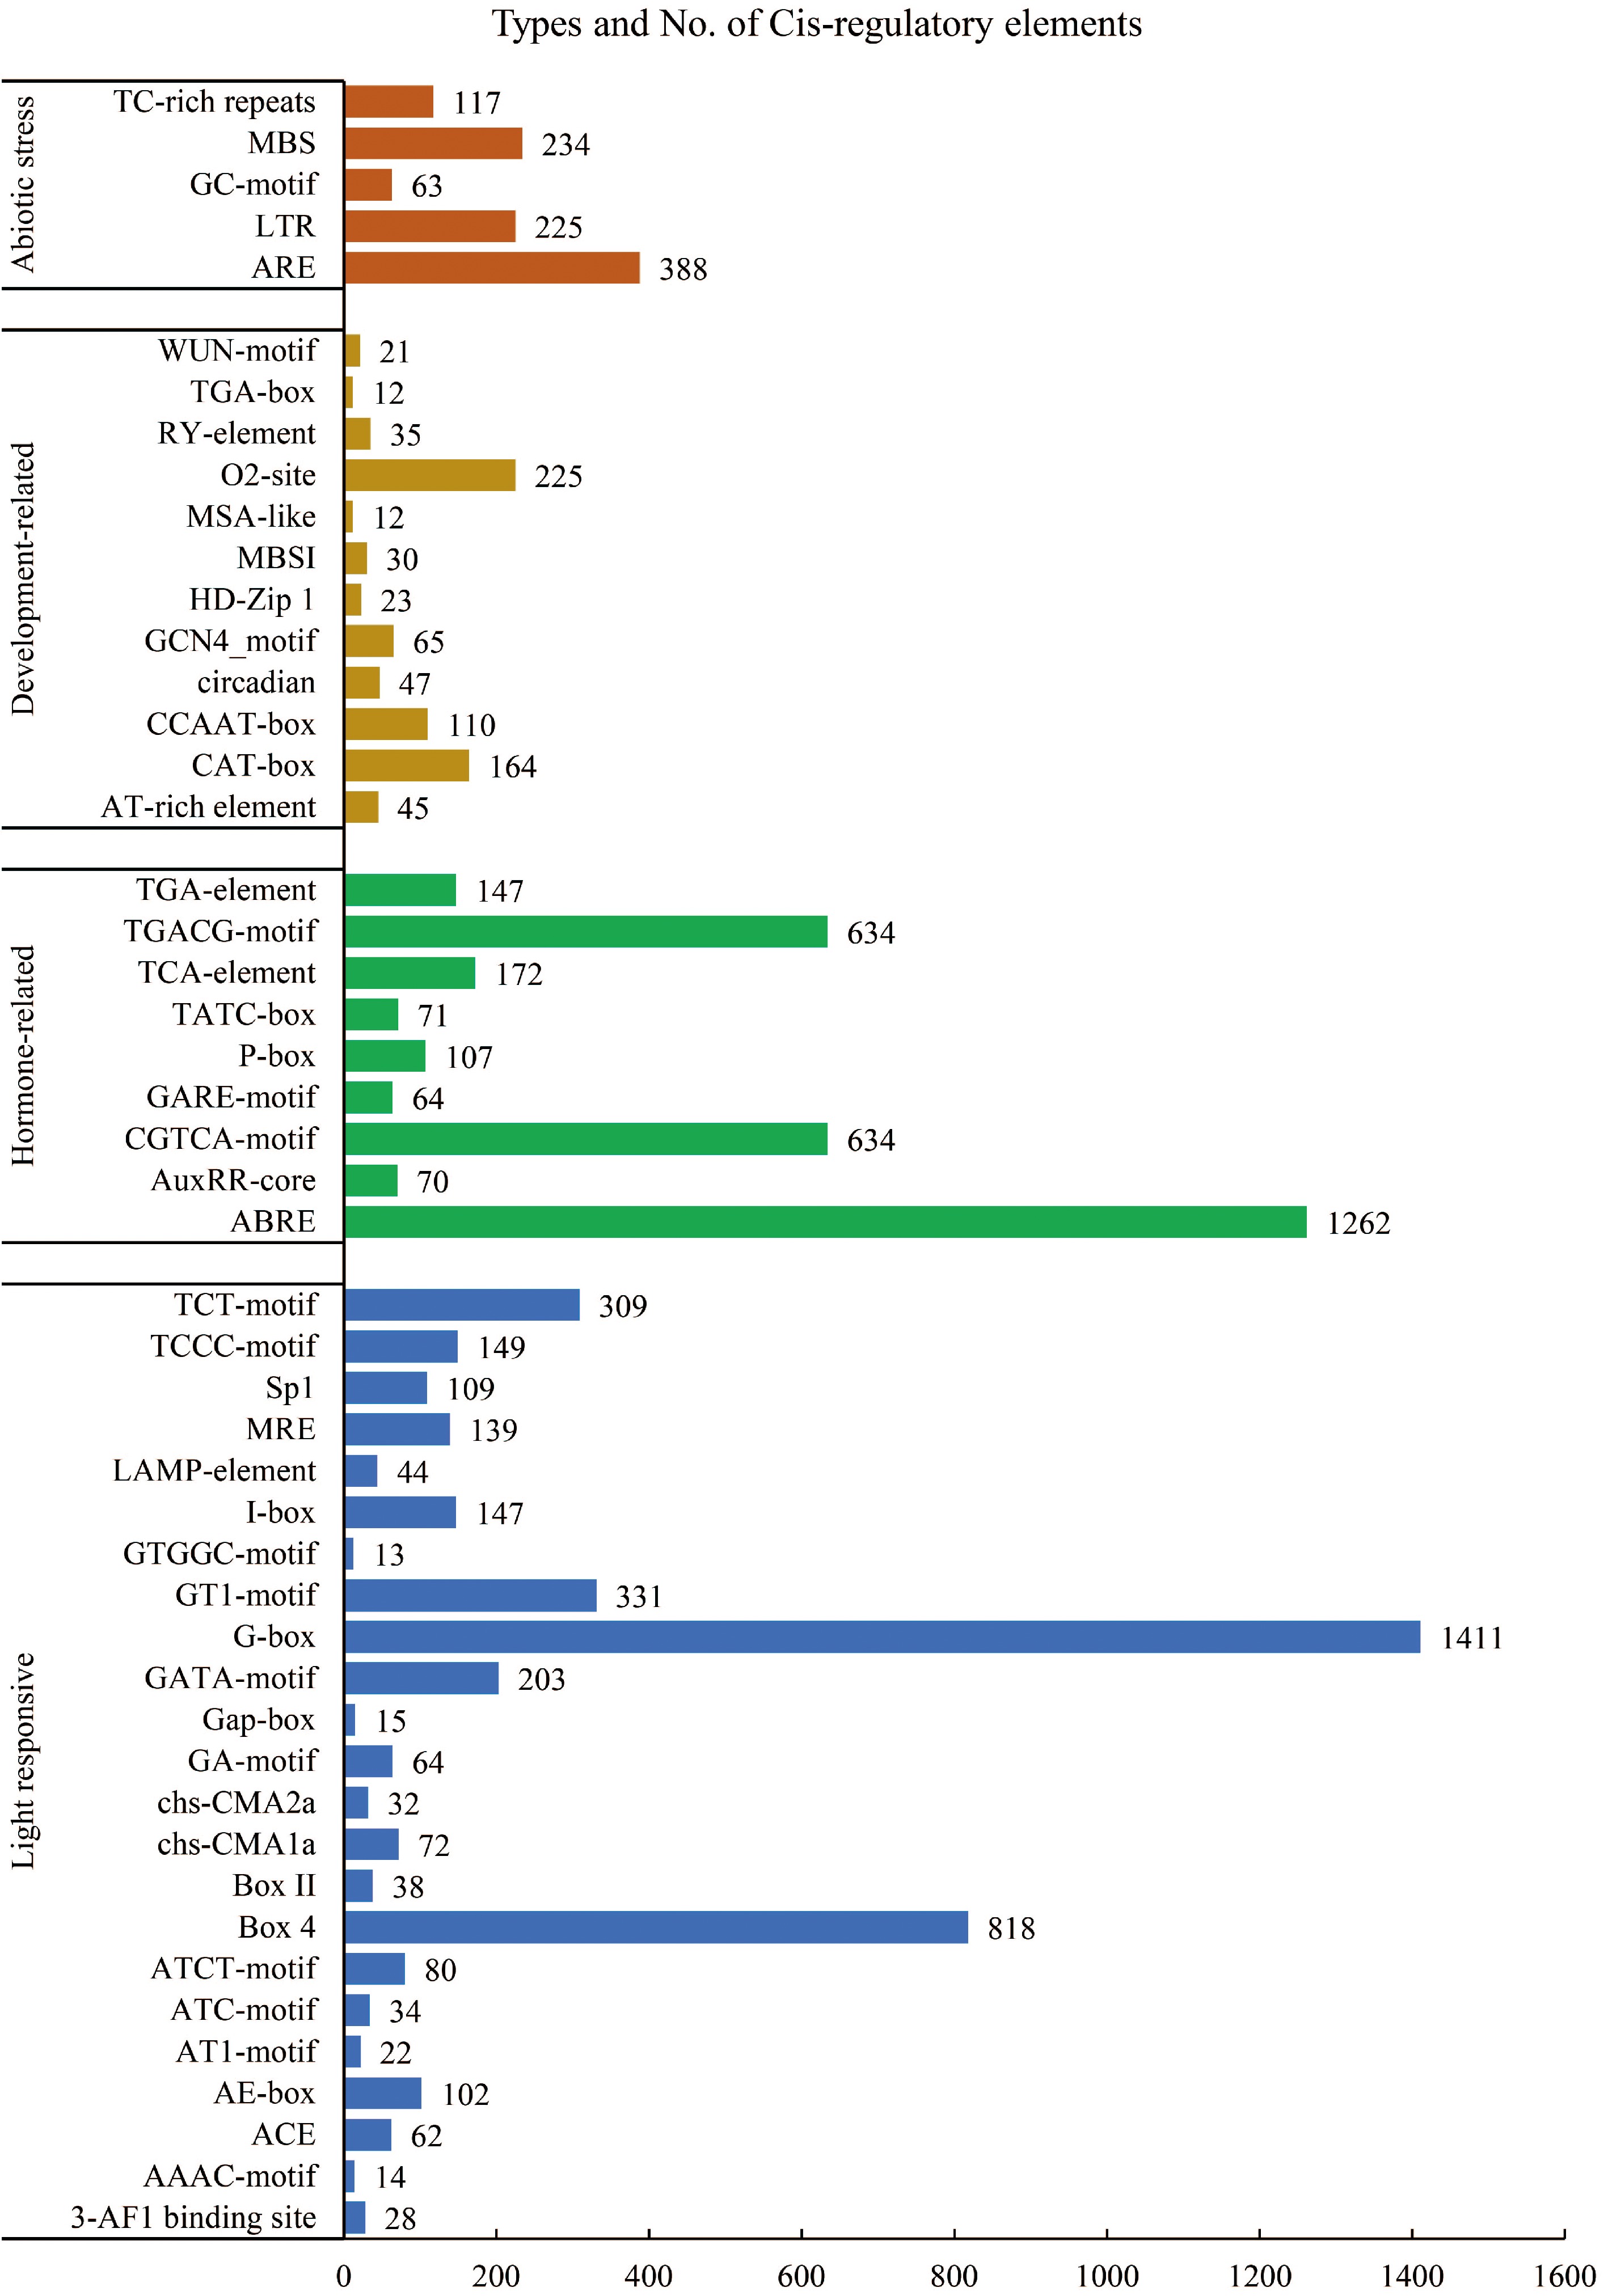
Figure 3.
Cis-acting elements identified in the promoter of the LiCYP450.
-
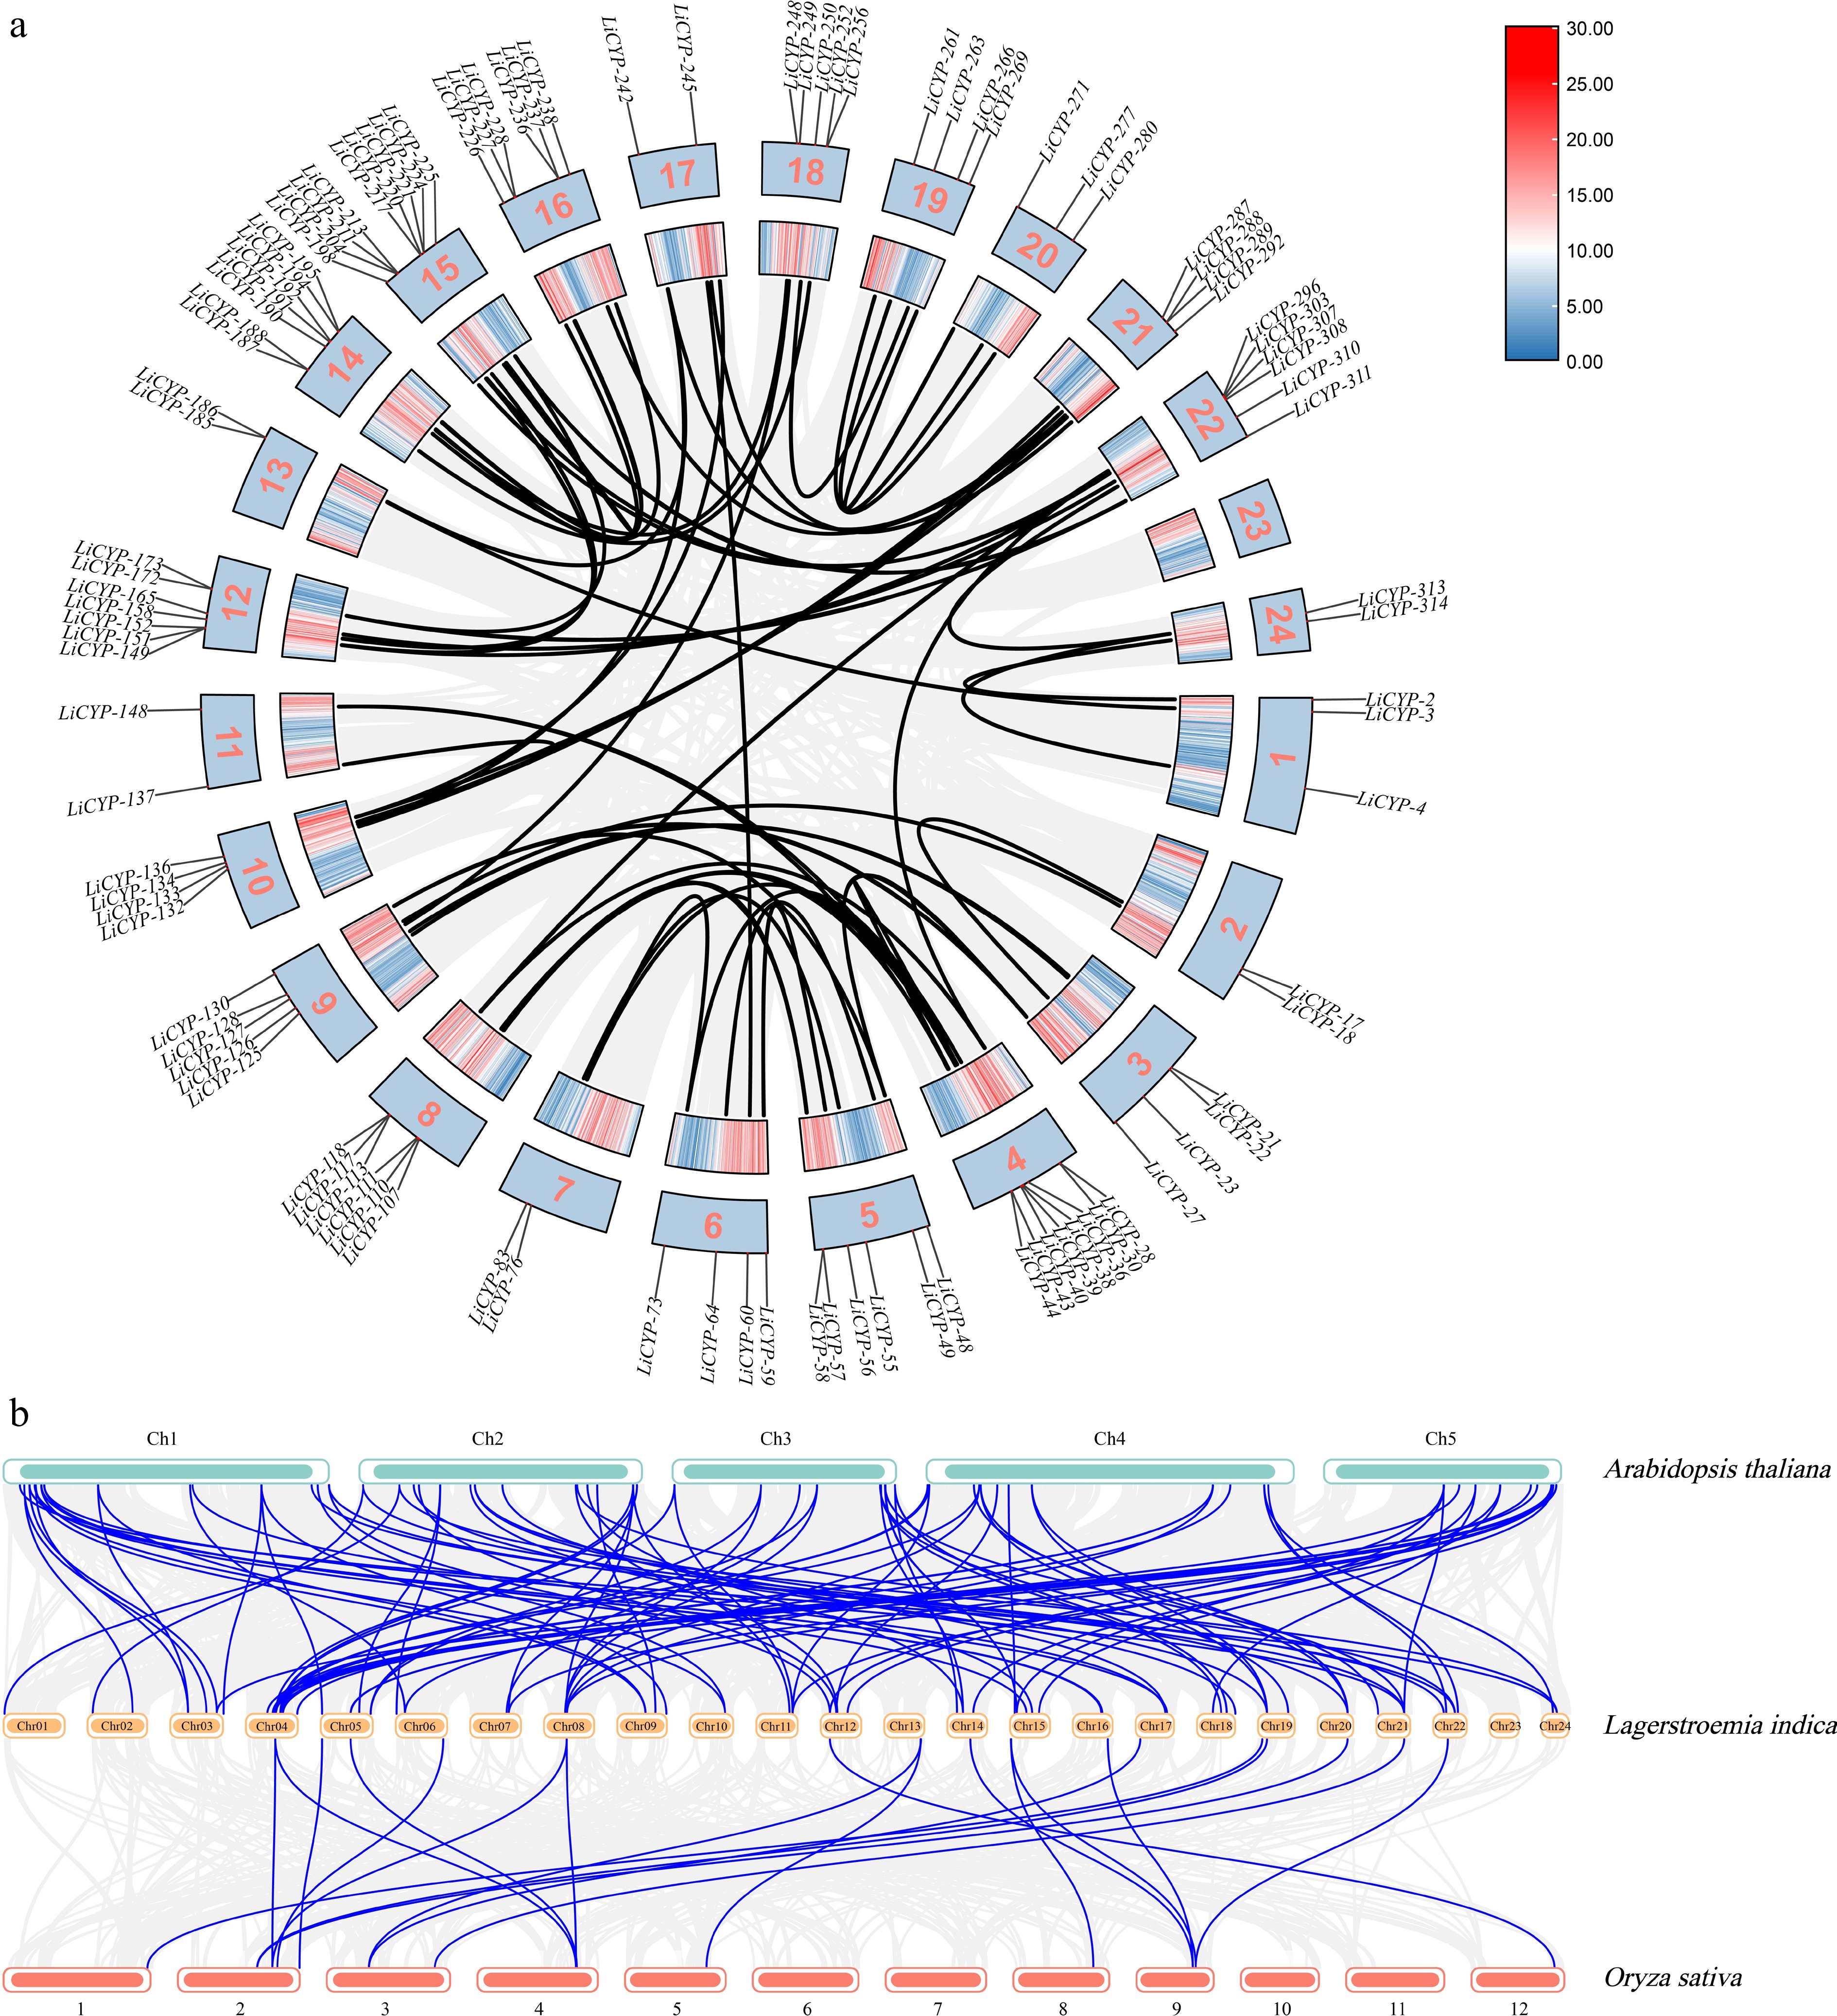
Figure 4.
(a) Segmental duplications of LiCYP450. (b) Comparative physical mapping displaying the orthologous relationships of CYP450 genes among L. indica, A. thaliana, and O. sativa.
-
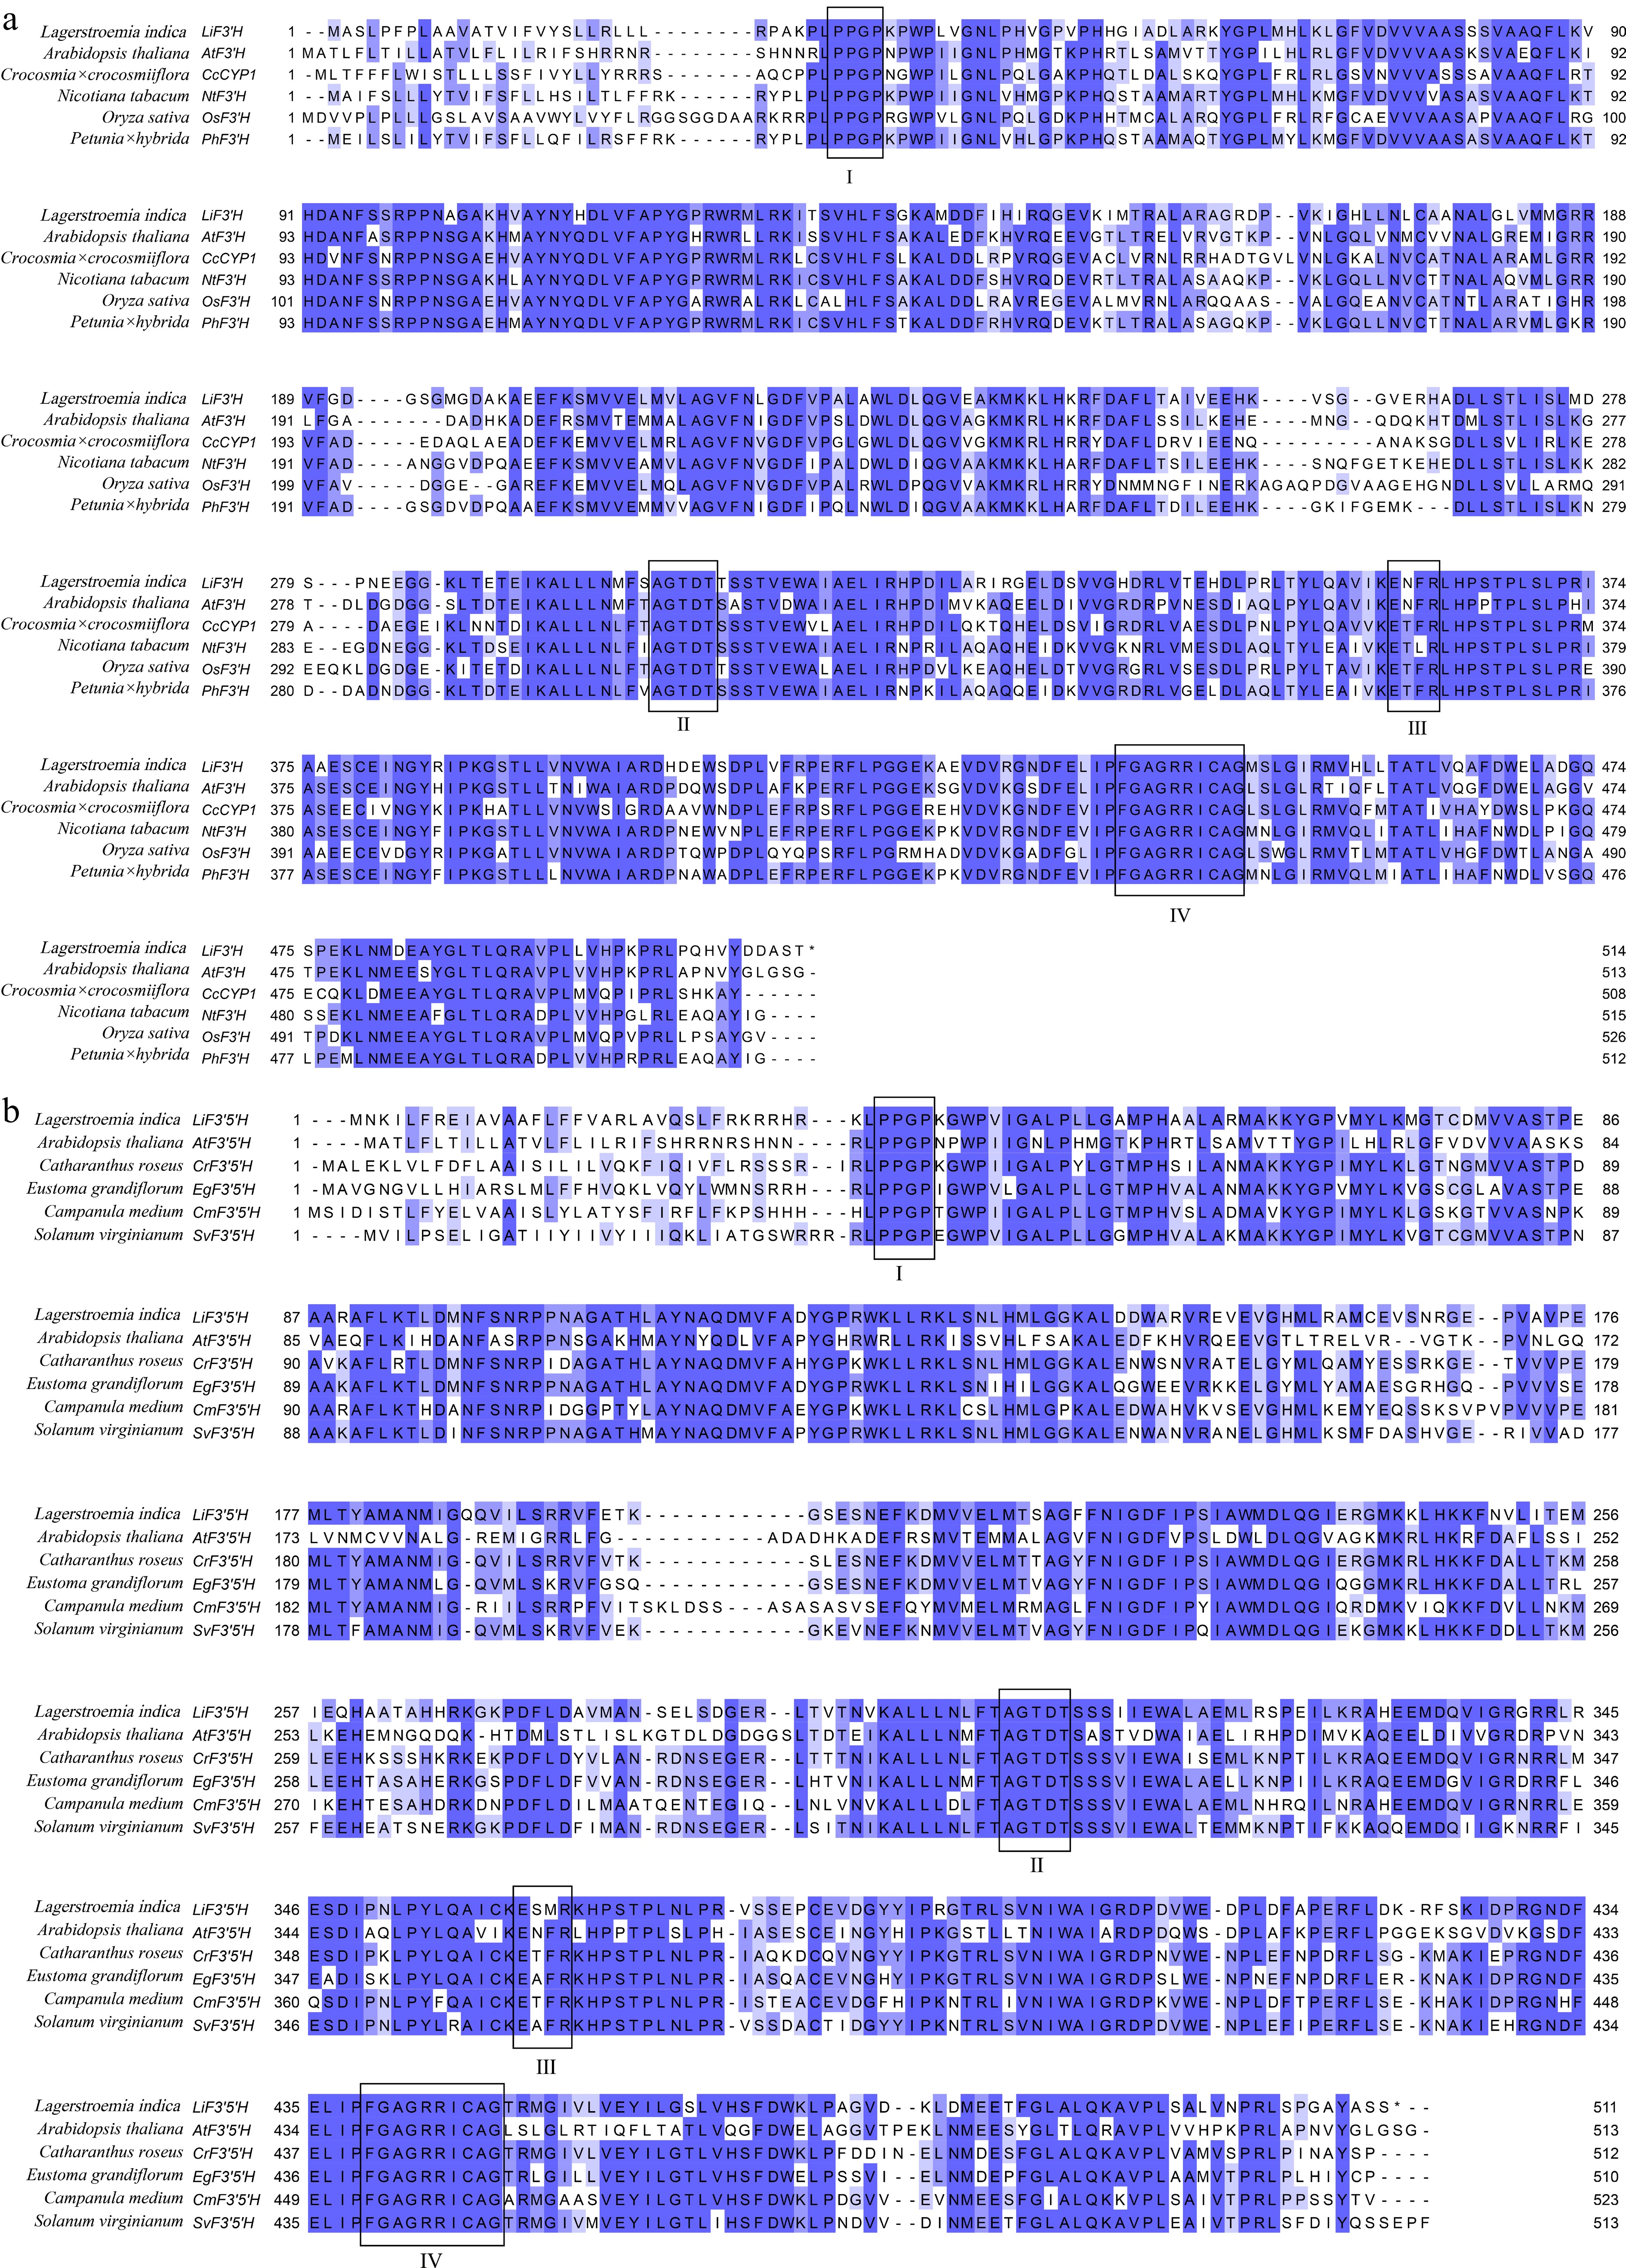
Figure 5.
(a) Multiple sequence alignment of F3'Hs from various plant species. (b) Multiple sequence alignment of F3'5Hs from various plant species. Boxed in red are the motifs characteristic of P450, encompassing the hinge region (I), the oxygen-binding pocket (II), the E - X - X - R motif (III), and the heme-binding domain (IV). F3'Hs and F3'5'Hs proteins originating from different species include AtF3'H (Arabidopsis thaliana), CcCYP1 (Crocosmia × crocosmiiflora), NtF3'H (Nicotiana tabacum), OsF3'H (Oryza sativa), PhF3'H (Petunia × hybrida), AtF3'5'H (Arabidopsis thaliana), CrF3'5'H (Catharanthus roseus), EgF3'5'H (Eustoma grandiflorum), CmF3'5'H (Campanula medium), SvF3'5'H (Solanum virginianum).
-
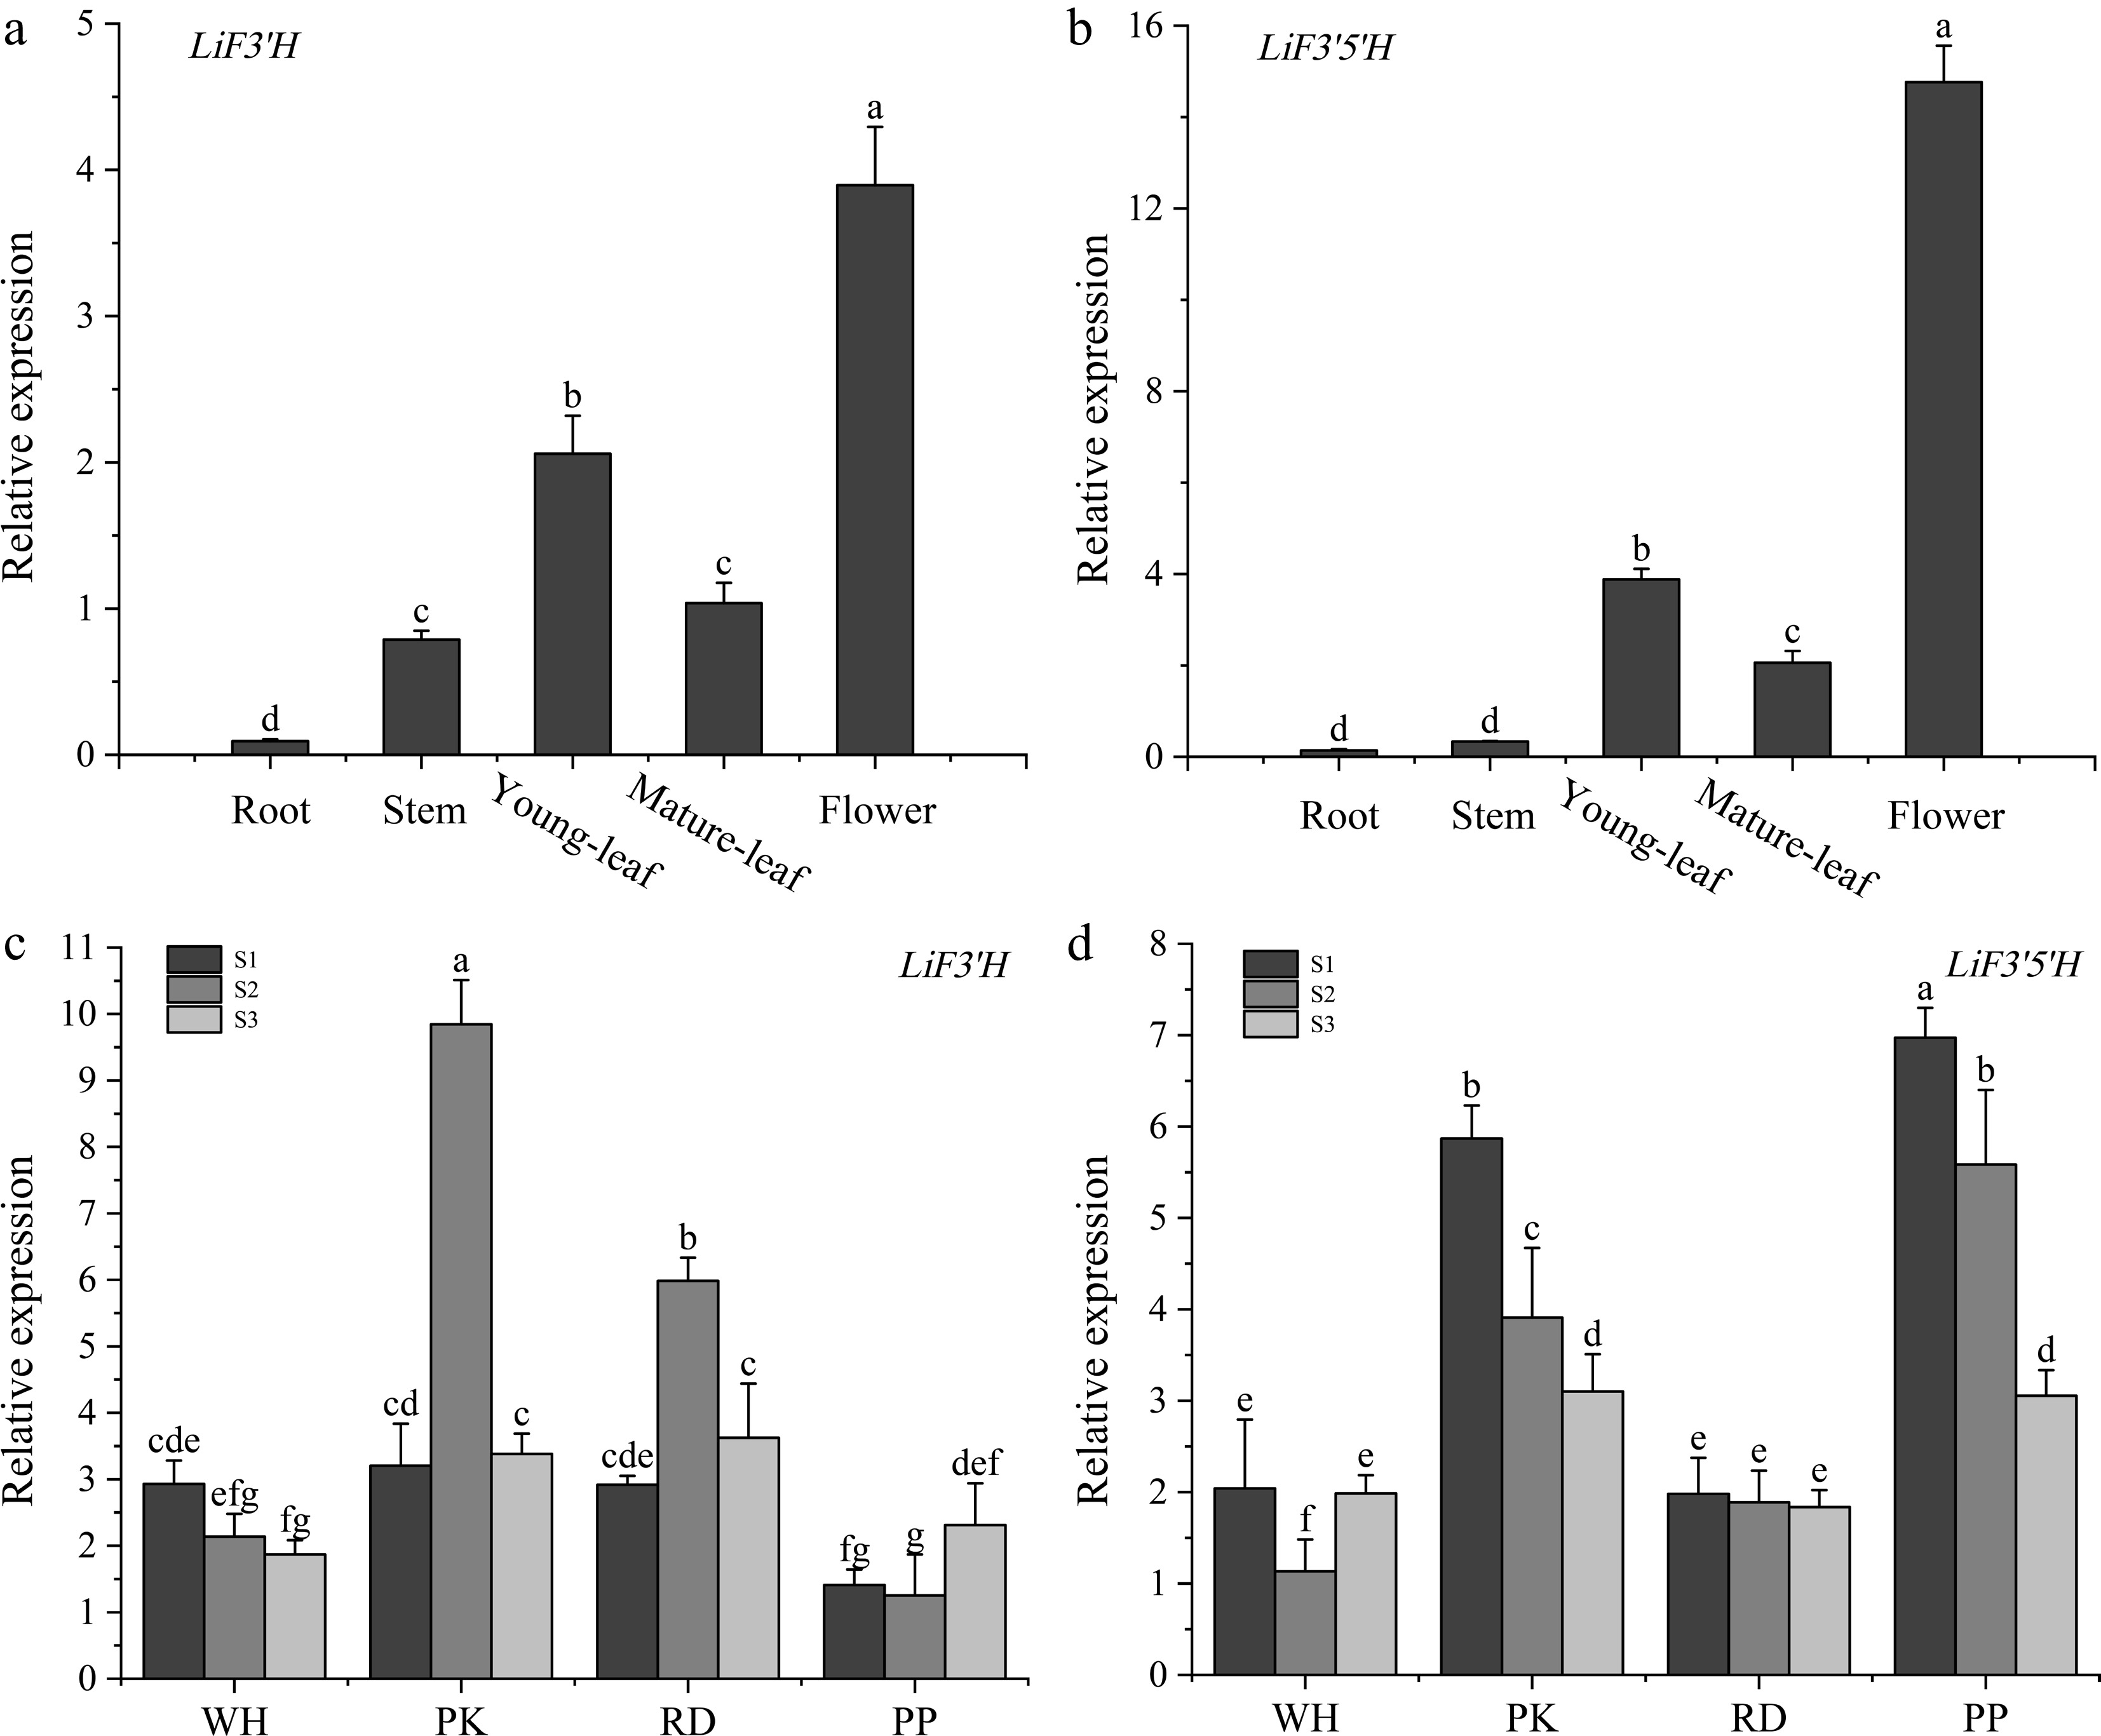
Figure 6.
(a) The expression level of LiF3'H in different tissues. (b) The expression level of LiF3'5'H in different tissues. (c) The expression level of LiF3'H in different flowering stages. (d) The expression level of LiF3'H in different flowering stages. Values represent the mean ± standard error (N = 3). Different letters denote significant differences in values were conducted by the one-way ANOVA Duncan test supplement (p < 0.05).
-
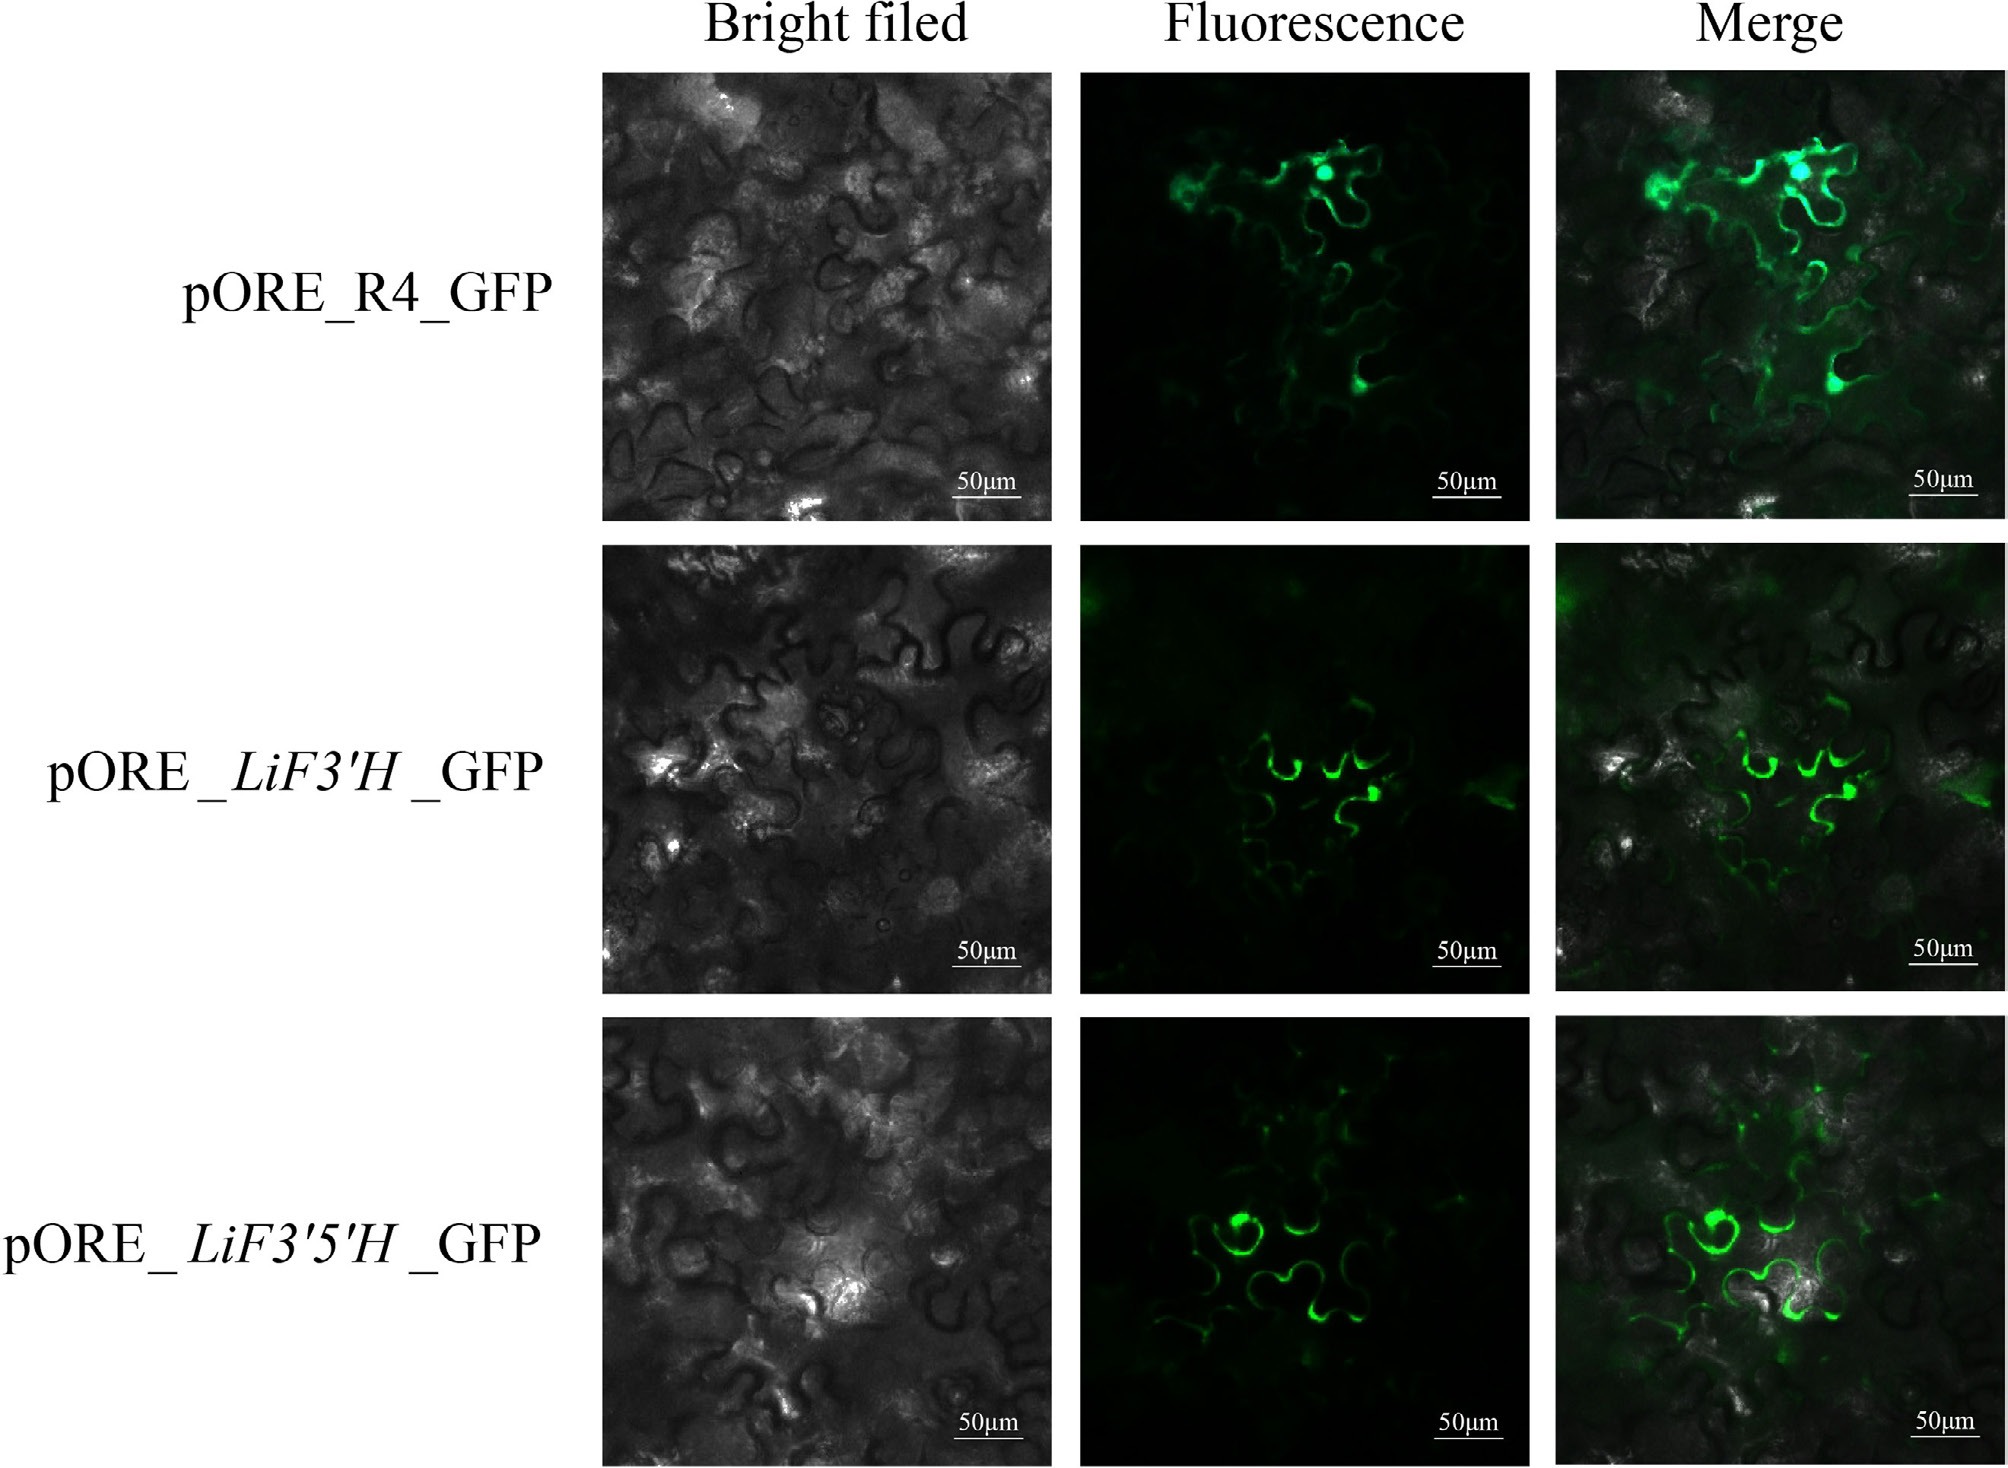
Figure 7.
The subcellular localization of LiF3'H and LiF3'5'H.
-
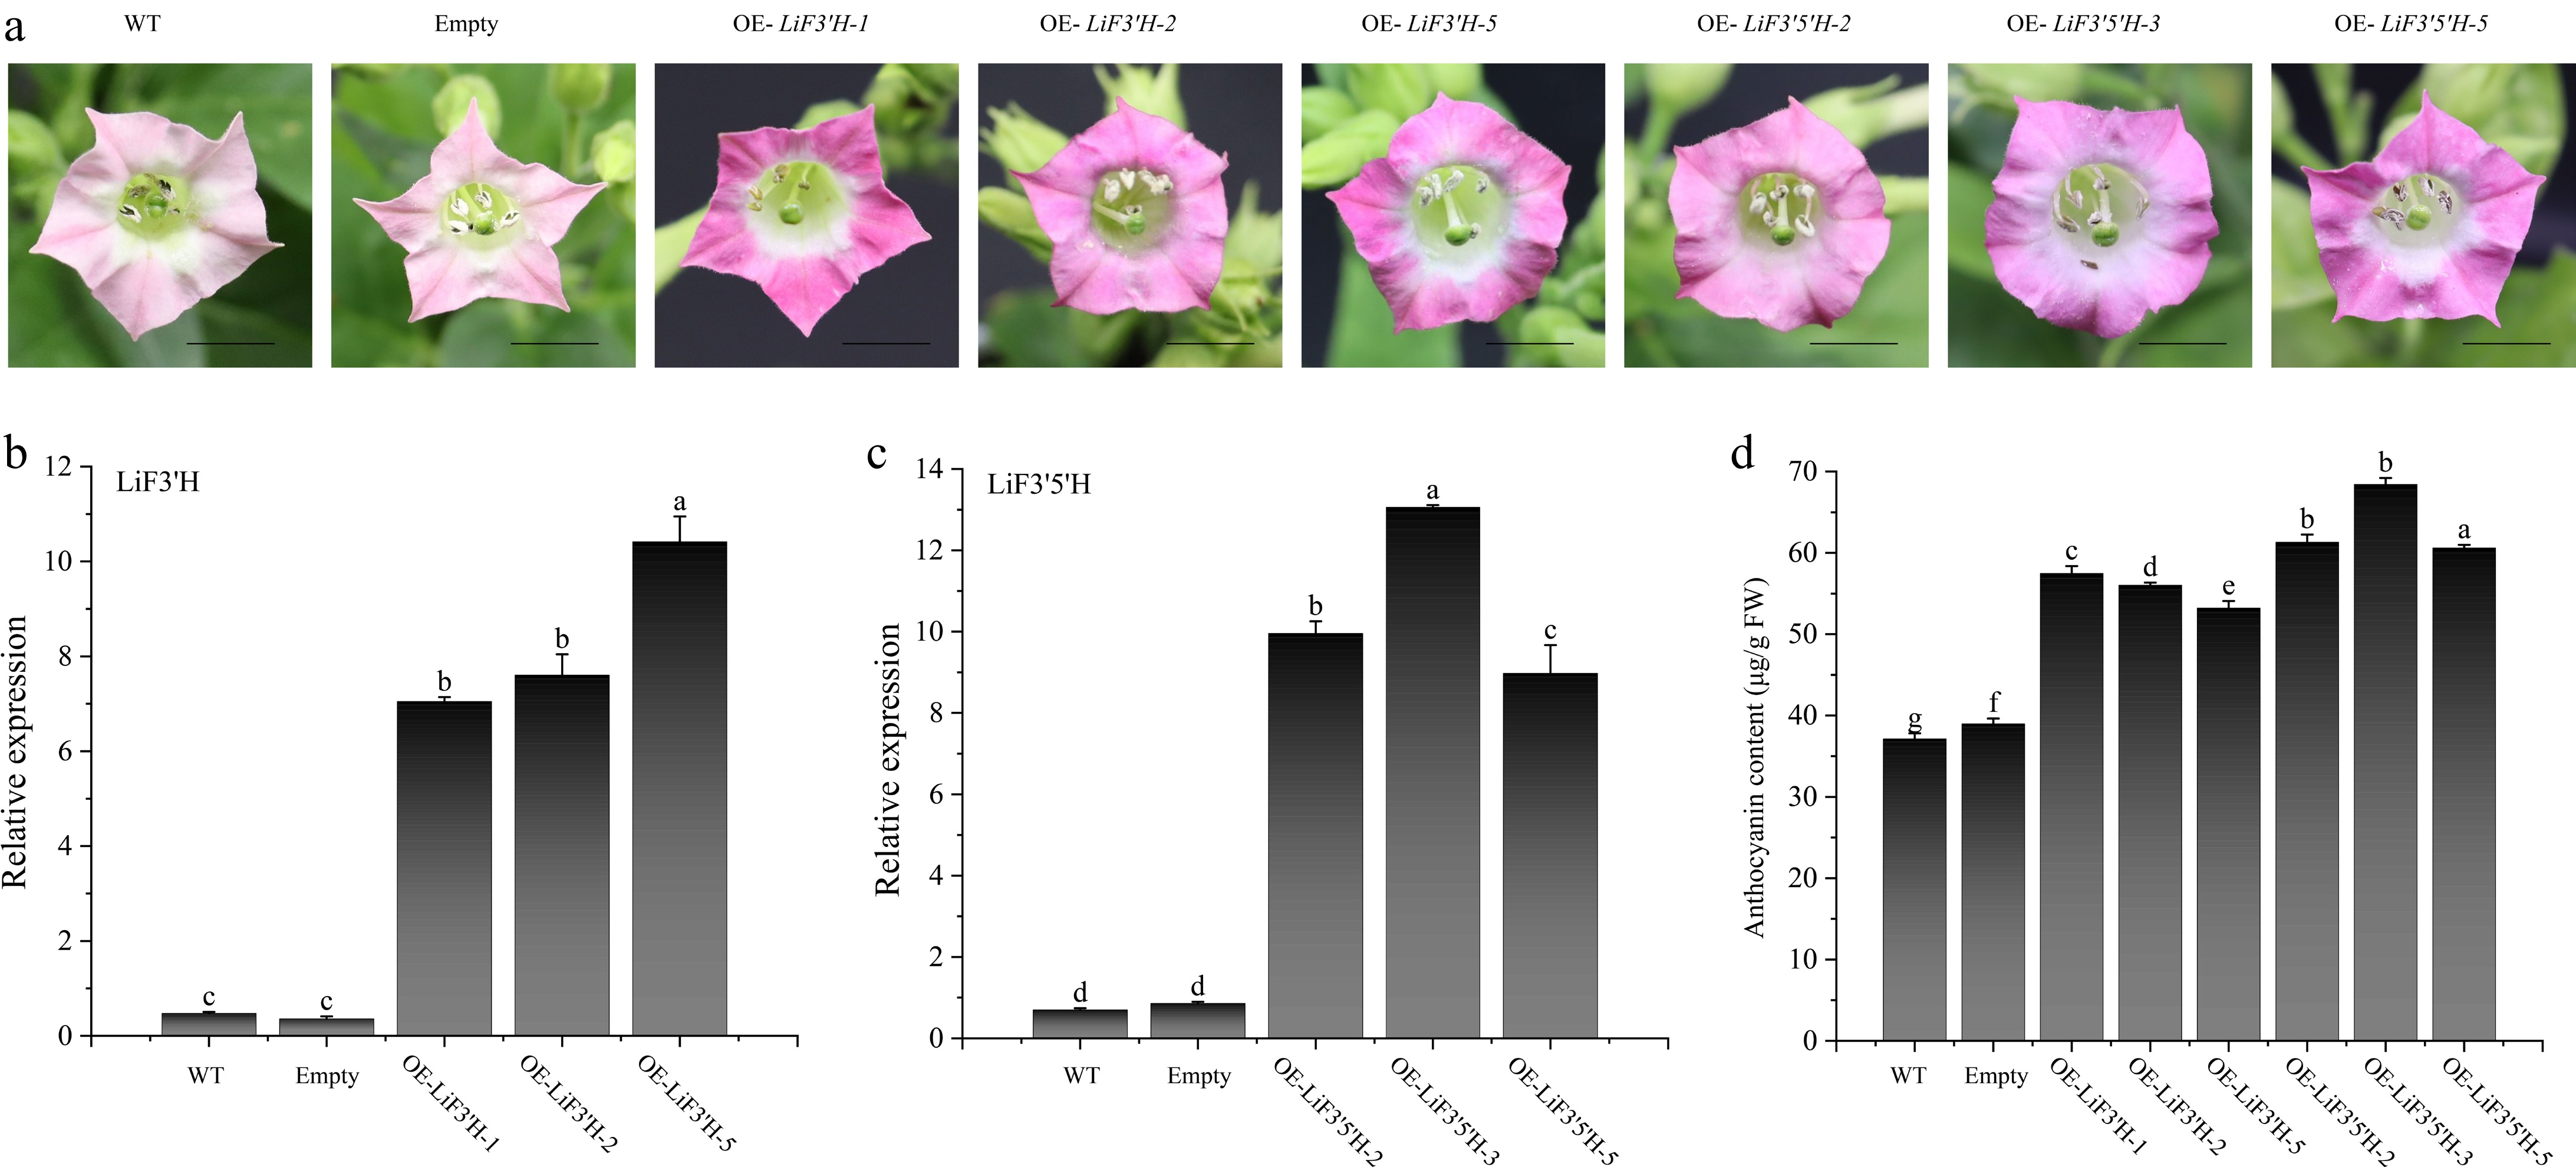
Figure 8.
(a) The phenotype of LiF3'H and LiF3'5'H transgenic tobacco. (b) The expression level of LiF3'H in WT, empty, and transgenic lines. (c) The expression level of LiF3'5'H in WT, empty, and transgenic lines. (d) The content of anthocyanin. The black line on the petal diagram showed a scale of 1 cm. The values represent the mean ± standard error (N = 3). When significant differences were present in the values, the one-way ANOVA Duncan test supplement (p < 0.05) was employed to denote them, with different letters used for this purpose. 'Empty' here refers to the transgenic plant carrying an empty vector.
Figures
(8)
Tables
(0)