-
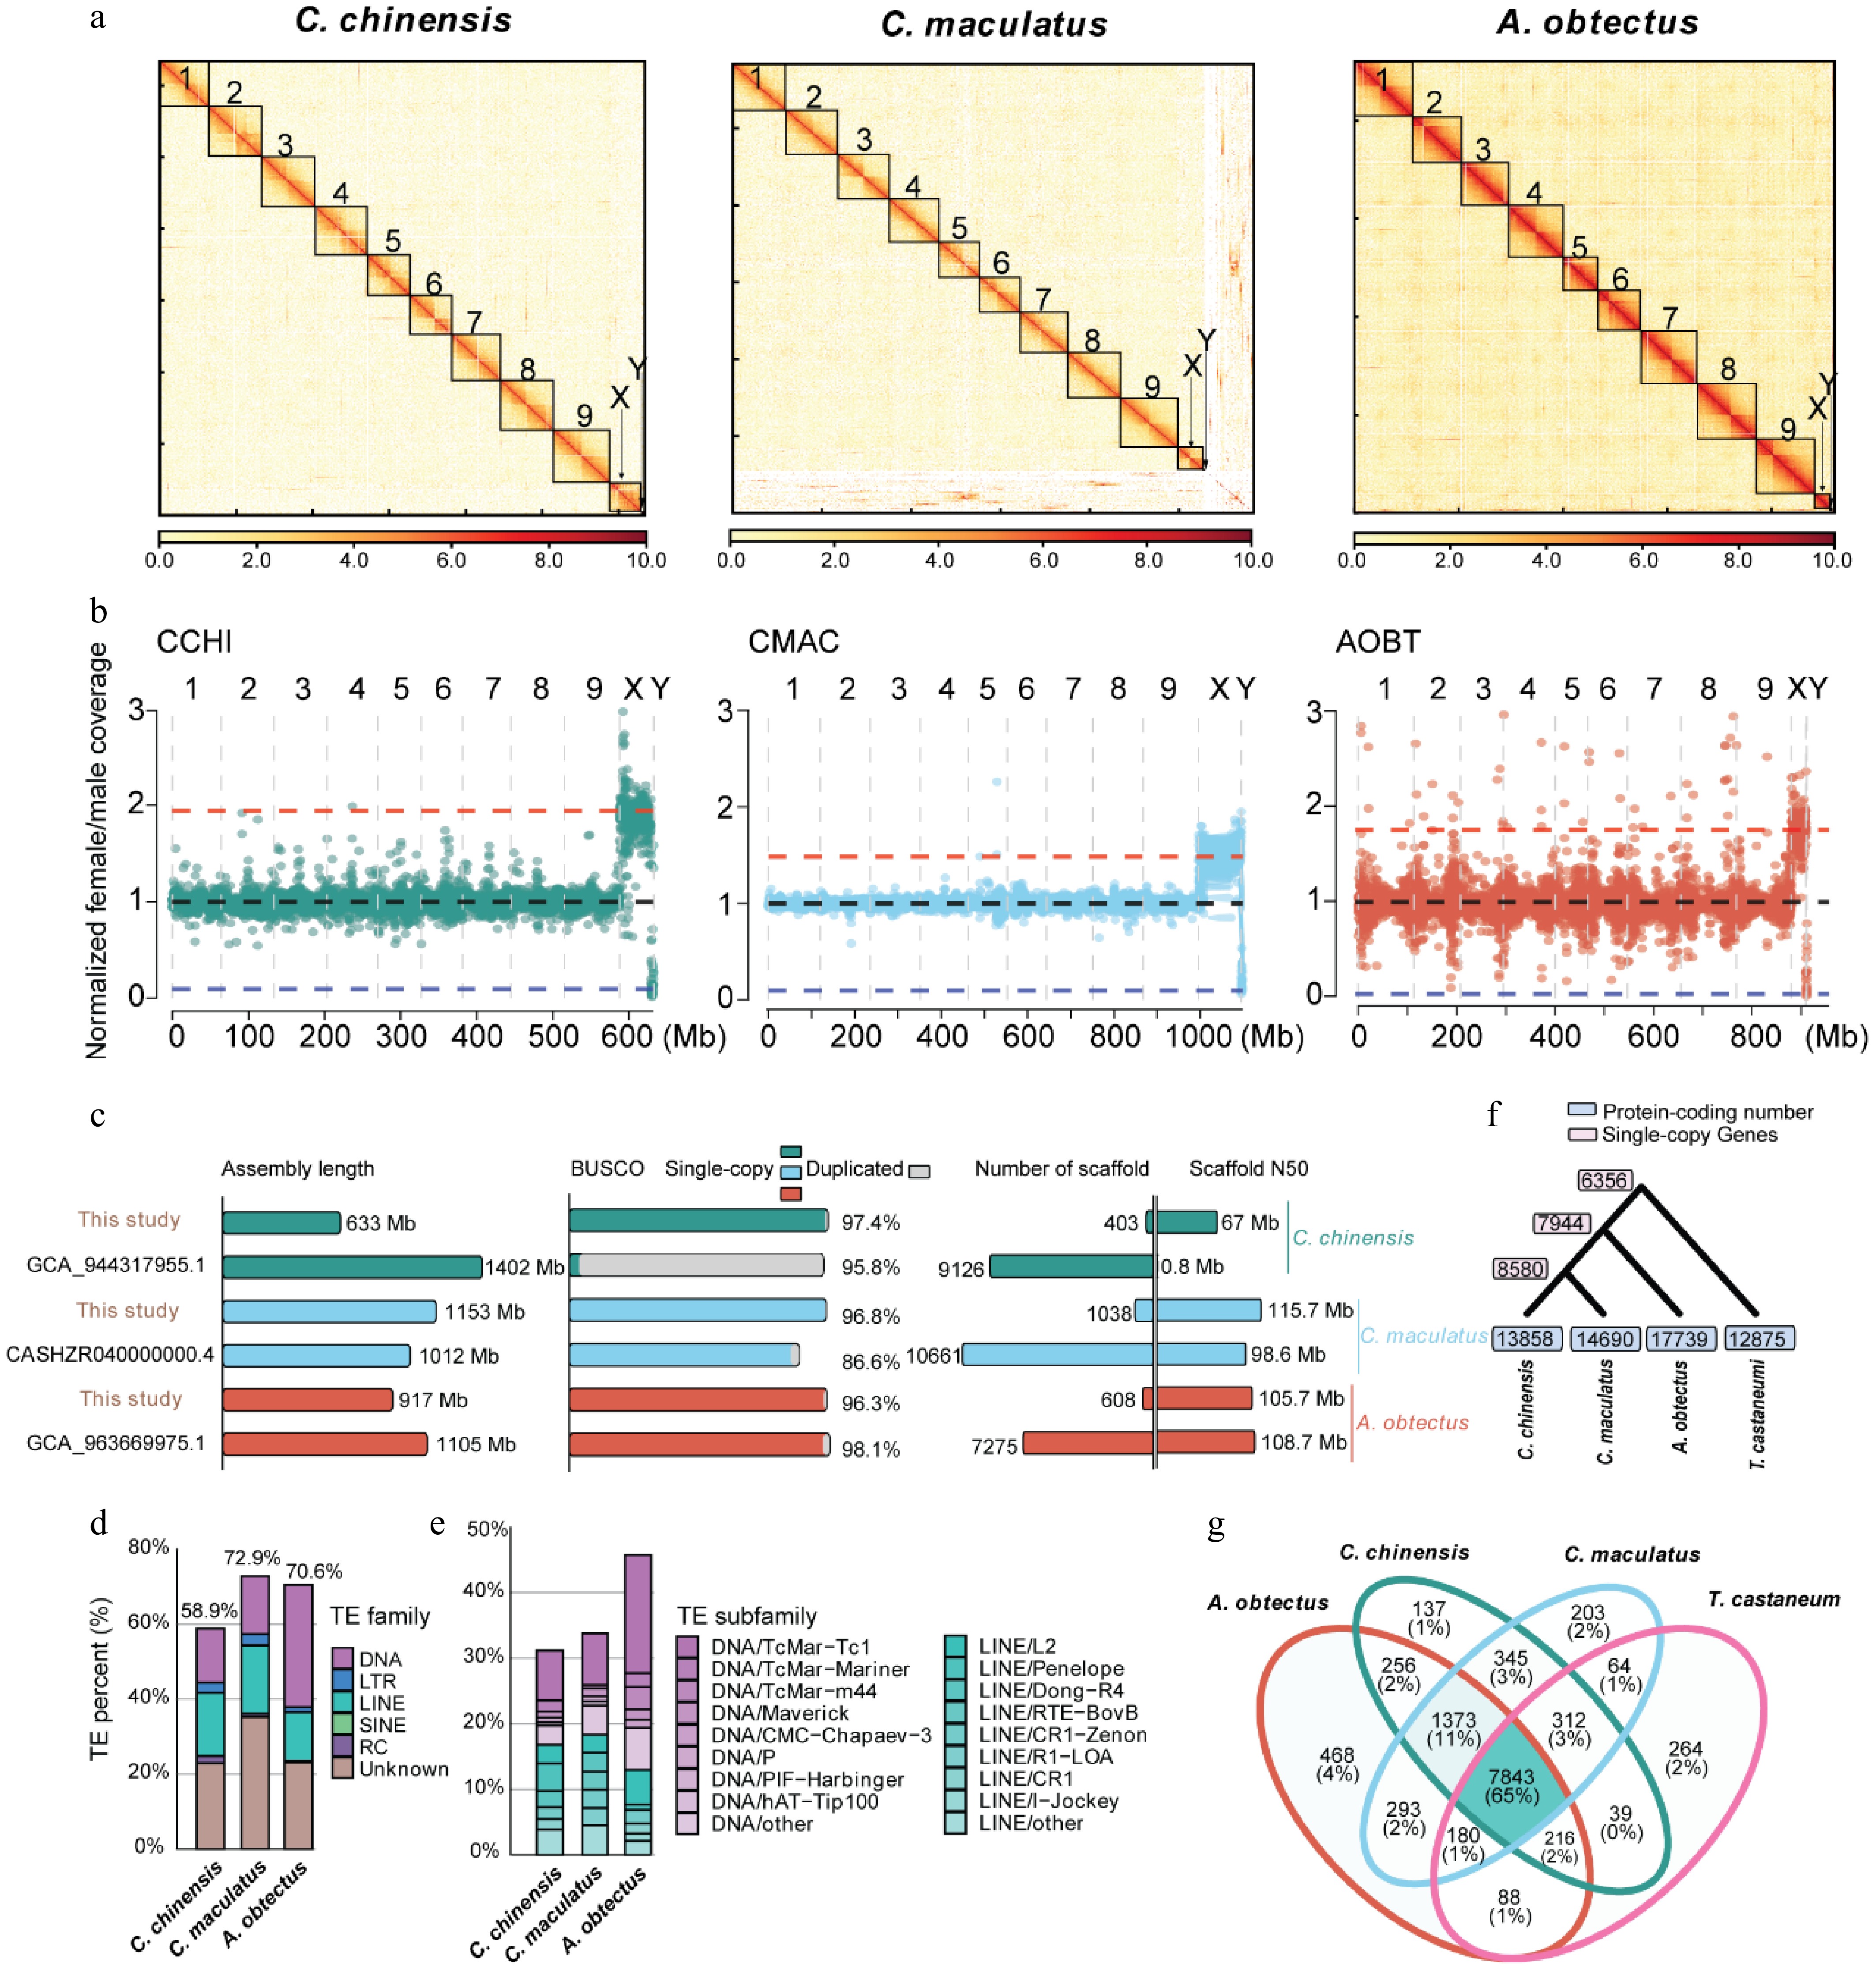
Figure 1.
Genome assembly and annotation of C. chinensis, C. maculatus, and A. obtectus. (a) Hi-C contact maps of the C. chinensis, C. maculatus, and A. obtectus genome assembly. Black boxes denote putative chromosomes. White indicates the weakest scaffold interaction, while red indicates the strongest interaction. (b) Normalized female/male whole-genome sequencing coverage over the three seed beetle species's genome assemblies. Each point represents a 100-kb window. Blue, black, and red horizontal lines indicate the expected coverage over Y-linked, autosomal, and X-linked scaffolds, respectively. (c) Comparison of genome assembly parameters with previously published genomes for the three seed beetle species. (d) Repeat landscape of the three seed beetle species' genomes. (e) Landscape of the subfamily of DNA transposons and long interspersed nuclear element (LINE) transposons of the three seed beetle species' genomes. (f) Phylogenetic trees and gene number of three seed beetle species and the model species T. castaneum. (g) Comparative analysis of orthologous families from the three seed beetle species and the model species T. castaneum.
-
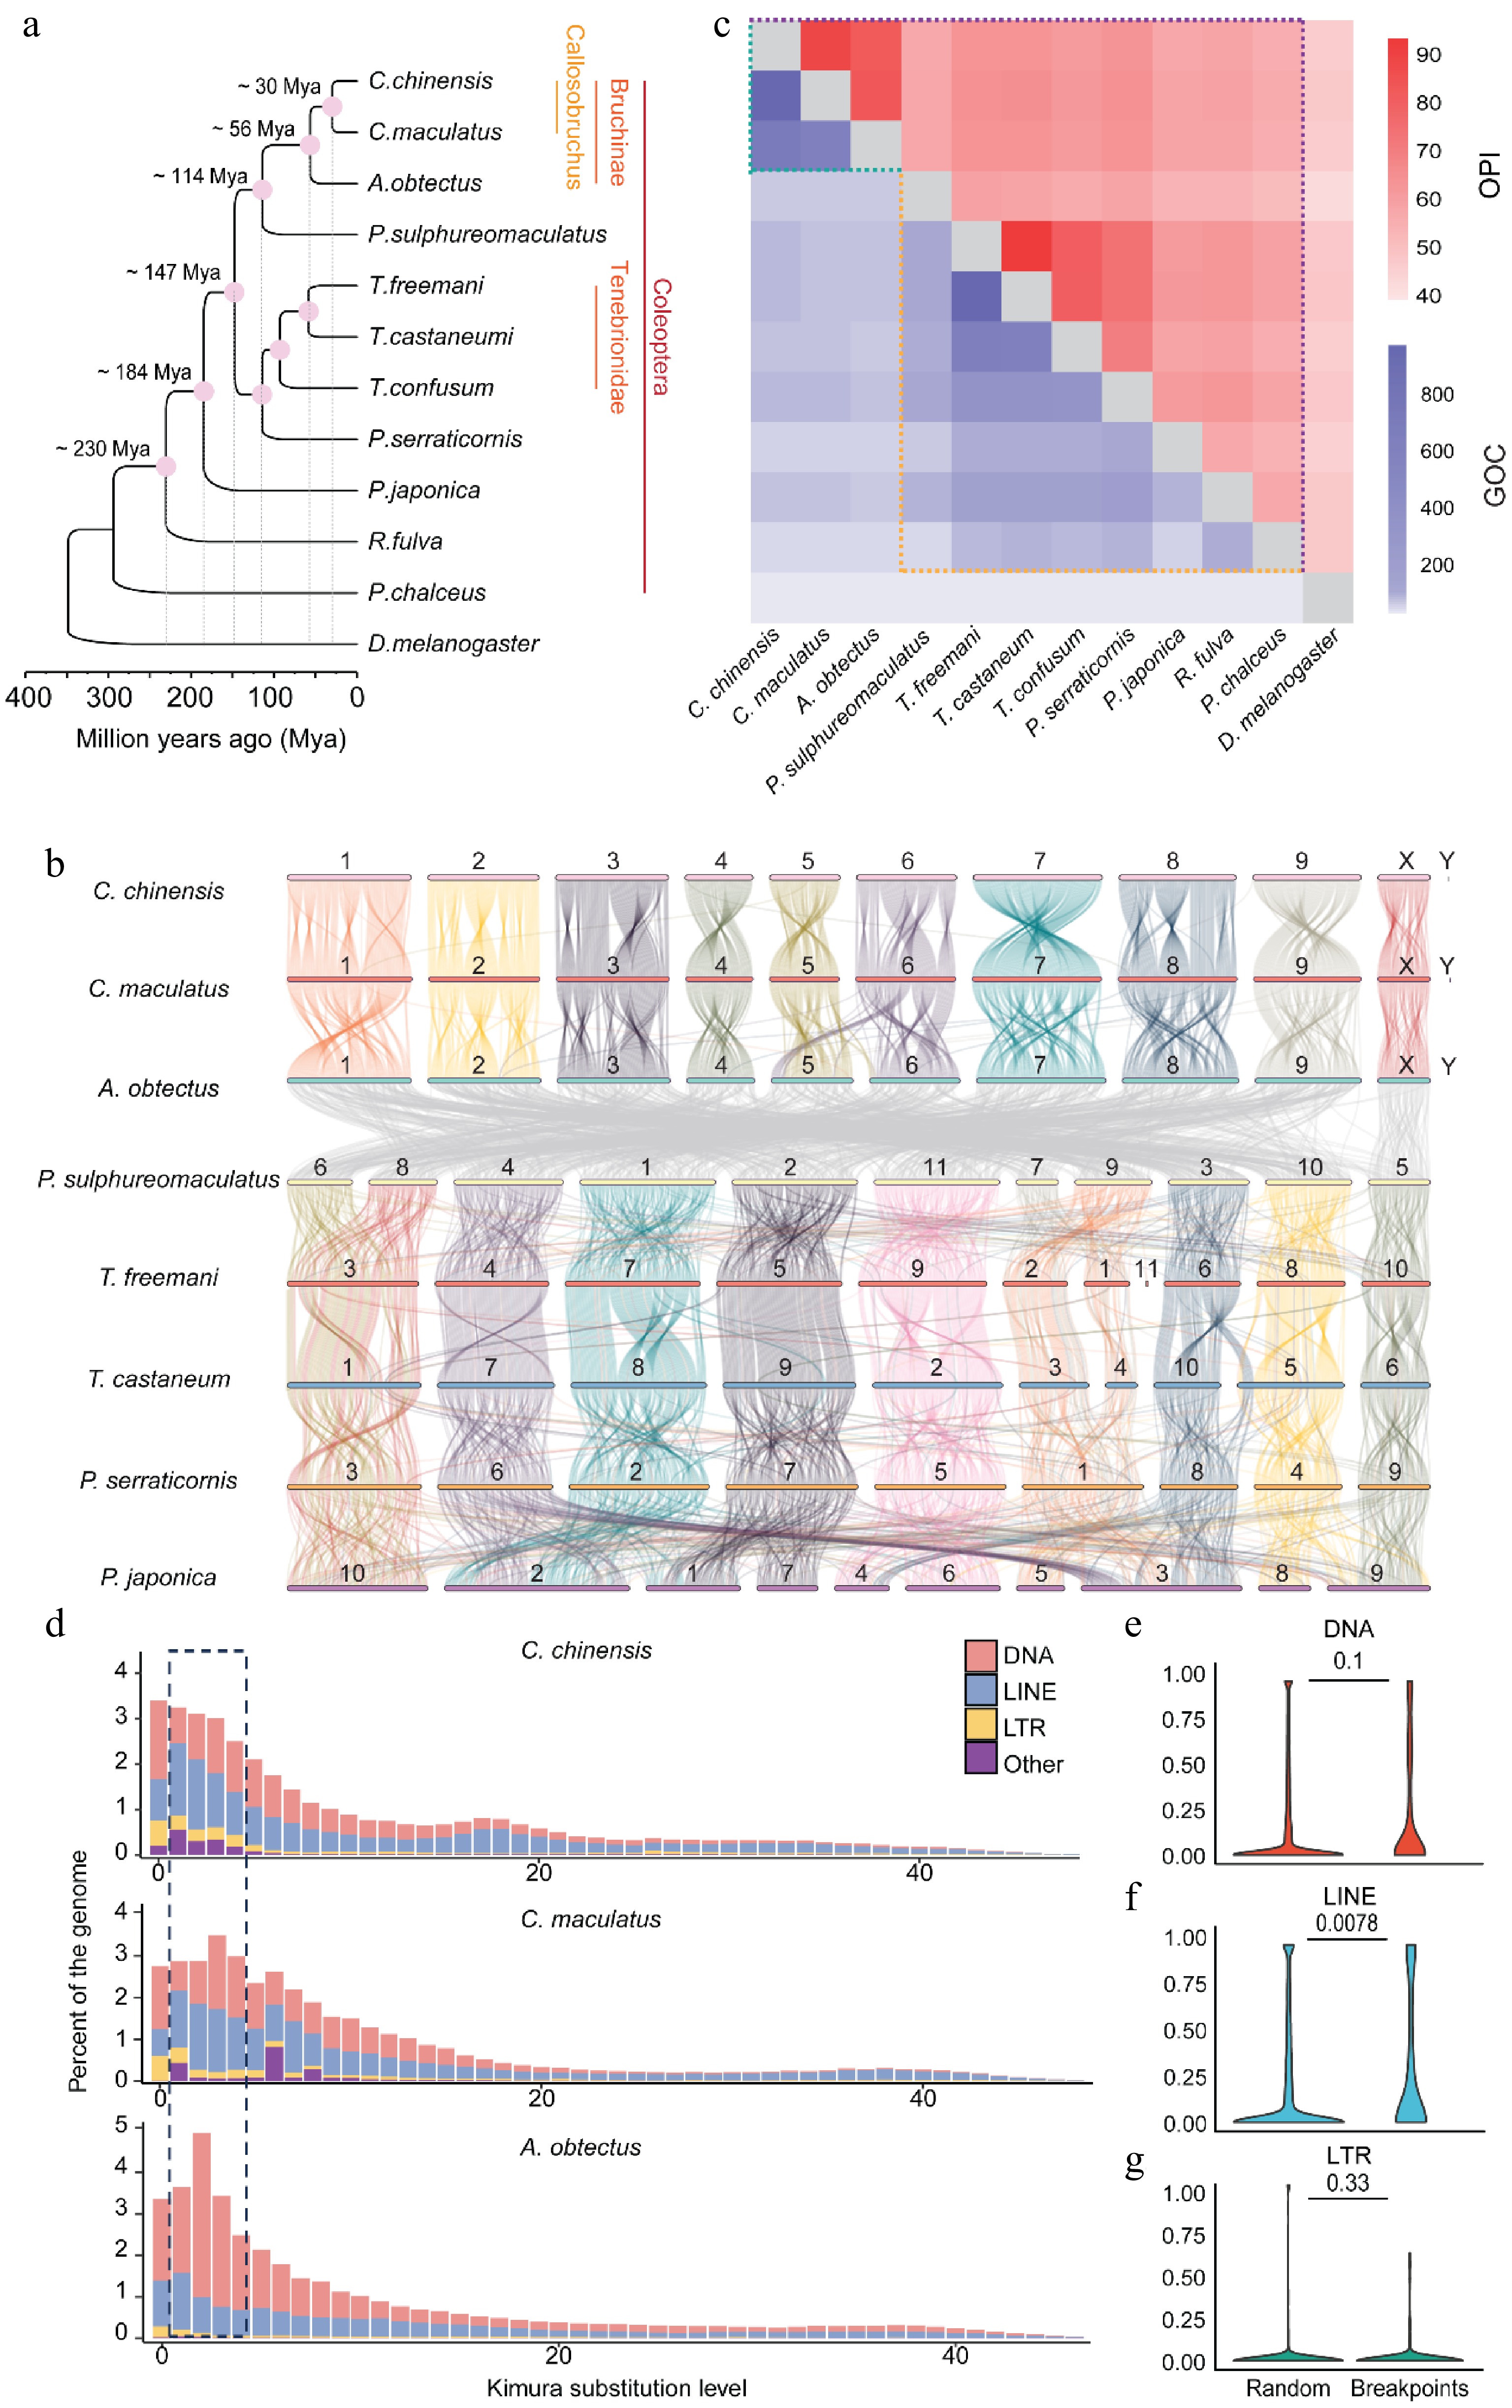
Figure 2.
Widespread genome rearrangements in Bruchinae. (a) The phylogenetic tree of different species in Coleoptera. A maximum likelihood tree of different Coleoptera species with D. melanogaster as the outgroup was established by iqtree. (b) Pairwise whole-genome alignments across eight Coleoptera genomes. Chromosome identifications (IDs) of each species are labeled on the chromosomes. The color of the collinear region in P. sulphureomaculatus, T. freeman, T. castaneum, P. serraticornis, and P. japonica is with reference to P. sulphureomaculatus. The color of the collinear region in C. chinensis, C. maculatus, and A. obtectus is with reference to C. chinensis. (c) A heat map matrix for orthologous proteins identity (OPI) and gene order conservation score (GOC) in Coleoptera and Bruchinae. The difference boundary between identity and GOC along evolutionary distance is highlighted with dashed lines. (d) Insertion history of TEs in seed beetles. Vertical bars show the frequency of TE insertions during the evolution of a species. Recent DNA and LINE TE amplifications are highlighted by dashed lines. (e–g) Contents of DNA, LINE, and LTR in chromosomal rearrangement (CR) regions and random regions. CR events are identified between our assembly and Lu et al.'s genome. The 1-kb regions flanking the CR events are compared with 10,000 random regions of the same length. The number on the horizontal line above each two boxes represents p-values (Wilcoxon's test).
-
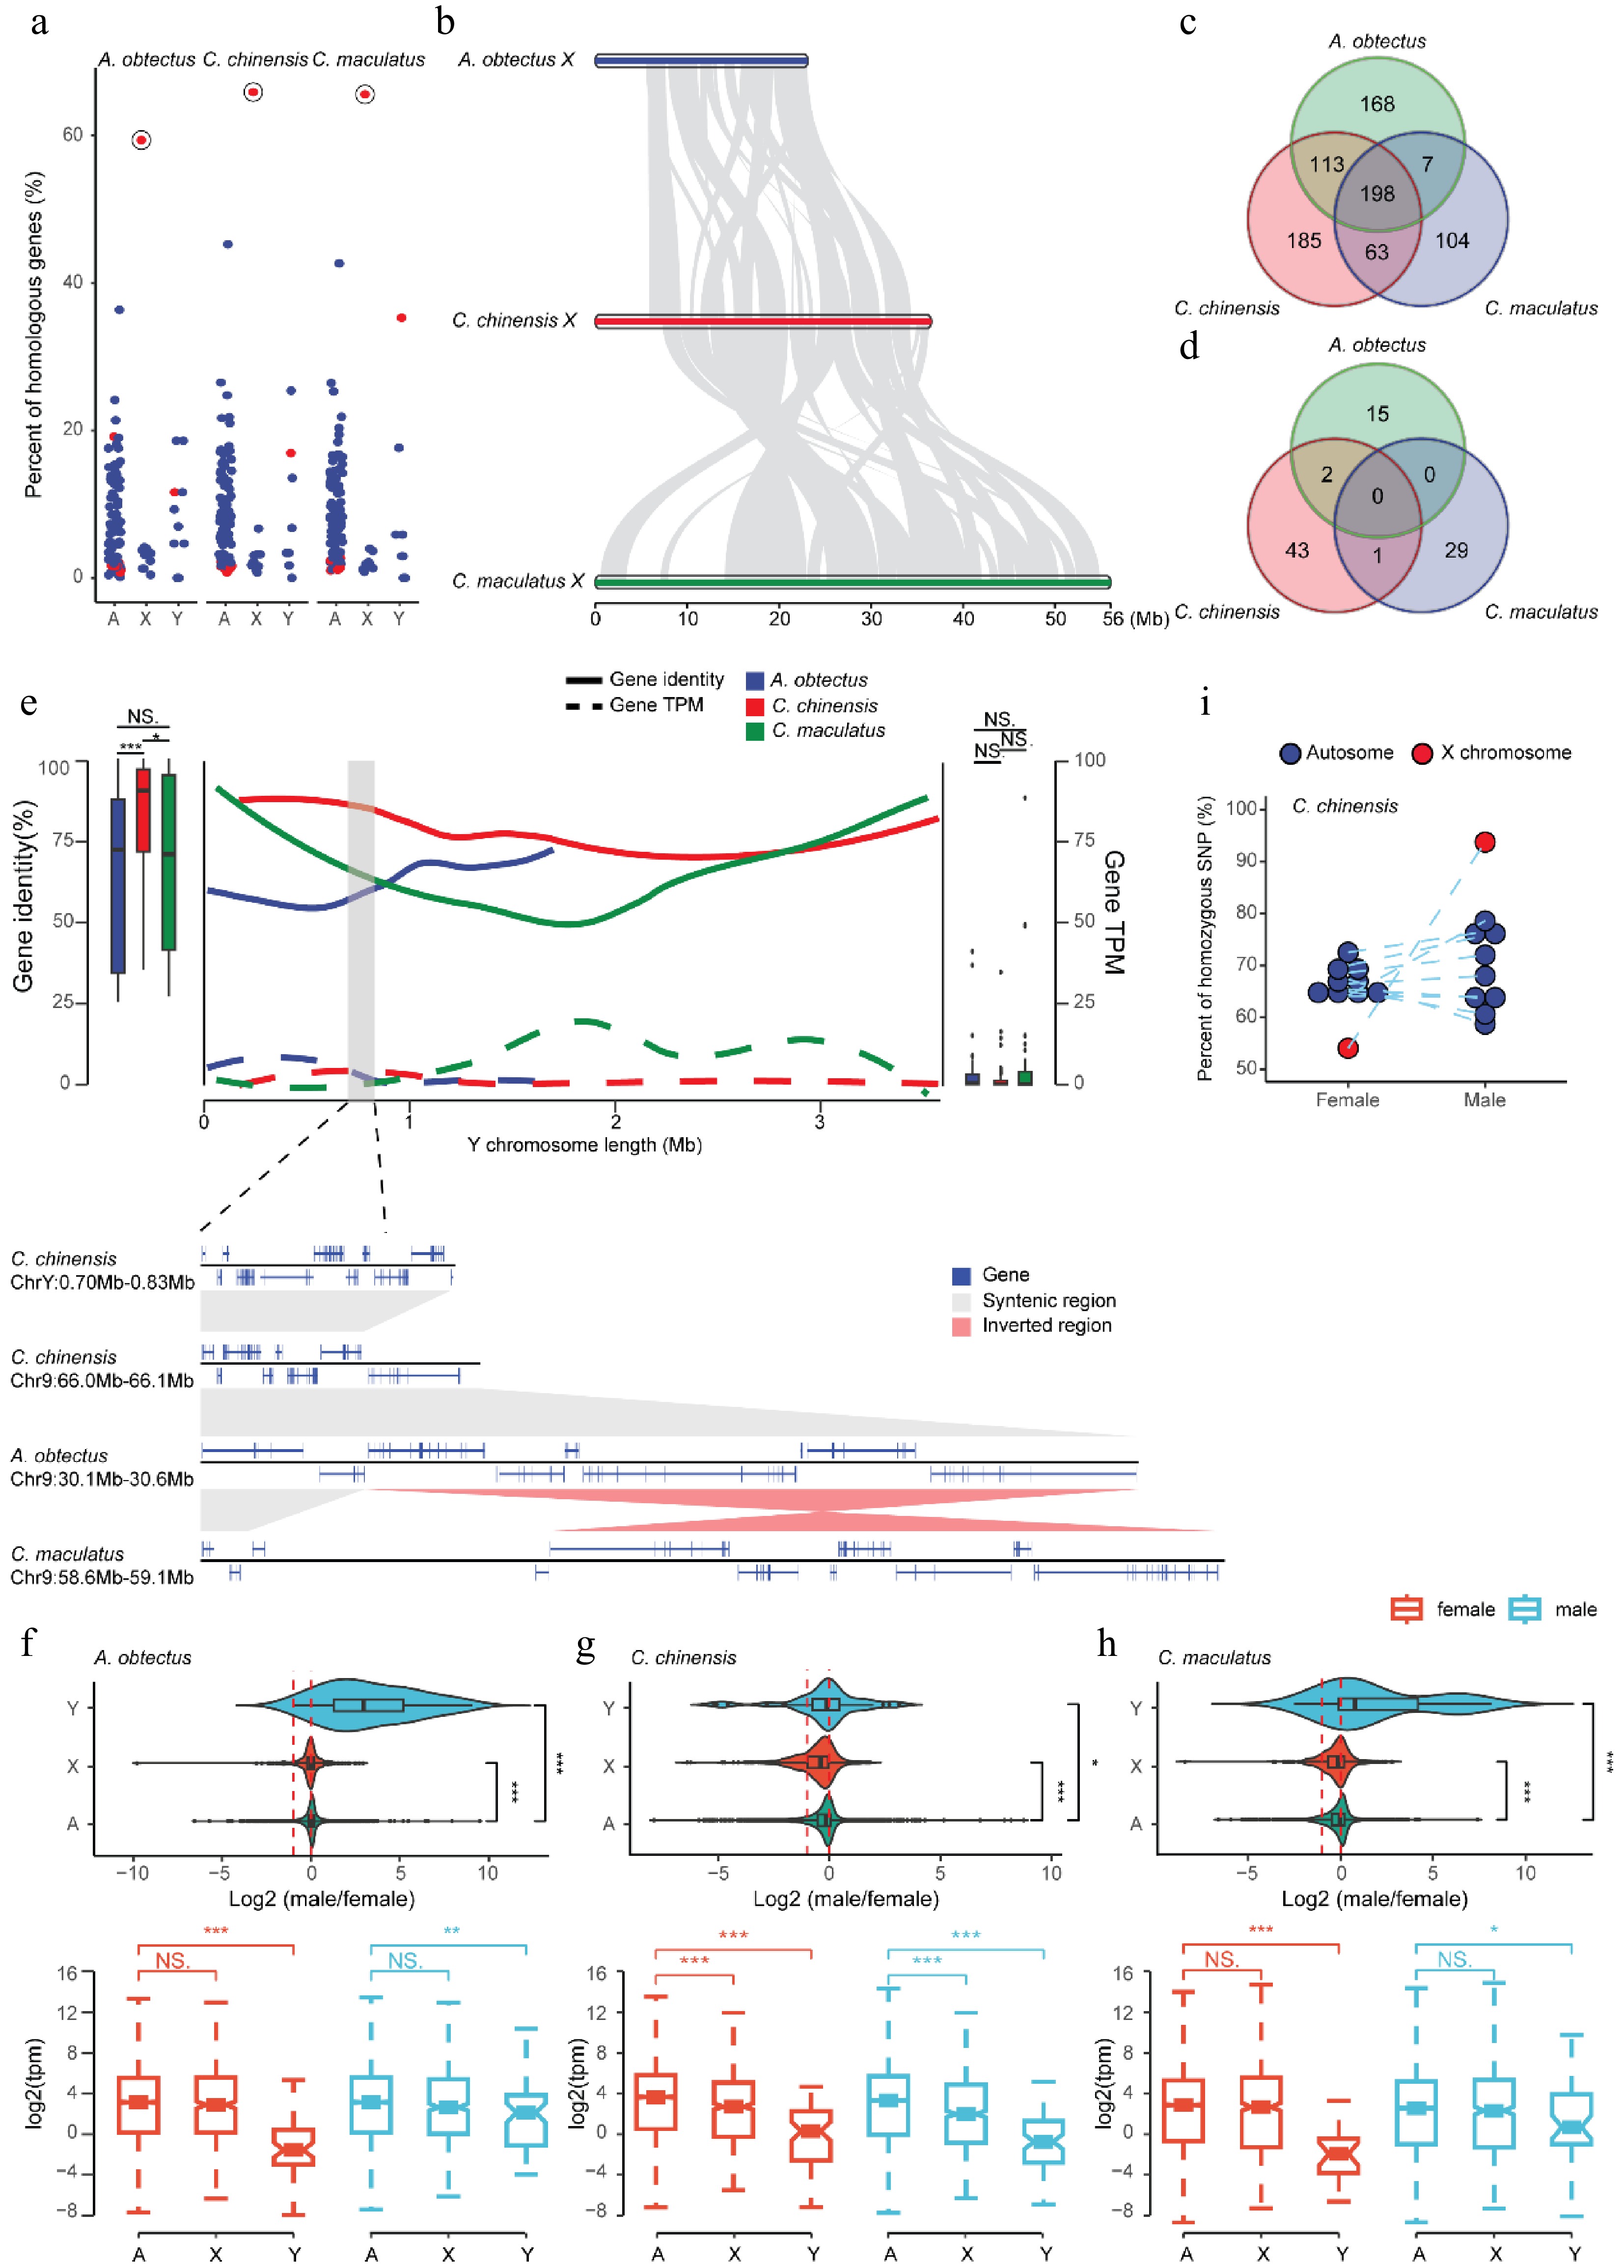
Figure 3.
The evolution of sex chromosomes in Bruchinae. (a) Chromosomal conservation of orthologous genes between Bruchinae and T. castaneum. Each point represents the percentage of orthologous genes between different chromosomes of T. castaneum and the autosomes, X chromosome, and Y chromosome of the corresponding Bruchinae species relative to the total number of genes on each chromosome of T. castaneum. The X chromosome of T. castaneum is marked with red dots, exhibiting the highest percentage of orthologous genes with Bruchinae species' X chromosome. (b) Widespread chromosomal rearrangement between the X chromosome of the seed beetles. Gray blocks represent regions of gene collinearity. (c, d) Conservatism of orthologs between seed beetles' X (c) and Y (d) chromosomes. (e) Sequence characteristics and gene expression of the Y chromosome. The overall similarity between Y chromosome genes and their orthologs in autosomes is depicted by a box plot. The distribution of gene identity (solid line) and expression levels (dashed line) along the Y chromosome is illustrated by a line graph. The collinearity of a segment of C. chinensis' Y chromosome with autosomes is magnified at the bottom. (f–h) Dose expression patterns of sex chromosomes for A. obtectus (f), C. chinensis (g), and C. maculatus (h) in the head. The log2 of the male-to-female expression ratio for autosomal and sex-linked genes is depicted in the violin plot. Expression of autosomal and sex-linked genes in males and females is depicted in the box plot. Female samples are represented by red and male samples are represented by blue. p-values (* p < 0.05, ** p < 0.01, *** p < 0.001) were derived from two-sided Wilcoxon matched-pair signed-rank tests. (i) Allelic heterozygosity in C. chinensis. Each point represents a chromosome, and the X chromosome is represented by red dots.
-
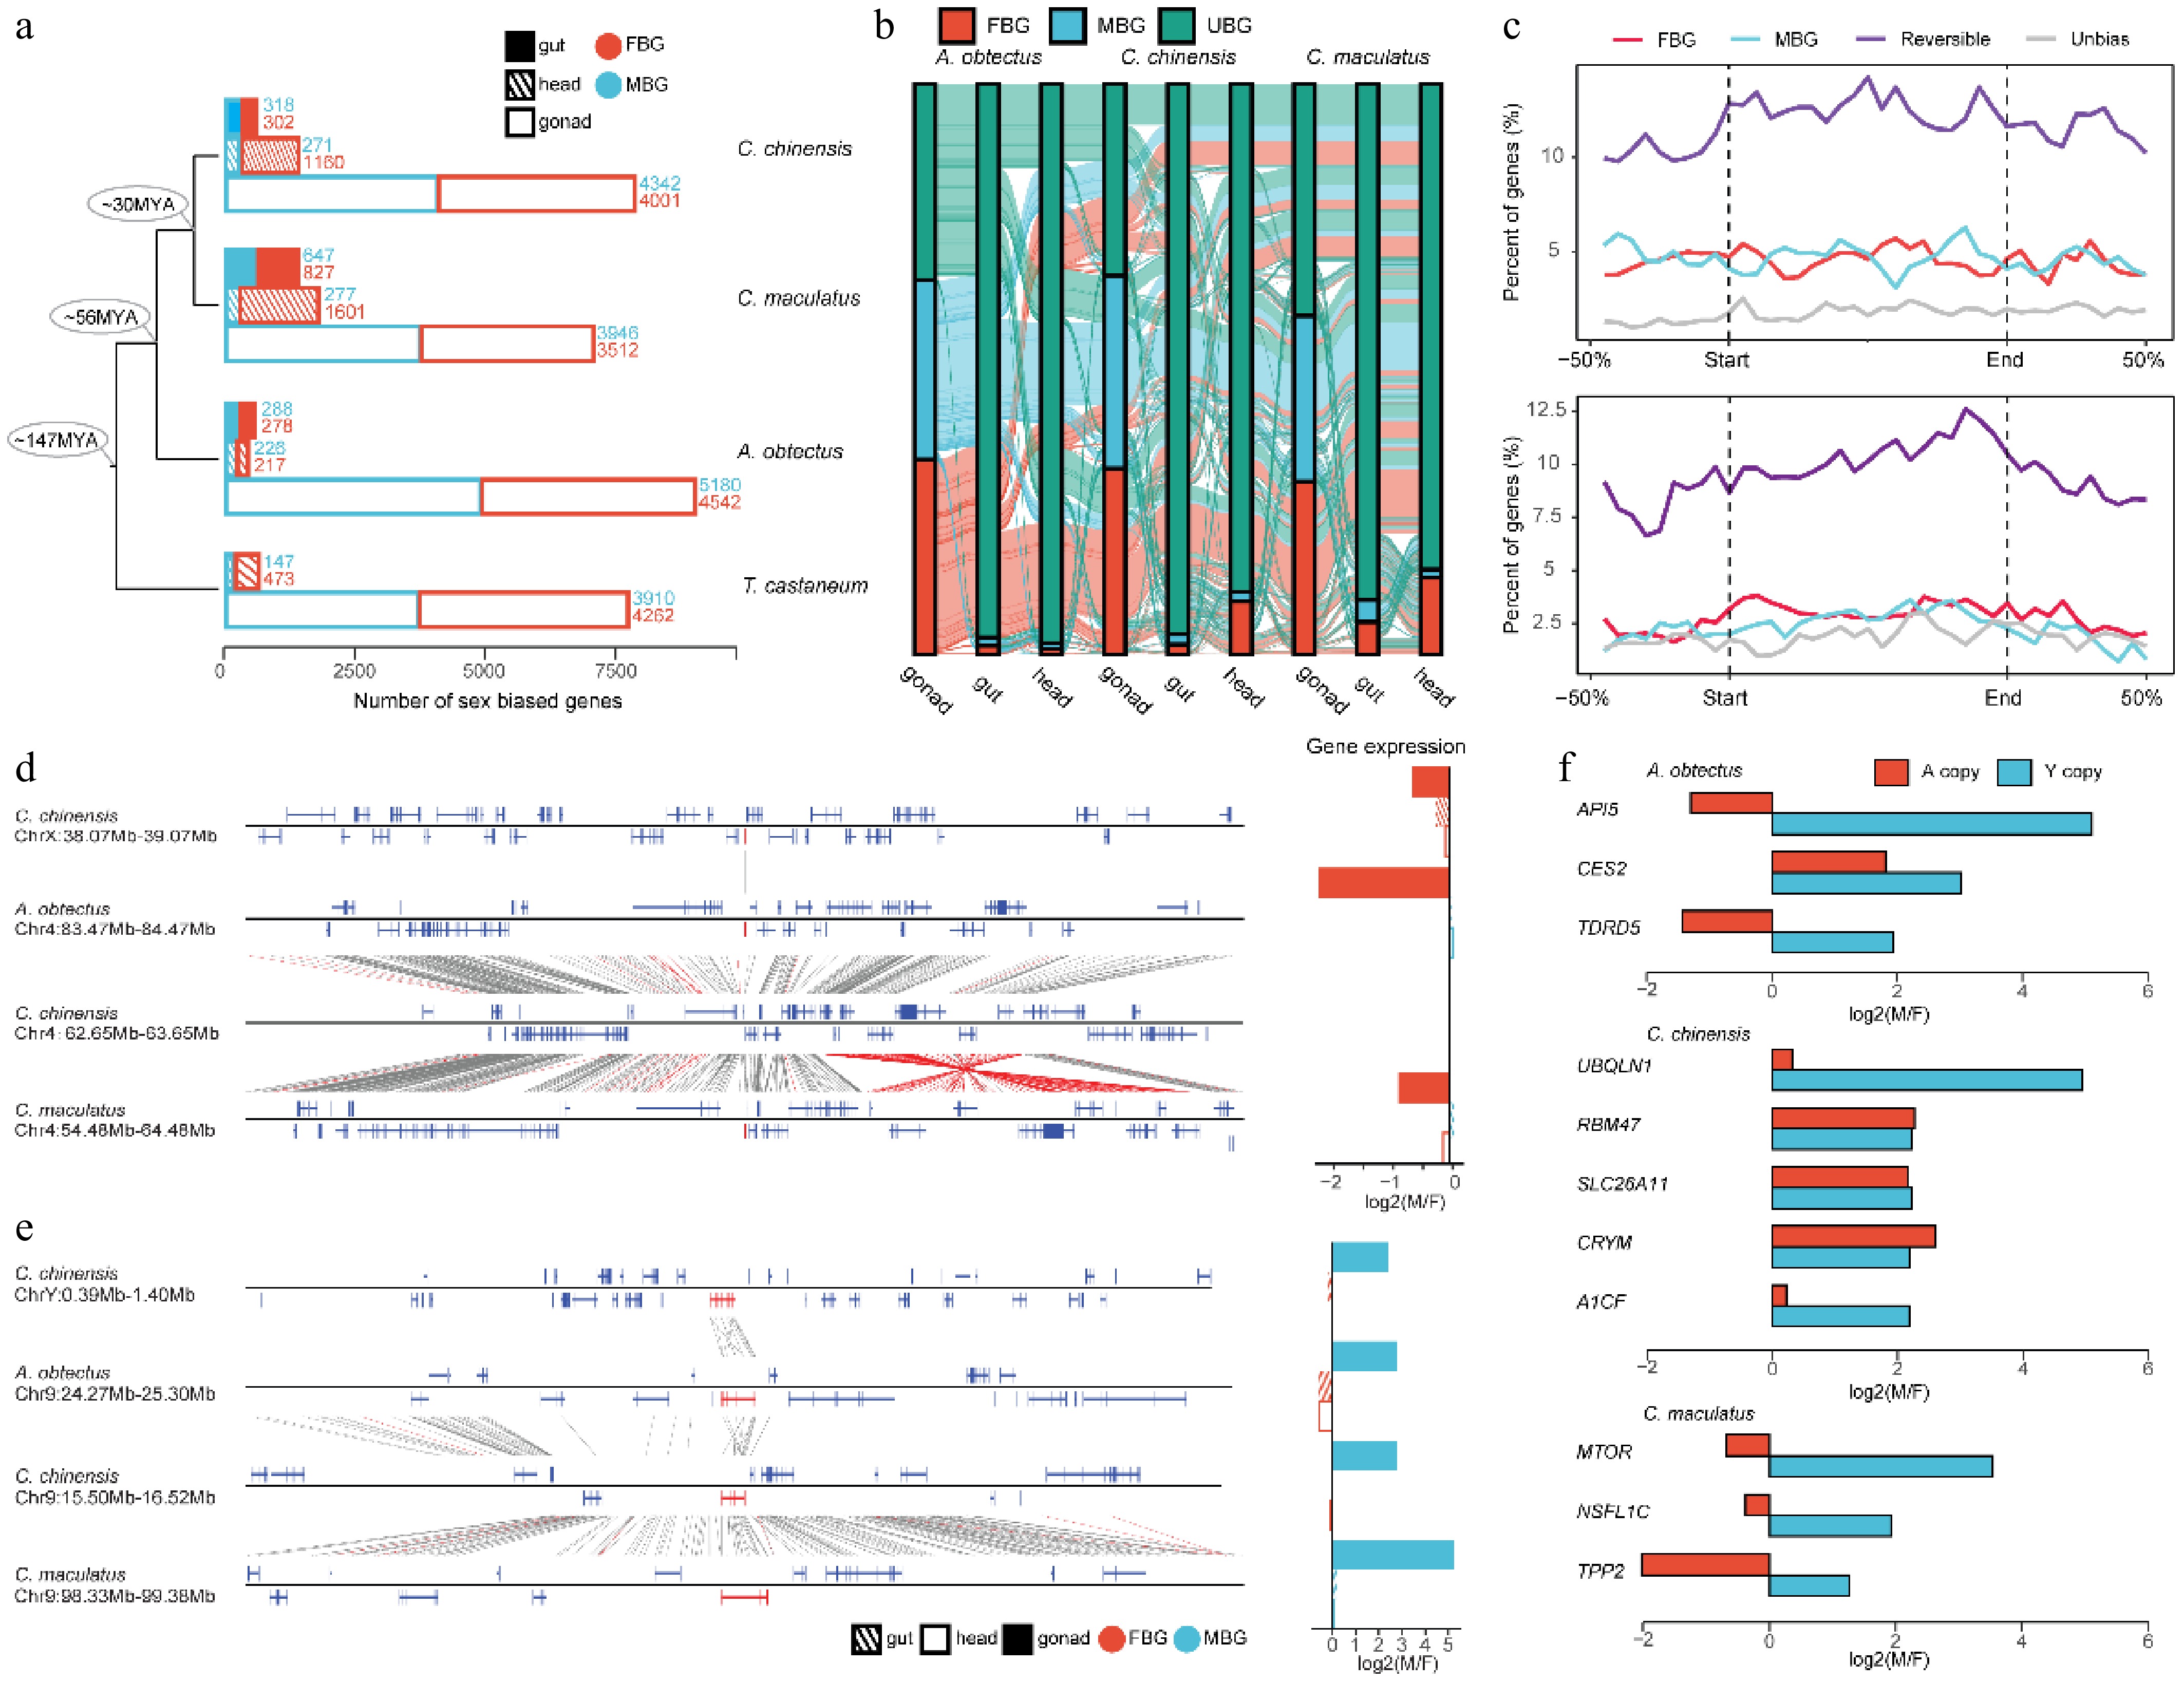
Figure 4.
The evolution of sex-biased genes in Bruchinae. (a) Comparison of the number of sex-biased genes between different species and tissues. We identified male-bias genes (MBG) and female-bias genes (FBG) in male and female samples from different tissues. The specific number of genes is indicated by numbers. (b) The Sankey diagram showing dynamic variation in sex-biased genes across different tissues and species. UBG, unbiased gene. (c) Distribution of sex-biased gene density between A. obtectus and C. chinensis (top) and between A. obtectus and C. maculatus (bottom) along sequence inversions. 'Reversible' represents the orthologs with different sex-biased expression patterns in different species. (d) Nonreplicating translocation event of gene. (e) Replication translocation event of genes. The genes that undergo translocation are marked in red on the collinearity chart, and the corresponding sex-biased expression patterns in different tissues are shown in the bar plot. (f) The expression of genes with strong sex bias on the Y chromosome and their orthologous genes on the autosomes. Expression of Y-linked genes was calculated using testis and ovary tissues.
Figures
(4)
Tables
(0)