-
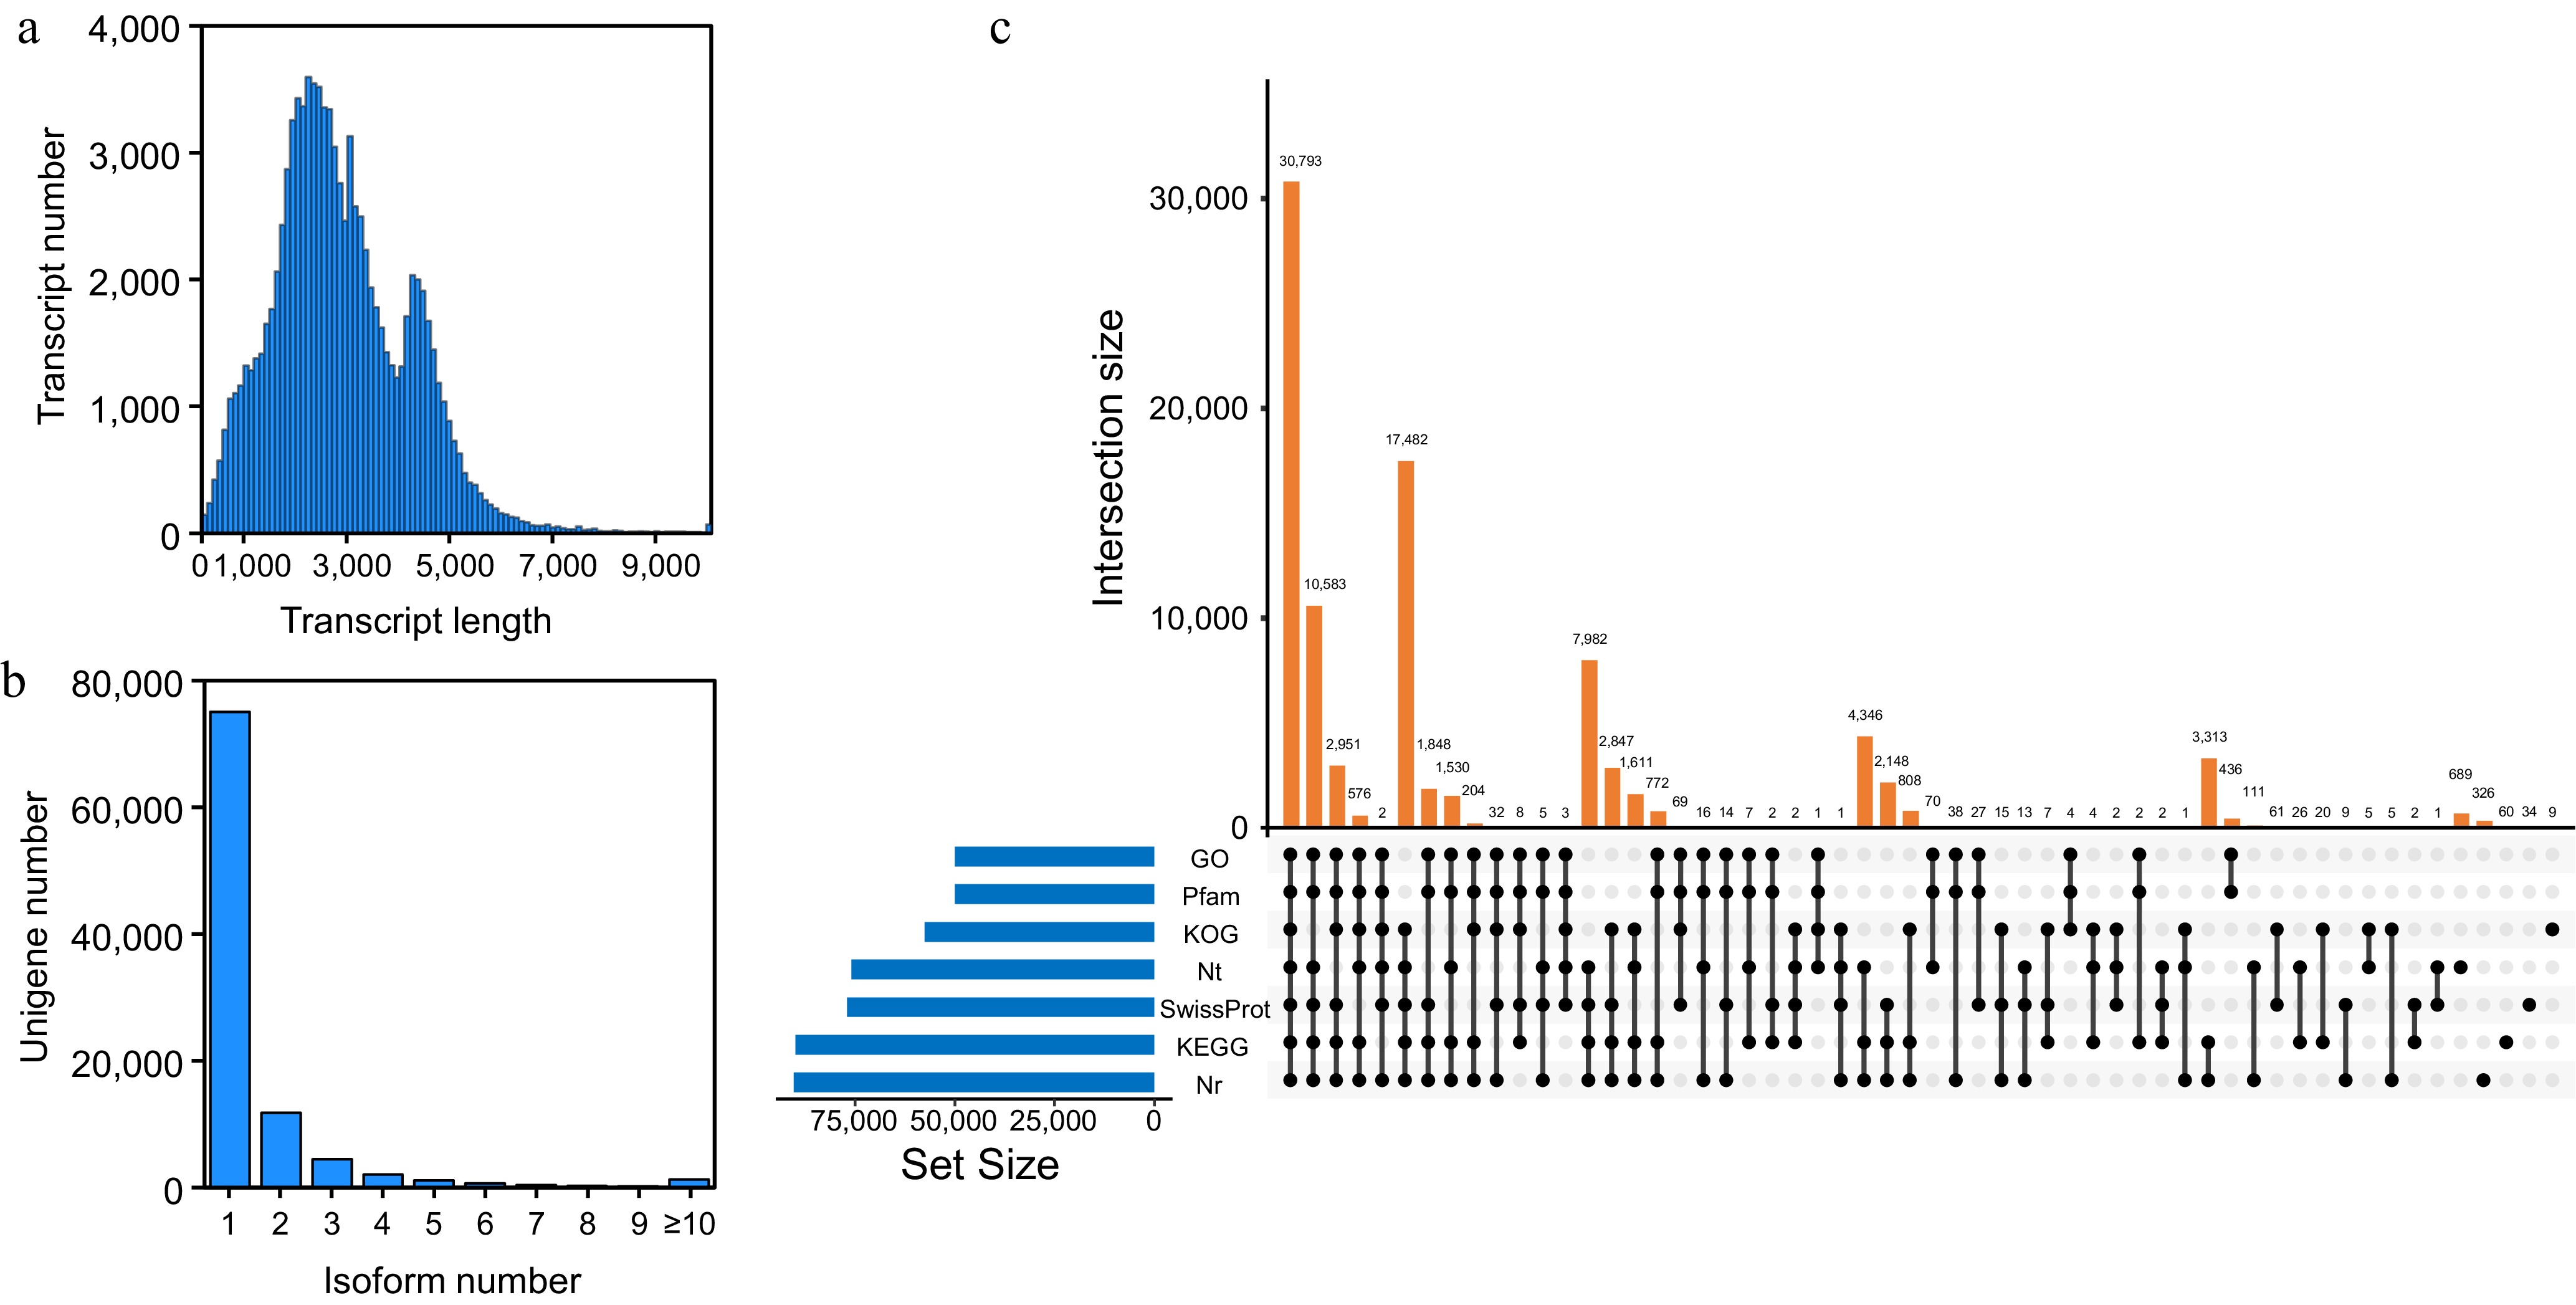
Figure 1.
PacBio single-molecule long-read sequencing of L. japonica. (a) Length distribution of unigenes. (b) Length distribution of transcripts after redundancy is removed. (c) Upset plot showing transcript annotations in Nr, SwissProt, KEGG, KOG, GO, Nt, and Pfam database.
-
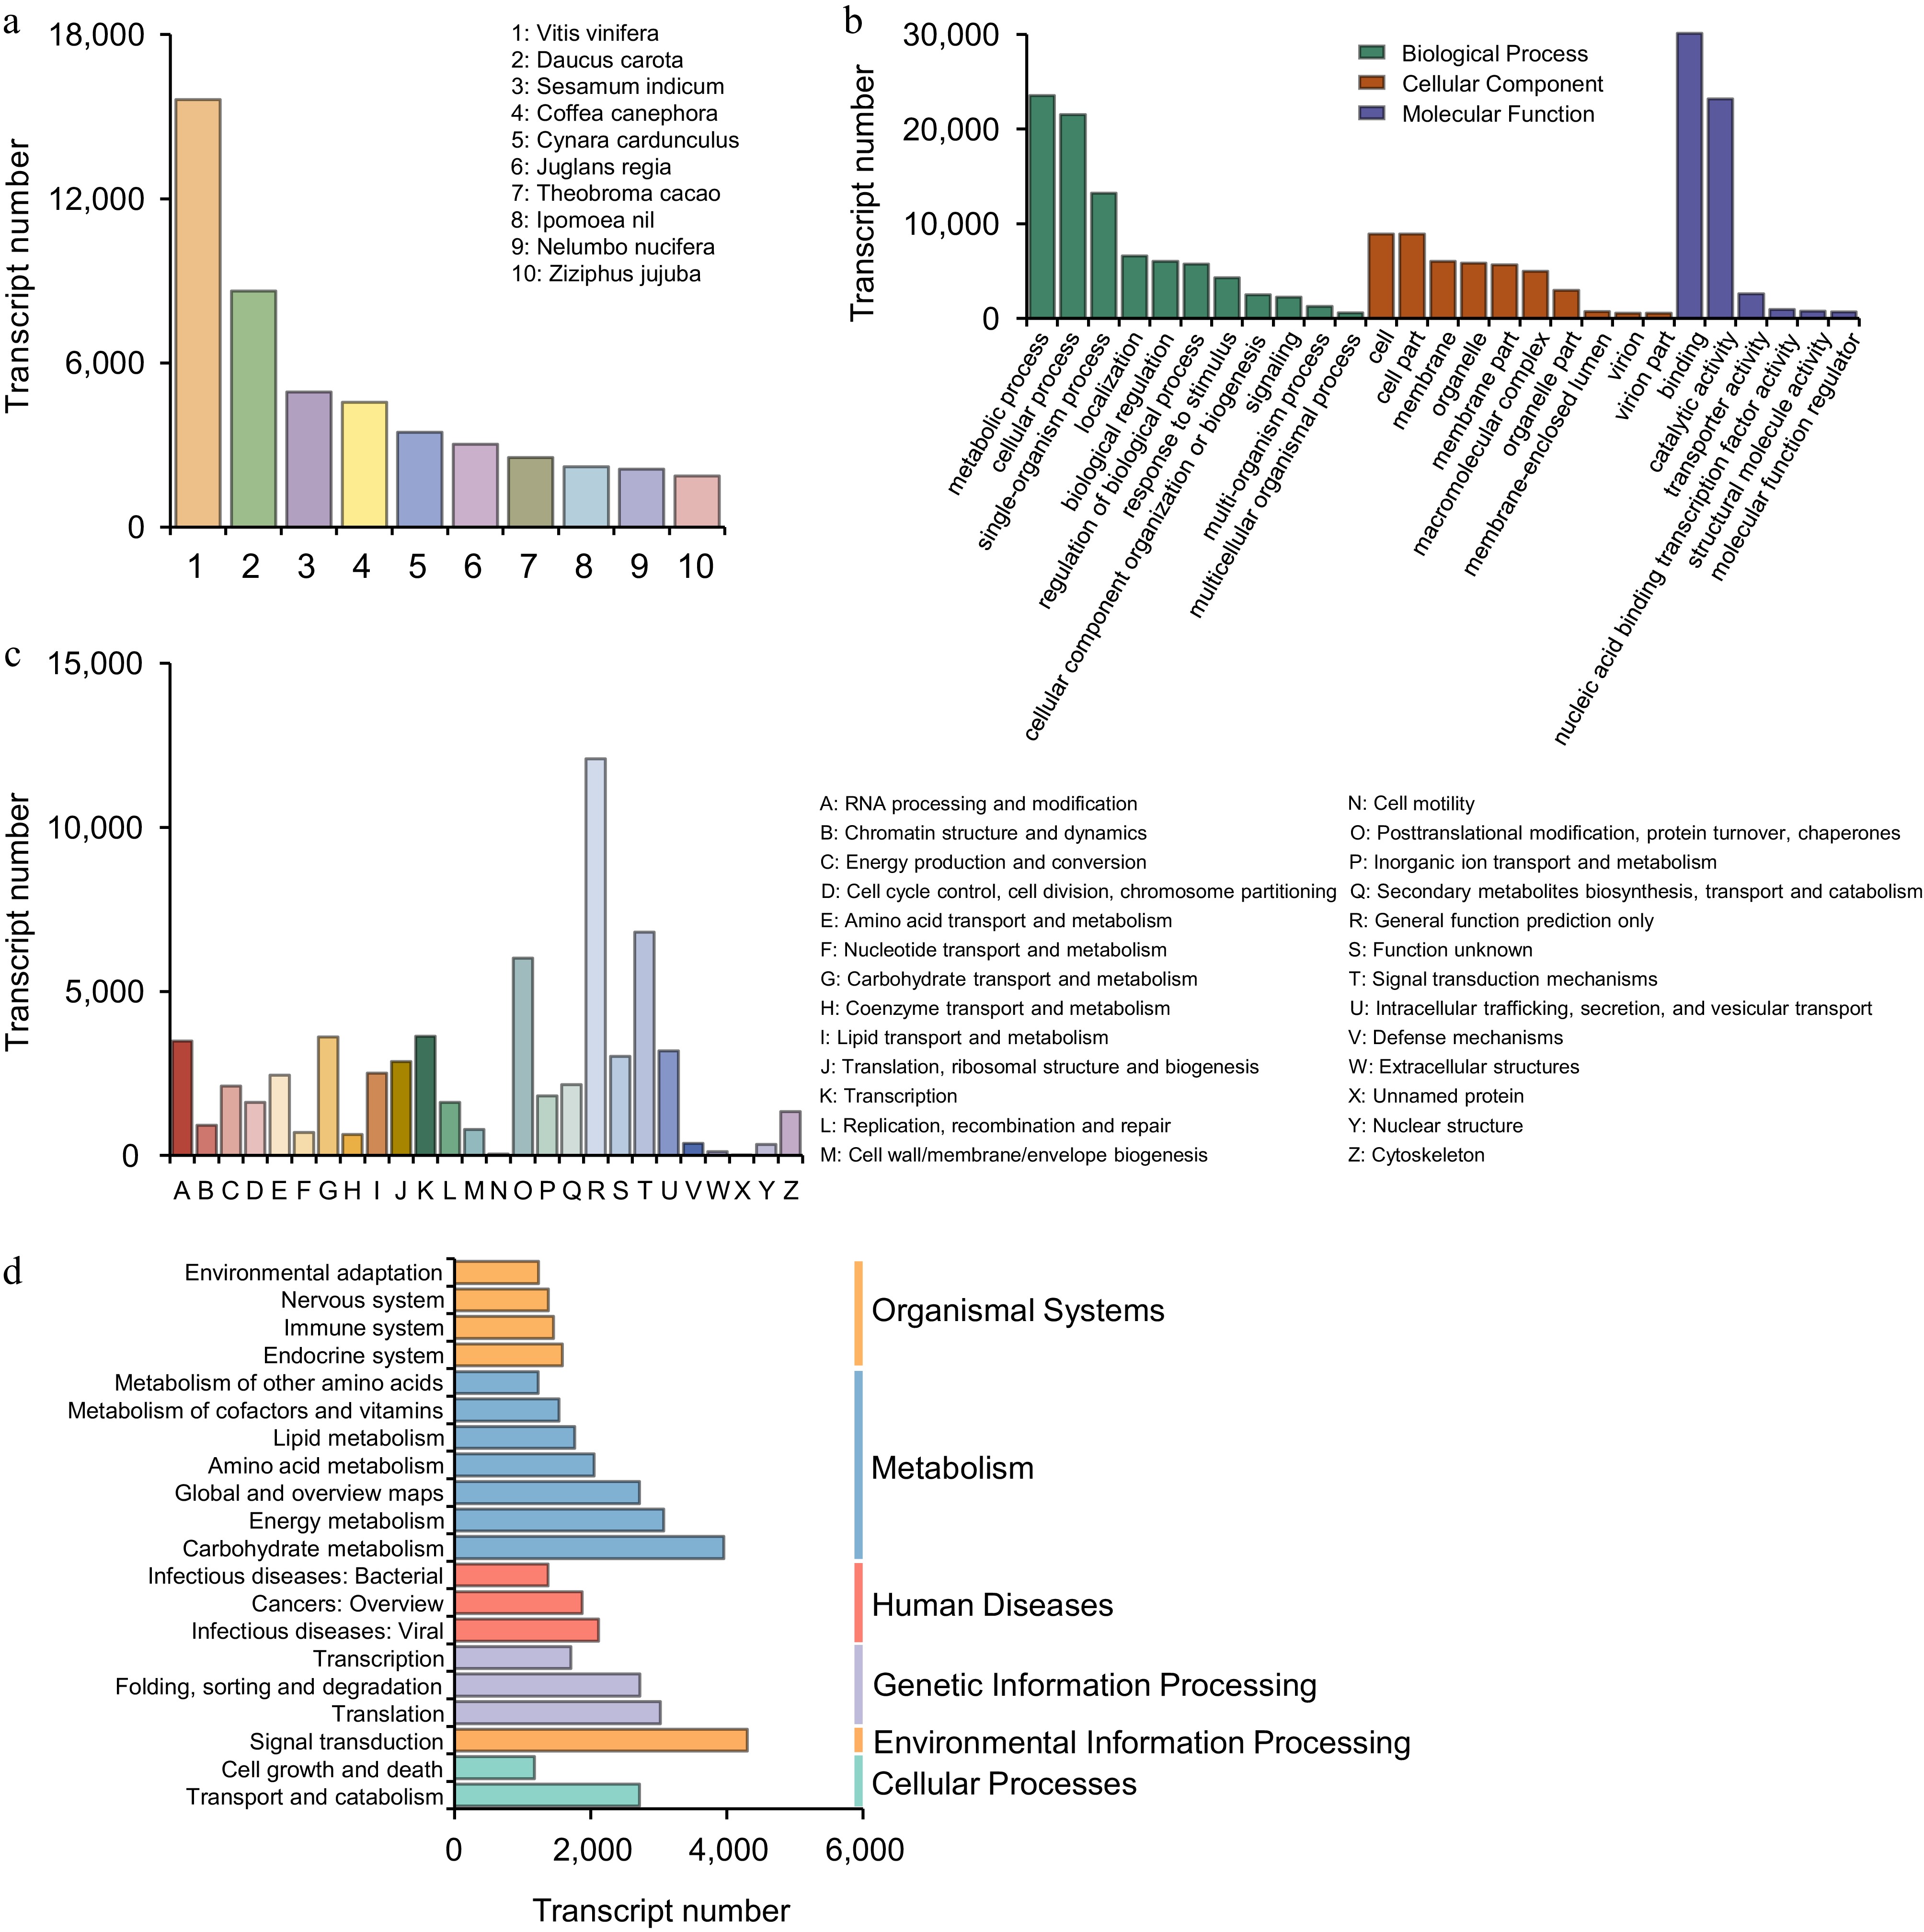
Figure 2.
Functional analysis of full-length transcripts. (a) Function classification annotated in the Nr database. (b) Function classification annotated in the GO database. (c) Function classification annotated in the KOG database. (d) Function classification annotated in the KEGG database.
-
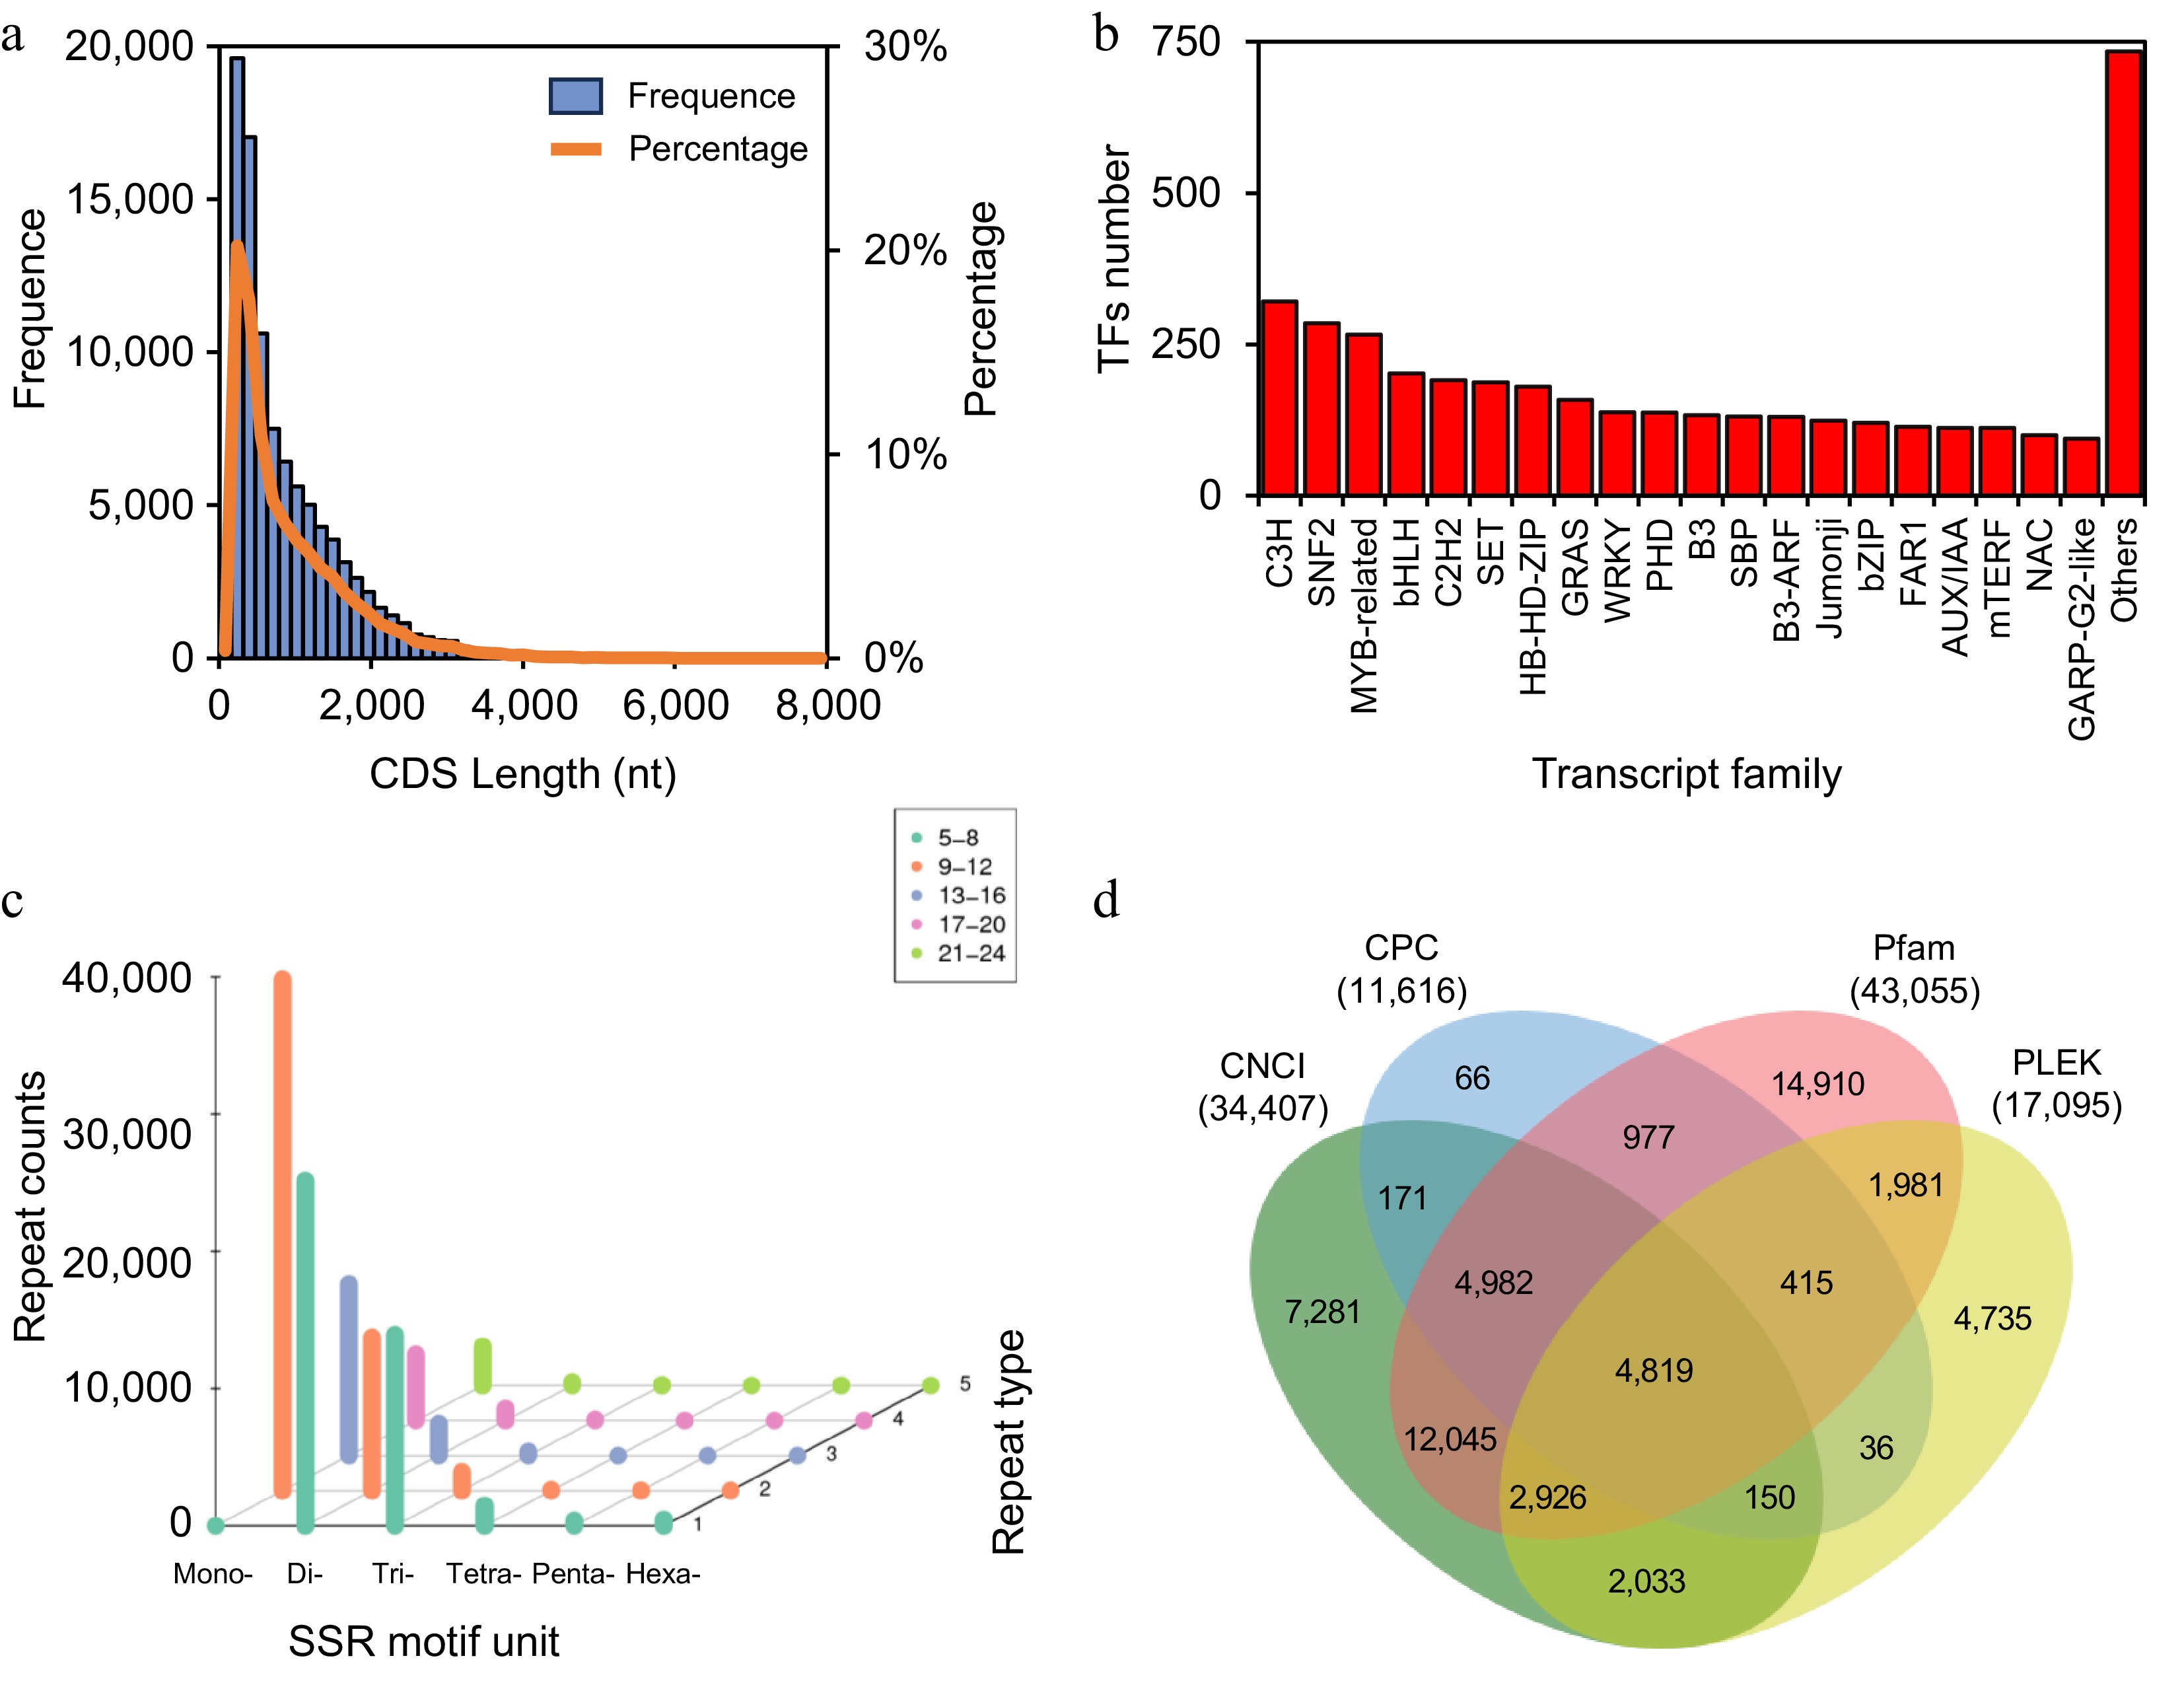
Figure 3.
Gene structure analysis. (a) Length distribution of CDS. (b) Top 20 transcription factor families. (c) Repeat numbers of SSR motifs. The X-axis represents SSR type (number of repeated bases), the Y-axis shows the number of base repeats (corresponding to color and legend), and the Z-axis indicates the number of SSRs. (d) Venn diagram of lncRNA prediction.
-
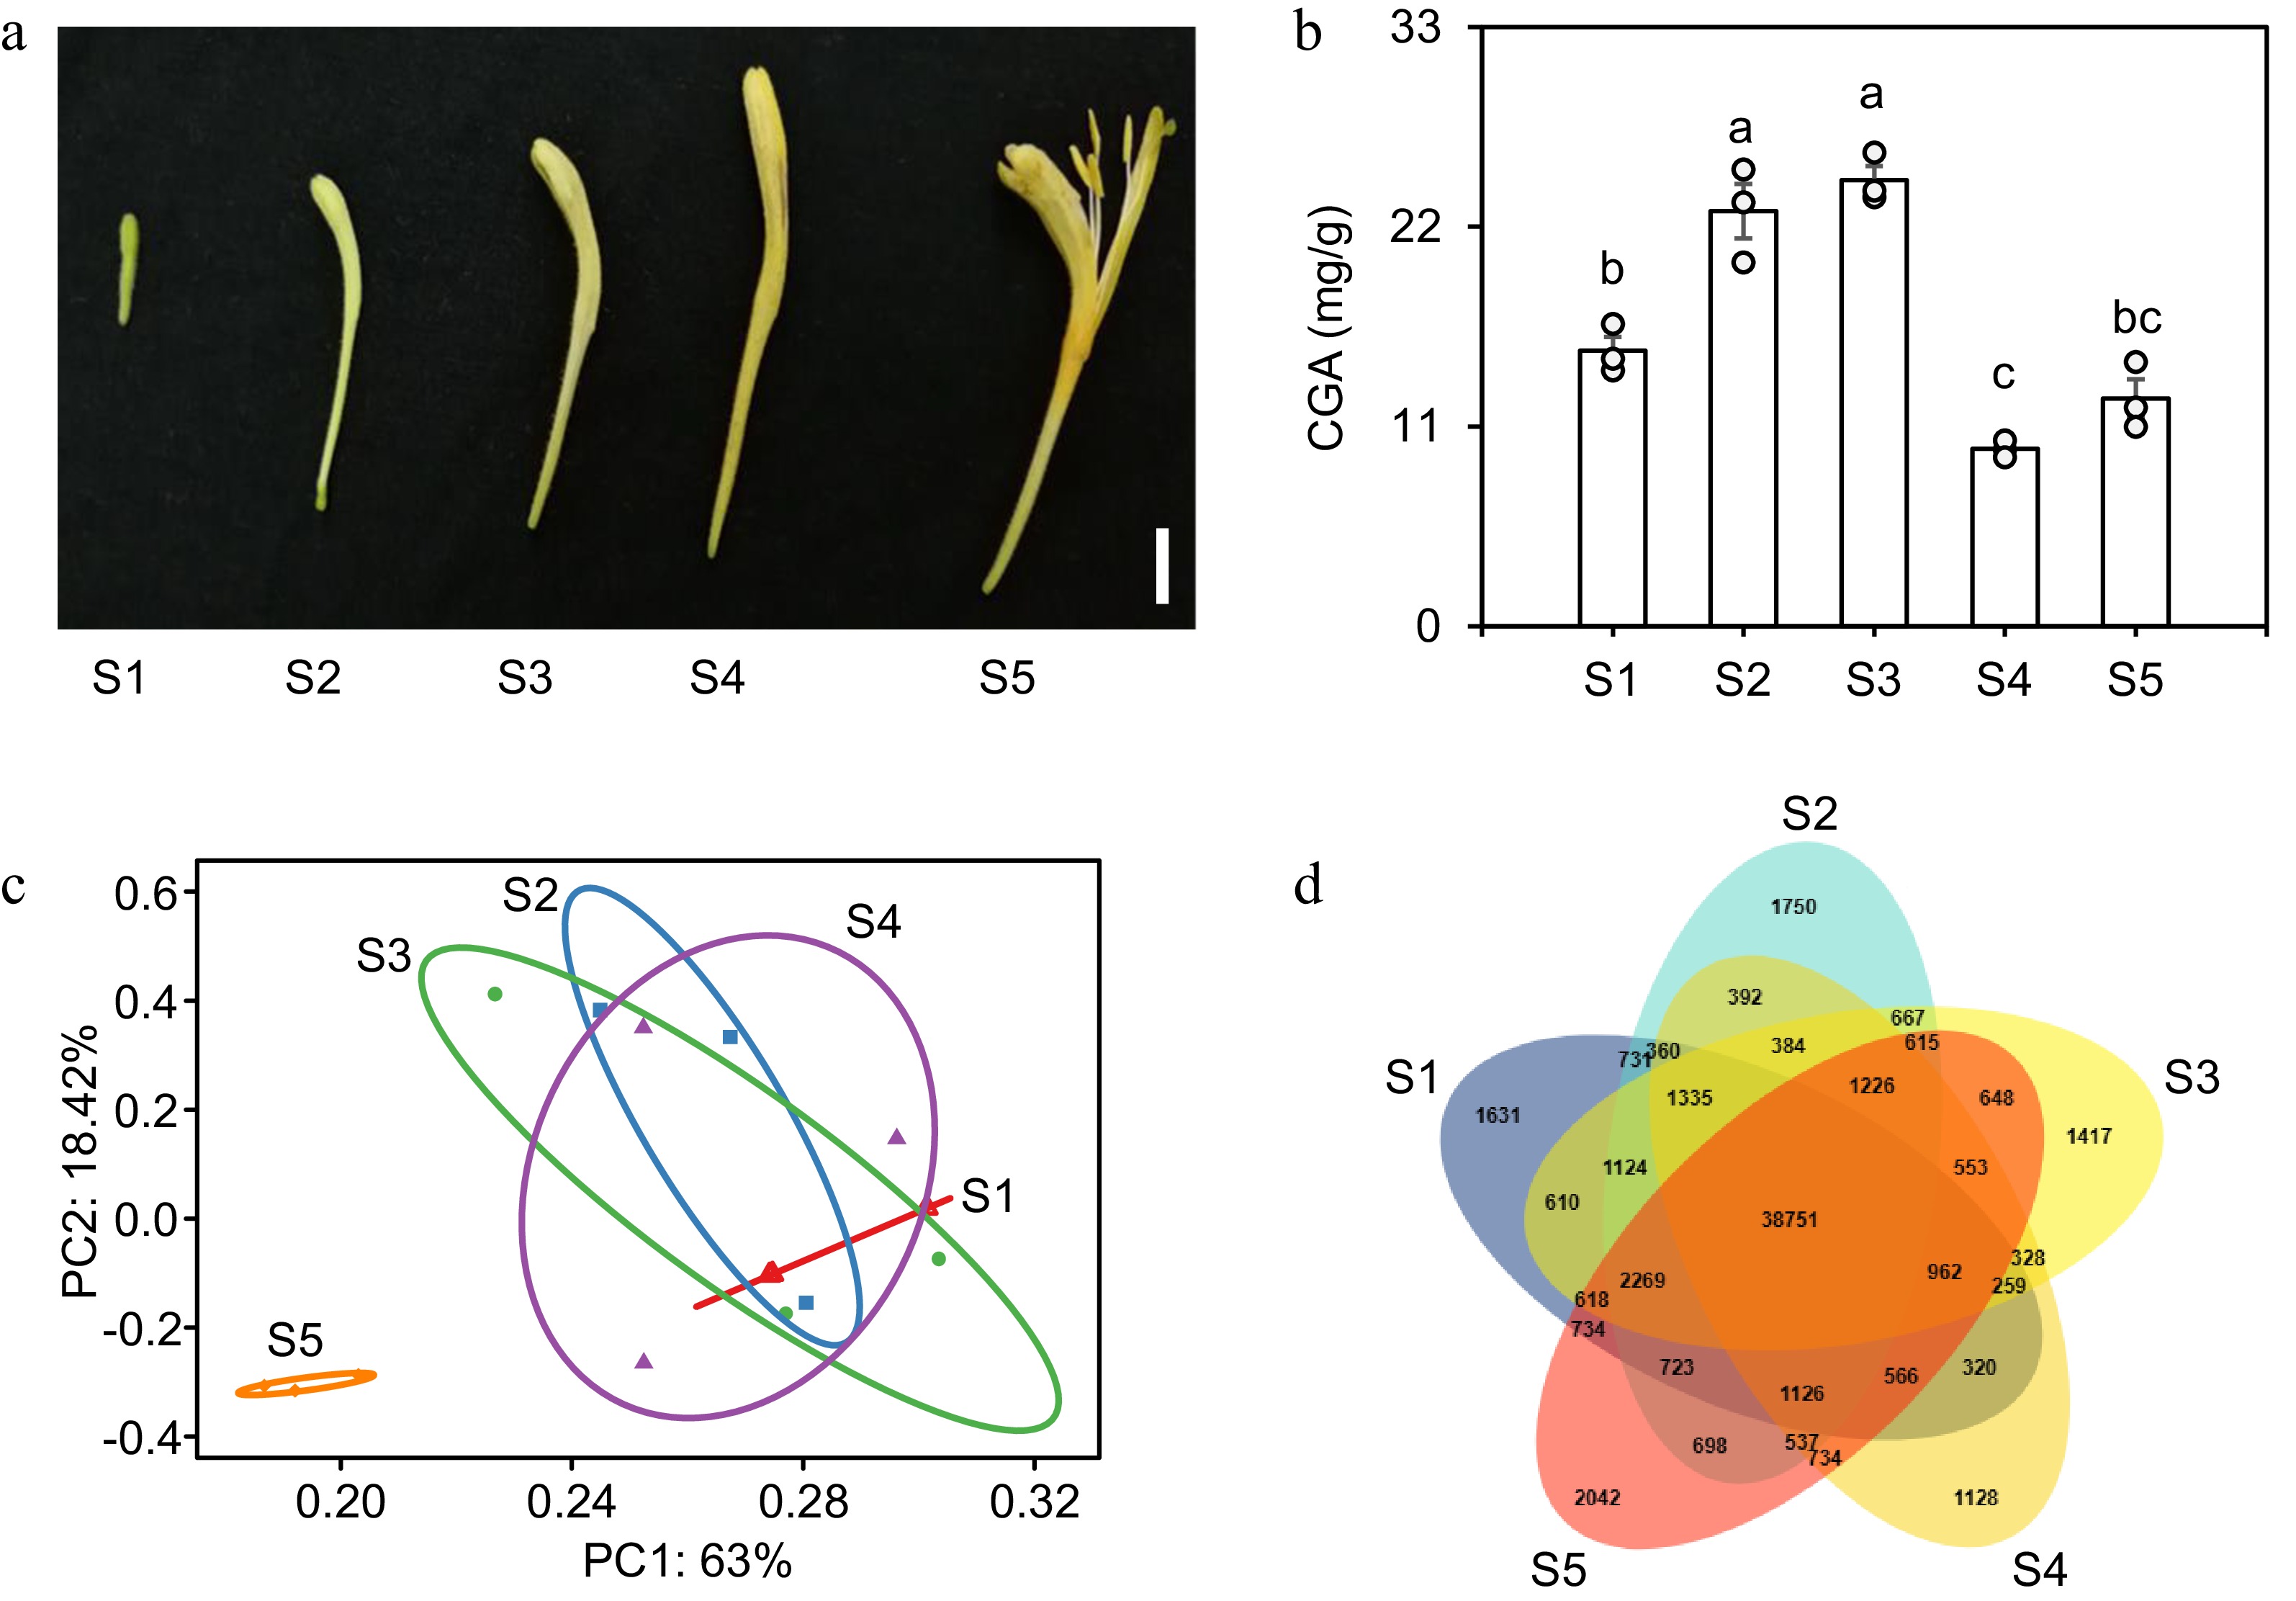
Figure 4.
Transcriptome analysis of flowers at five developmental stages in L. japonica. (a) Phenotypes of flowers at five developmental stages: juvenile bud stage (S1), third green stage (S2), second white stage (S3), complete white stage (S4), and gold flowering stage (S5). Scale bar = 1 cm. (b) CGA content in flowers at five developmental stages. Data are mean ± SE (n = 3). Different letters indicate significant differences (one-way ANOVA, Fisher's LSD, p < 0.05). (c) PCA of transcriptional profiles in L. japonica flowers at five developmental stages. (d) Venn diagram of transcript expression in flowers at five developmental stages.
-
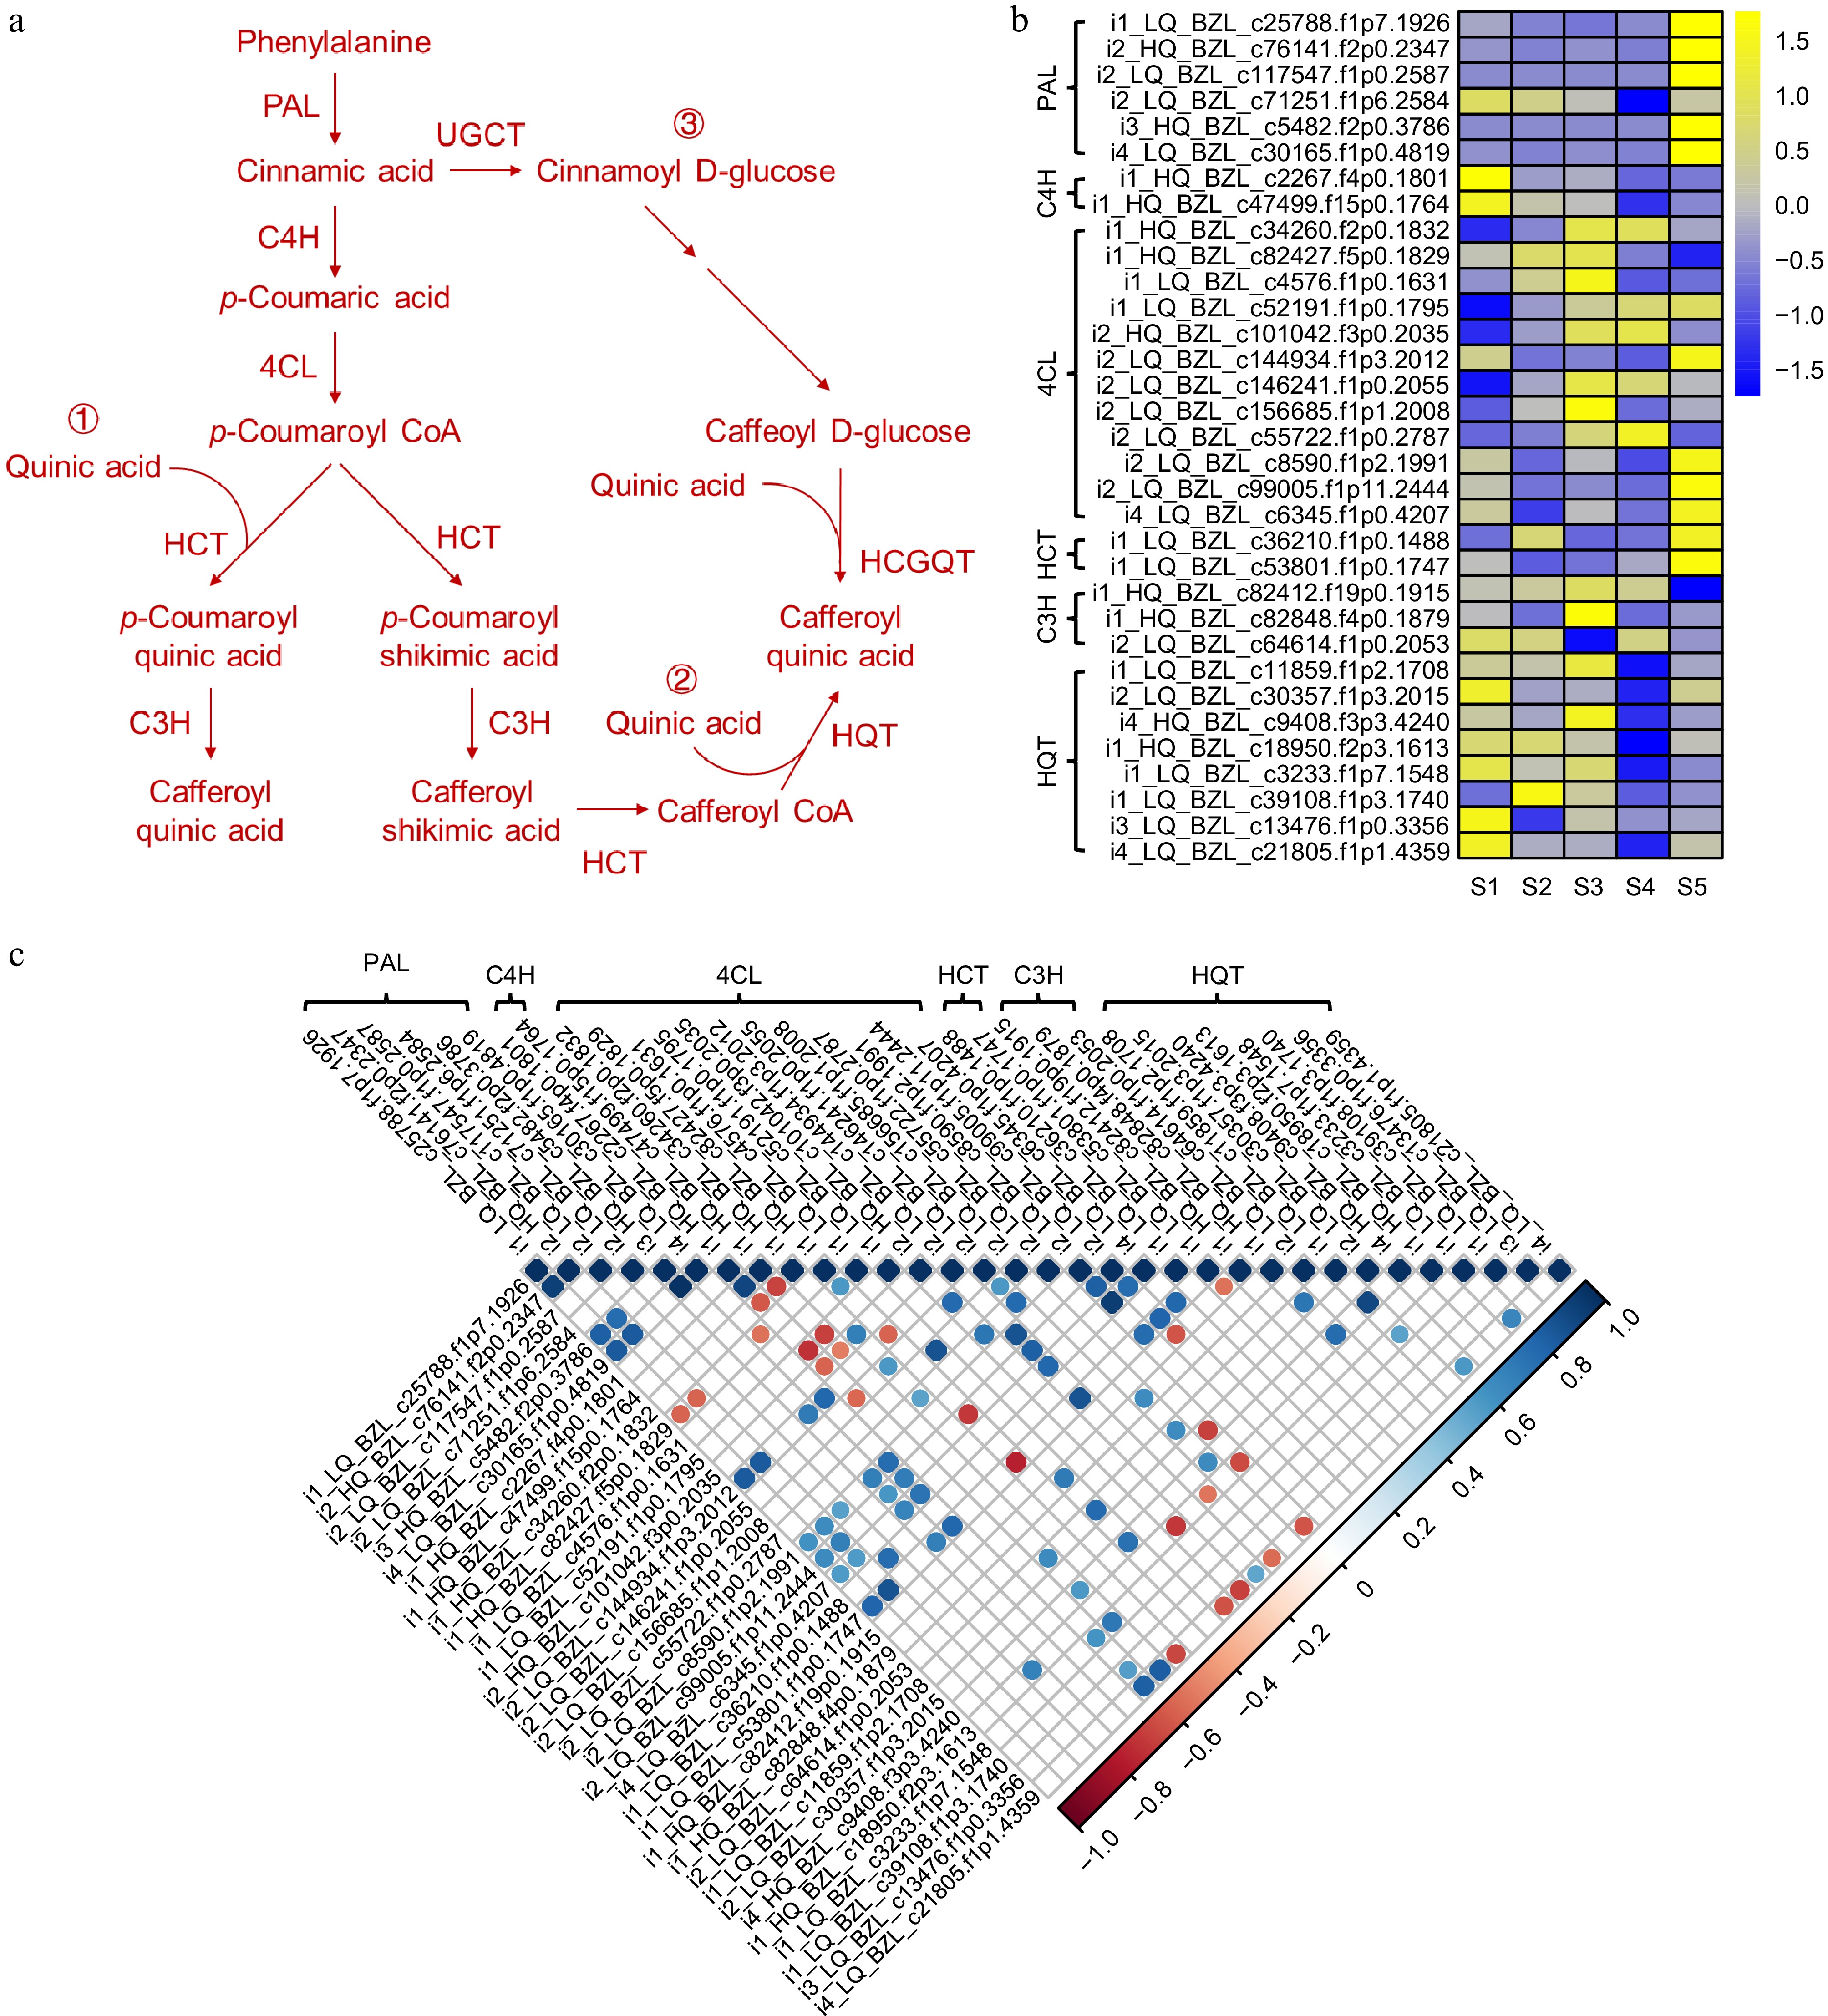
Figure 5.
Visualization of gene expression levels associated with CGA biosynthetic pathways in L. japonica. (a) Schematic diagram of CGA biosynthetic pathways. (b) Heatmap of gene expression related to CGA biosynthetic. (c) Correlation analysis of gene expression in CGA biosynthetic pathways.
-
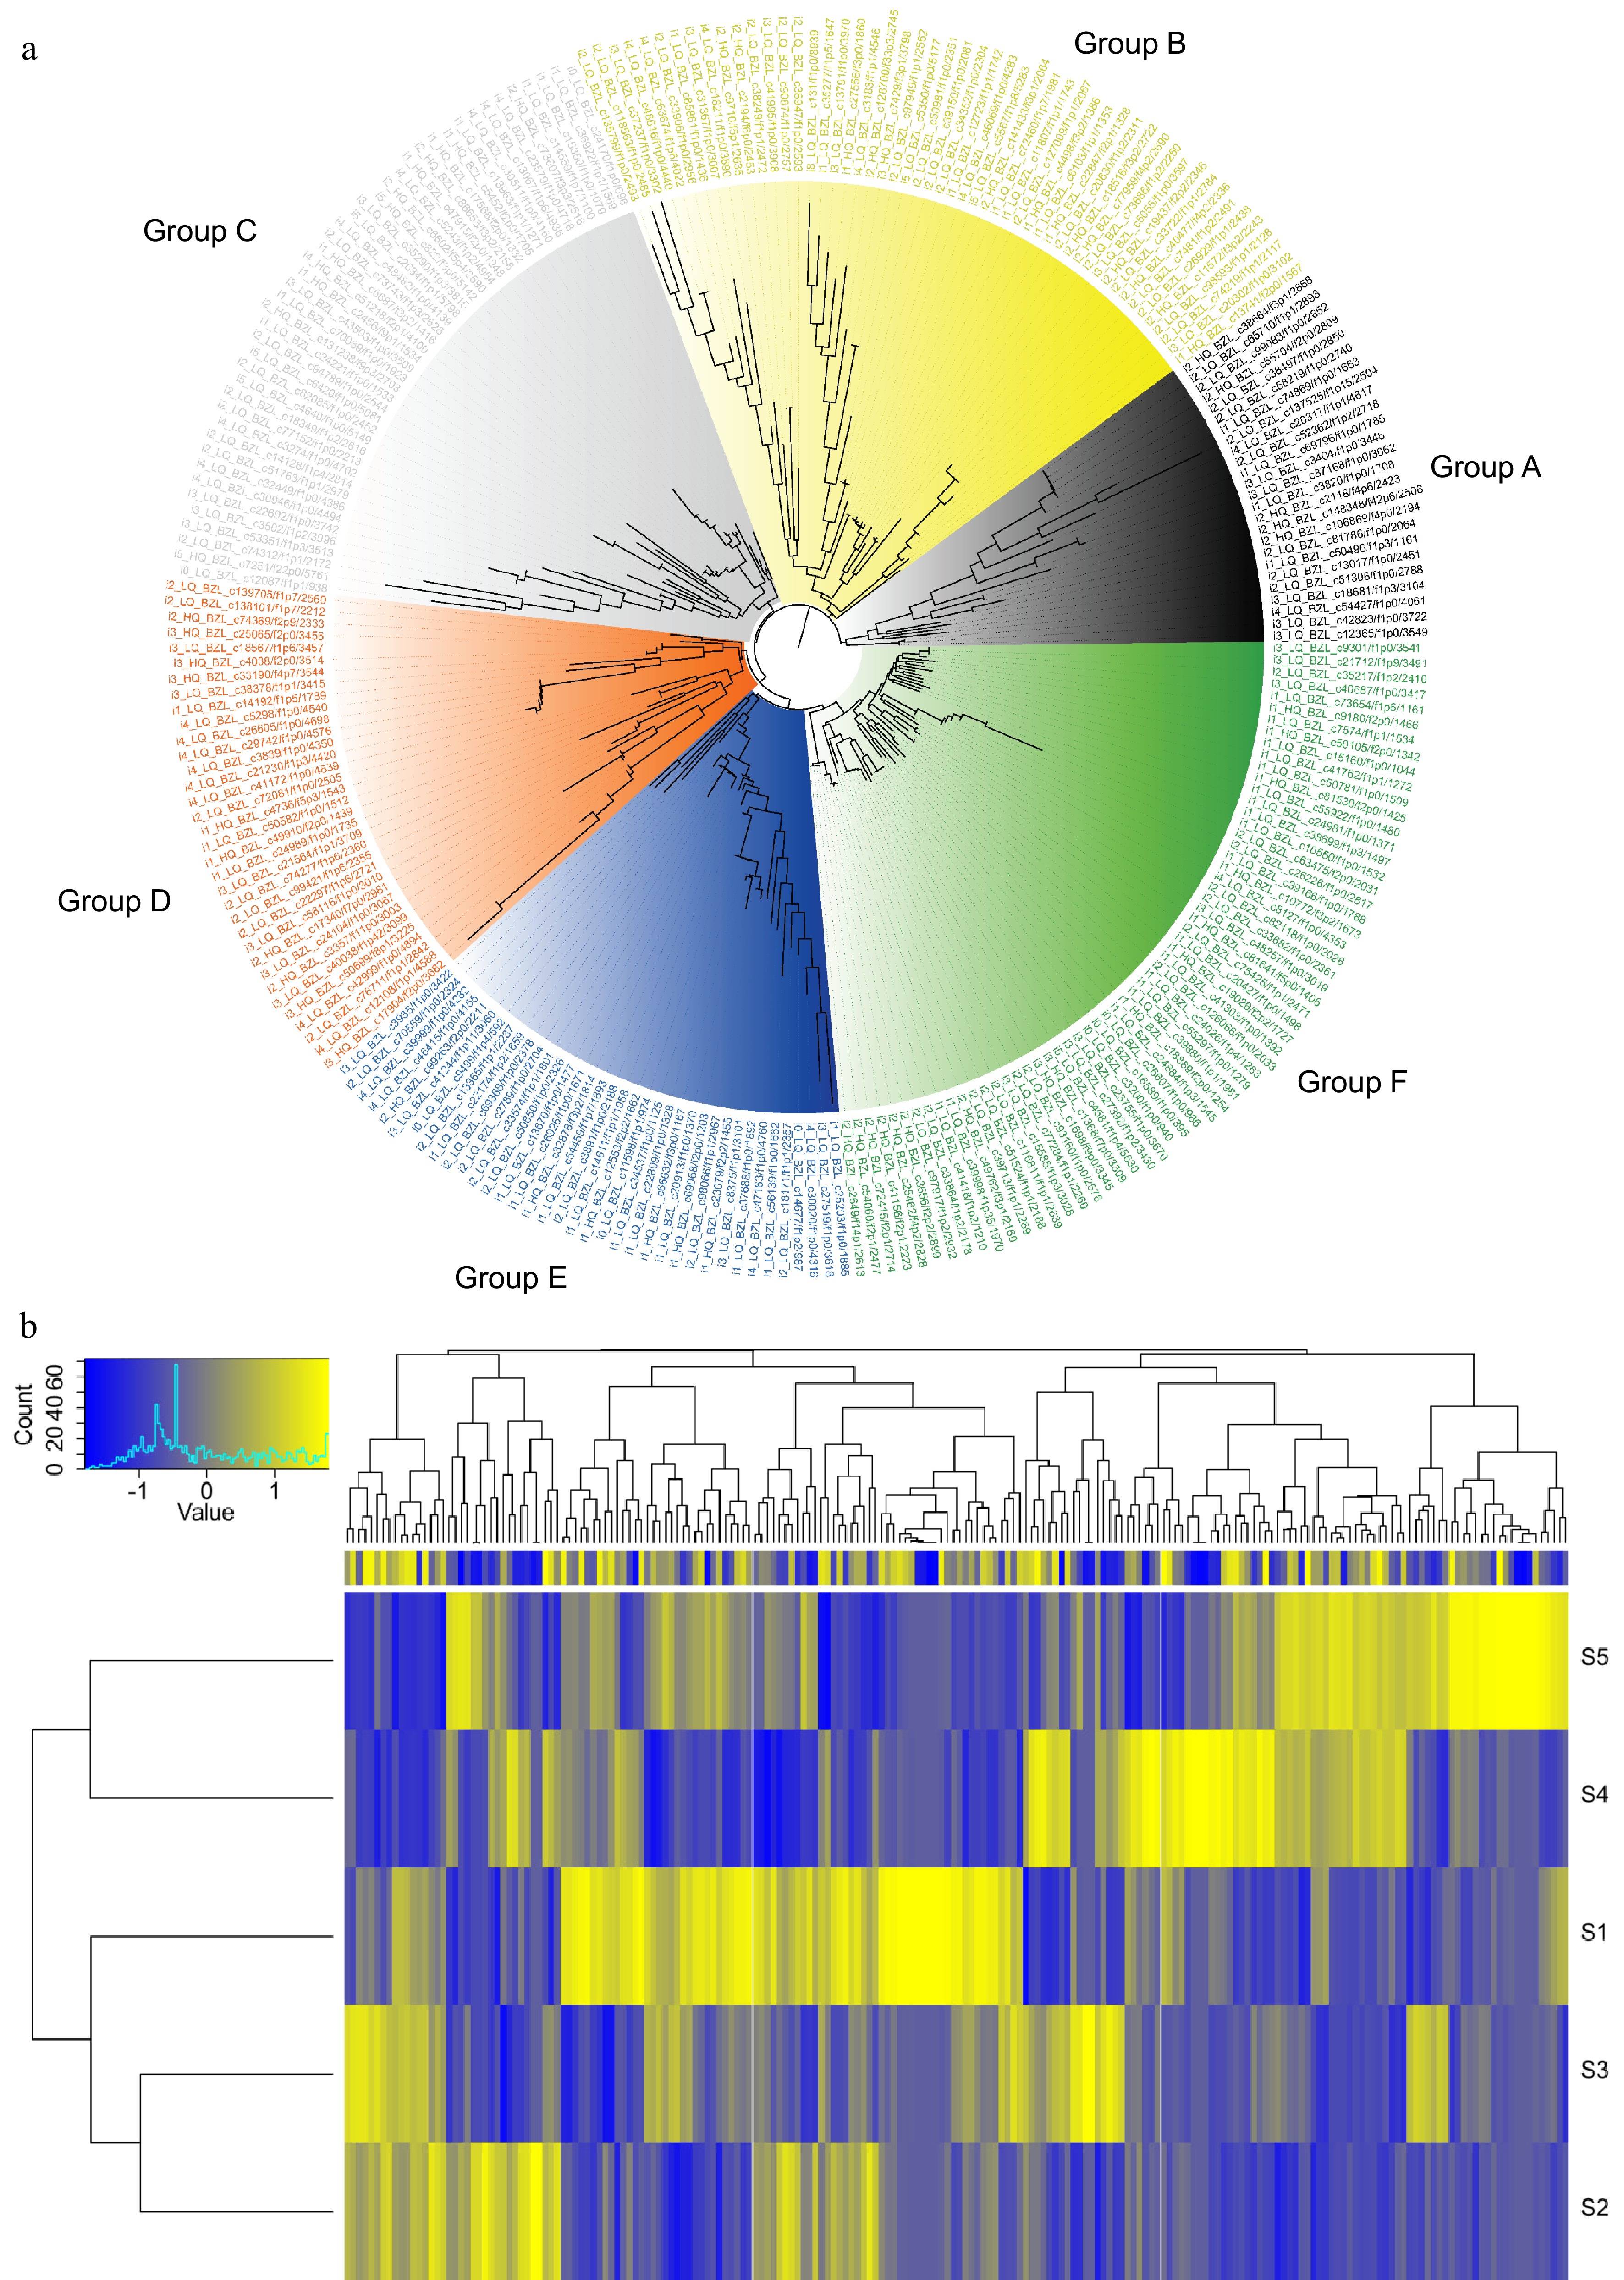
Figure 6.
Characterization of MYB transcription factors in L. japonica. (a) Phylogenetic tree of 252 MYB transcription factors. (b) Heatmap showing the expression profiles of MYB transcription factors in flowers at five developmental stages.
-
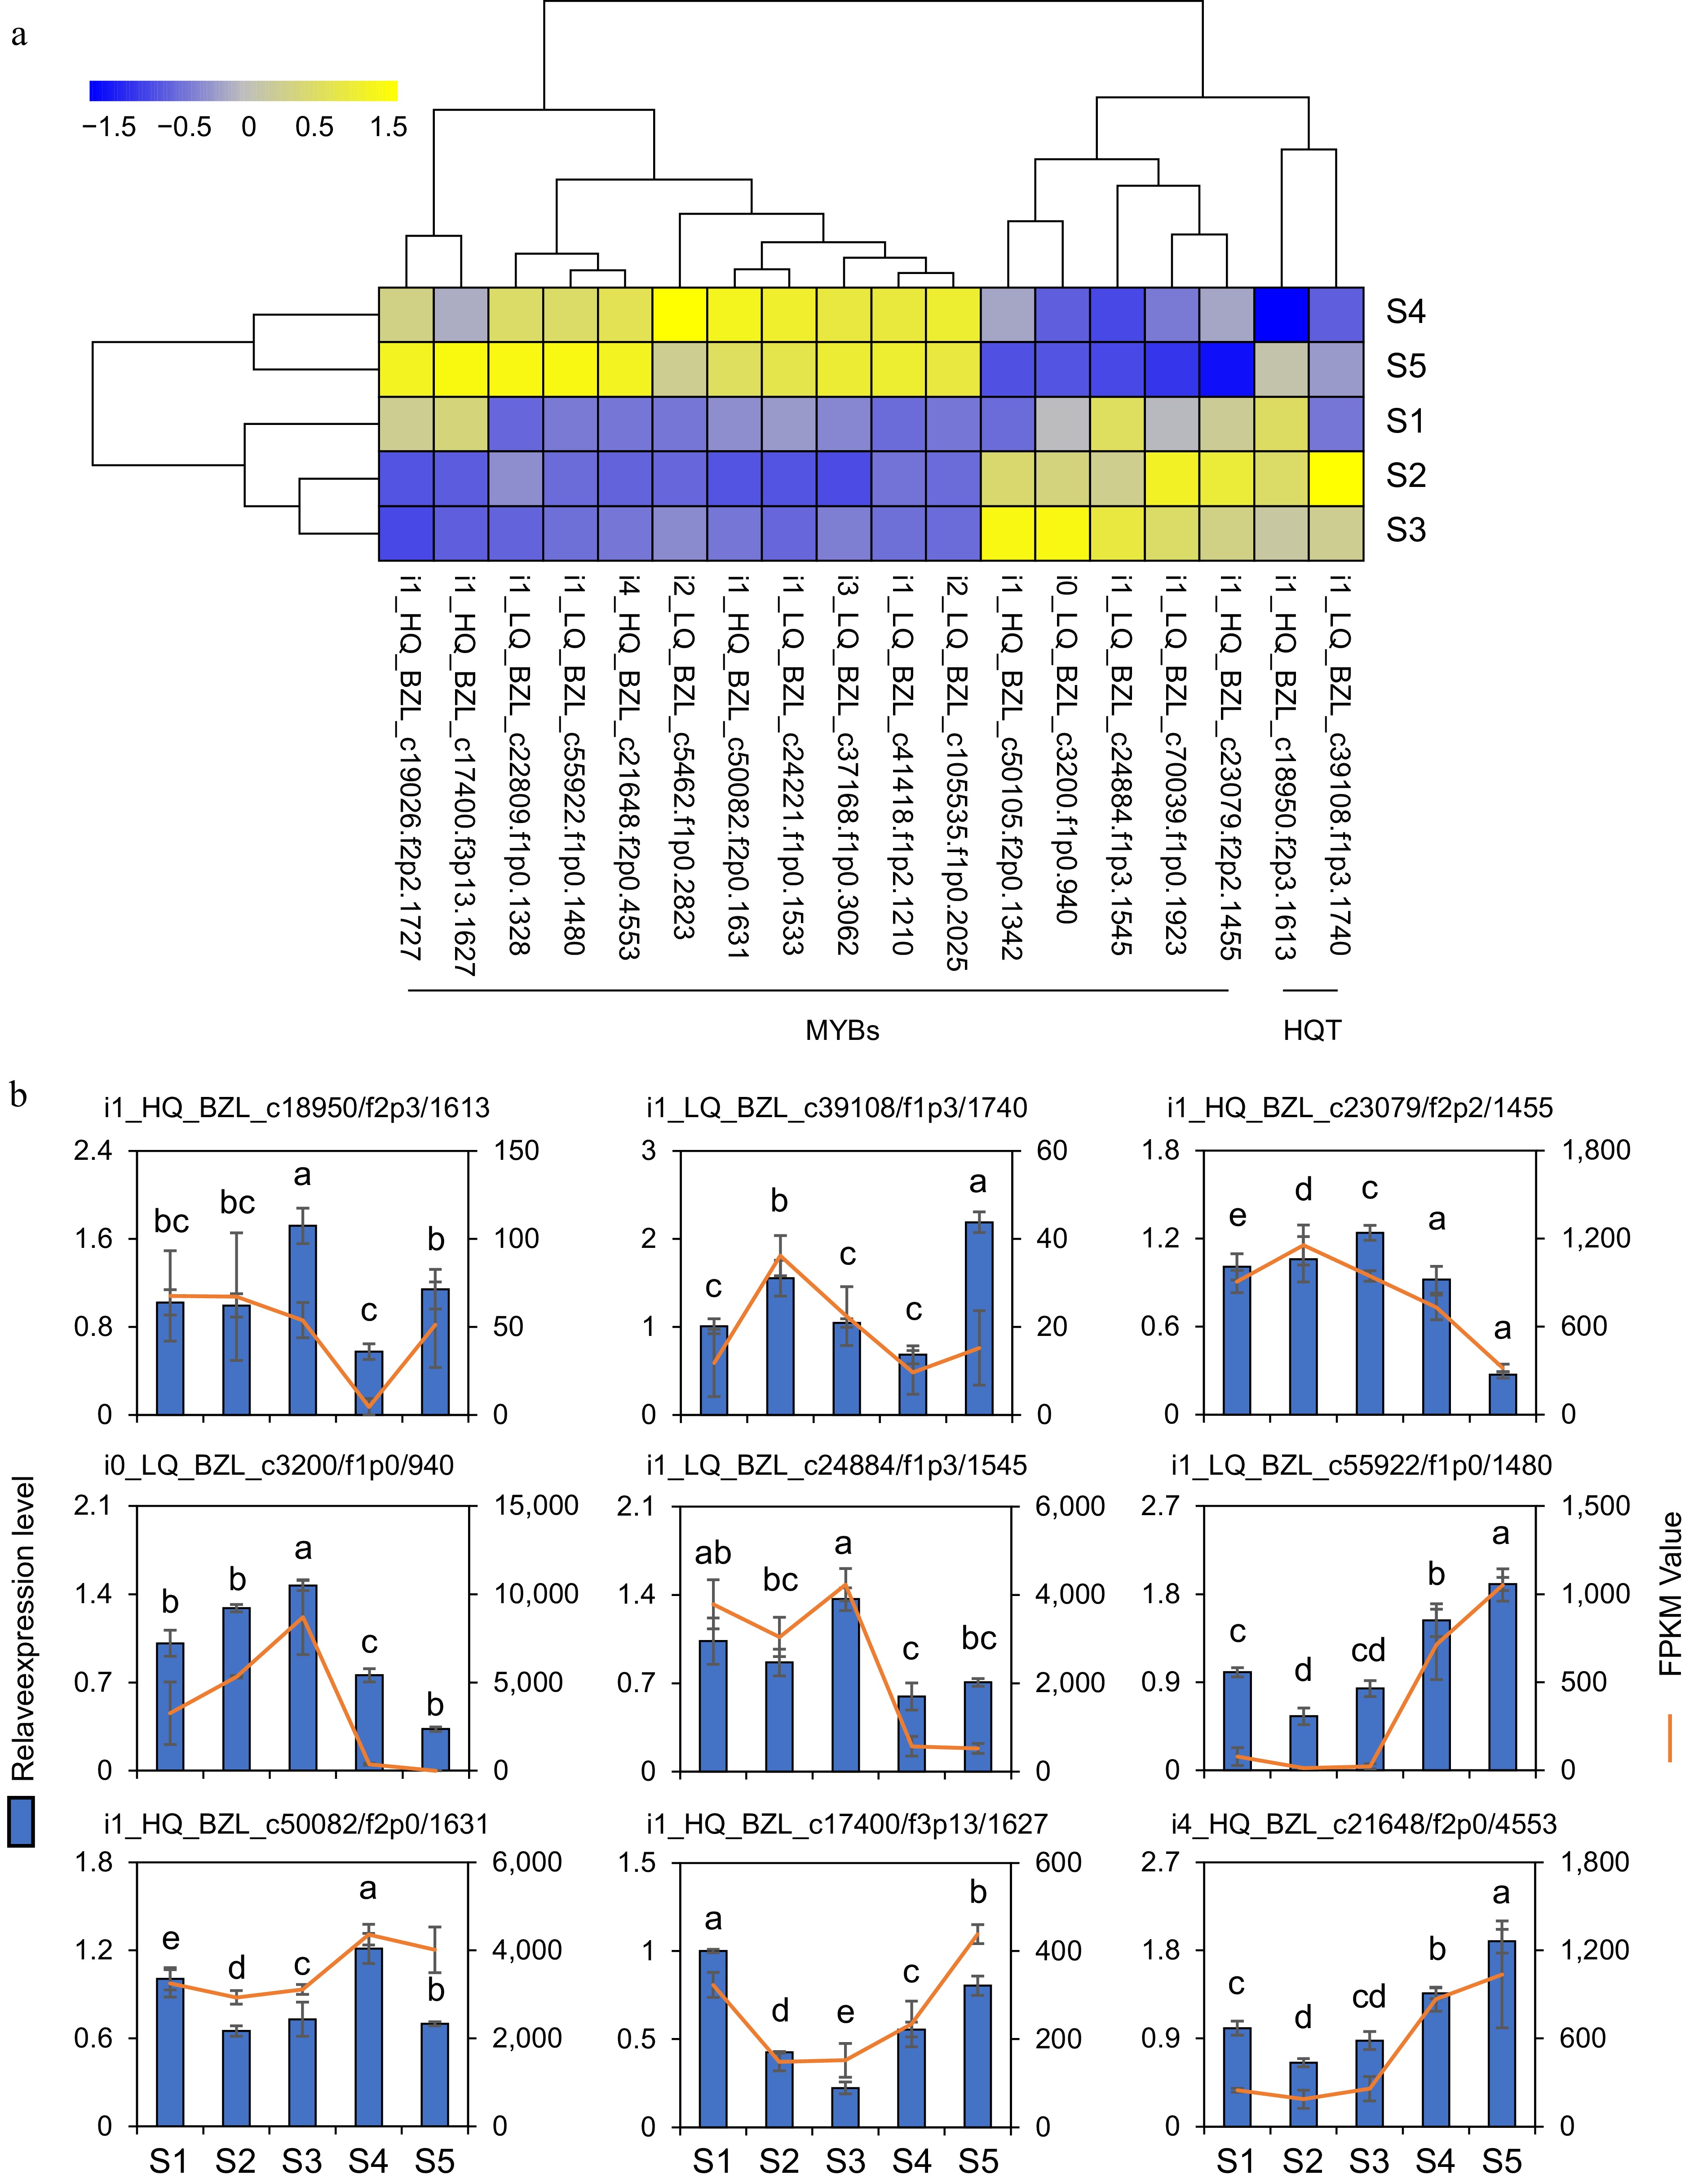
Figure 7.
Gene expression analysis. (a) The heatmap shows the expression profiles of 16 MYB transcription factors and two HQT genes based on FPKM values. (b) Expression changes of two HQT genes and 7 MYB DEGs in flowers at five developmental stages. The line charts represent gene expression levels derived from RNA-seq data using FPKM normalization. The bar charts represent corresponding gene expression levels quantified by qRT-PCR. The data represent the mean ± SE of three replicates (n = 3). Different letters in the graph indicated significant differences between groups (one-way ANOVA, Fisher's LSD test, p < 0.05).
Figures
(7)
Tables
(0)