-
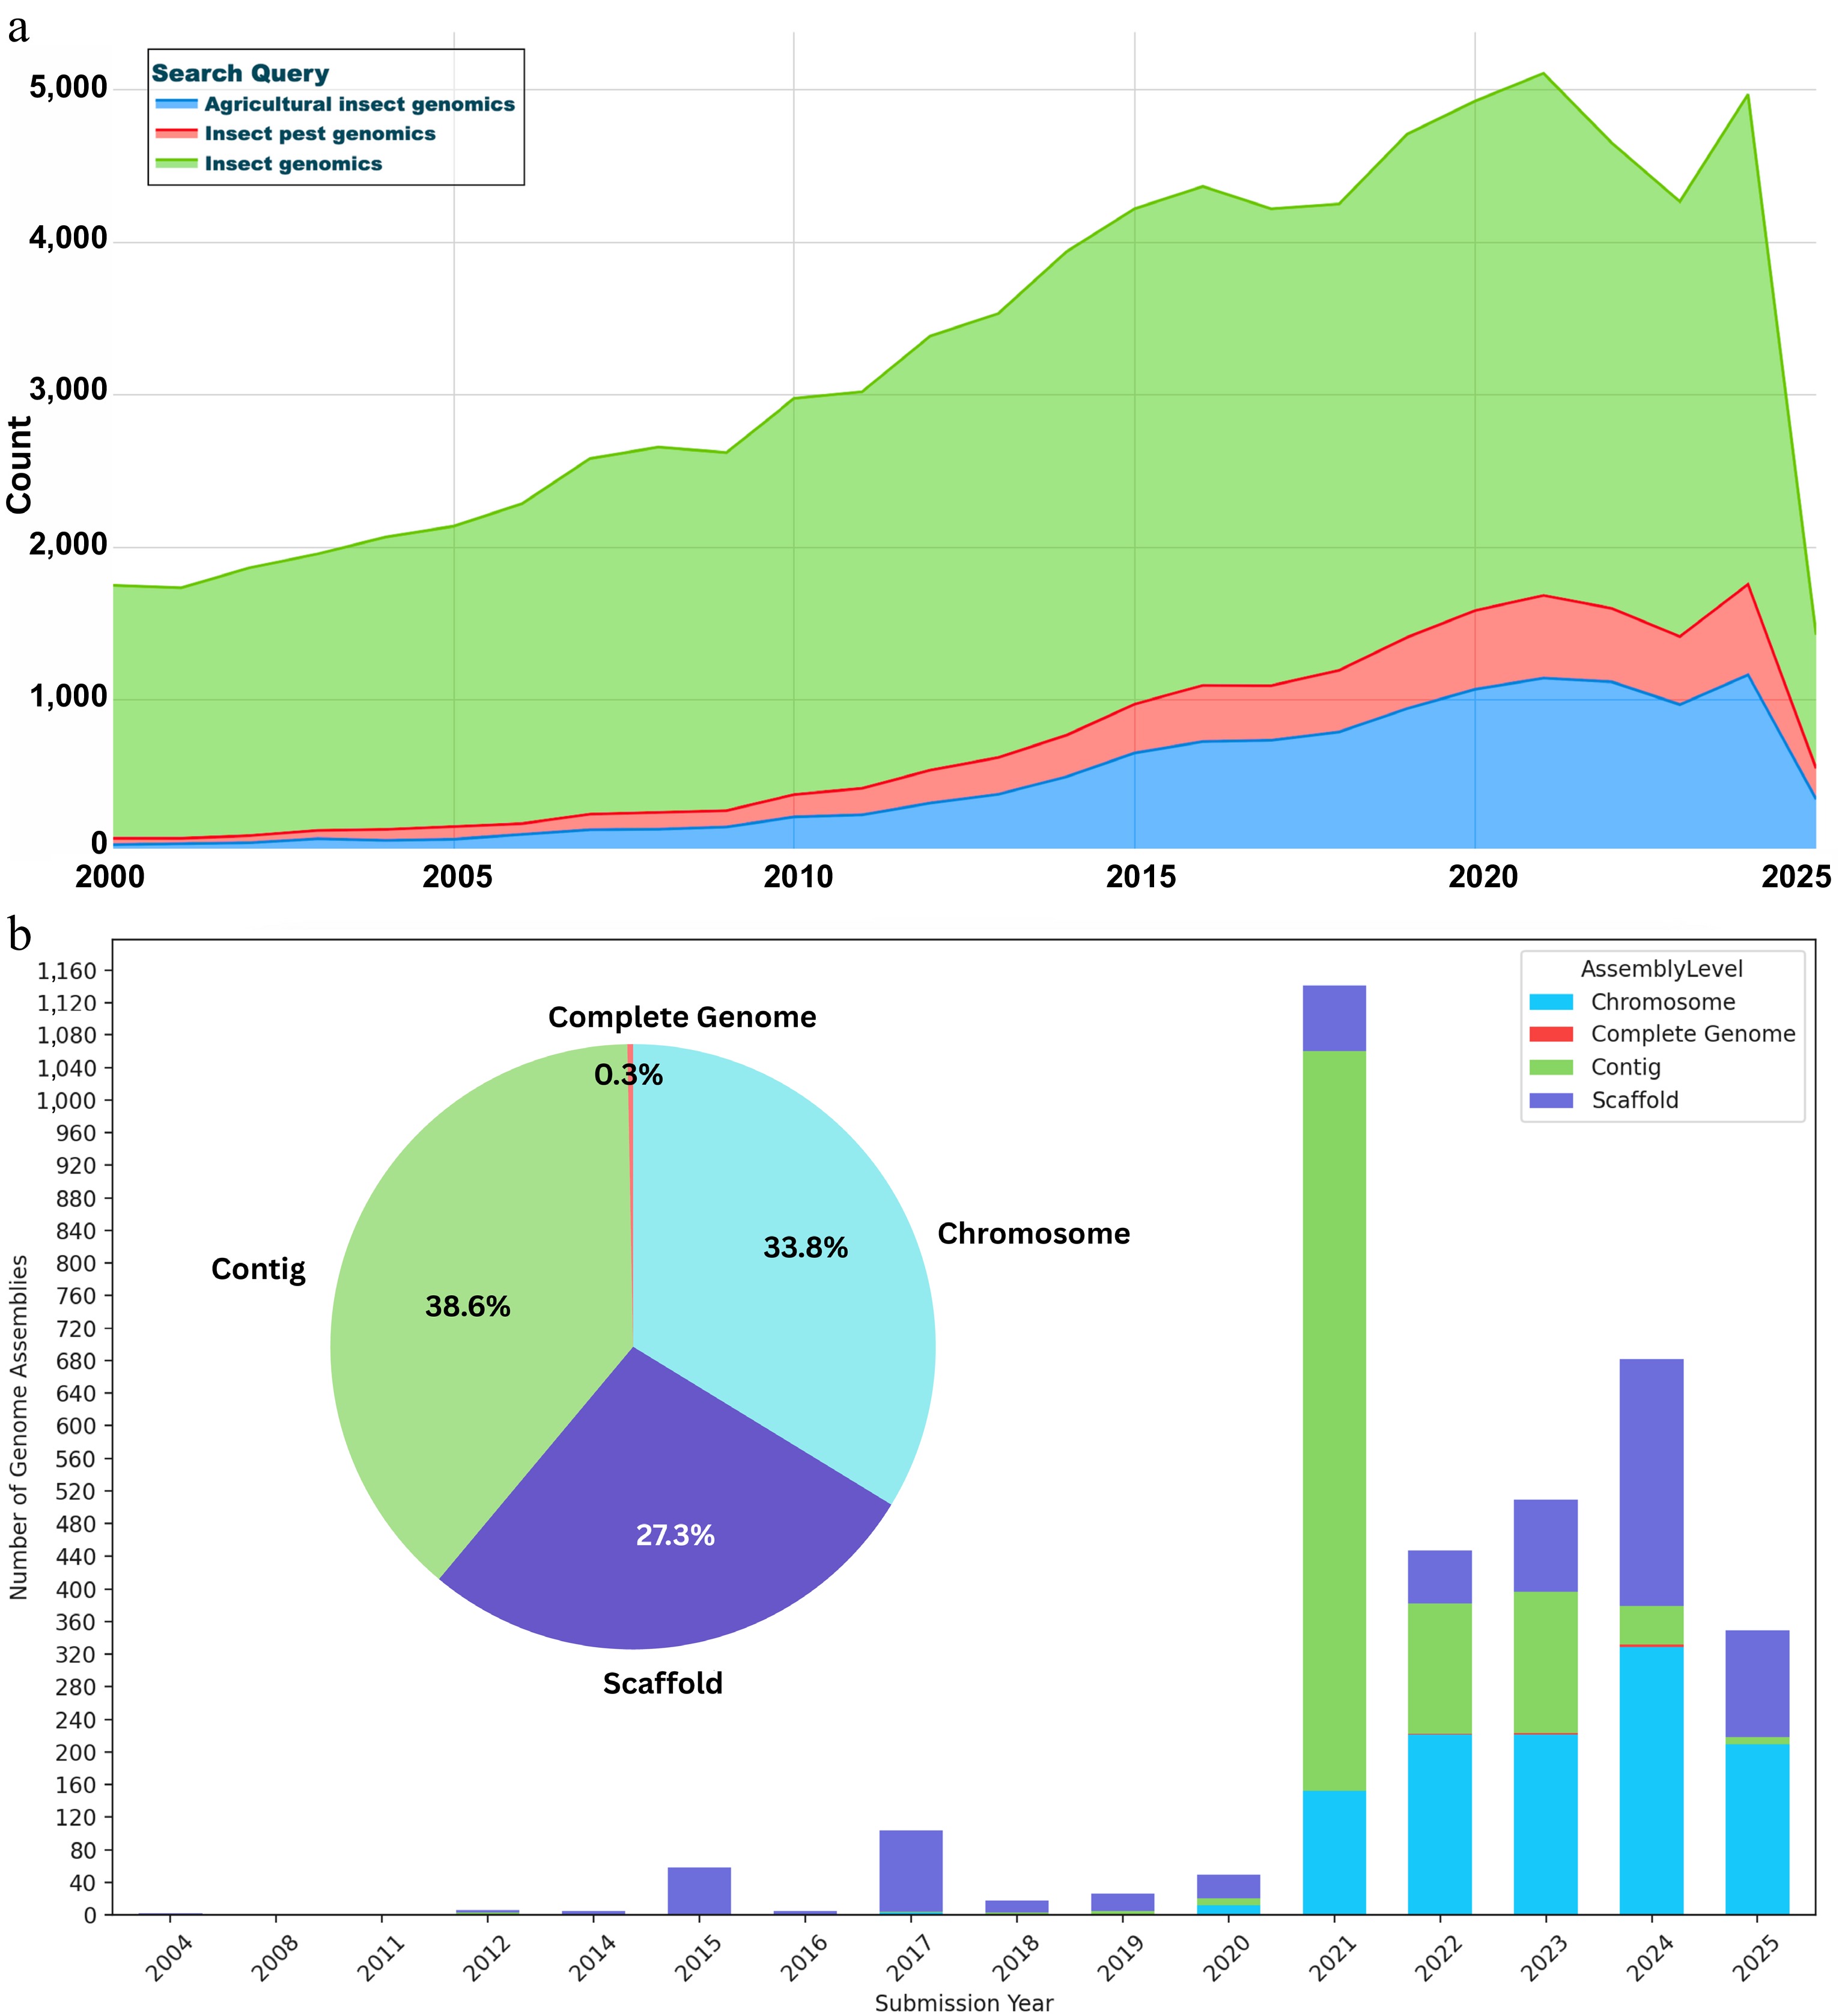
Figure 1.
Trends in insect genomics research and genomic resources. (a) Publication trends in insect genomics from PubMed. The number of publications per year (as of 13 April 2025) was retrieved using the search query (insect genomics/insect genome/insect genome sequencing) in PubMed. The trend highlights the growing academic focus on insect genomics over the past two decades, with notable surges coinciding with the adoption of next-generation and third-generation sequencing technologies. (b) Cumulative count of publicly available nuclear genomes of insects, dominated by agro-economical insects, classified as complete, chromosome, scaffold, and contig-level genomes. Data were retrieved from the NCBI Assembly database (as of 12 April 2025) by searching for nuclear genomes associated with insect species classified as agricultural pests.
-
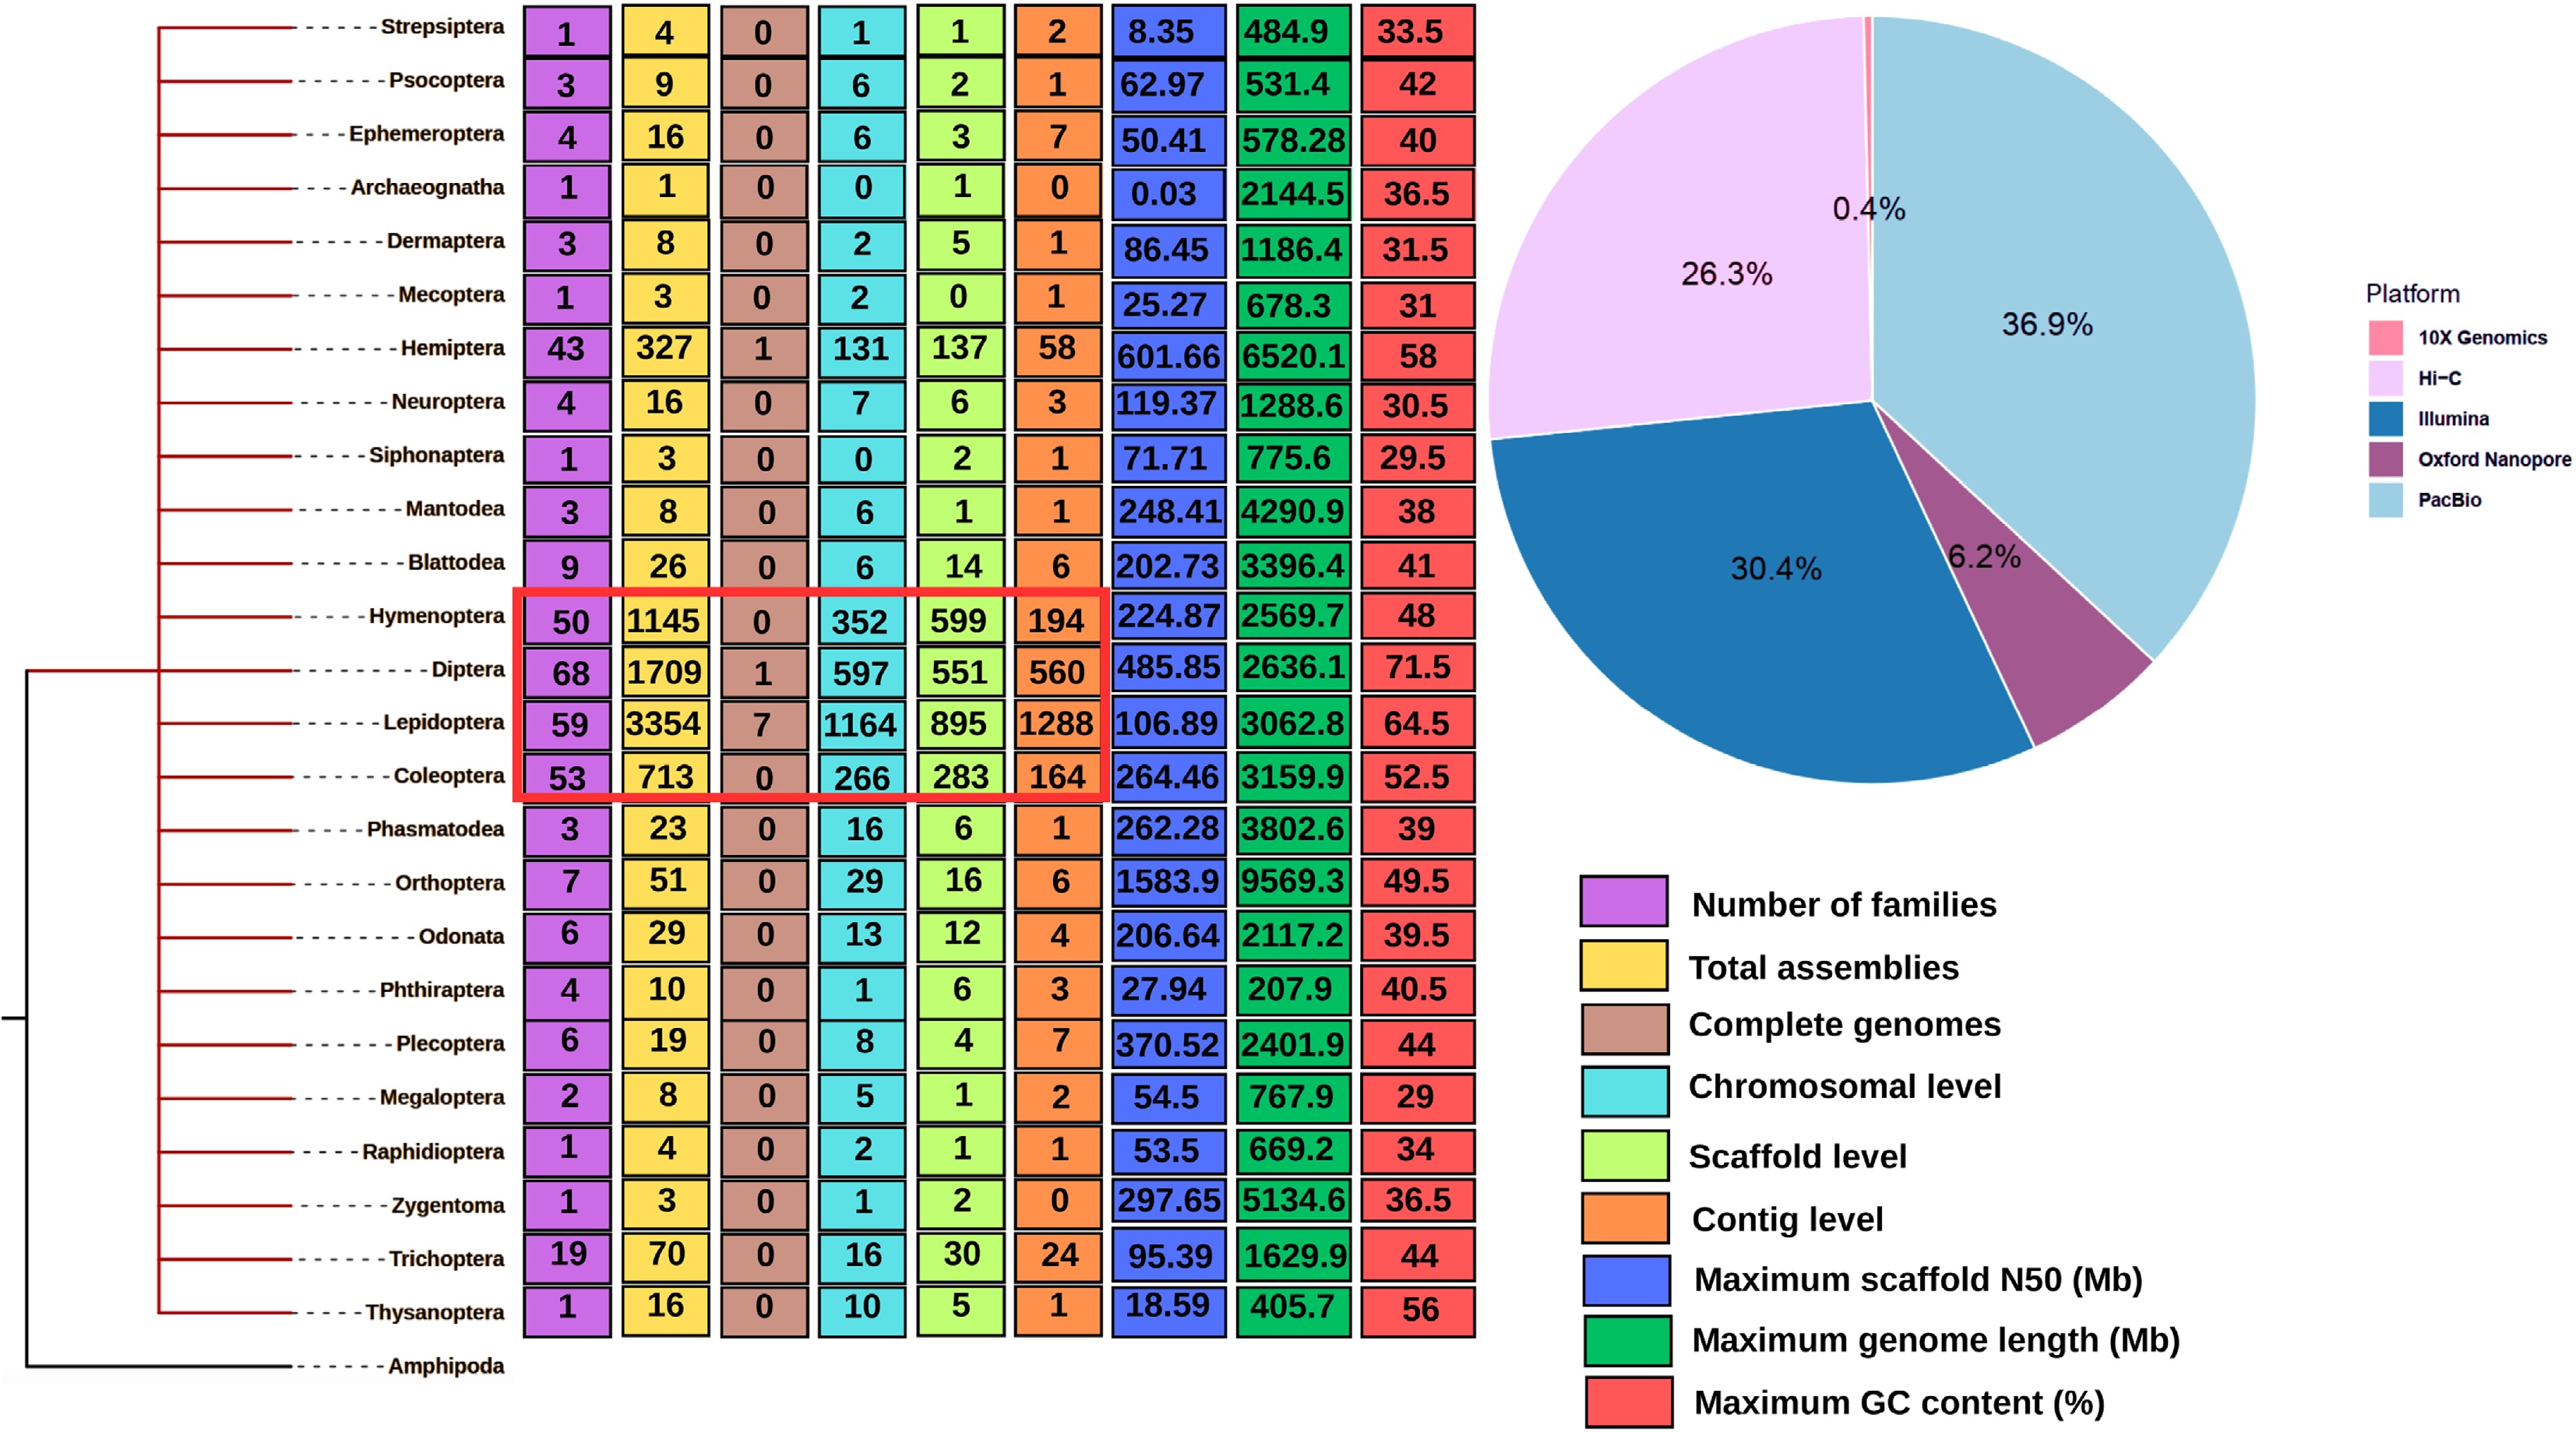
Figure 2.
Phylogenetic tree representing 25 insect orders for which nuclear genome assemblies are publicly available in the NCBI database. The tree is rooted with Amphipoda, which, while not an insect order, serves as an appropriate outgroup for comparative purposes. Each order is annotated with the number of insect families that have at least one genome sequenced, as well as proportions reflecting the genome assembly's level such as contig, scaffold, and chromosome-scale. Additional annotations include the maximum scaffold N50, contig N50, and GC content observed for each order. Insect orders with dominant representation at higher assembly levels are highlighted in red. The pie chart alongside the tree summarizes the relative distribution of major sequencing technologies such as Illumina, PacBio HiFi, Oxford Nanopore, 10X Genomics, and Hi-C used across these genome projects.
-
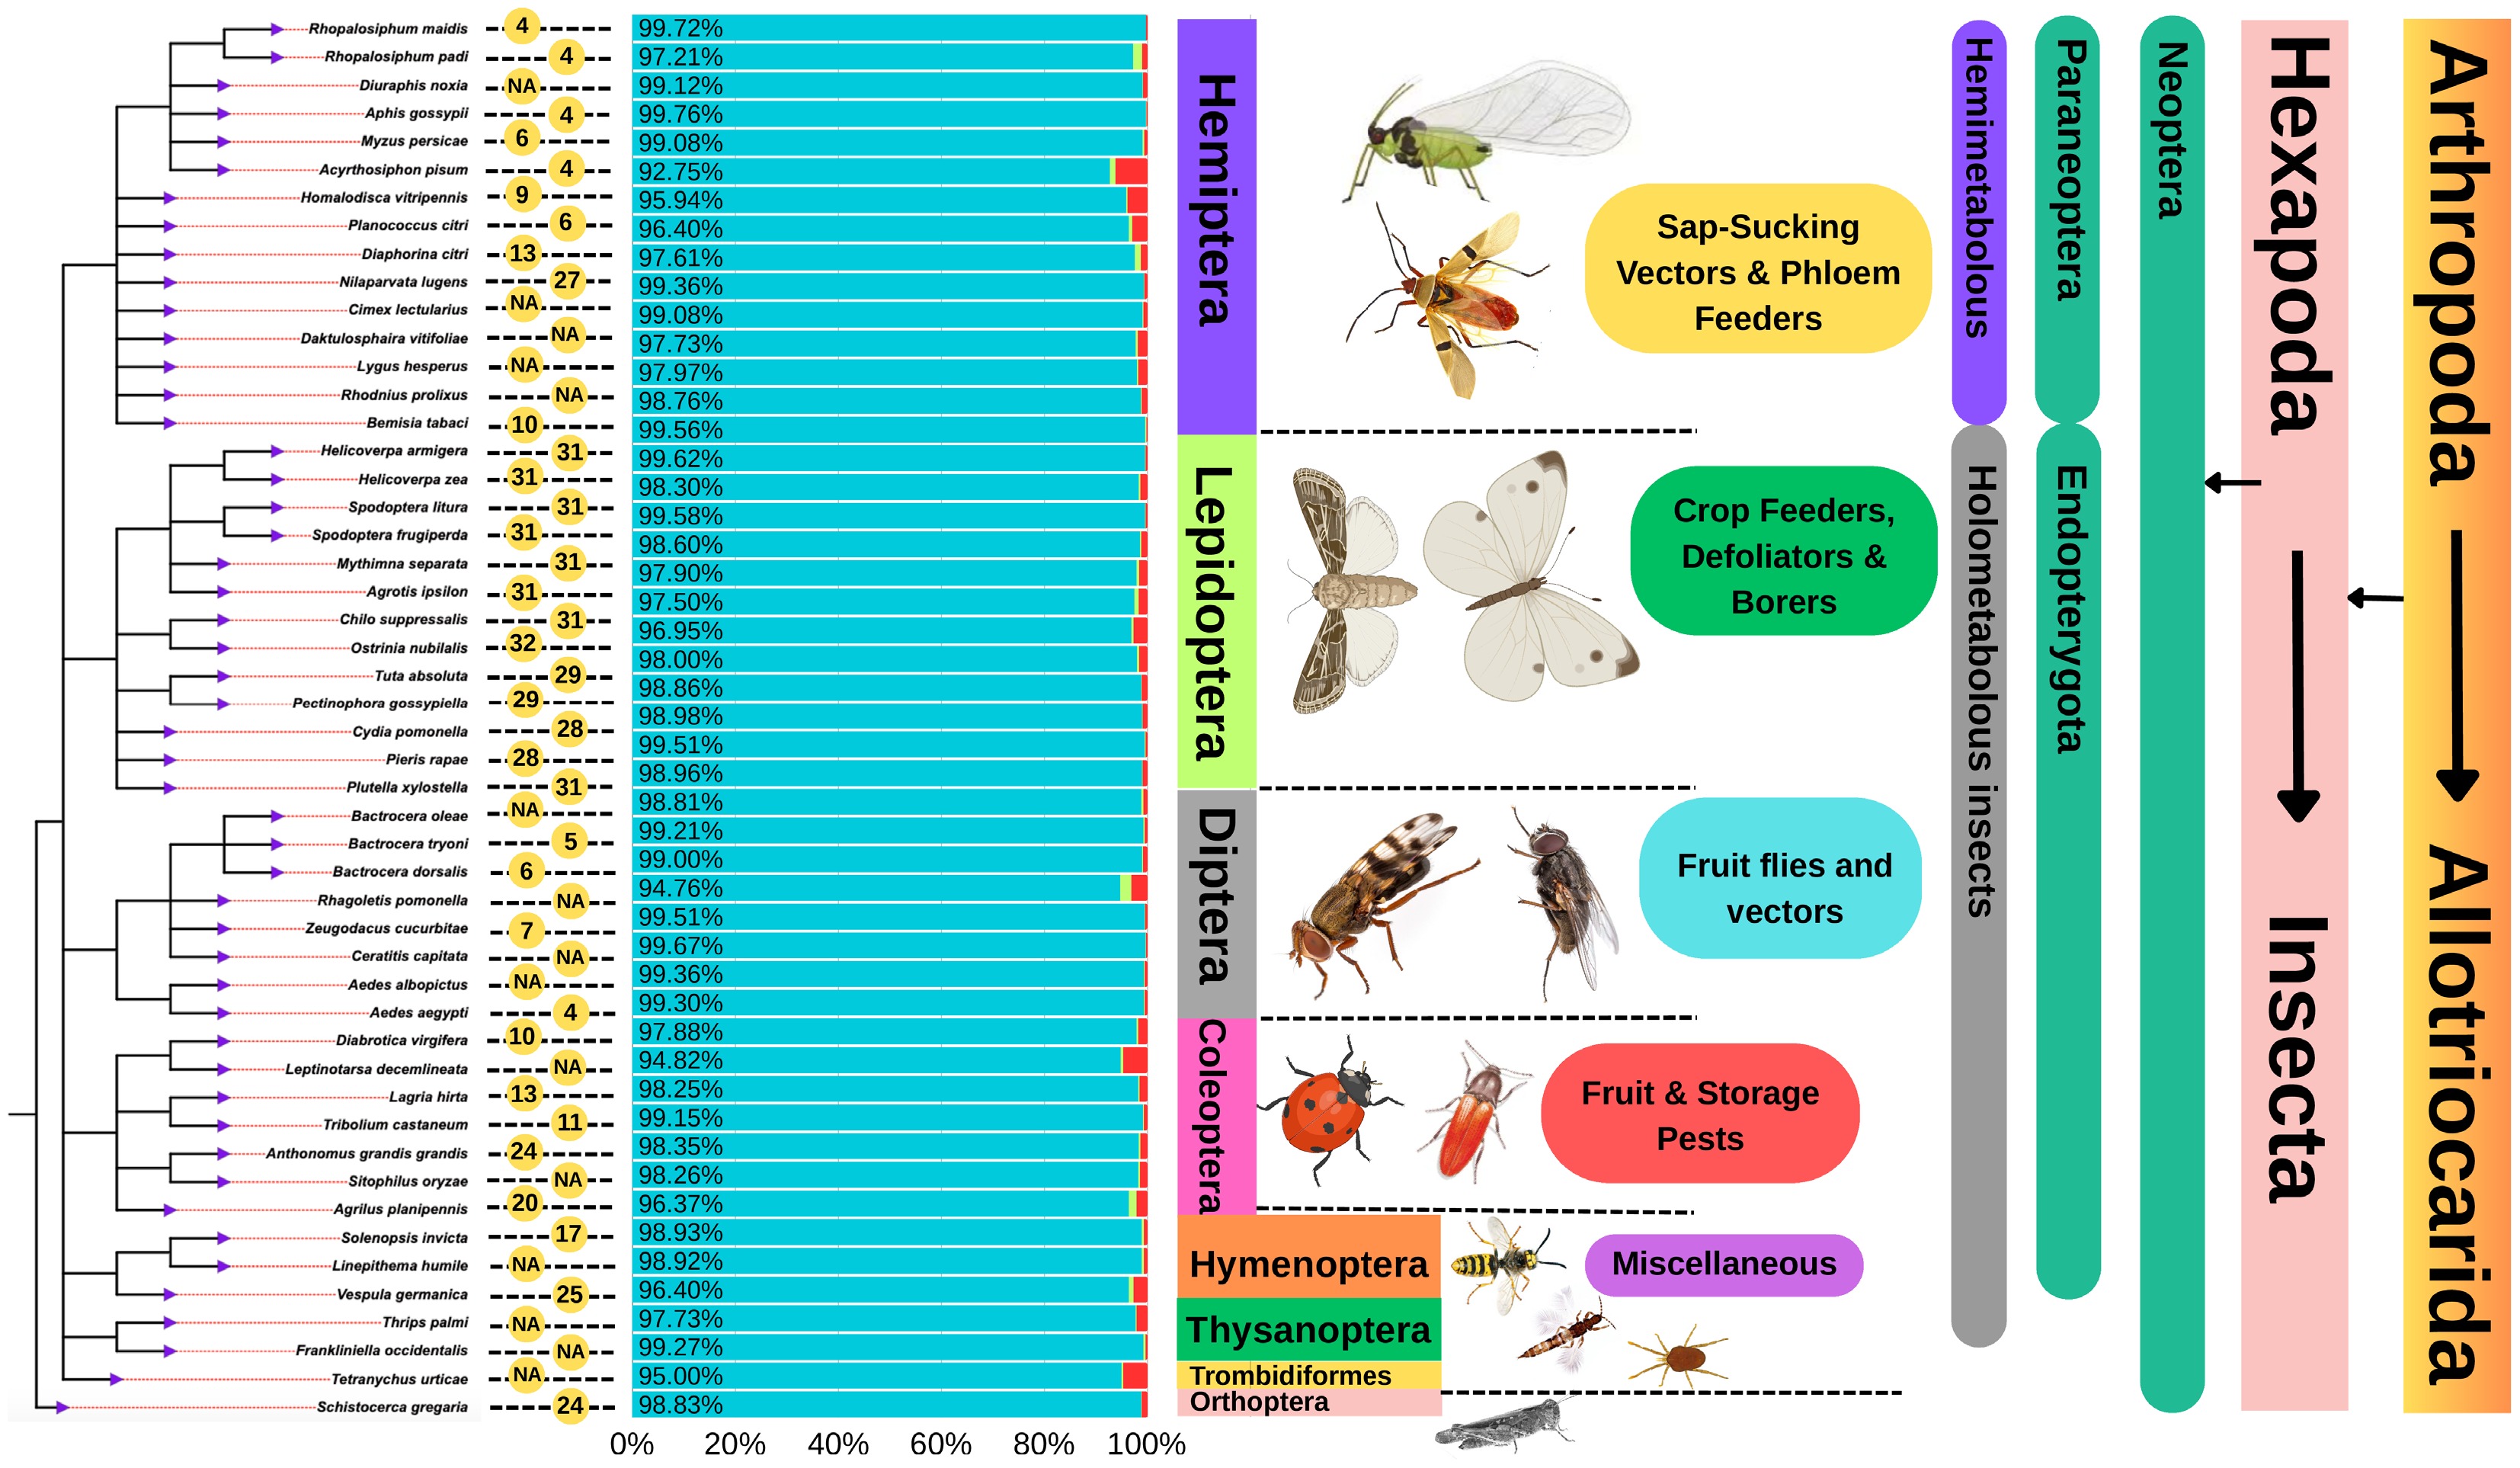
Figure 3.
Phylogenetic tree of 50 representative insect species with publicly available genome assemblies, based on data retrieved from the NCBI and Insectbase databases. The tree is rooted with Schistocerca gregaria (Orthoptera) and annotated with key genomic and taxonomic information. Yellow circles indicate the number of chromosomes per species (NA denotes unavailable chromosome data). BUSCO bar graphs accompany each species, with blue bars representing complete BUSCOs, light green indicating duplicated BUSCOs, and red showing missing BUSCOs, reflecting genomes' completeness and quality. The tree is further annotated with hierarchical classifications, including phylum, subphylum, clade, class, and family; developmental type (e.g., hemimetabolous or holometabolous); and body morphology. Taxonomic classifications have been adapted from publicly available sources, including Wikipedia and NCBI Taxonomy.
-
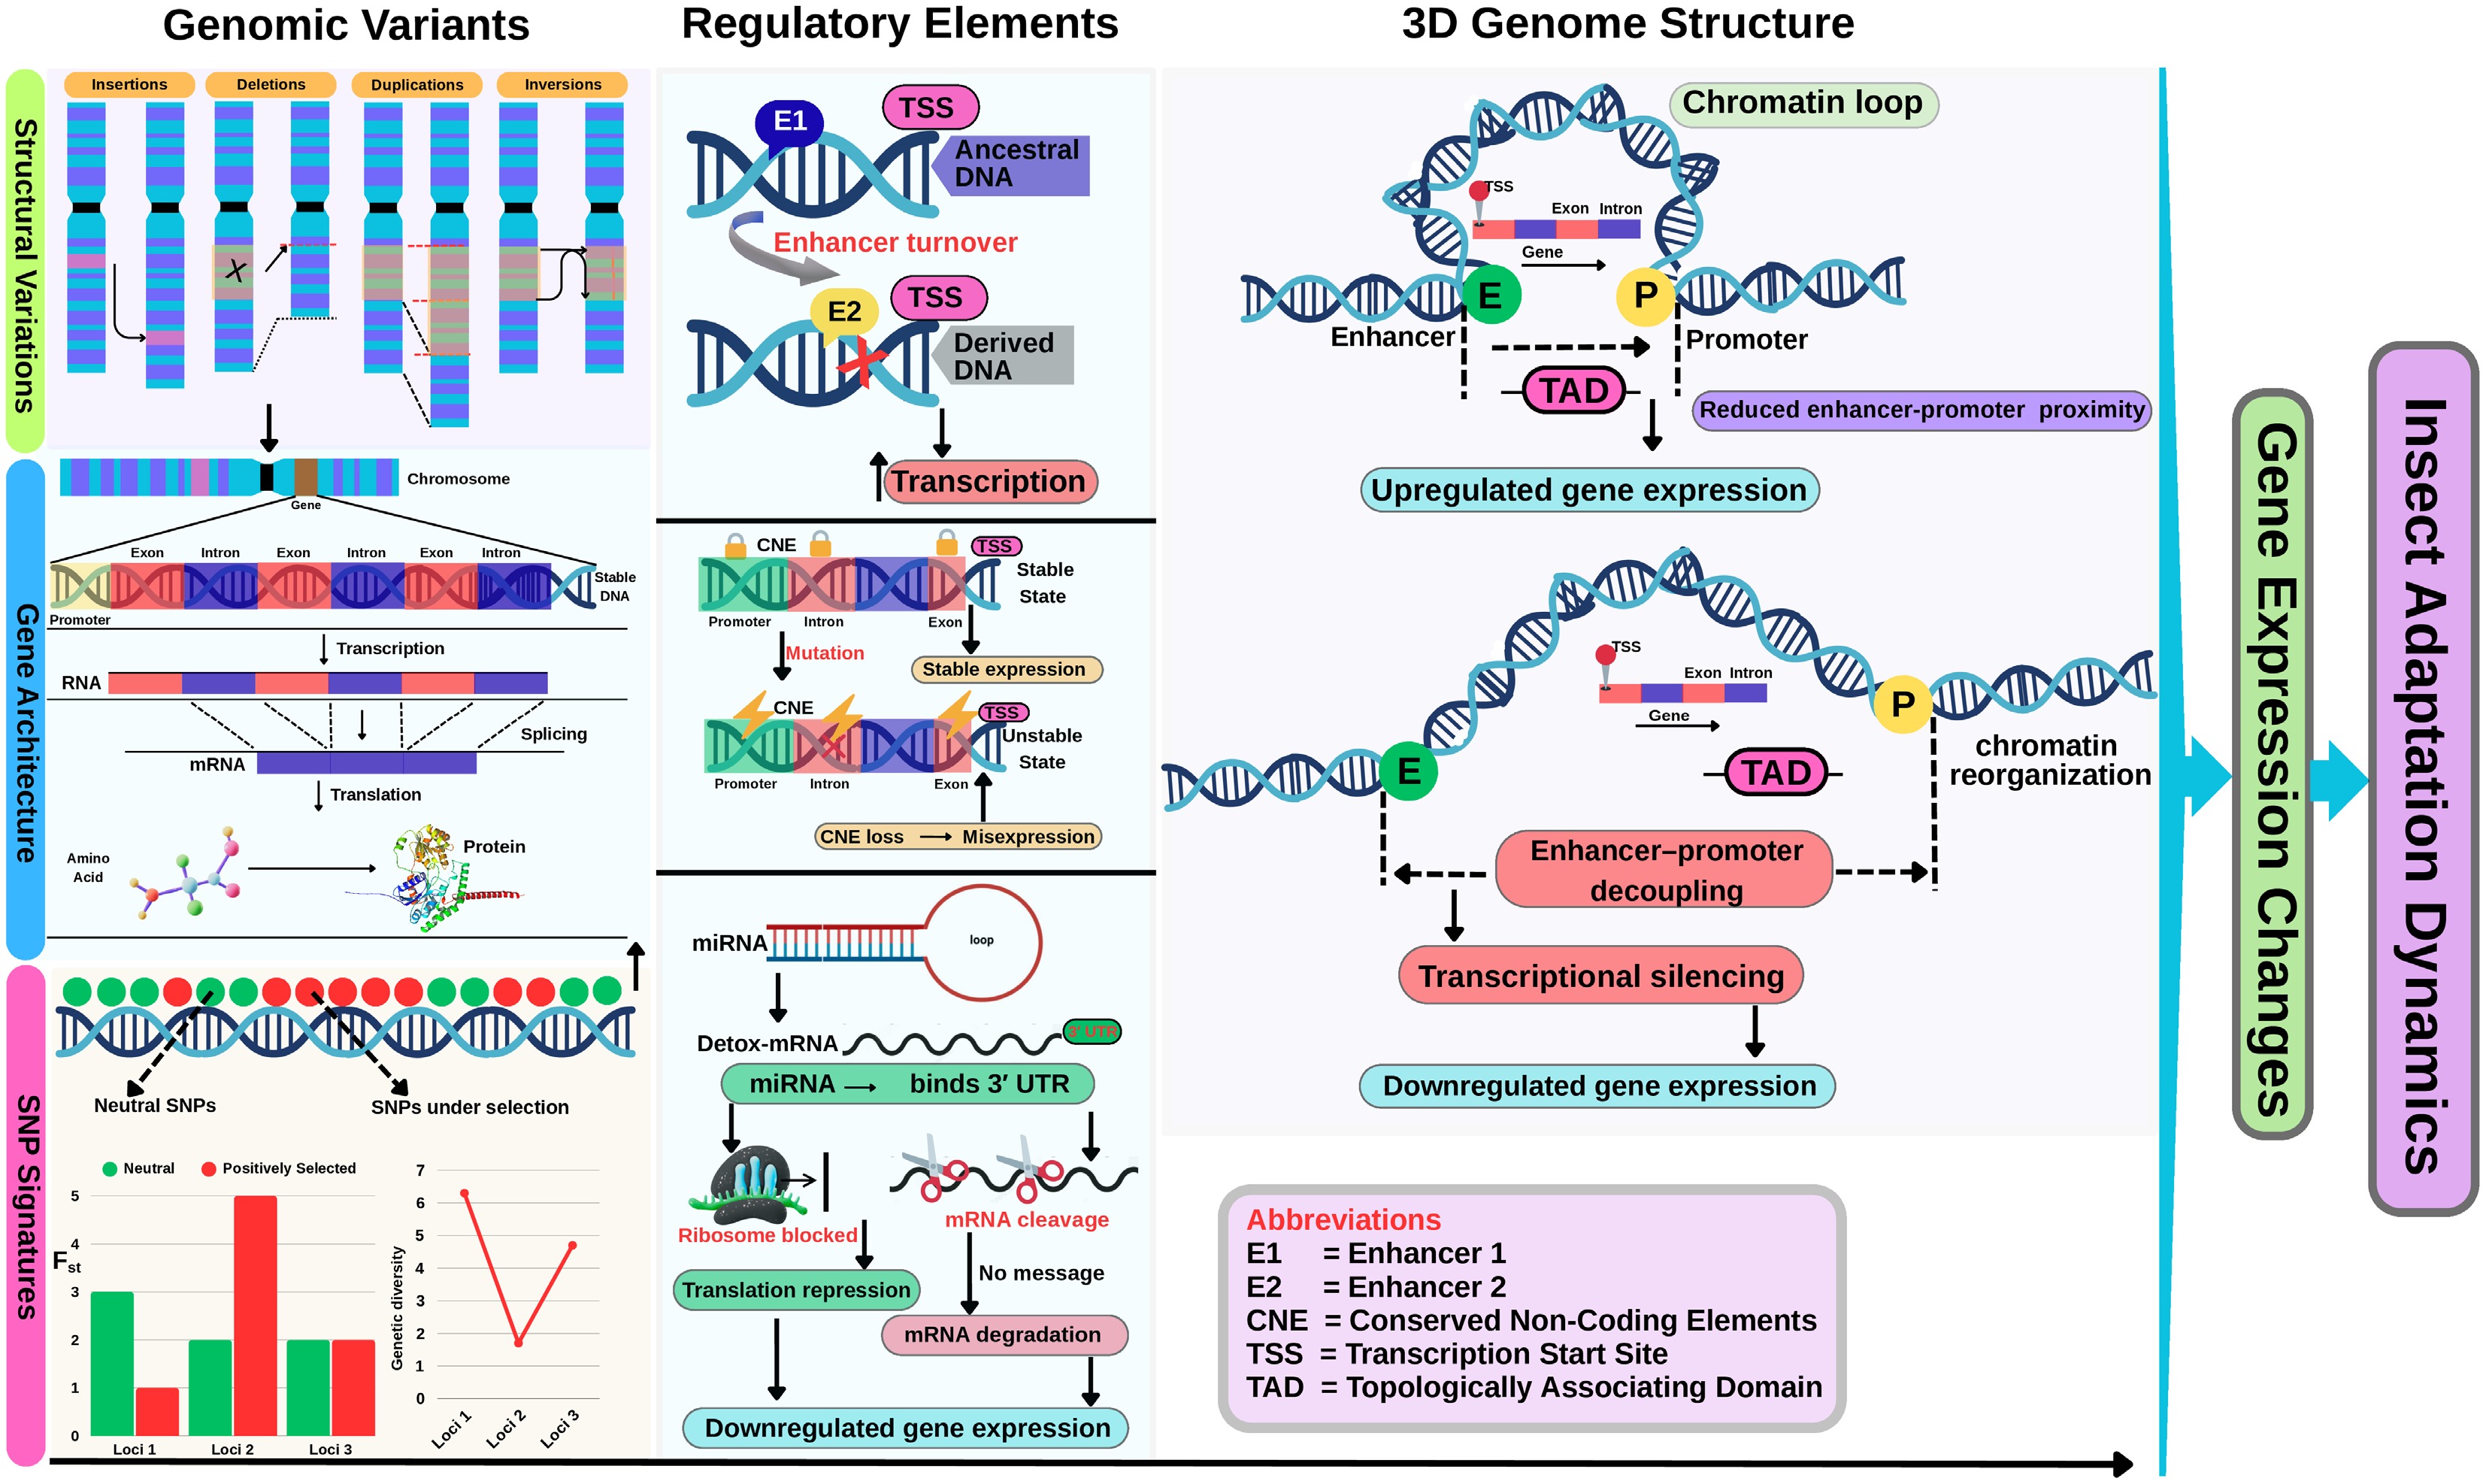
Figure 4.
Important dimensions driving genomic divergence and gene regulation in insects. This figure integrates three major layers. First, genomic variants such as structural variants (insertions, deletions, duplications, inversions) and SNPs can reshape genes' architecture by altering exon–intron structures, splicing patterns, and transcriptional activity. Second, regulatory elements, including enhancers, conserved noncoding elements (CNEs), and microRNAs (miRNAs), modulate gene expression through multiple mechanisms; for instance, enhancer gain/loss affects transcription initiation, CNE mutations may lead to misexpression, and miRNAs regulate gene expression post-transcriptionally by repressing translation or mRNA degradation. Third, the 3D chromatin architecture shows how the genome folds into topologically associating domains (TADs), bringing enhancers and promoters into physical proximity to promote transcription. Disruption of these 3D structures can impair regulatory interactions and lead to altered expression. Collectively, these layers illustrate how genomic, regulatory, and structural mechanisms converge to drive adaptive and evolutionary responses in insect genomes, which directly influence their adaptation dynamics.
-
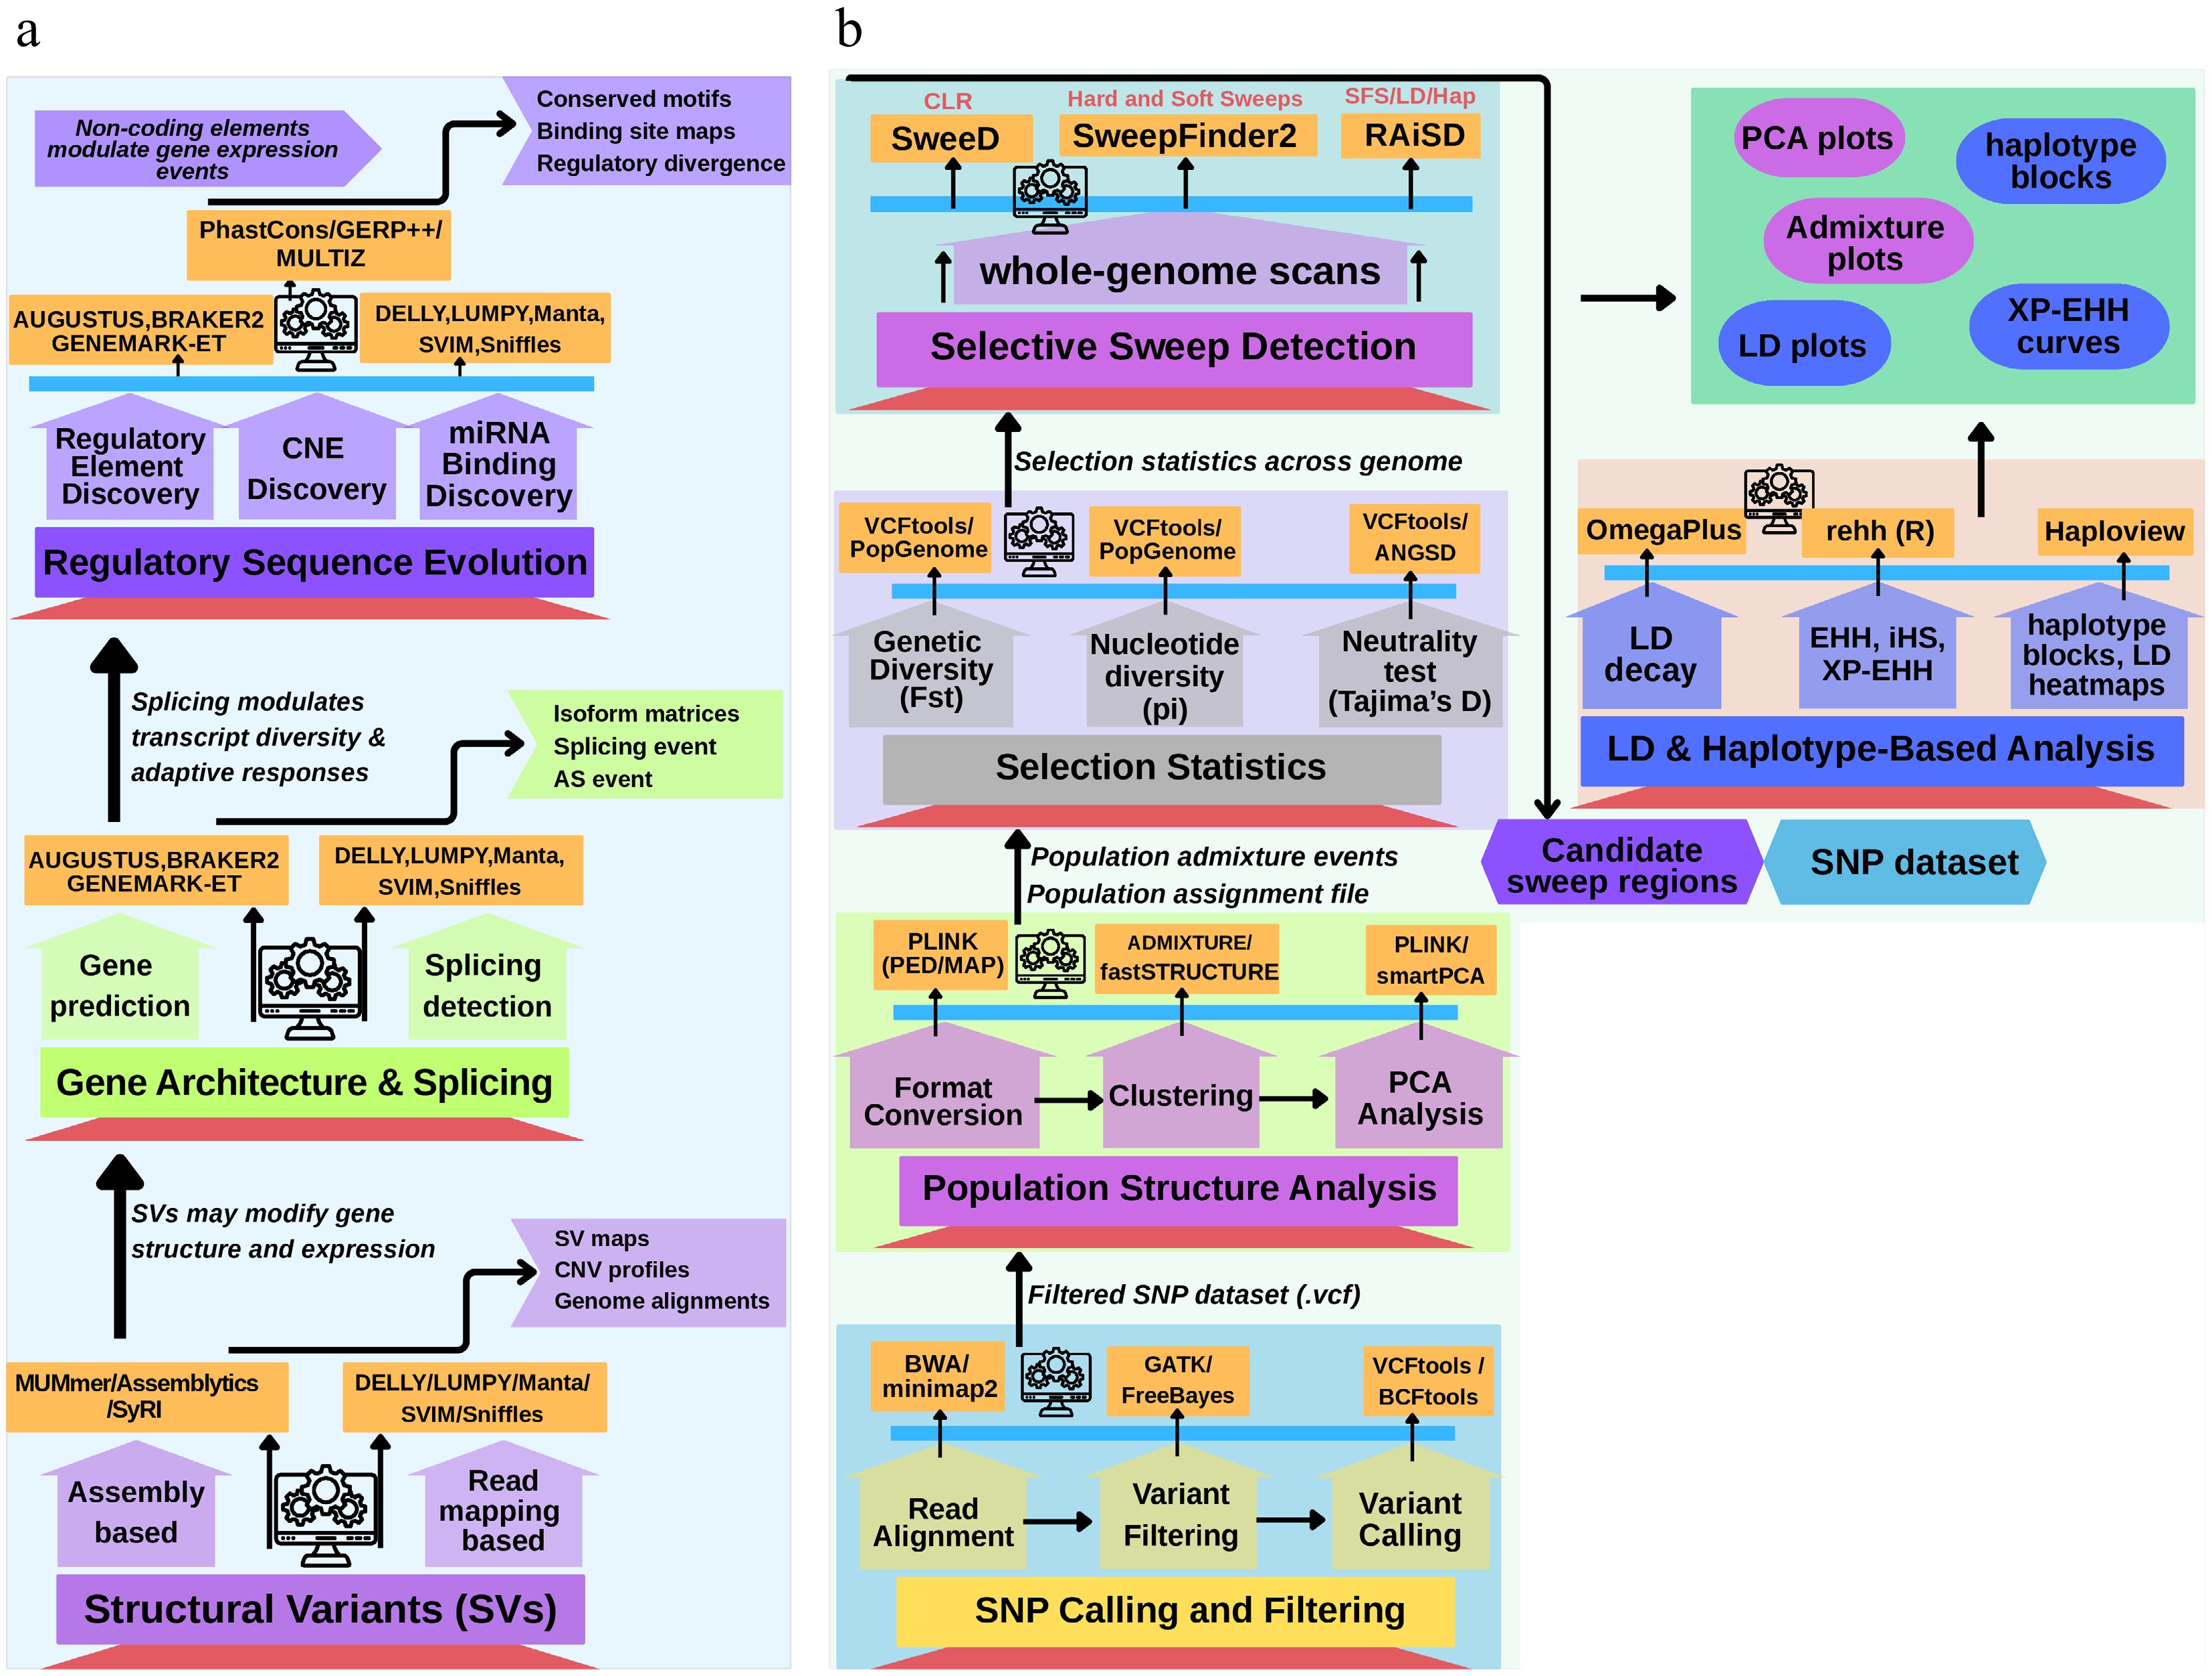
Figure 5.
Multi-scale genomic tools for detecting adaptive evolution in insect pests. This schematic illustrates a tiered framework highlighting the major genomic layers contributing to insect pests' adaptation, along with the corresponding analytical tools and biological outputs at each level. Starting with Panel (a), Tier 1 showcases how structural variants (SVs), detected using tools such as DELLY, Manta, Assemblytics, and MUMmer, can reshape genomes' architecture and influence gene expression, yielding structural variant maps and genome alignments. Tier 2 focuses on alternative splicing and exon–intron variation, where tools like rMATS, SUPPA2, MAJIQ, and IsoSeq uncover isoforms' diversity and splicing event profiles. Tier 3 concerns regulatory sequence evolution, including enhancer turnover, conserved noncoding elements (CNEs), and miRNA binding changes, analyzed with PhastCons, GERP, MEME, FIMO, miRanda, and TargetScan to reveal transcriptional rewiring and binding site alterations. Panel (b) focuses on the detection of adaptive evolution through single nucleotide polymorphisms (SNPs), using pipelines such as GATK, PopGenome, ANGSD, RAiSD, rehh, and ADMIXTURE, alongside various tools to infer selective sweeps, population divergence, and haplotype dynamics. Collectively, this integrative approach demonstrates how layered genomic methodologies uncover the complex mechanisms underlying pest evolution and resistance.
-
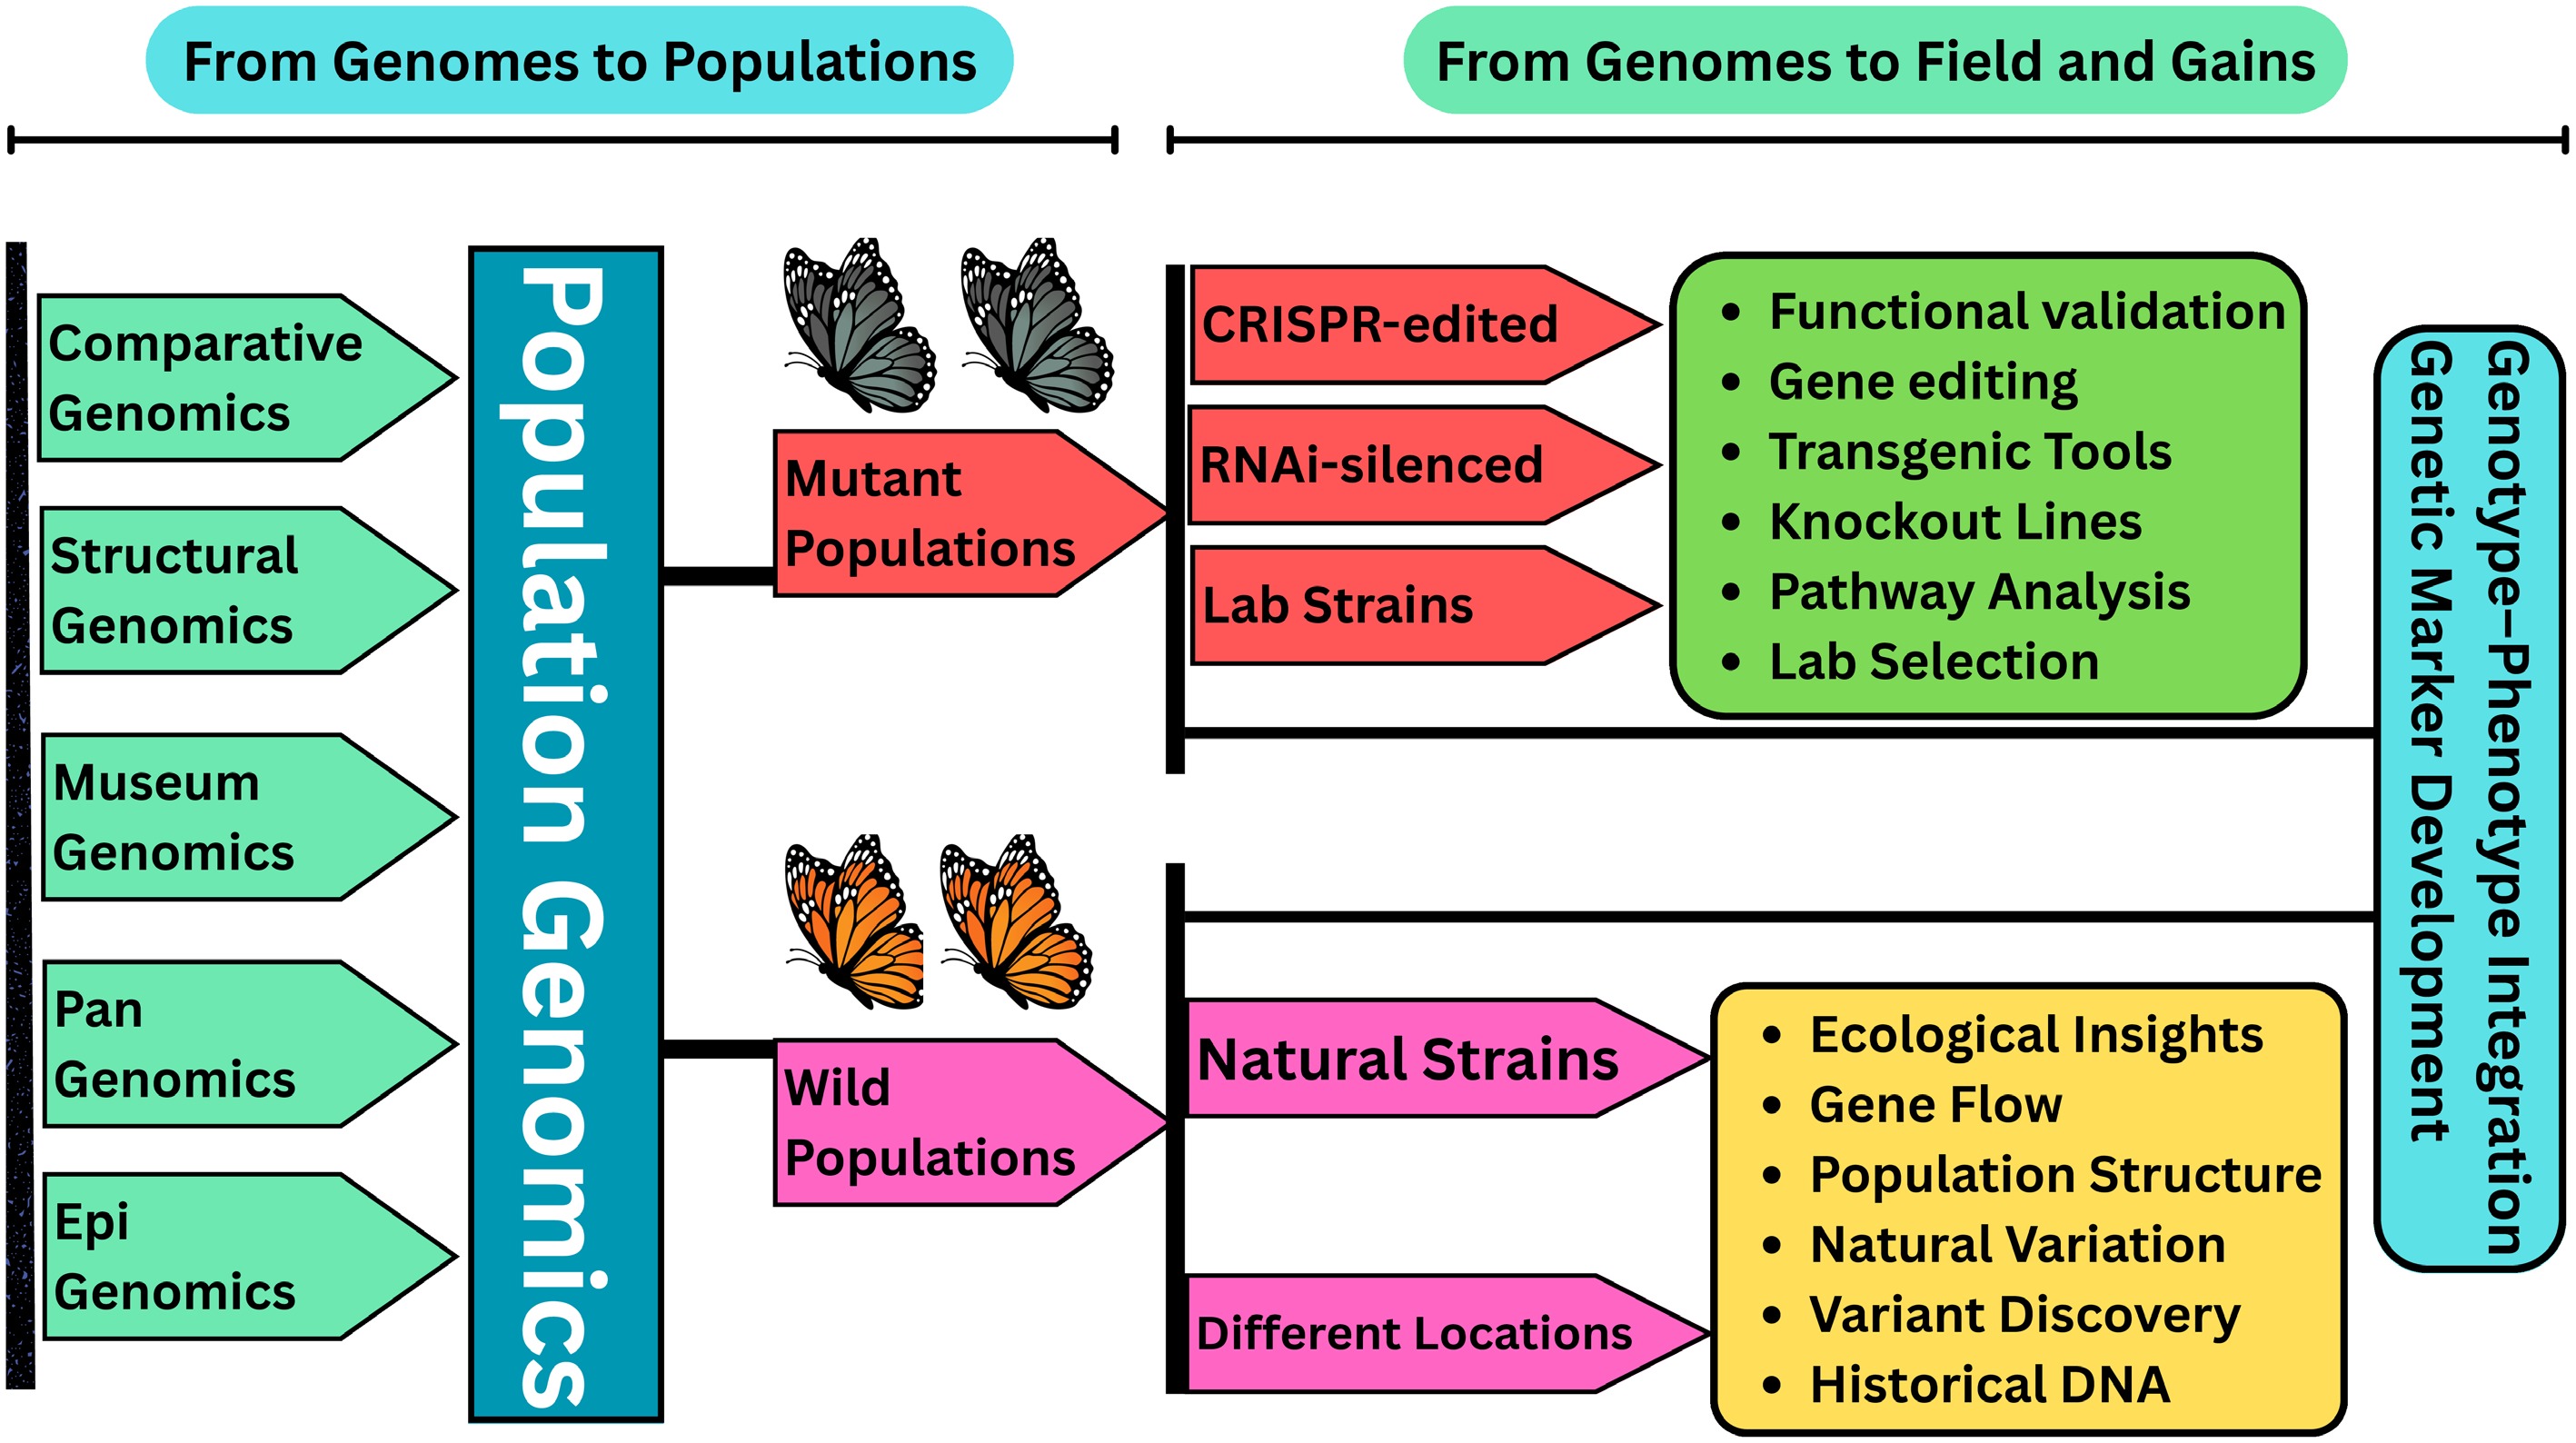
Figure 6.
Conceptual tree depicting the progression from foundational genomics to applied outcomes in agricultural insect research. The base of the tree represents genomic disciplines such as comparative genomics, structural genomics, museum genomics, pangenomics, and epigenomics that form the foundation of insect genomic knowledge. These roots converge into the central trunk of population genomics, which captures genetic variation within and between populations. From this trunk emerge two primary branches representing insights from wild-type and mutant lineages, symbolizing the evolutionary and functional pathways explored through genomic tools. Wild-type and mutant strains are then applied in the real-world 'blossoms', ranging from improved pest control strategies such as RNAi and resistance monitoring to targeted trait development and sustainable agricultural practices. The figure underscores how integrative genomic approaches are translating molecular data into actionable solutions for agricultural pest management.
Figures
(6)
Tables
(0)