-
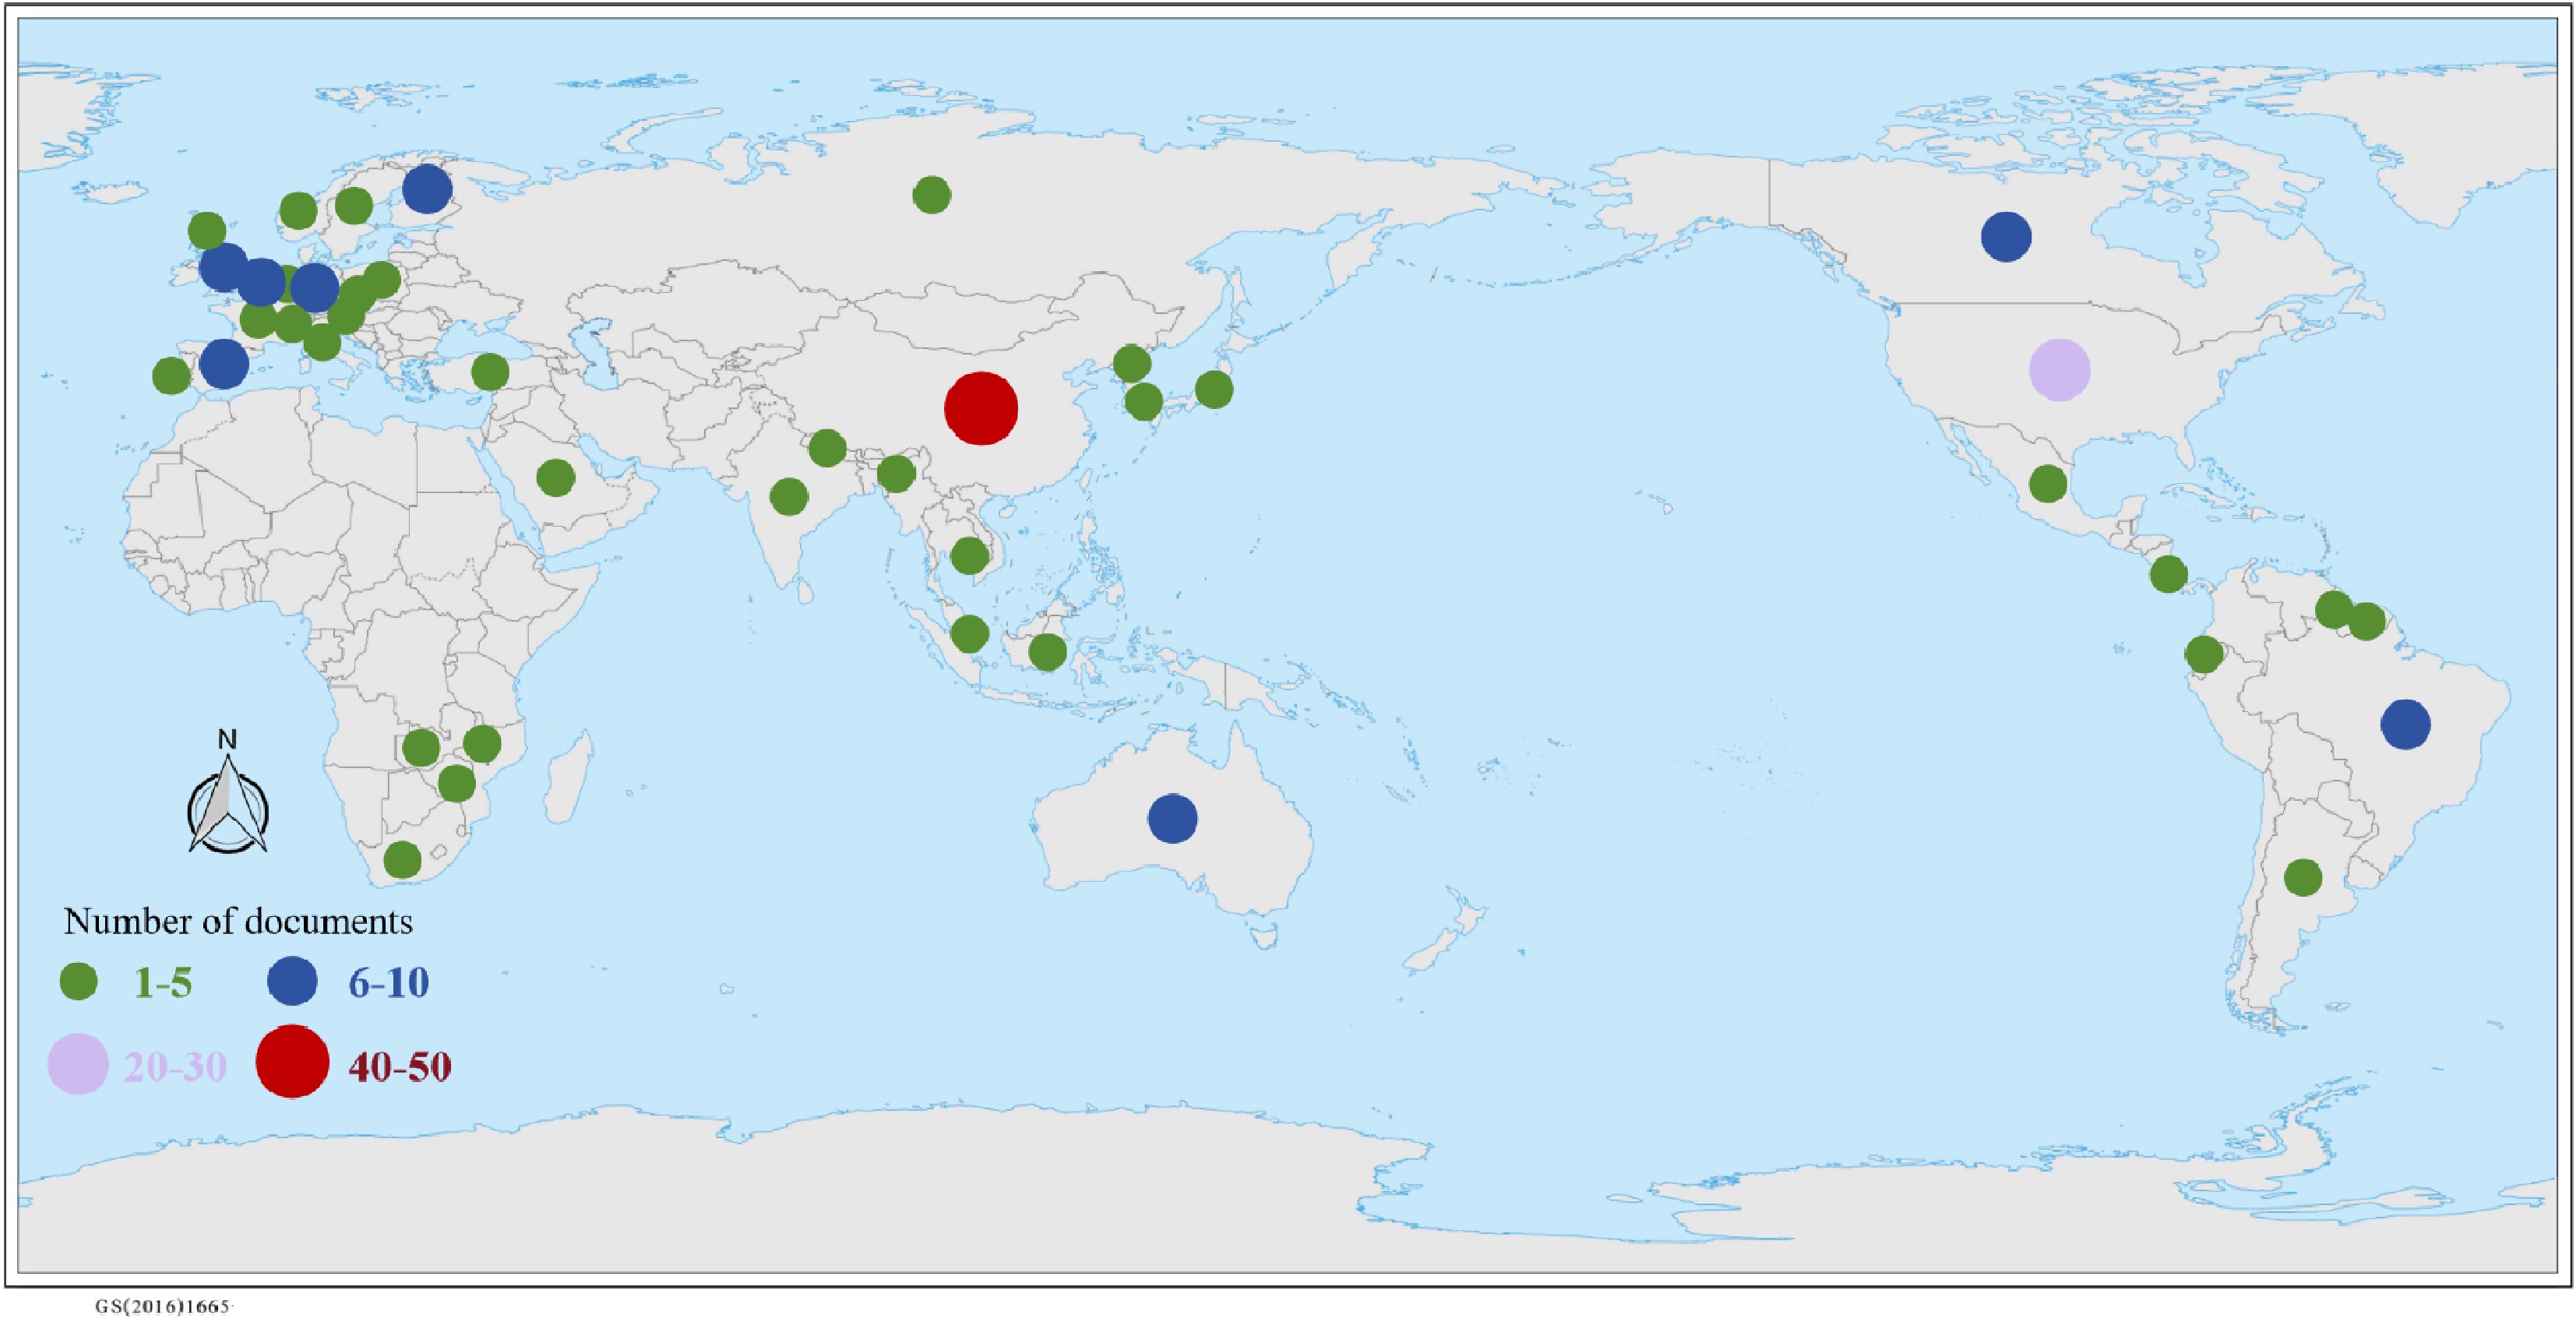
Figure 1.
Distribution of global literature.
-
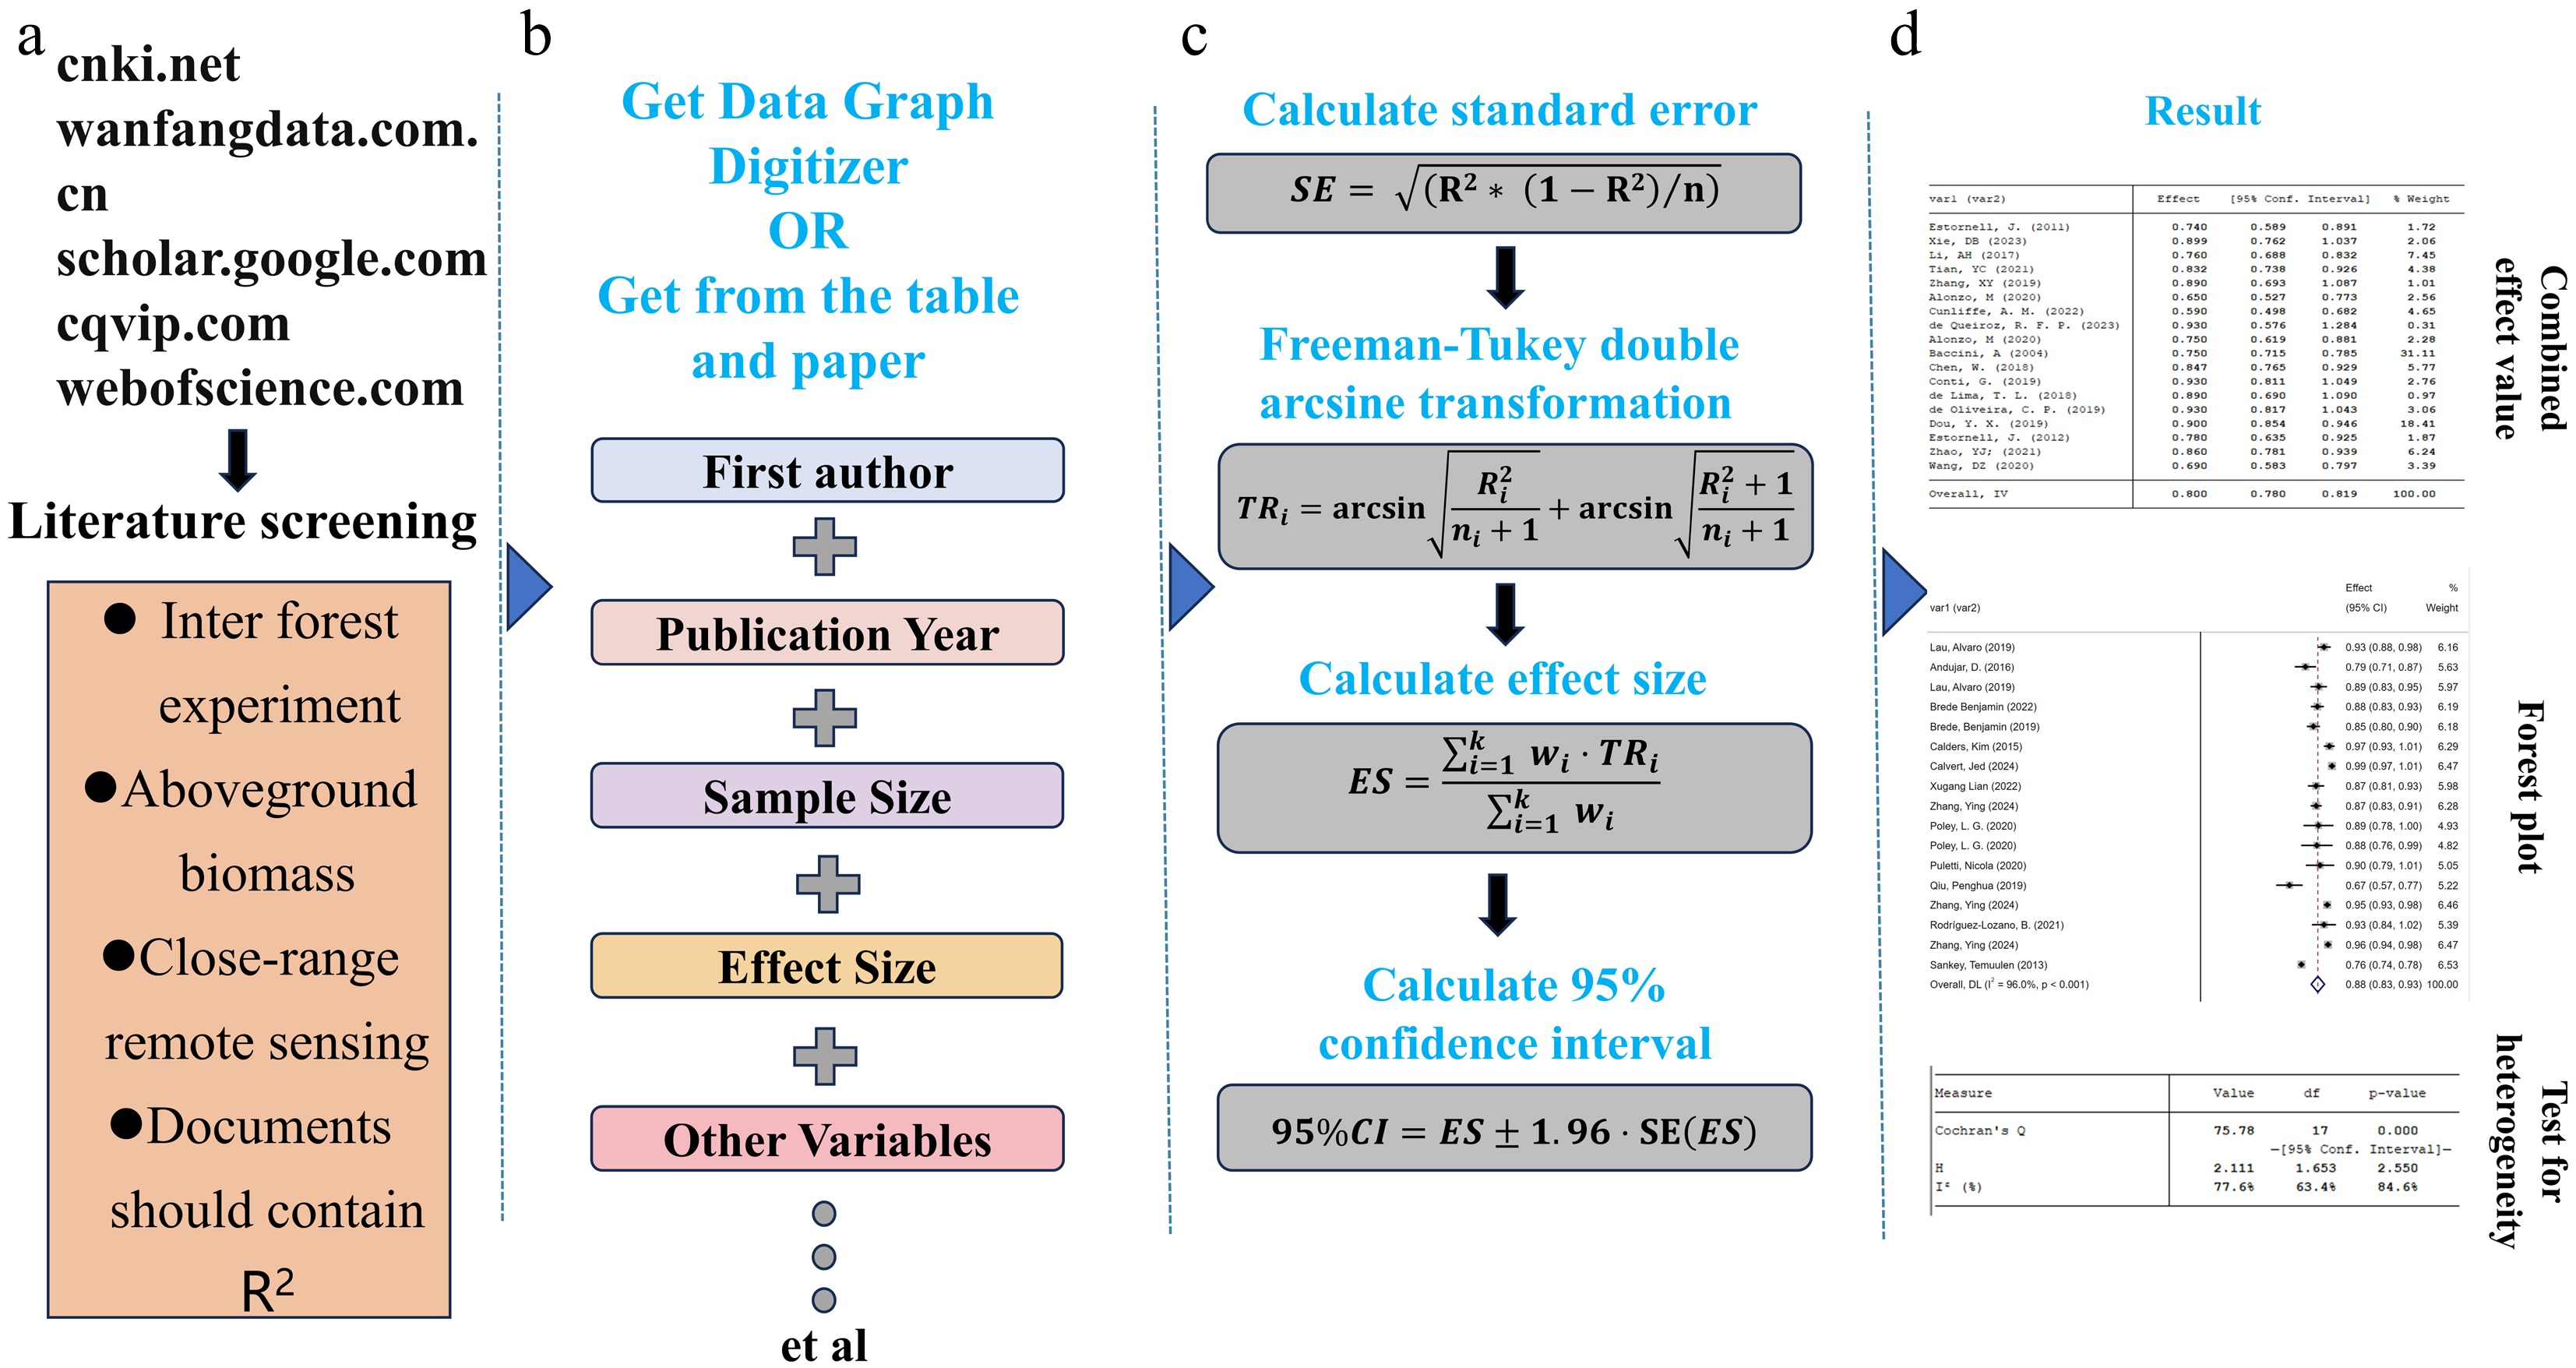
Figure 2.
Workflow of the meta-analysis. (a) Literature screening and search process; (b) extracting relevant data from the literature; (c) calculating the ES and 95% confidence interval (CI); (d) result.
-
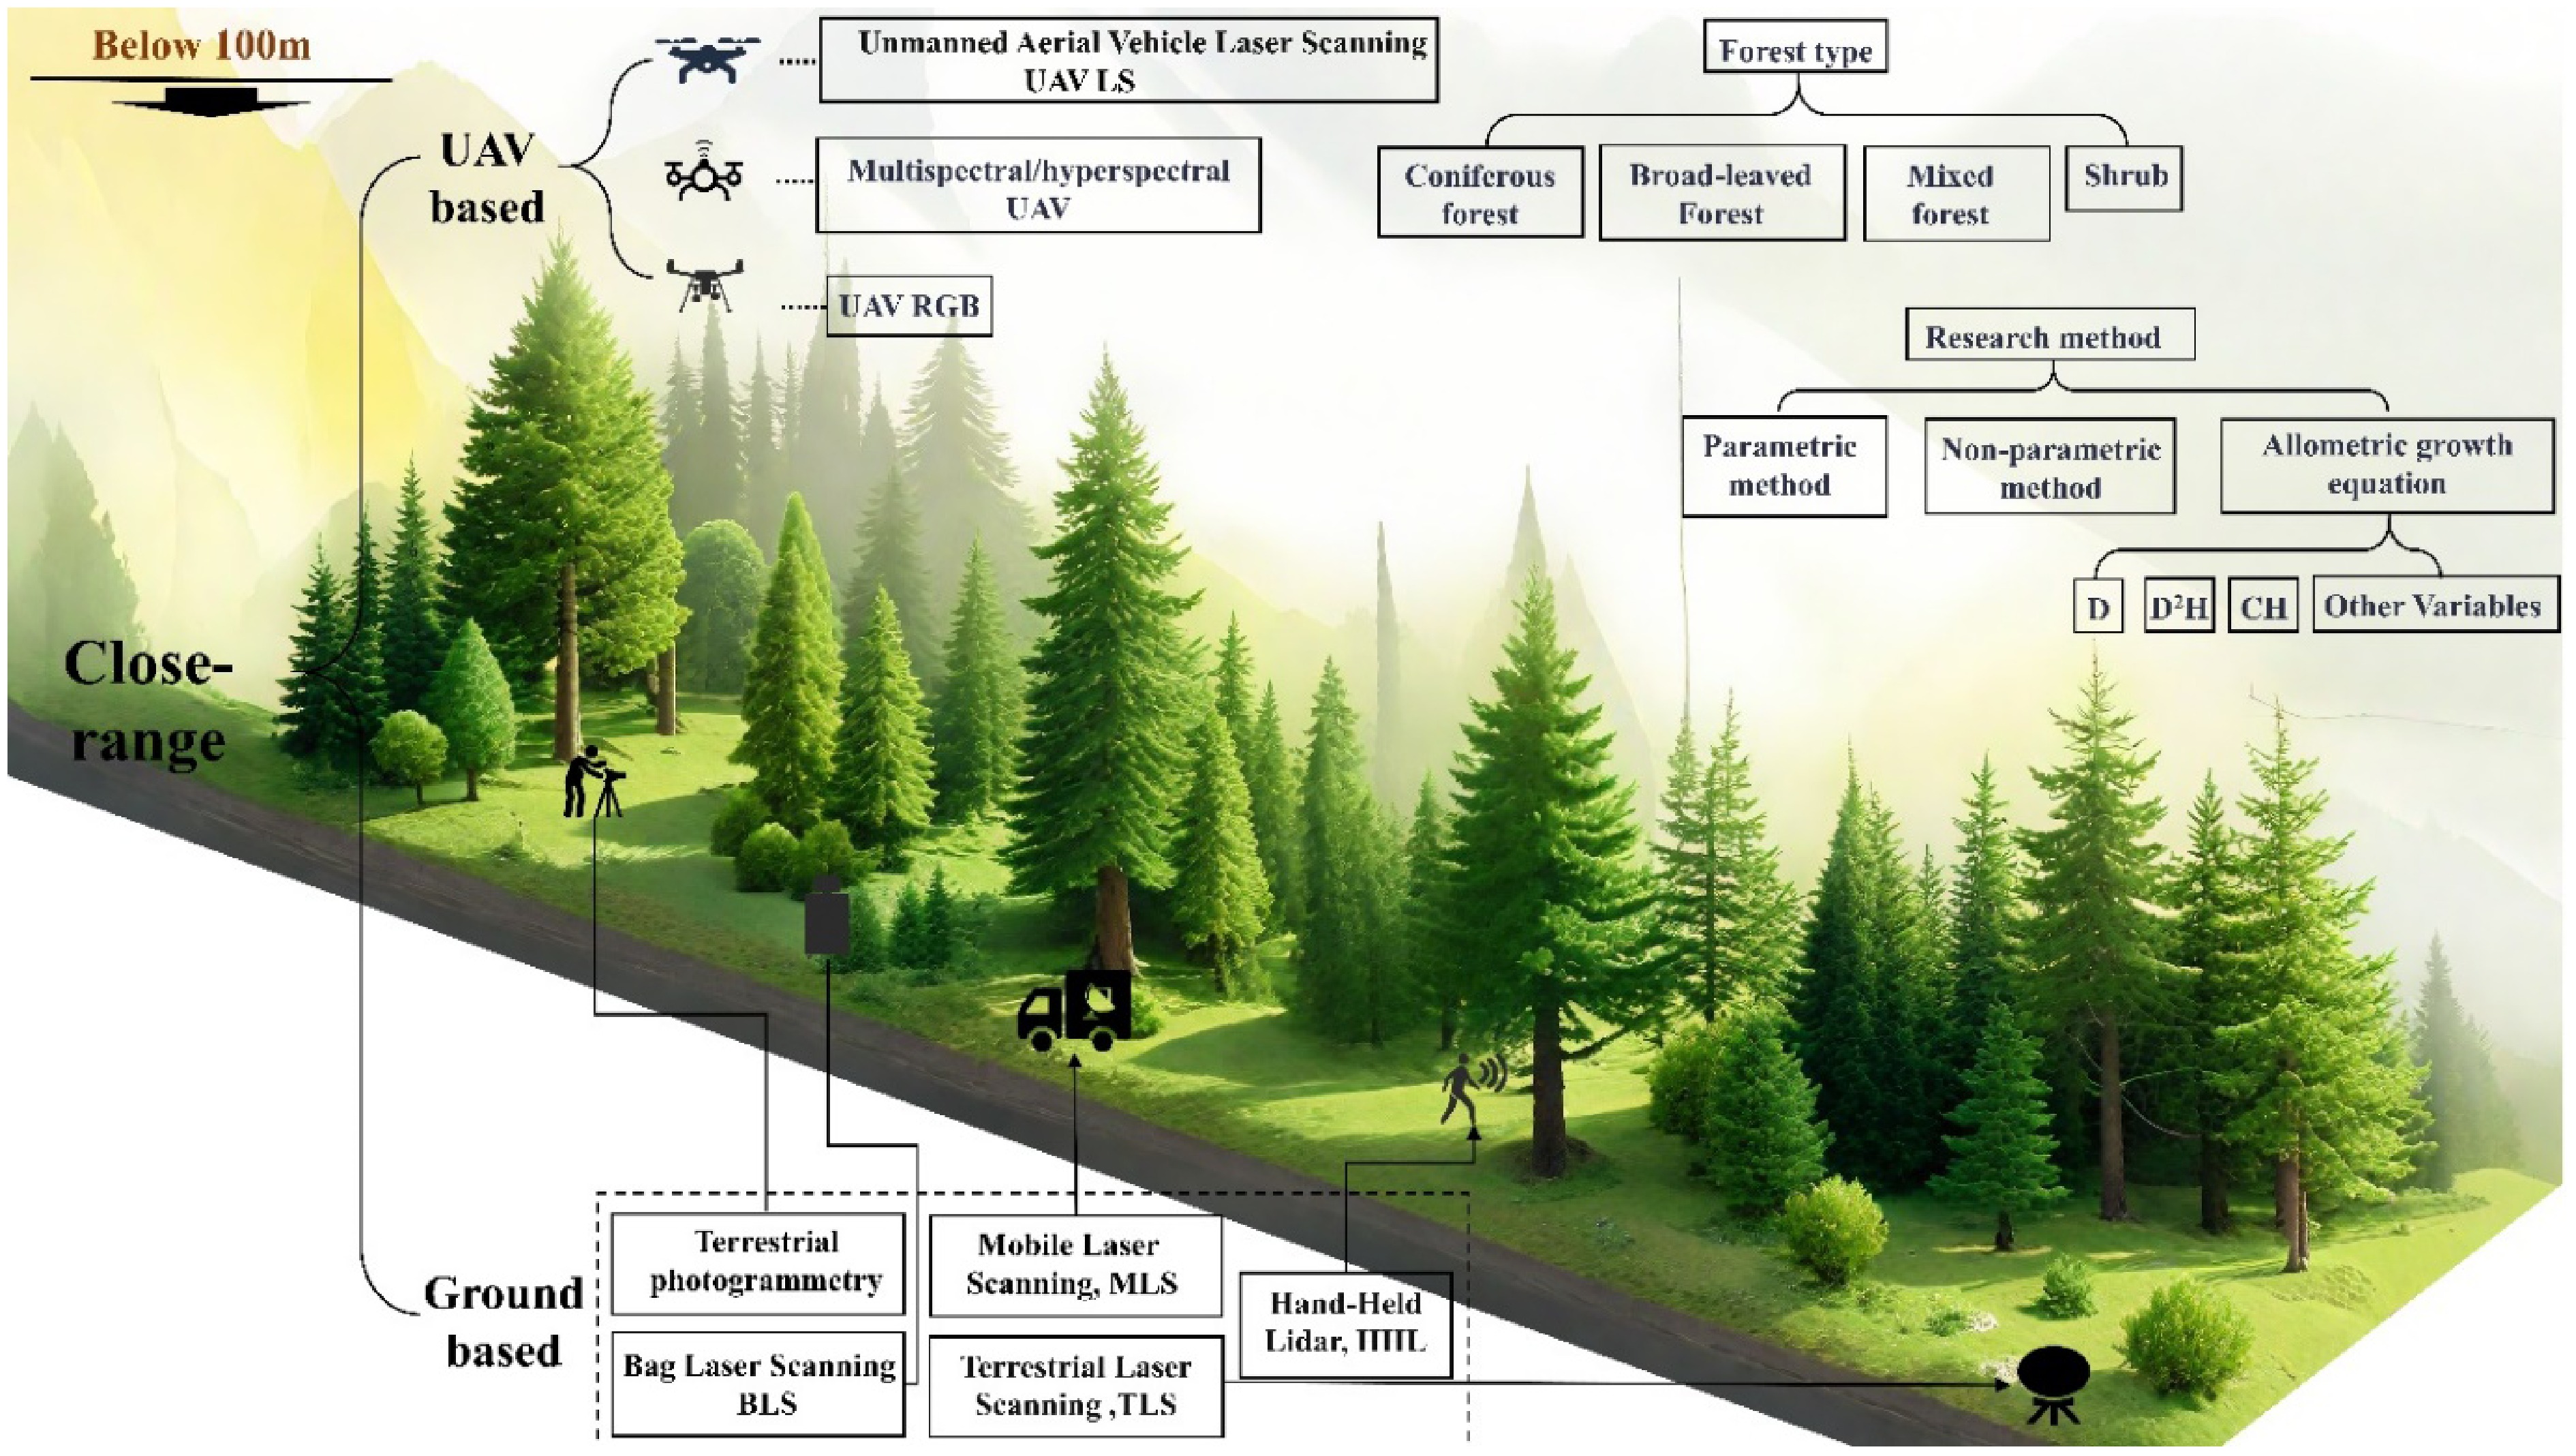
Figure 3.
AGB estimation systems using close-range remote sensing.
-
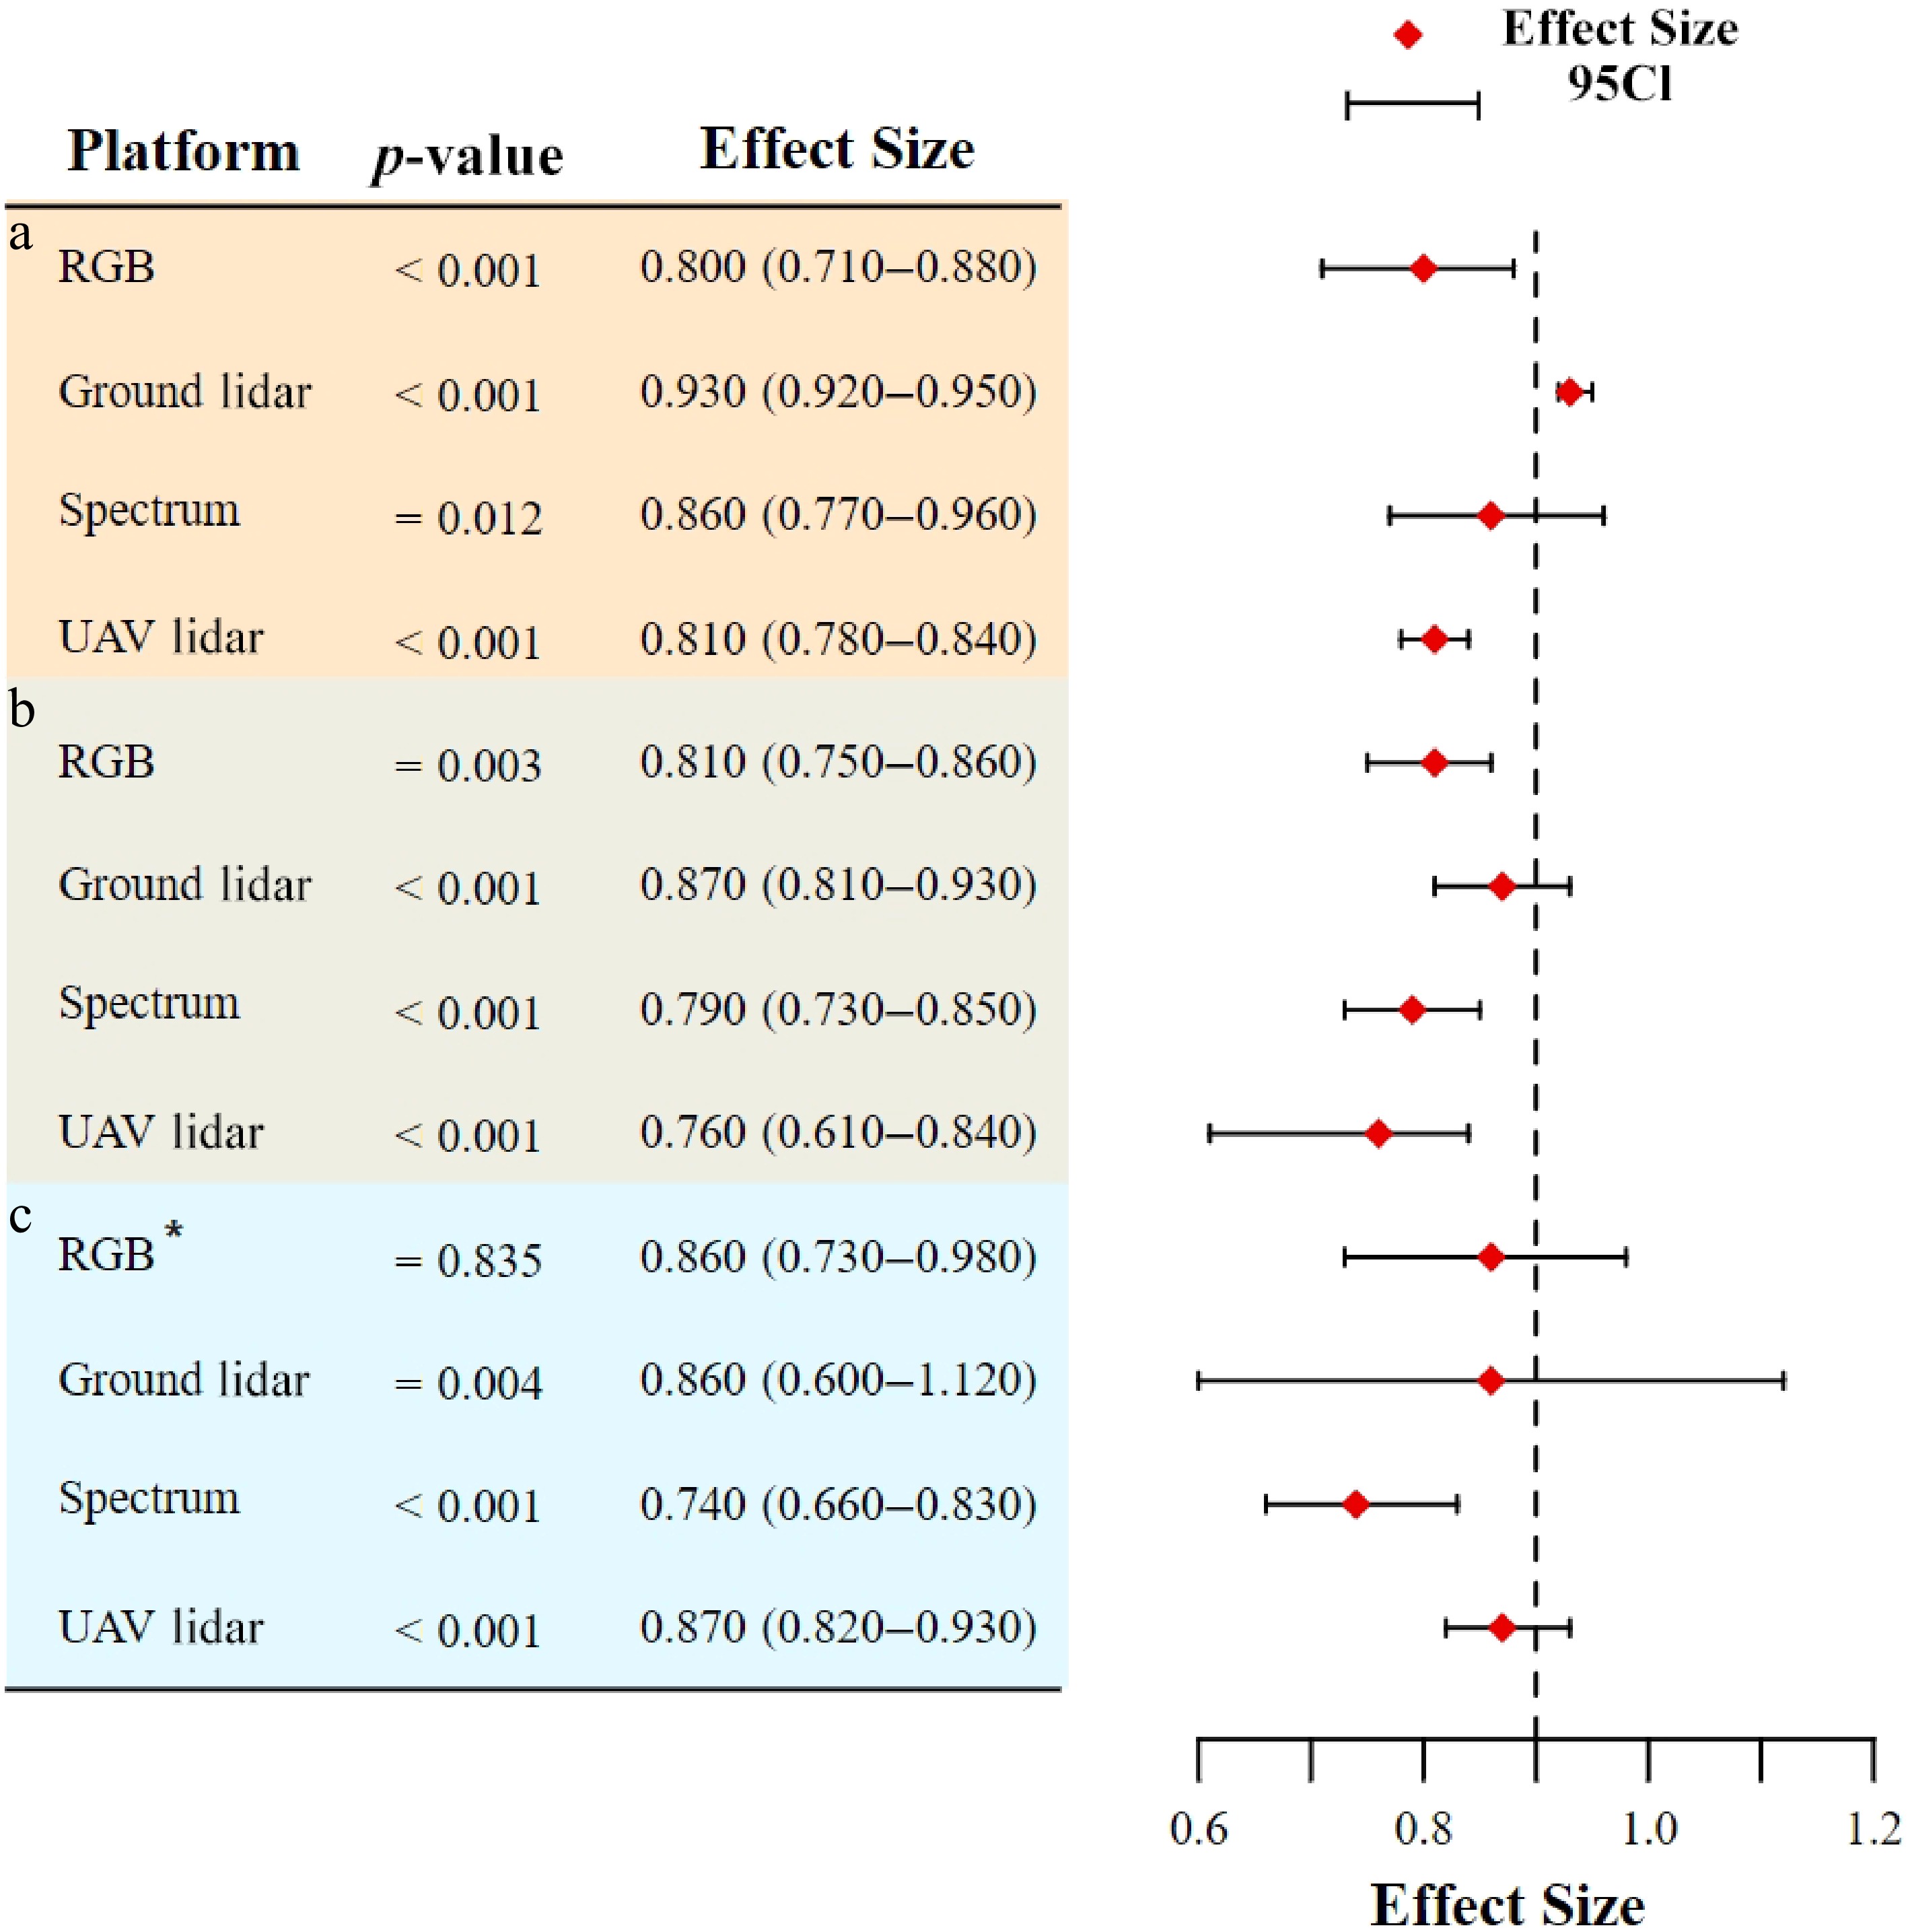
Figure 4.
Effects of different research scales on forest AGB estimation: (a) Single-tree scale; (b) plot scale; (c) stand scale. * indicates that a fixed effects model was used.
-
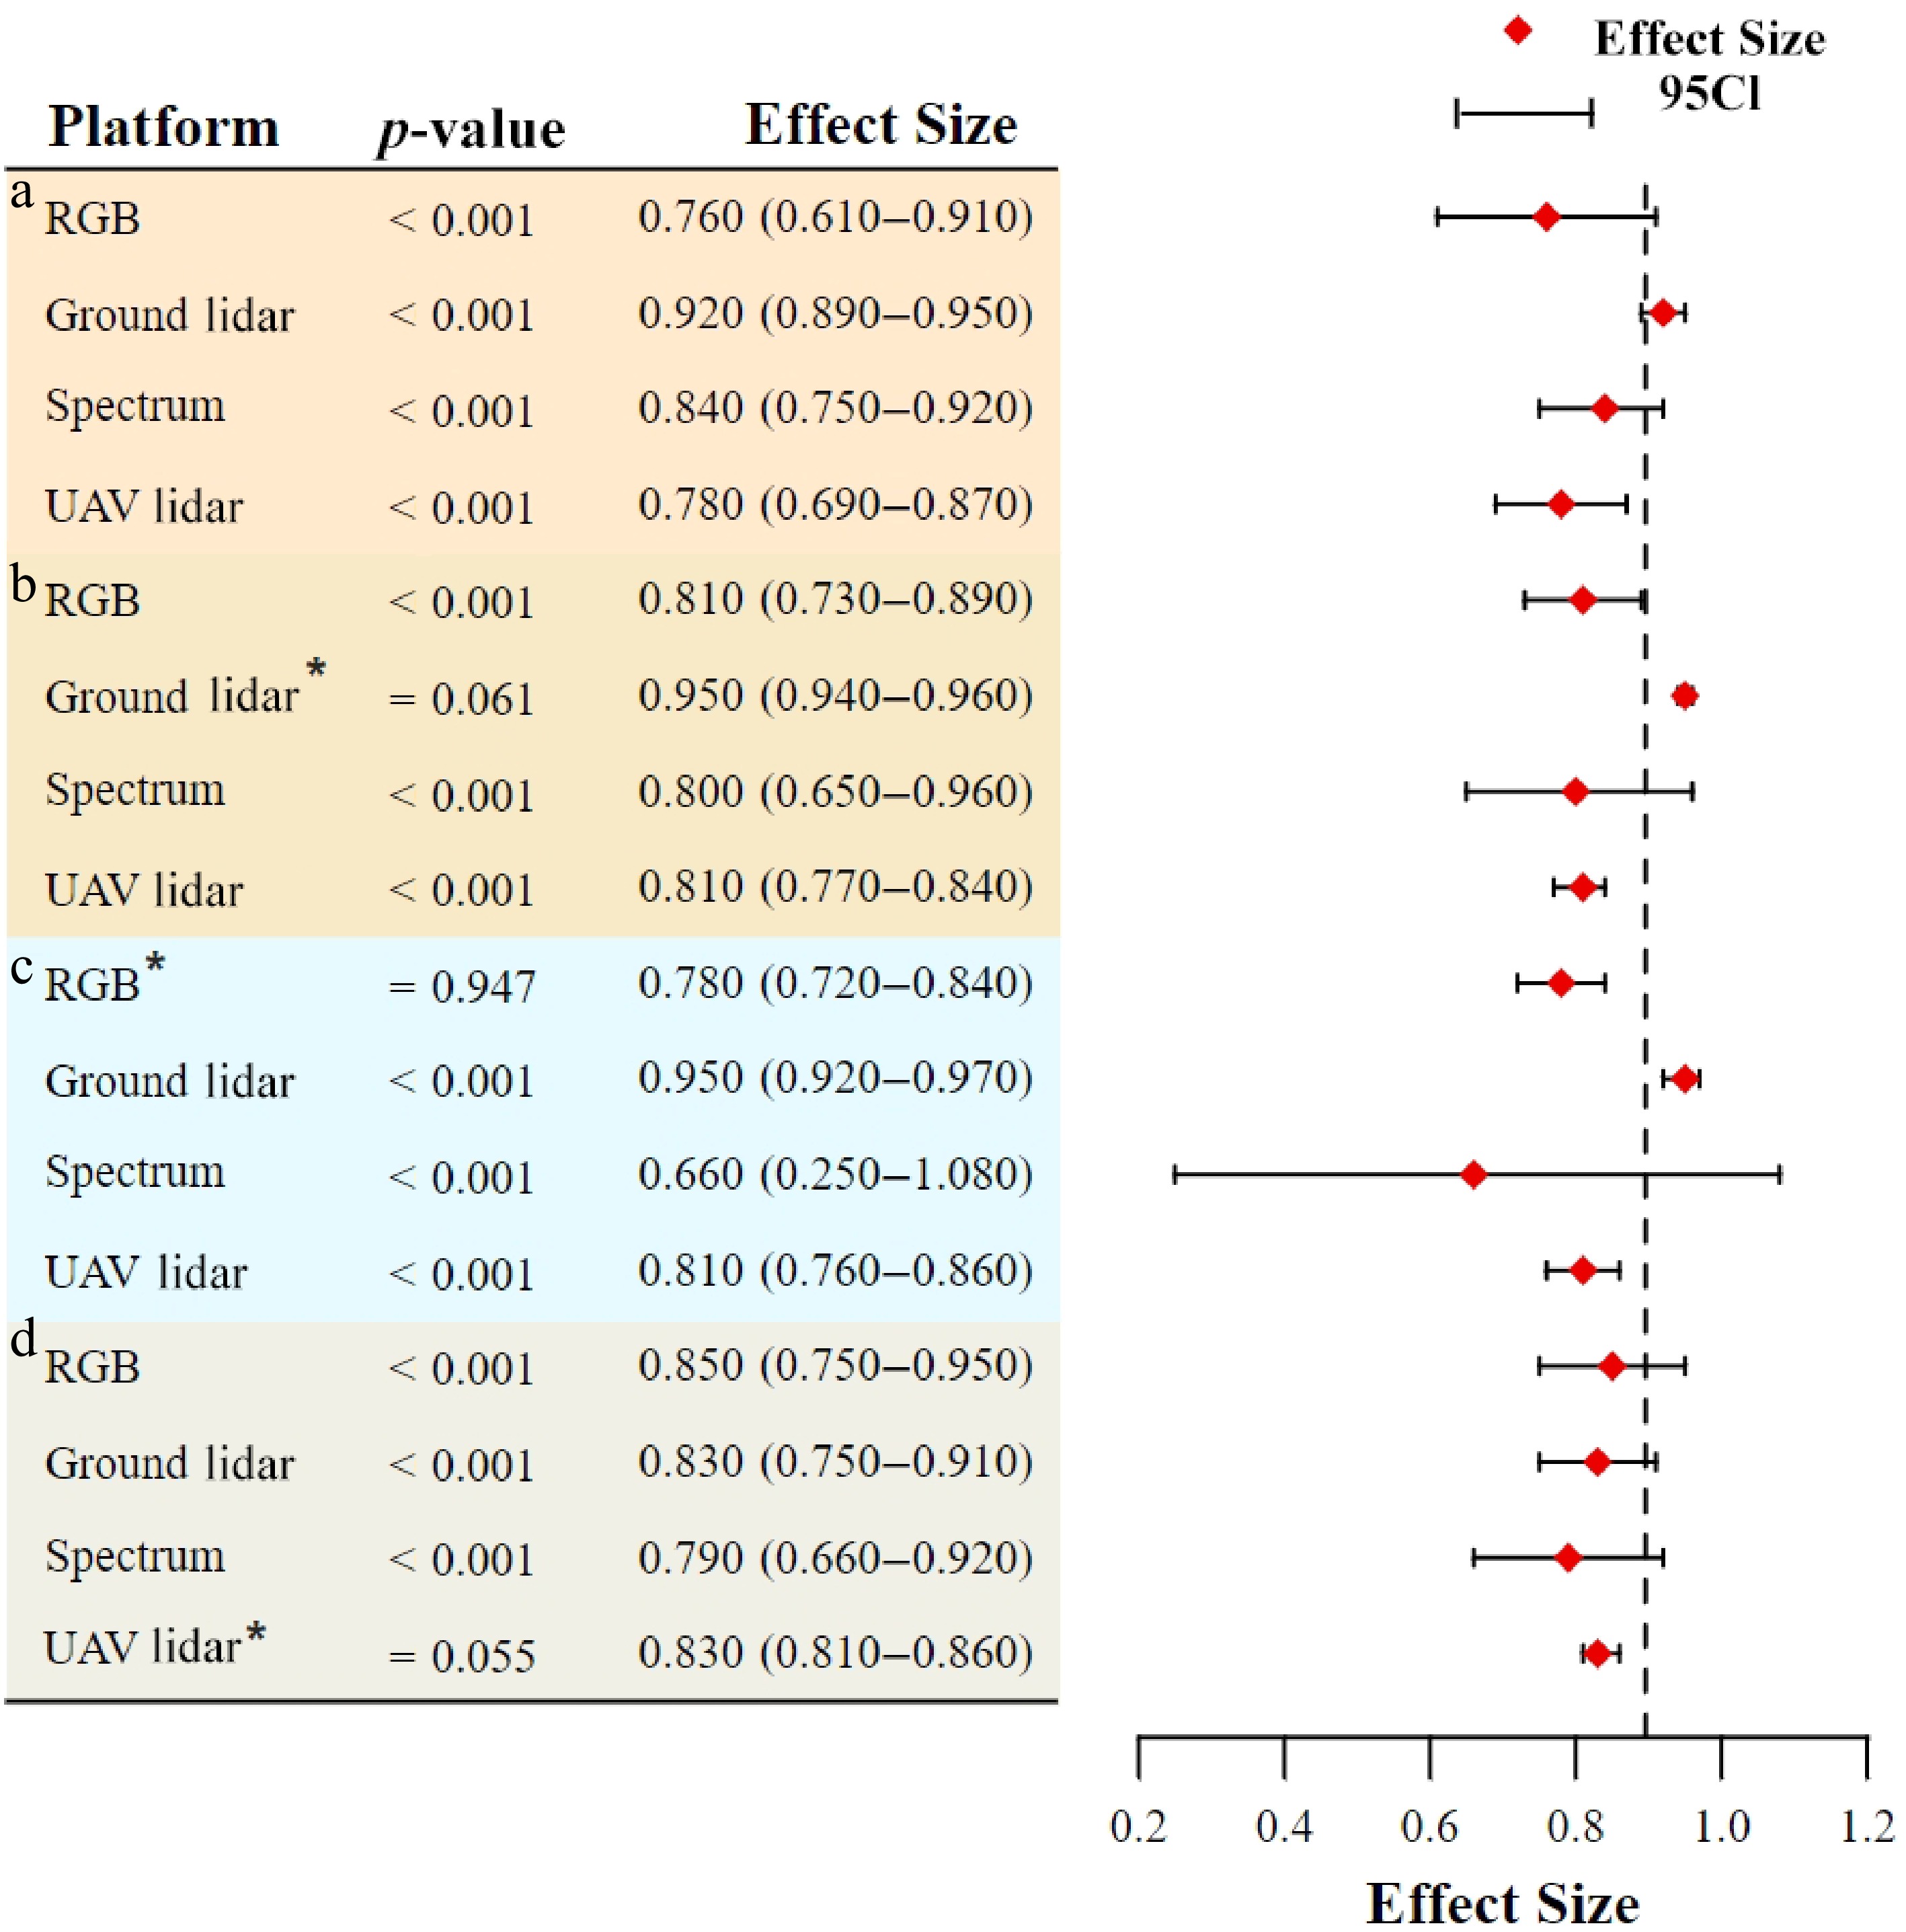
Figure 5.
Effects of different forest types on forest AGB estimations: (a) broadleaf forests; (b) coniferous forests; (c) mixed forests; (d) shrubs. * indicates that a fixed effects model was used.
-
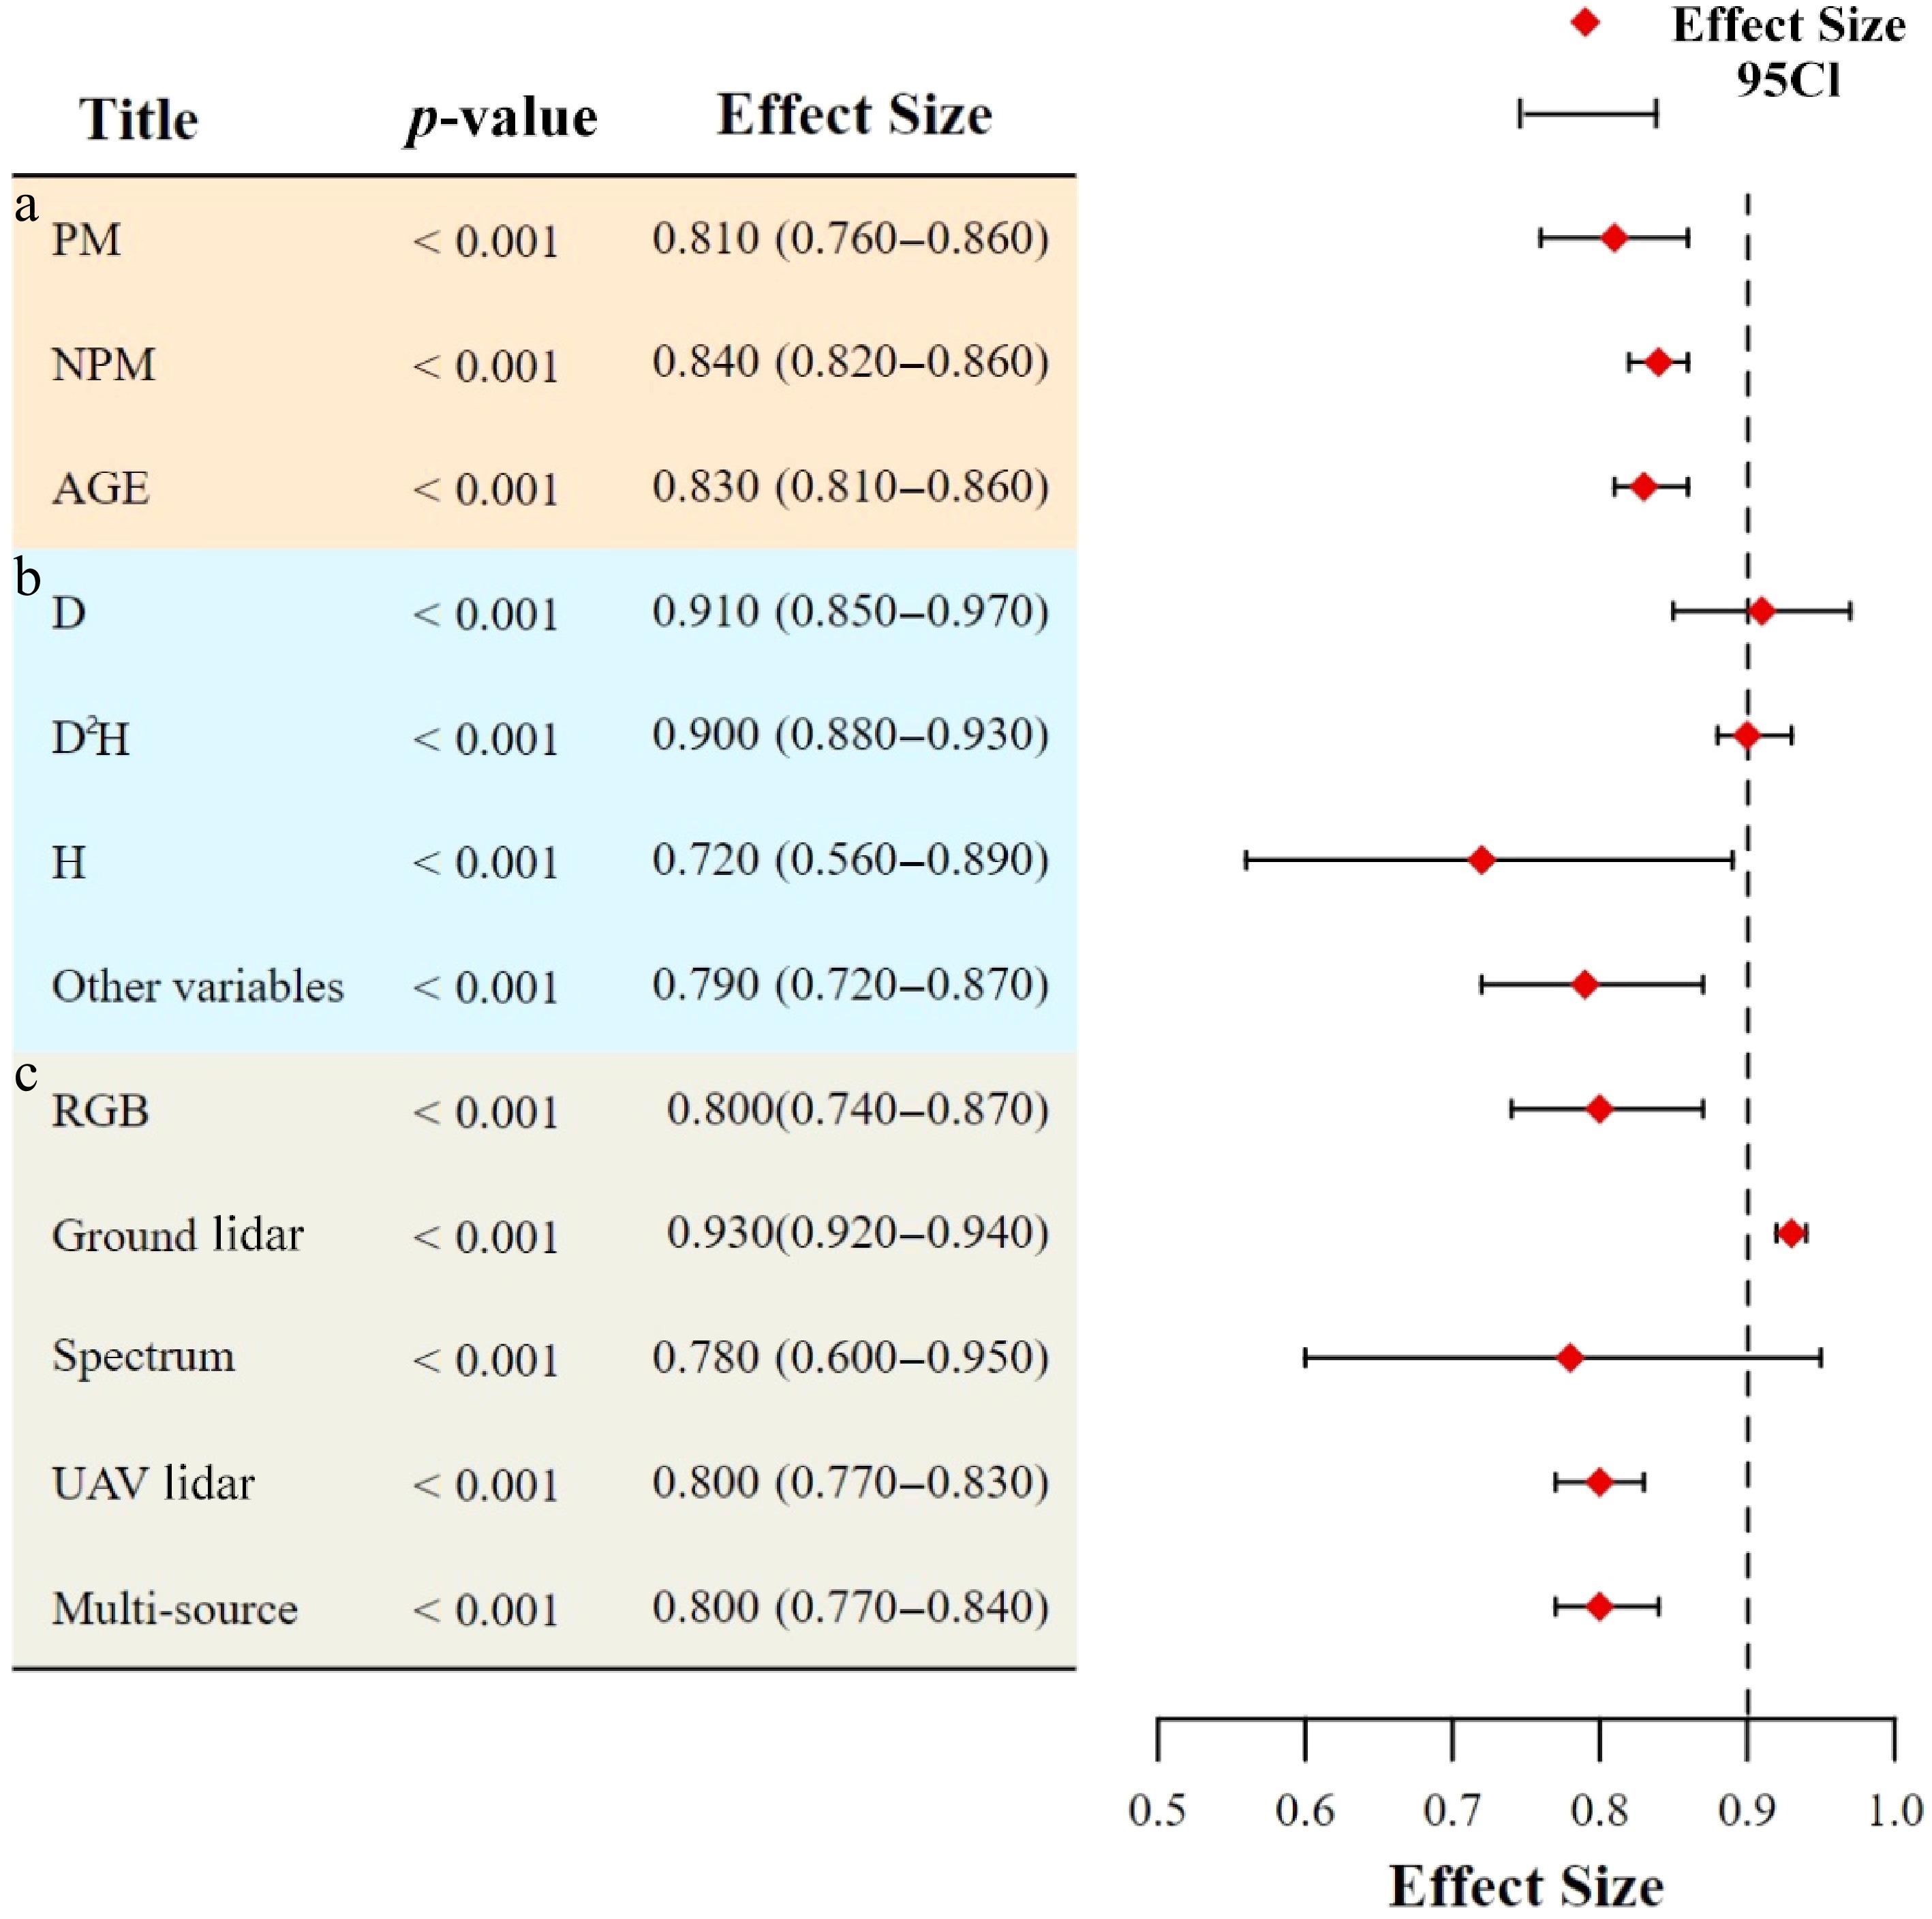
Figure 6.
AGB estimation accuracy of different research methods, different independent variables, and different platforms. (a) Different research methods. PM, parametric method; NPM, non-parametric method, AGE, allometric growth equation. (b) Different independent variables. (c) Accuracy comparison between multi-source remote sensing and individual remote sensing data sources.
-
Scale of study Sensor type Number of samples Sample proportion (%) I2 (%) Tree UAV lidar 38 19.90 97.6 Ground lidar 42 21.99 75.8 RGB 24 12.57 95.8 Spectra 4 2.09 72.7 Plot UAV lidar 31 16.23 97.0 Ground lidar 7 3.66 73.5 RGB 13 6.81 59.5 Spectra 12 6.28 68.3 Stand UAV lidar 13 6.81 86.6 Ground lidar 2 1.05 88.3 RGB 3 1.57 0.0 Spectra 2 1.05 90.8 Total 191 100 Table 1.
Statistical table of sample size at different research scales.
-
Type of forest Sensor type Number of samples Sample proportion (%) I2 (%) Broadleaf forests UAV lidar 22 11.52 98.2 Ground lidar 14 7.33 42.1 RGB 11 5.76 97.7 Spectra 6 3.14 83.3 Coniferous forests UAV lidar 20 10.47 85.8 Ground lidar 12 6.28 42.1 RGB 11 5.76 77.4 Spectra 4 2.09 83.3 Mixed forests UAV lidar 31 16.23 97.7 Ground lidar 17 8.90 80.9 RGB 6 3.14 0.0 Spectra 3 1.57 99.6 Shrubs UAV lidar 9 4.71 47.4 Ground lidar 8 4.19 80.6 RGB 12 6.28 88.8 Spectra 5 2.62 86.0 Total 191 100 Table 2.
Statistical table of samples in different forest types.
-
Research method Number of samples Sample proportion (%) I2 Parametric method 95 40.77 98.6 Non-parametric method 62 26.61 91.9 Allometric growth equation 76 32.62 97.2 Total 233 100 Table 3.
Statistical table of samples with different research methods.
-
Independent variable Number of samples Sample proportion I2 H 14 18.42% 98.4 D 10 13.16% 77.4 D2H 28 37.04% 93.5 Other 24 31.58% 95.3 Total 76 100% Table 4.
Statistical table of sample with different independent variables.
-
Sensor Number of samples Sample proportion I2 UAV lidar 82 35.19% 97.3 Ground lidar 52 22.32% 75 RGB 40 17.17% 93.5 Spectra 18 7.73% 99.7 Multi-source 41 17.60% 95.5 Total 233 100% Table 5.
Statistical table of samples using different sensors.
Figures
(6)
Tables
(5)