-
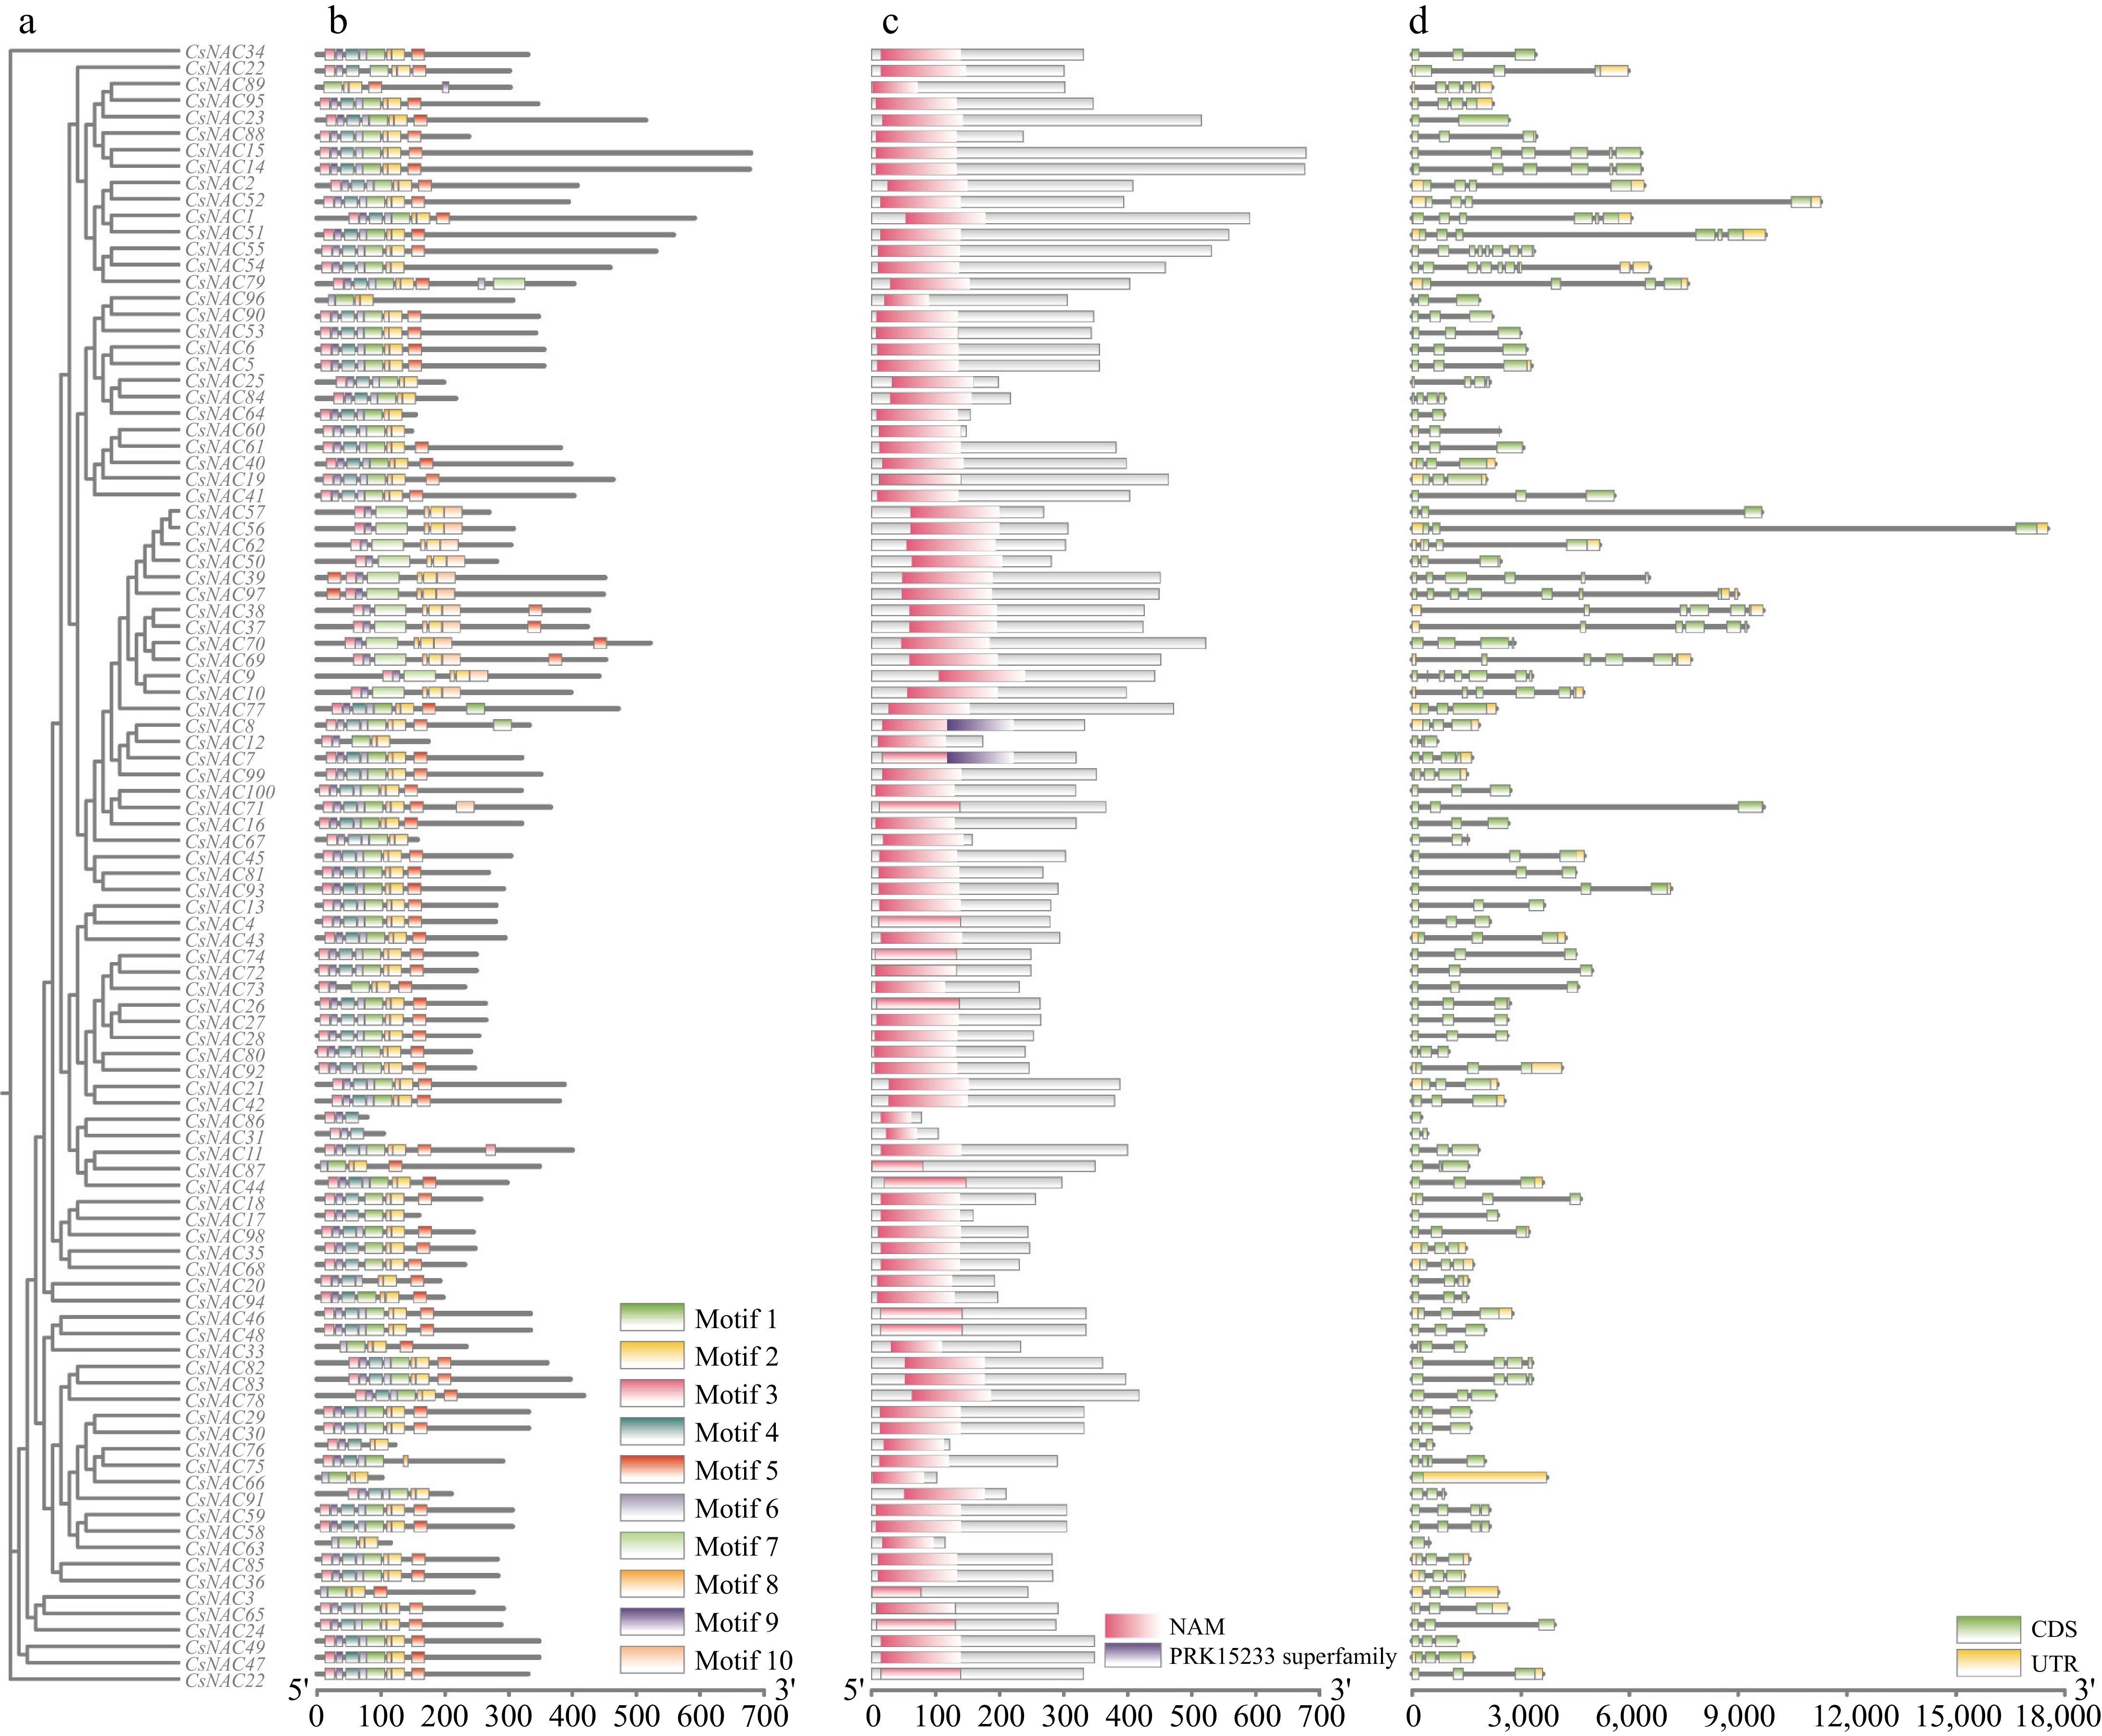
Figure 1.
CsNAC gene phylogenetic tree, gene conserved motifs, conserved domains, and gene structure. (a) A phylogenetic tree was constructed using 100 CsNACs. (b) The distribution of conserved motifs within the CsNAC genes is categorized into 10 distinct motifs, with different colors representing each motif. (c) The distribution of conserved domains in the CsNAC genes. (d) An analysis of the CsNAC gene structure, where green boxes denote exons, yellow boxes represent untranslated upstream and downstream regions, and lines indicate introns.
-
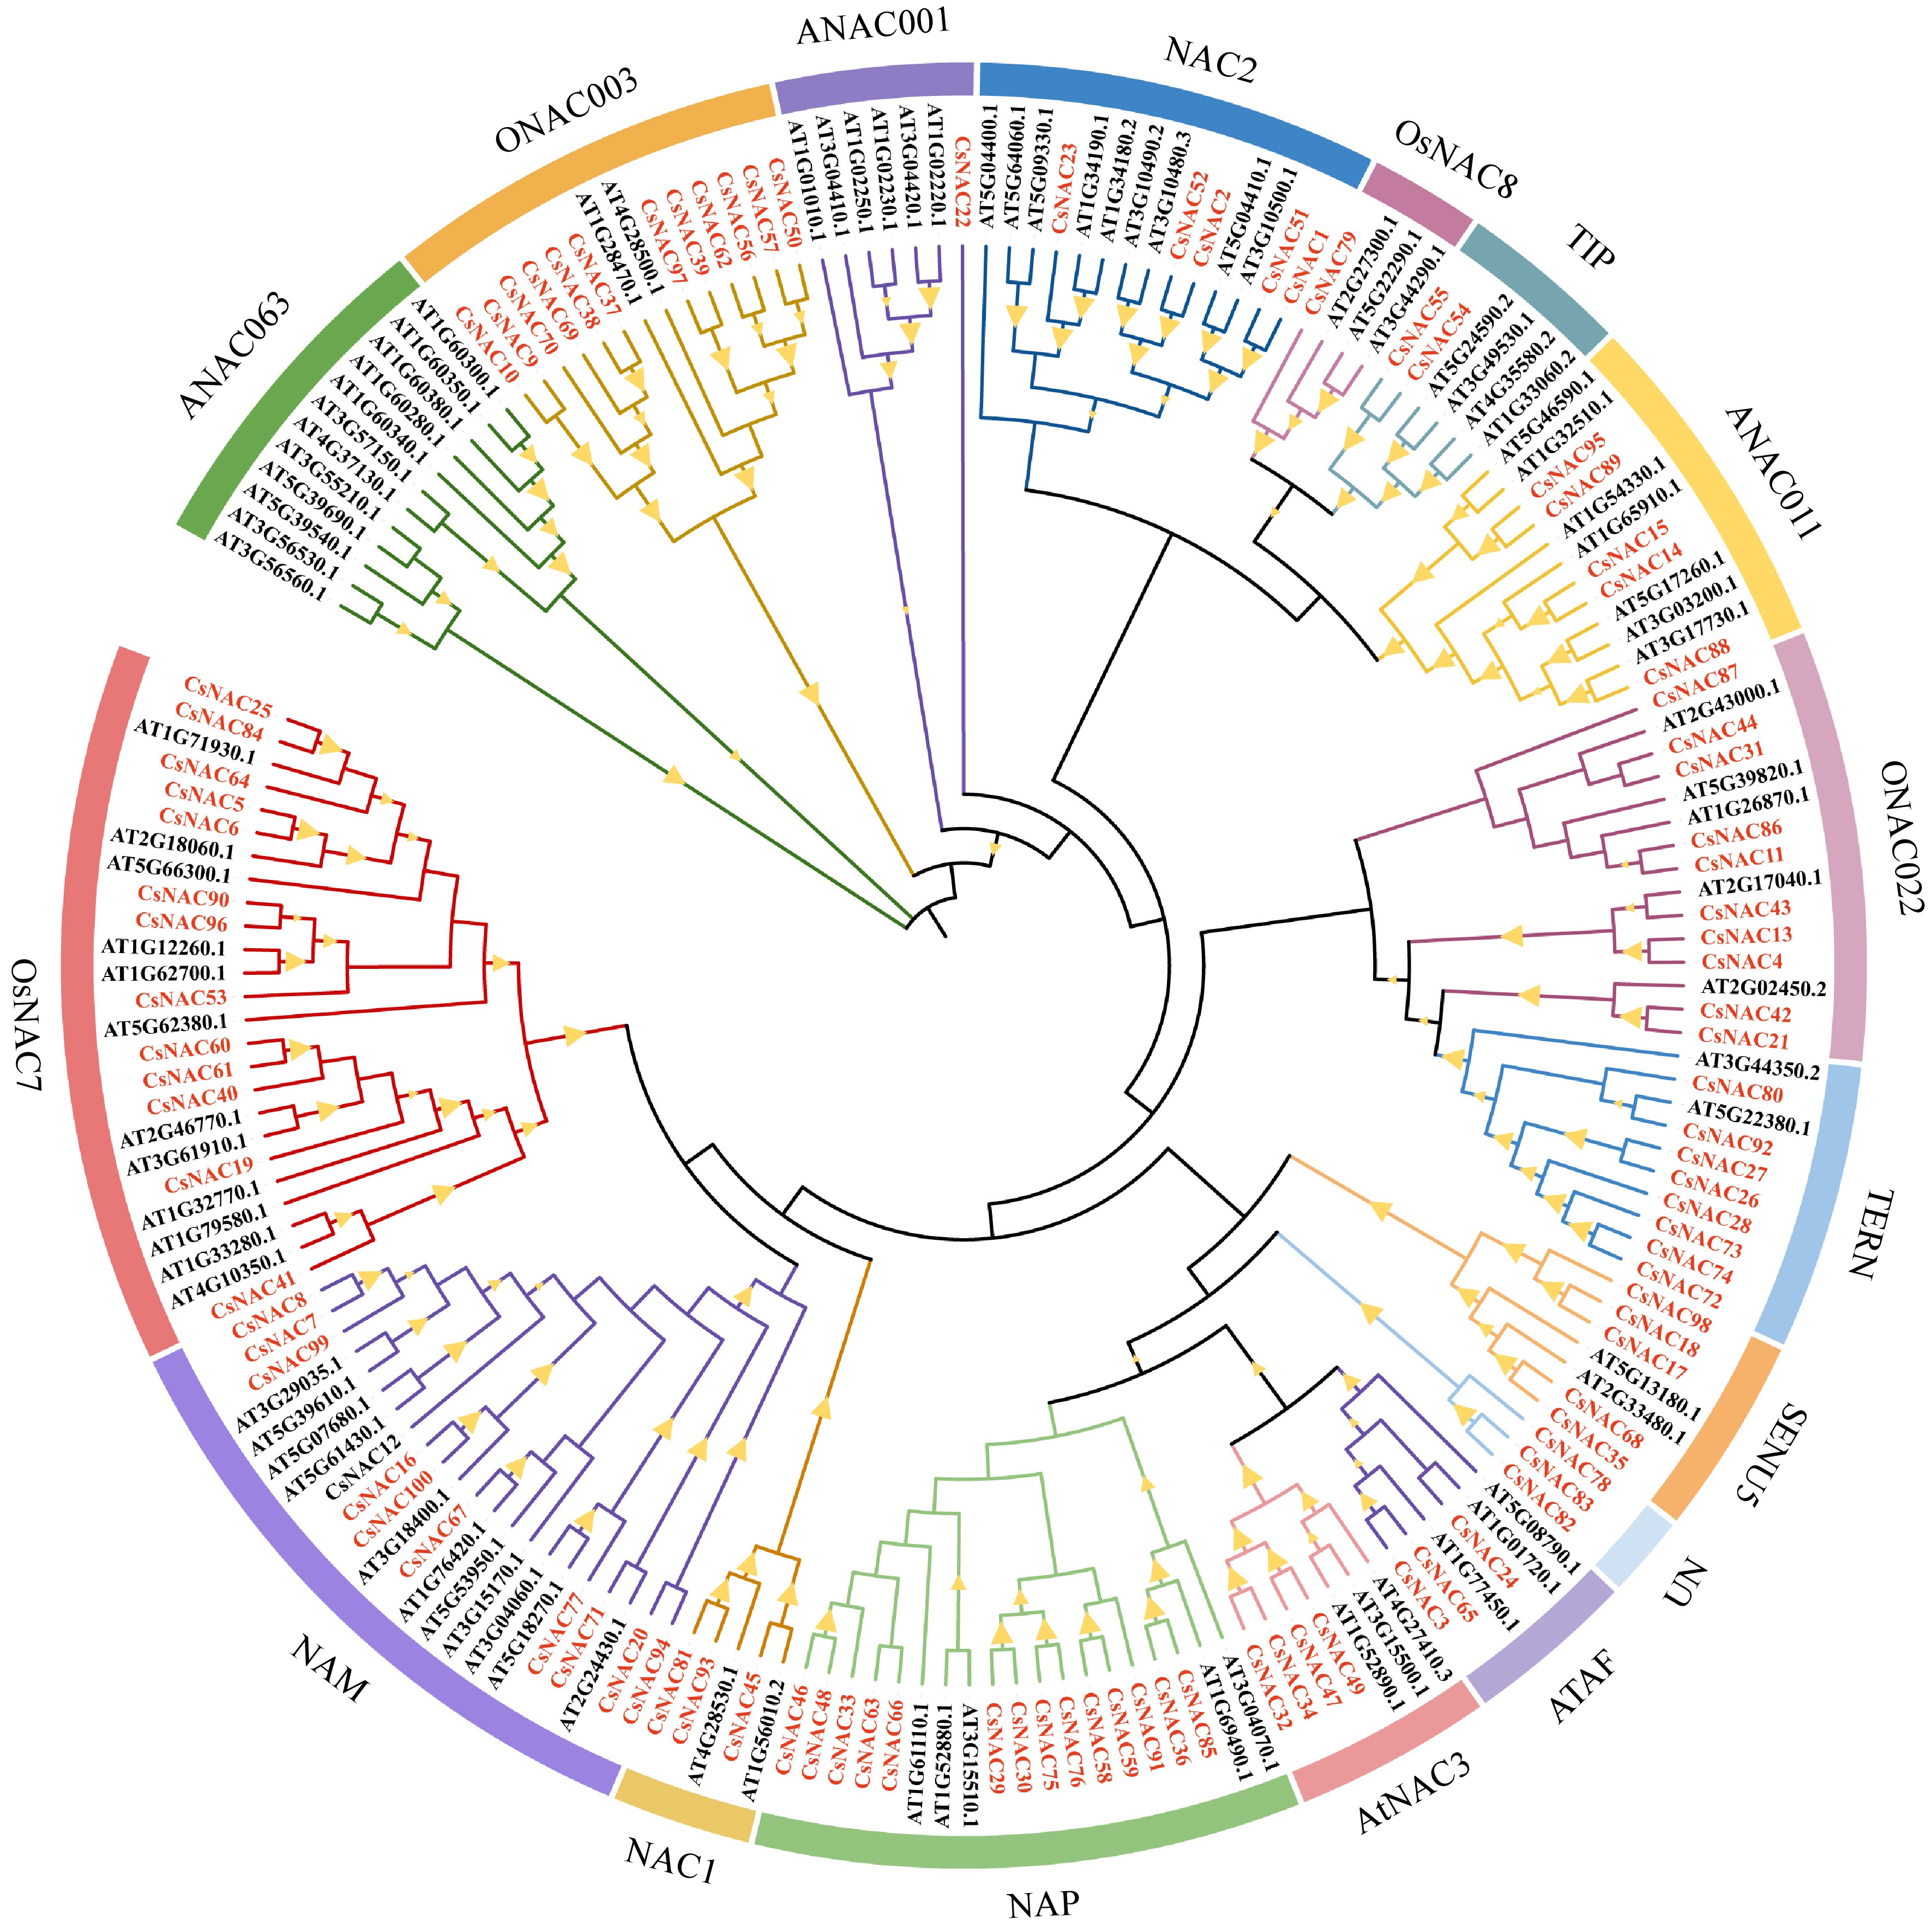
Figure 2.
Phylogenetic relationship of NAC gene family in tea plant and A. thaliana. A phylogenetic analysis was conducted using 100 tea plants and 88 Arabidopsis thaliana protein sequences, employing the Neighbor-Joining (NJ) method with MEGA 11 software. These proteins are categorized into 16 distinct groups, with different colors in the outer ring representing the various groups of NAC proteins. The prefixes Cs and At denote the tea plant and Arabidopsis proteins, respectively, while the CsNAC genes are highlighted in red font. Notably, the Bootstrap values for all branches exceed 50%.
-
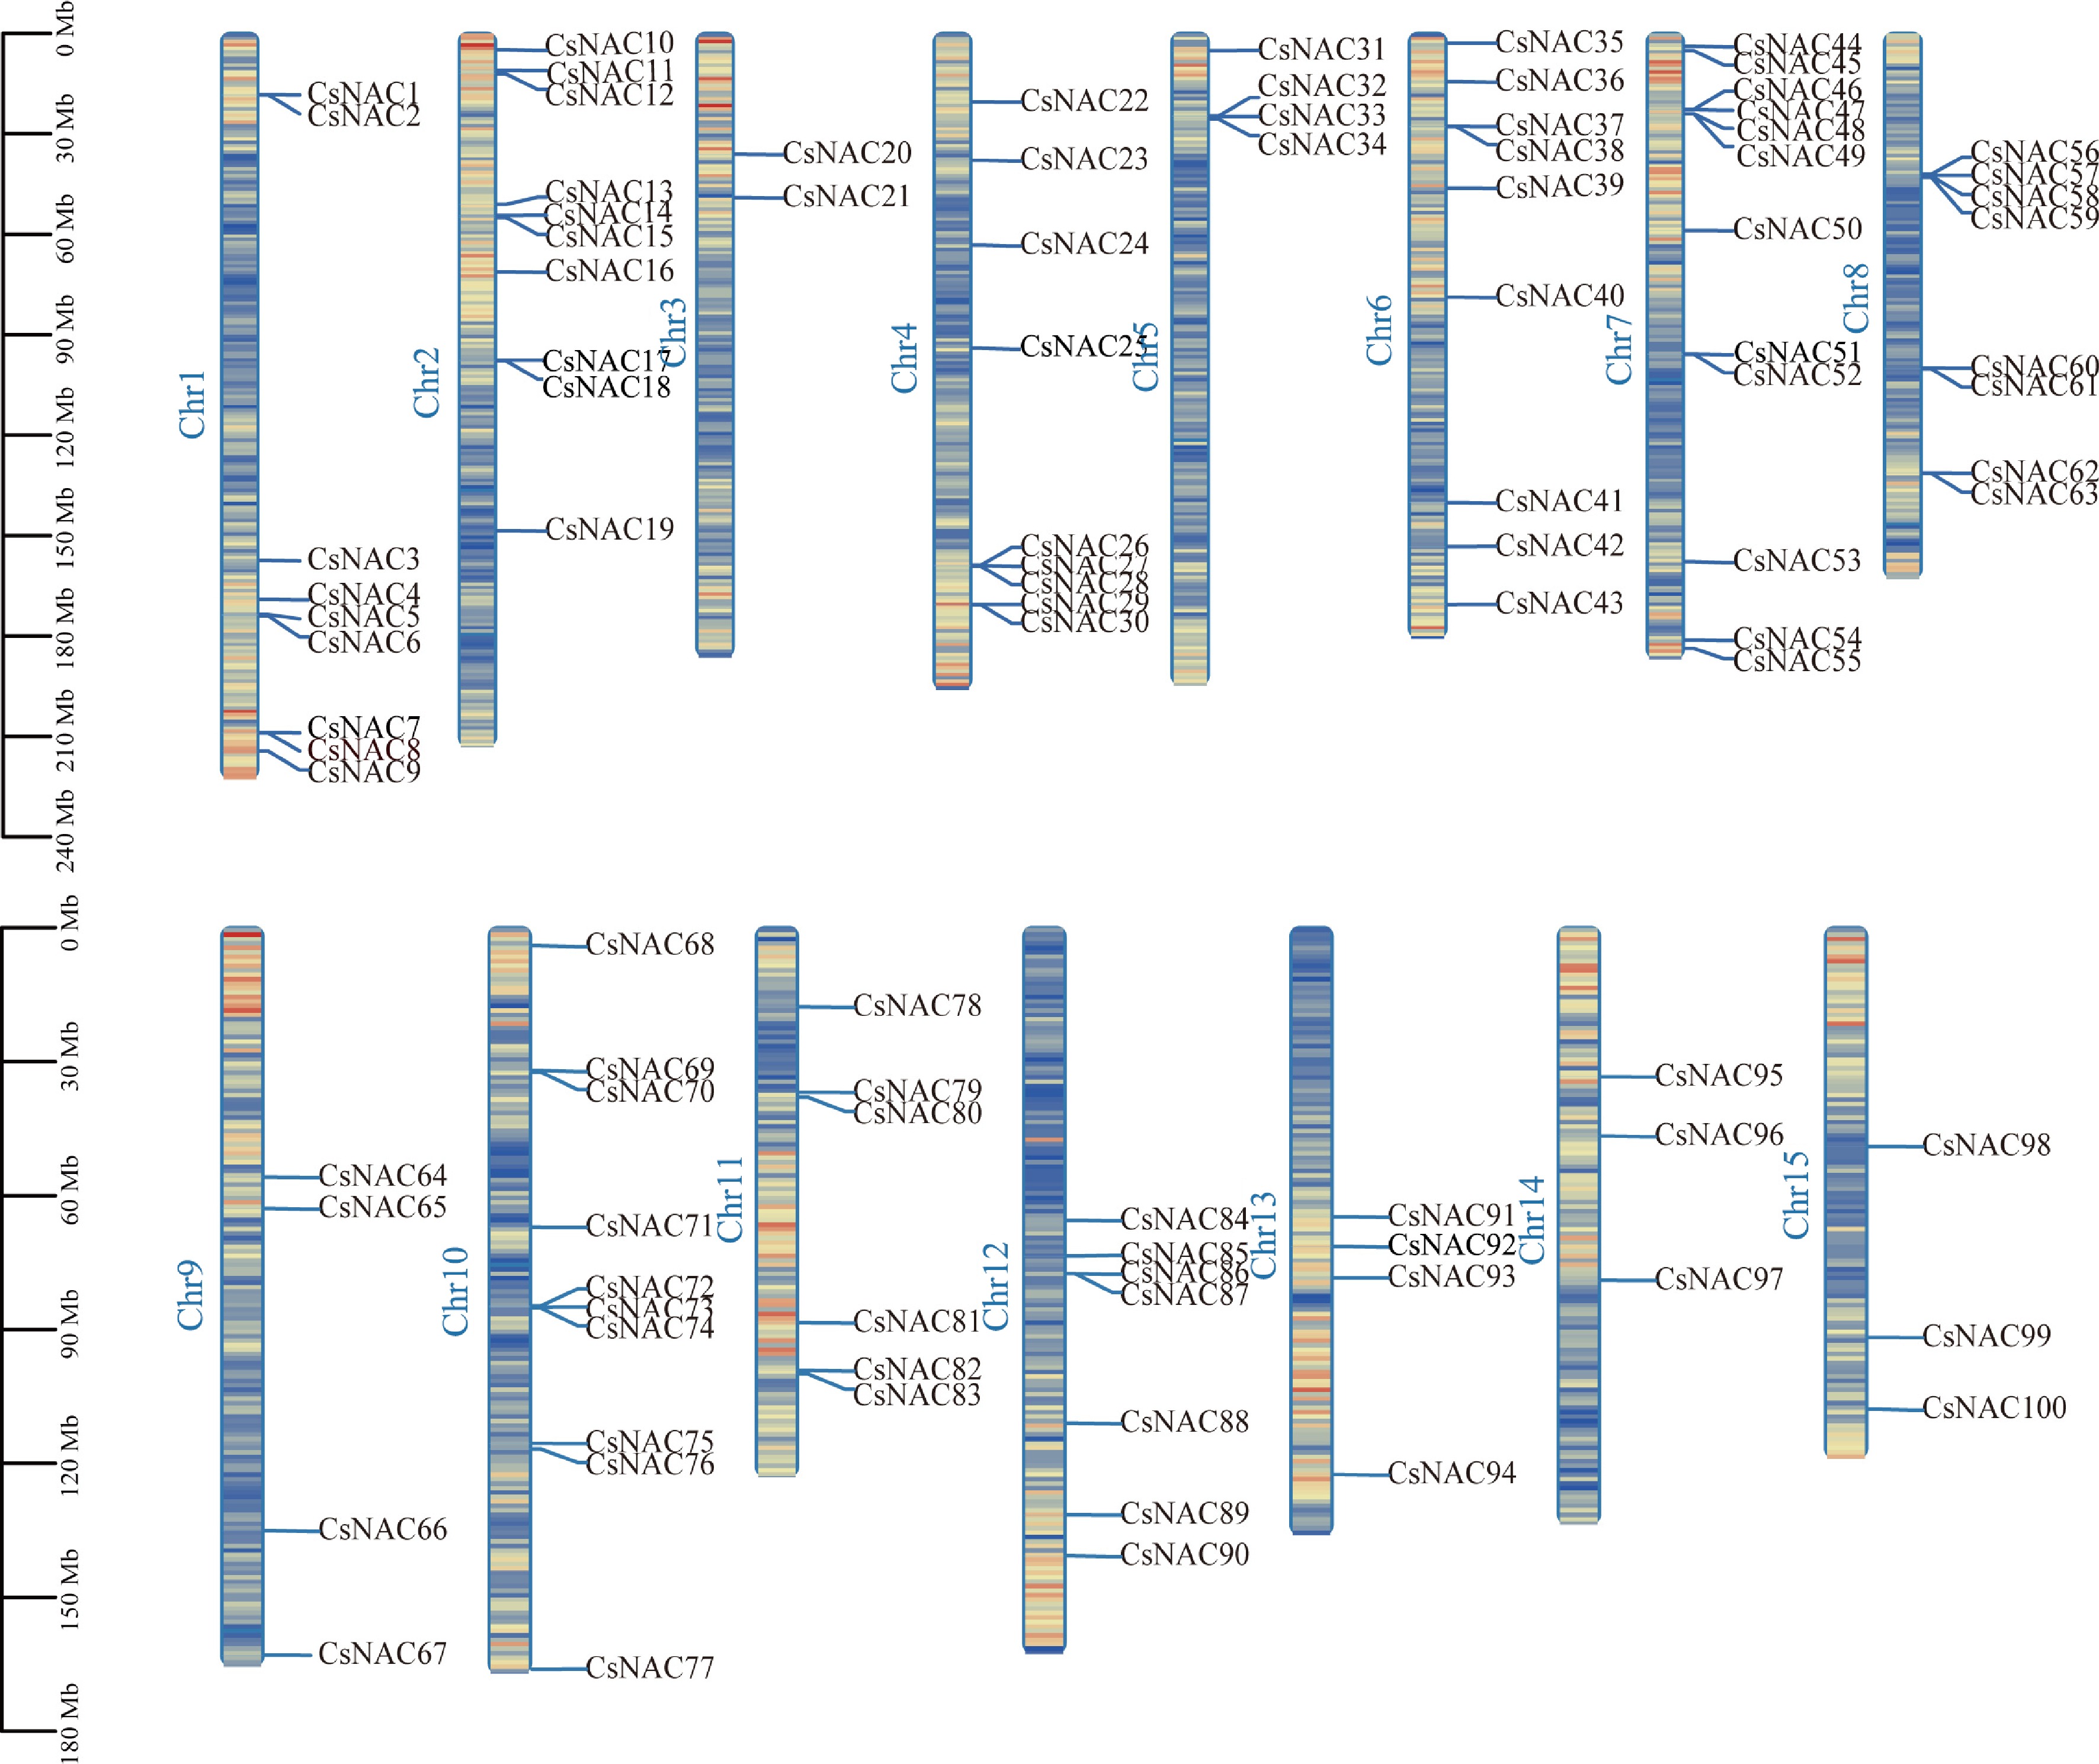
Figure 3.
Chromosomal distribution of CsNAC genes. Scale is in megabytes (Mb). All identified CsNAC genes are displayed on their respective chromosomes, with the chromosome numbers labeled at the top of each band. The lines within the chromosomes indicate gene density.
-
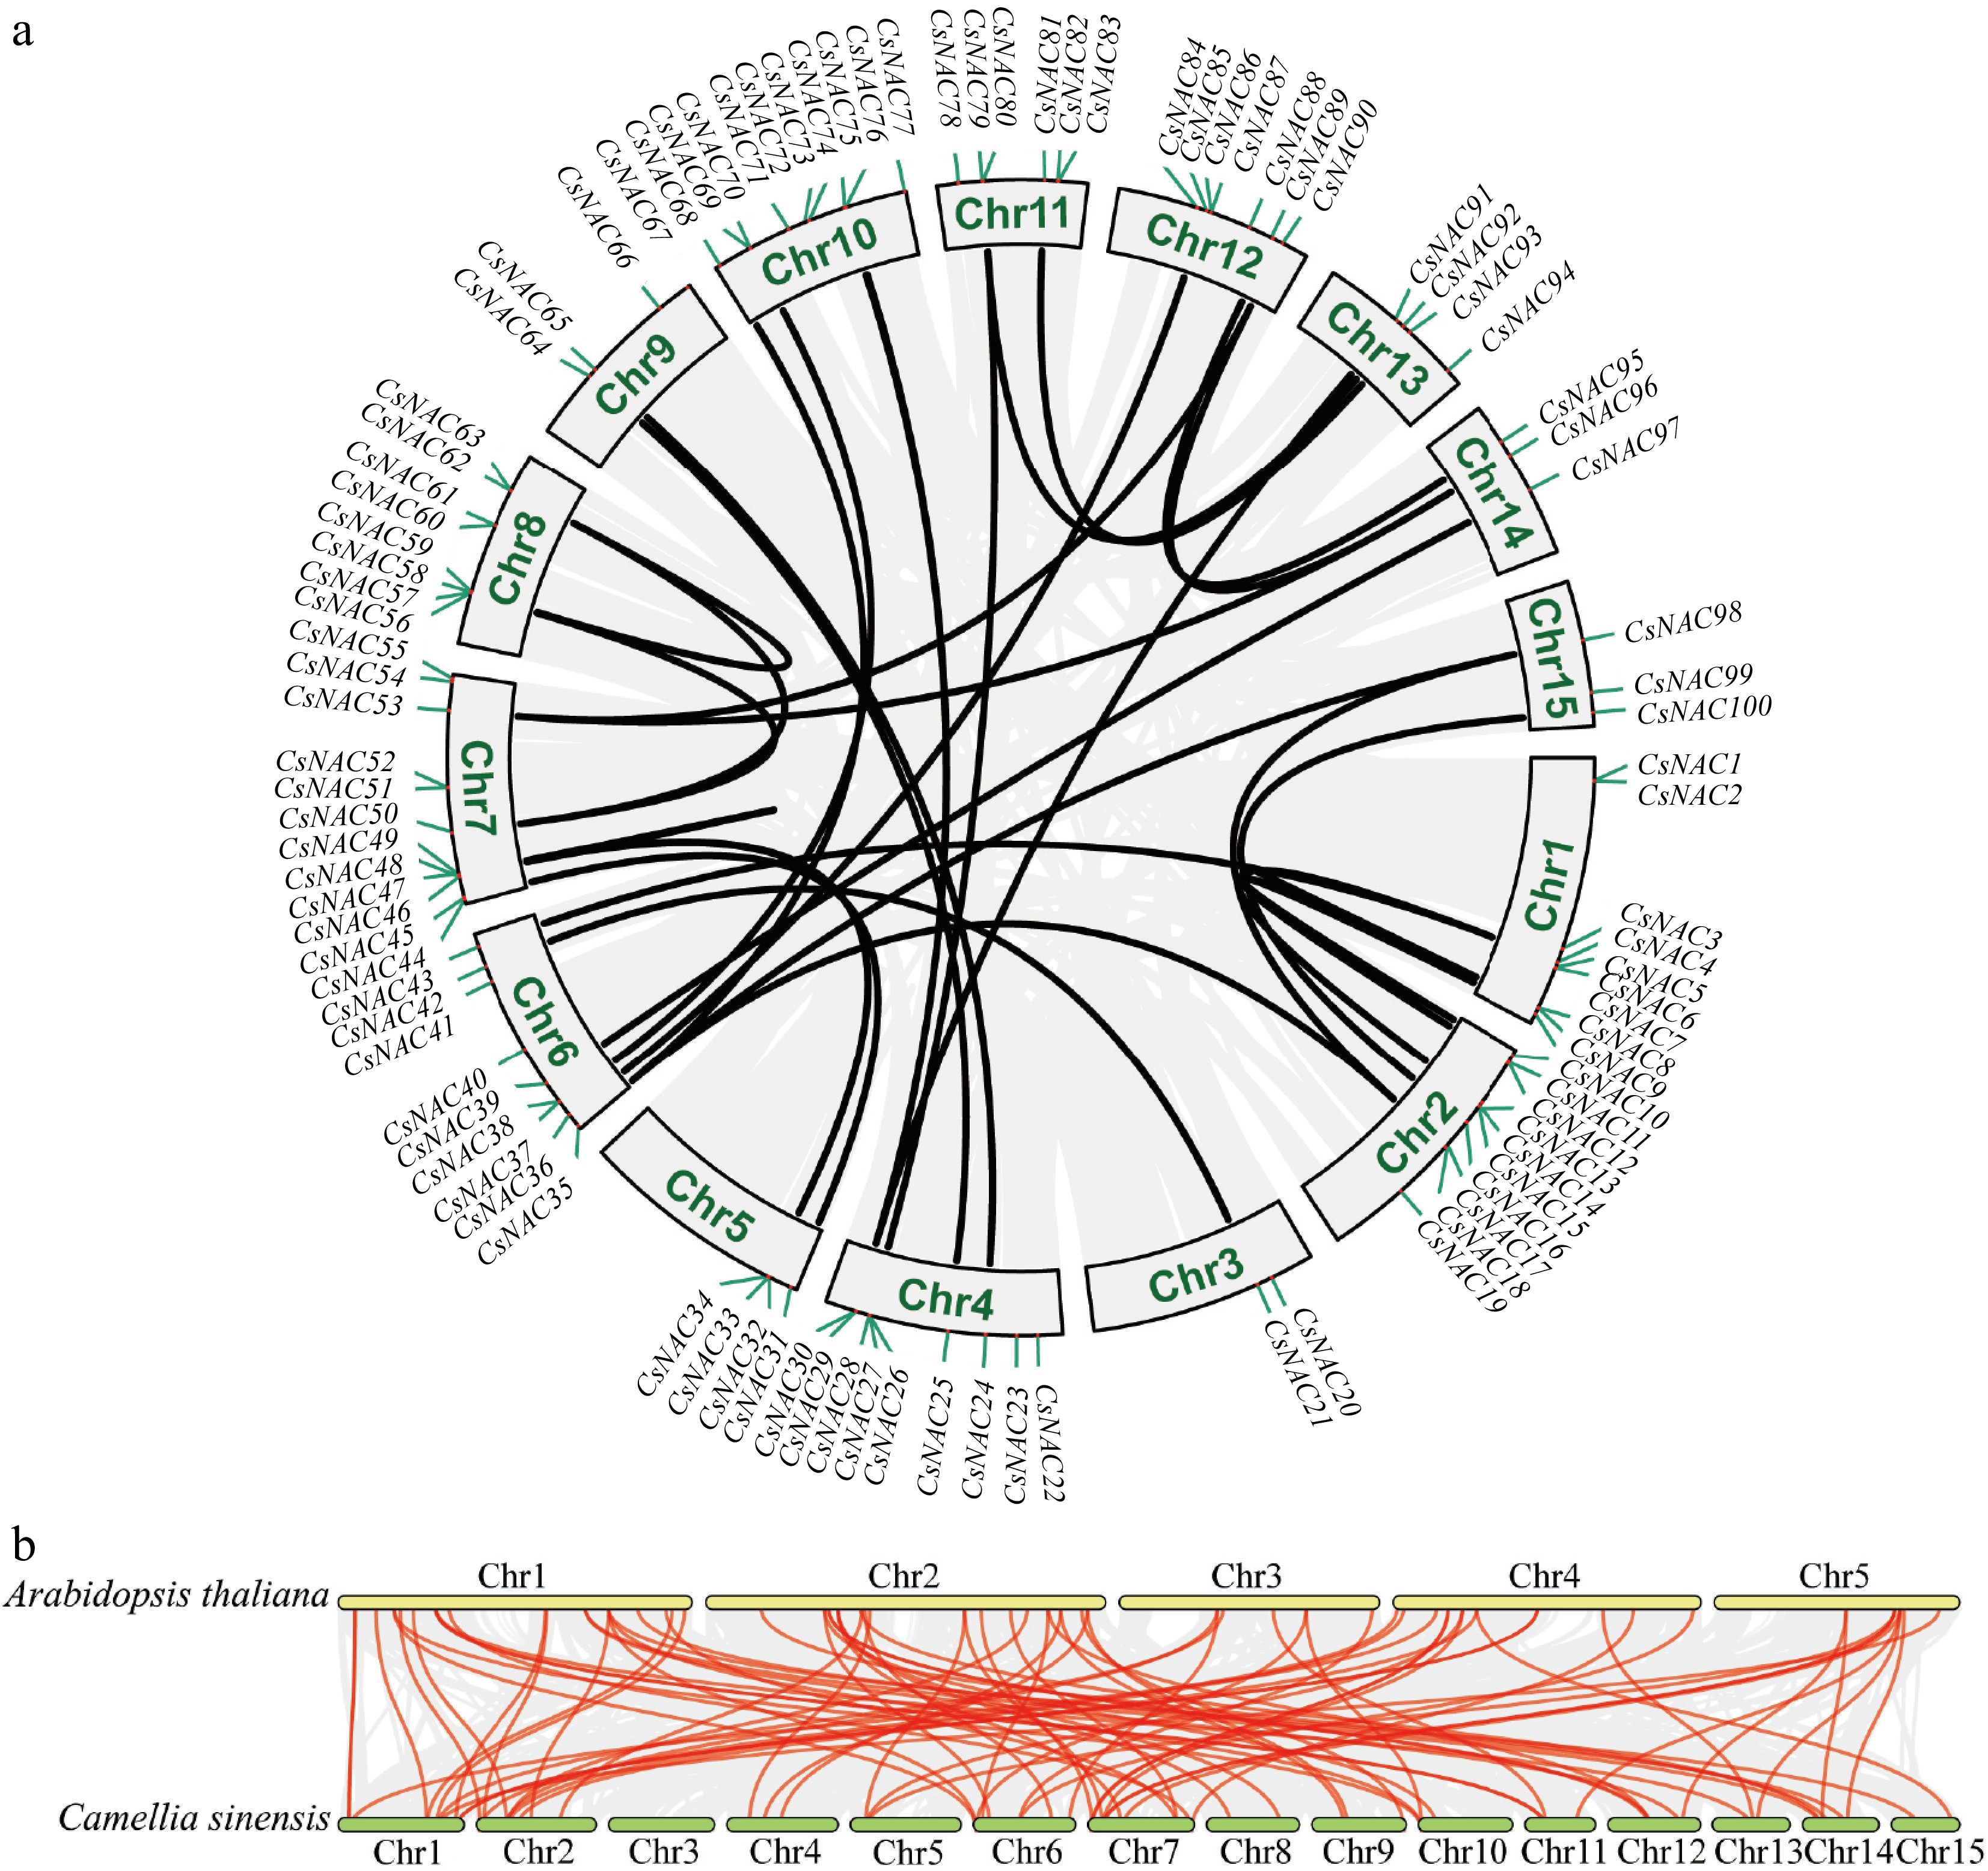
Figure 4.
Collinearity analysis of CsNAC genes. (a) The intra-species collinearity analysis of the CsNAC genes shows 100 CsNAC genes labeled according to their chromosomal distribution in the tea plant genome. The red line indicates the duplication event of the CsNAC genes, while chromosome numbers are marked within gray rectangles. (b) The interspecies collinearity analysis compares the NAC genomes of the tea plant and A. thaliana. In this analysis, the red line represents the homologous gene pairs of the CsNAC genes, whereas the gray line signifies other homologous gene pairs.
-
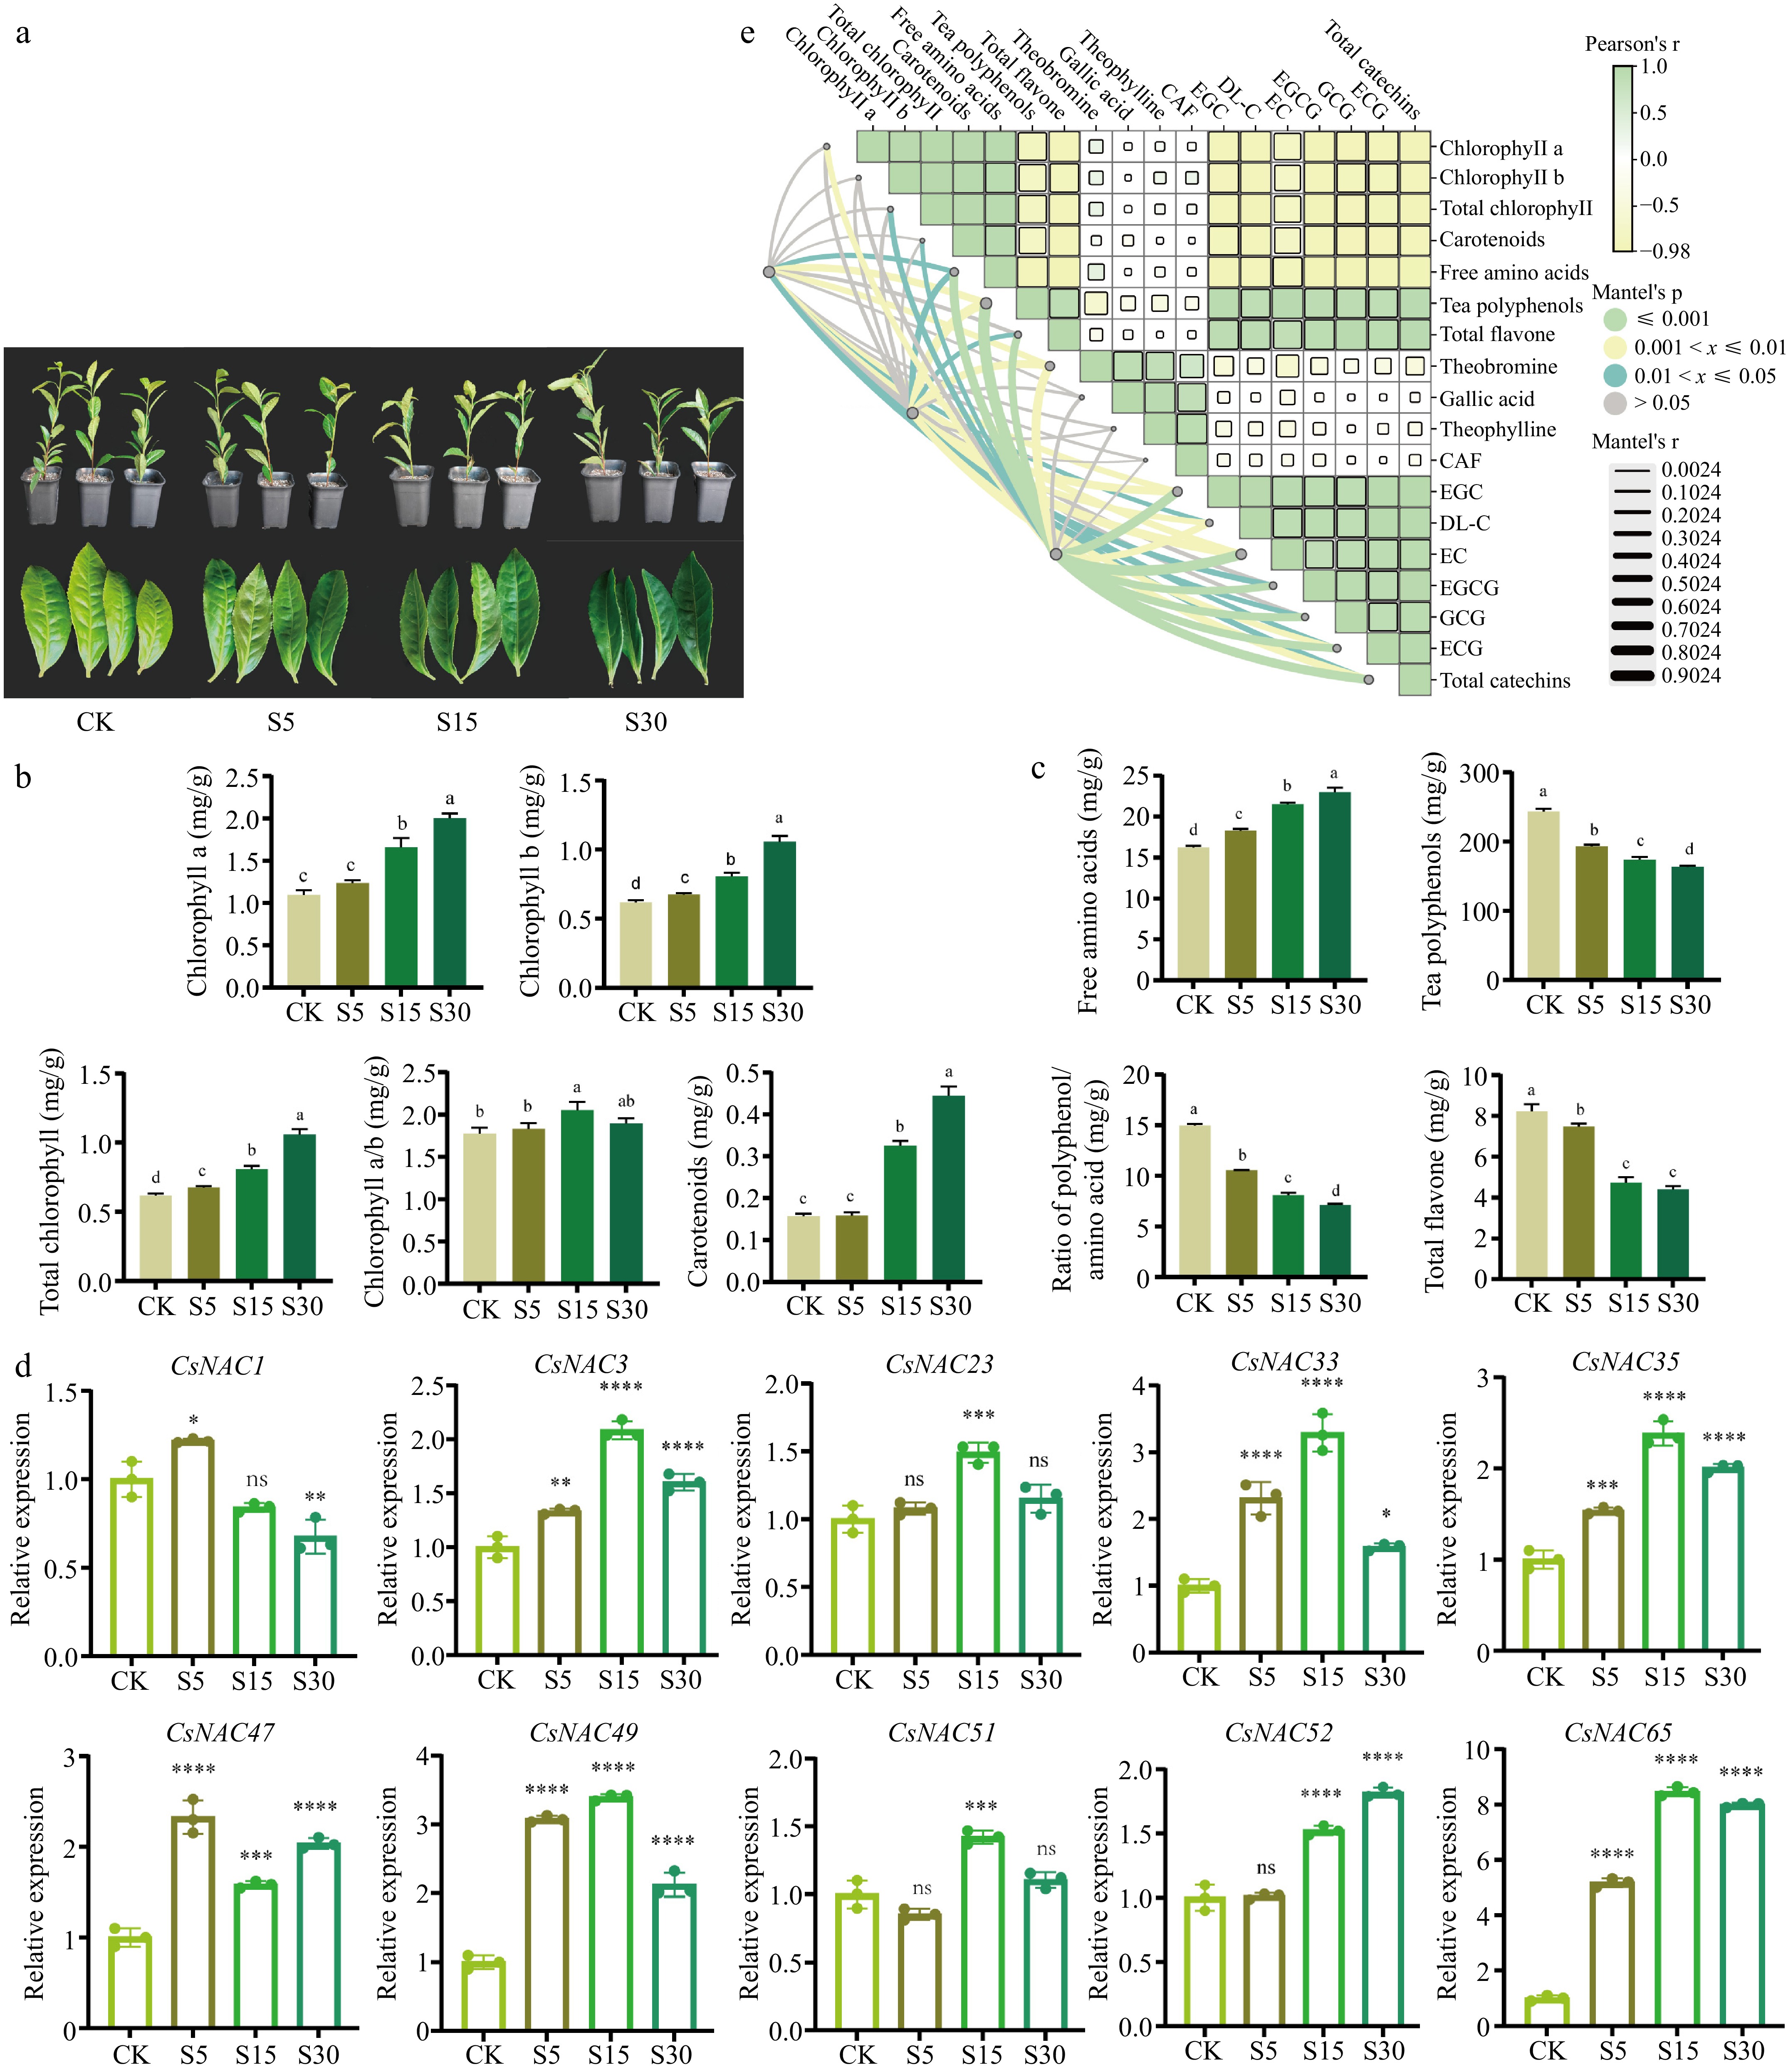
Figure 5.
Changes in the content of photosynthetic pigments, quality chemical components and gene expression analysis of tea leaves under different shade days. (a) Displays the effects of shading treatments on tea plant leaves, highlighting the color changes observed under different shading durations. (b) Shows the alterations in photosynthetic pigment content following shading treatment. (c) Depicts the modifications in quality components of tea leaves resulting from shading treatment. (d) Presents the results of RT-qPCR, which measures the expression levels of genes in tea leaves under various shading conditions. (e) Provides a correlation analysis between the expression levels of CsNAC33, CsNAC49, and CsNAC65 and the physiological indicators of tea plants. CK refers to the control group; S5 indicates shading treatment for 5 d; S15 represents shading treatment for 15 d; and S30 denotes shading treatment for 30 d. Values are expressed as means ± SD (n = 3). Different letters signify significant differences (p < 0.05) as determined by one-way ANOVA and Duncan's test. Asterisks indicate significantly different values for each group compared to the control group (* p < 0.05; ** p < 0.01; *** p < 0.001; **** p < 0.0001).
-
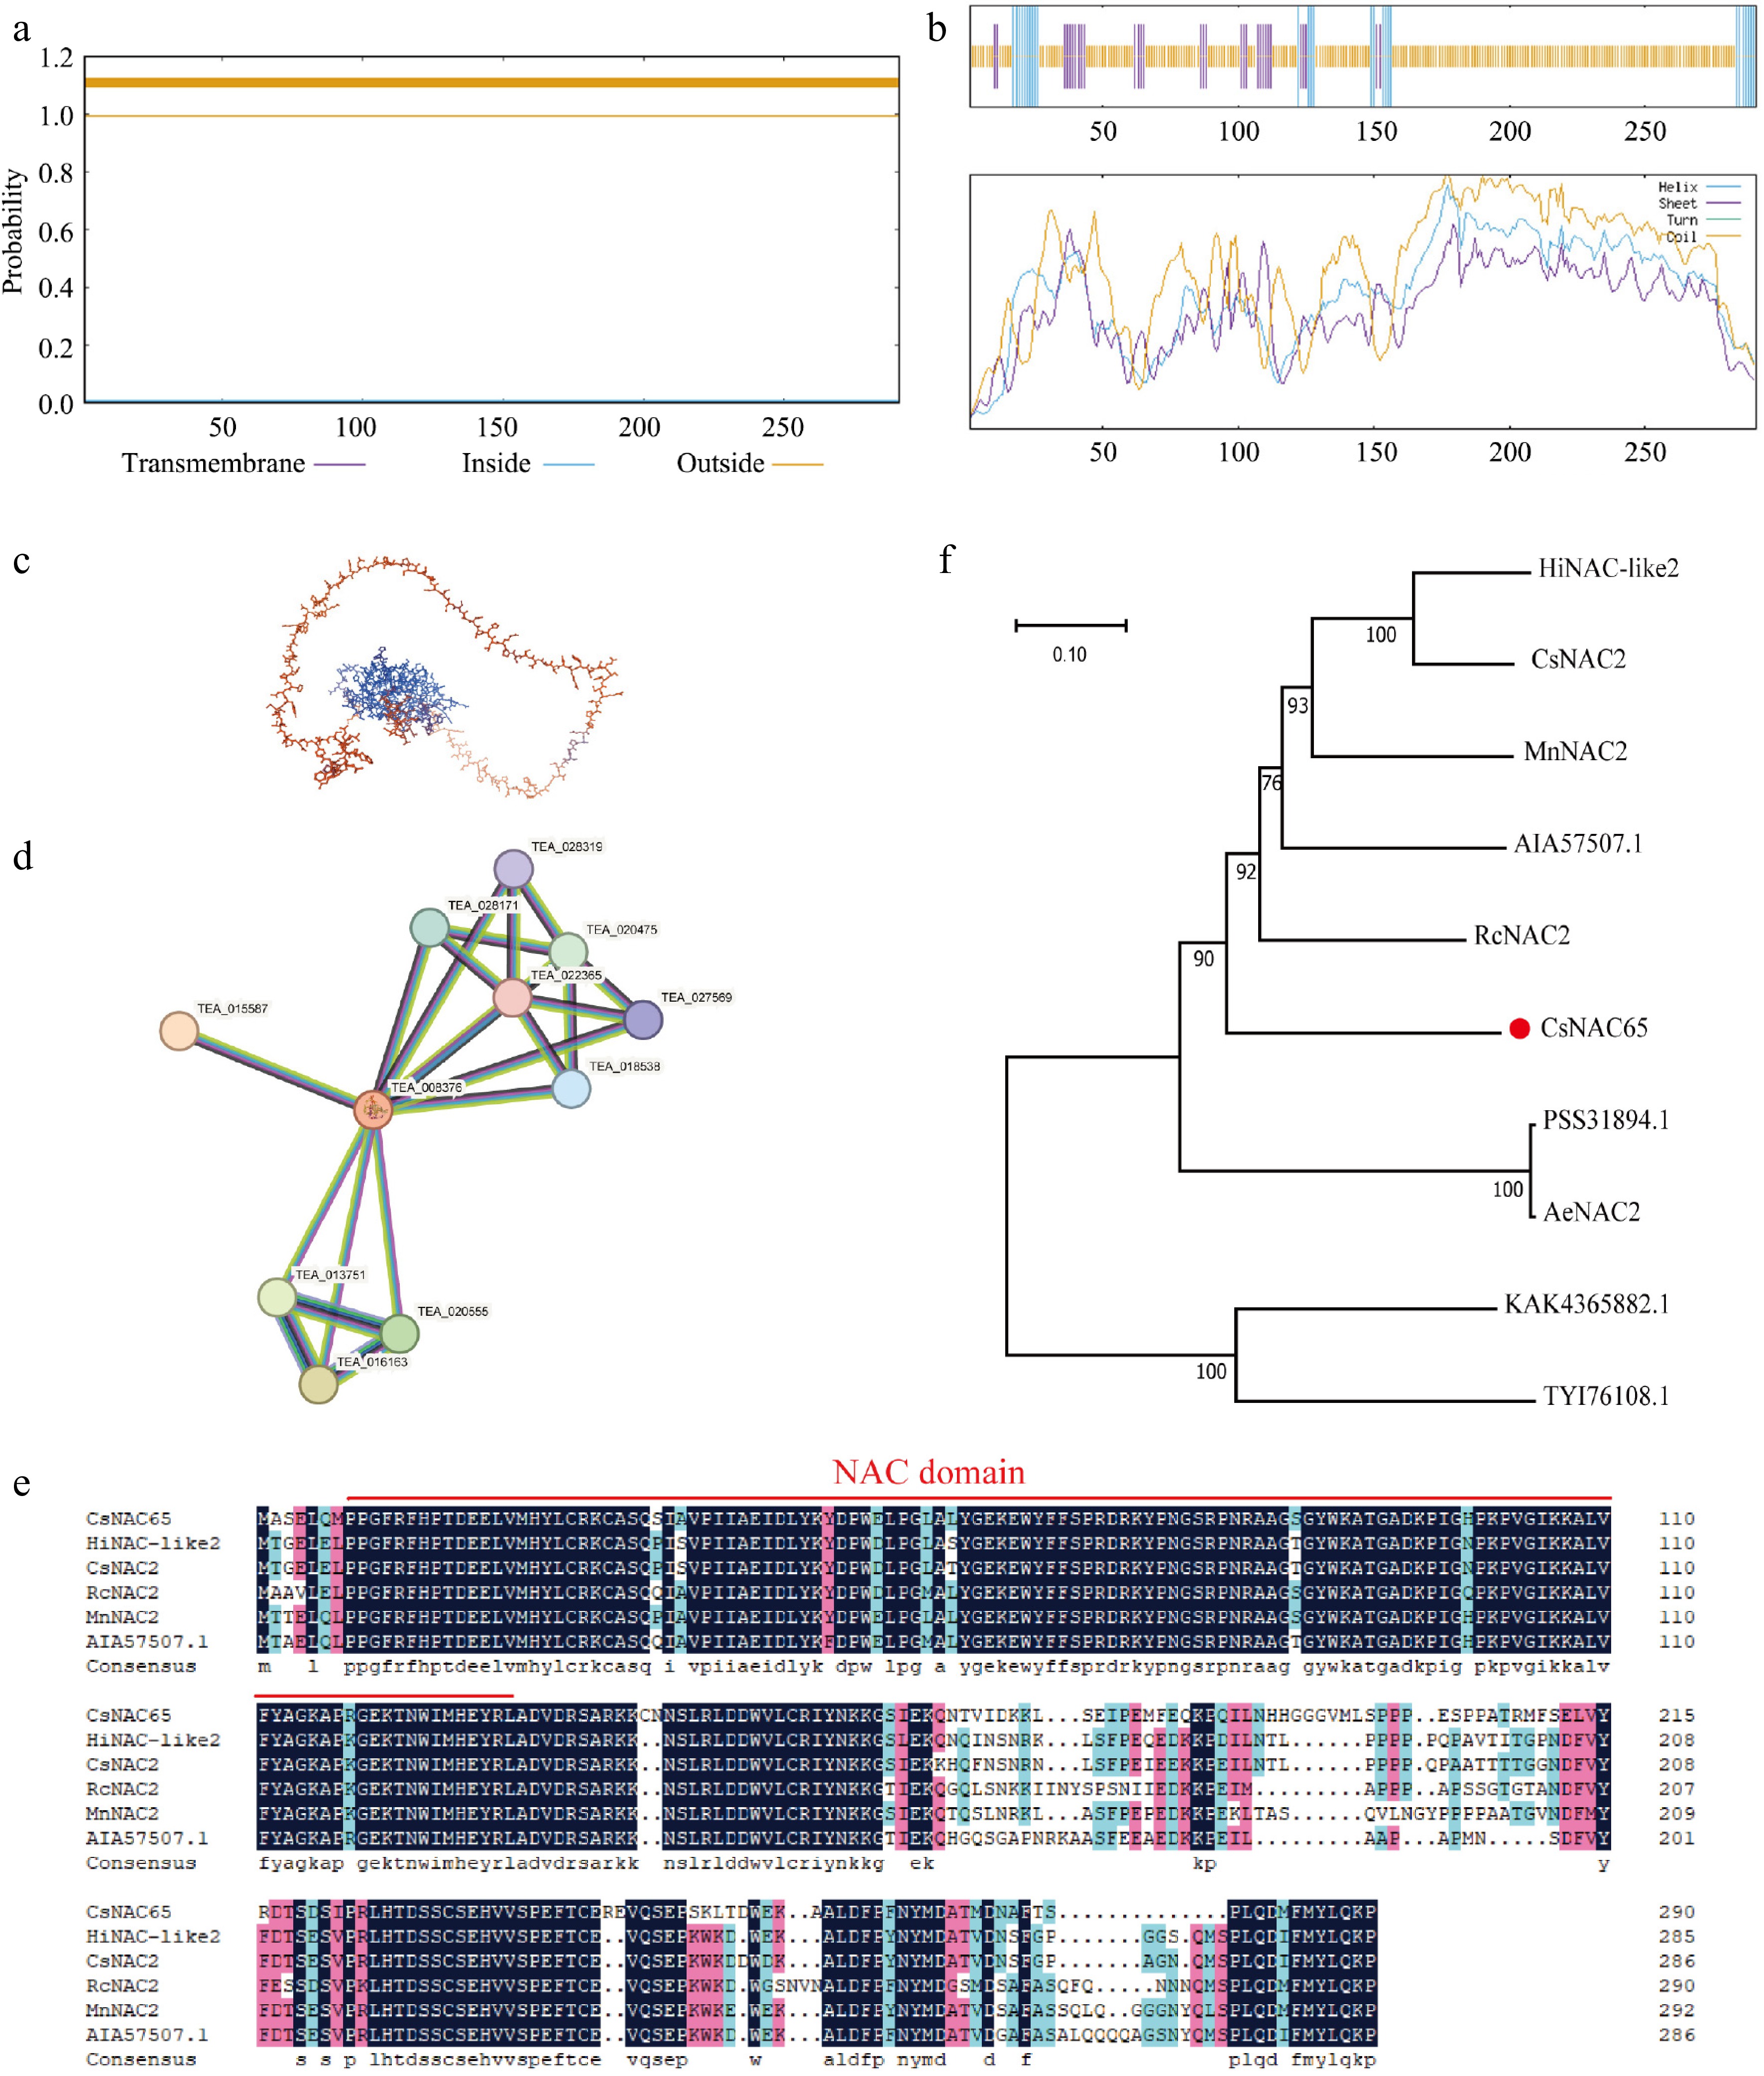
Figure 6.
Protein sequence analysis of CsNAC65. (a) Prediction of the transmembrane domain of CsNAC65. (b) Secondary structure prediction of CsNAC65. (c) Tertiary structure prediction of CsNAC65. (d) Prediction and analysis of protein interactions of CsNAC65. (e) Multiple alignments of the amino acid sequences of CsNAC65 and other plants. The red line indicates the conserved DNA binding domain. (f) Phylogenetic analysis of CsNAC65 (marked by a red dot) and other plants. The control species are: Humulus lupulus: HiNAC-like2, XP_062099271.1; Cannabis sativa: CsNAC2, XP_030493913.1; Ricinus communis, RcNAC2, XP_015575373.1; Morus notabilis, MnNAC2, XP_010095416.1; Boehmeria nivea, AIA57507.1; Actinidia chinensis var. Chinensis, PSS31894.1; Actinidia eriantha, AeNAC2, XP 057490780.1; Anisodus tanguticus, KAK4365882.1; Gossypium mustelinum, TYI76108.1.
-
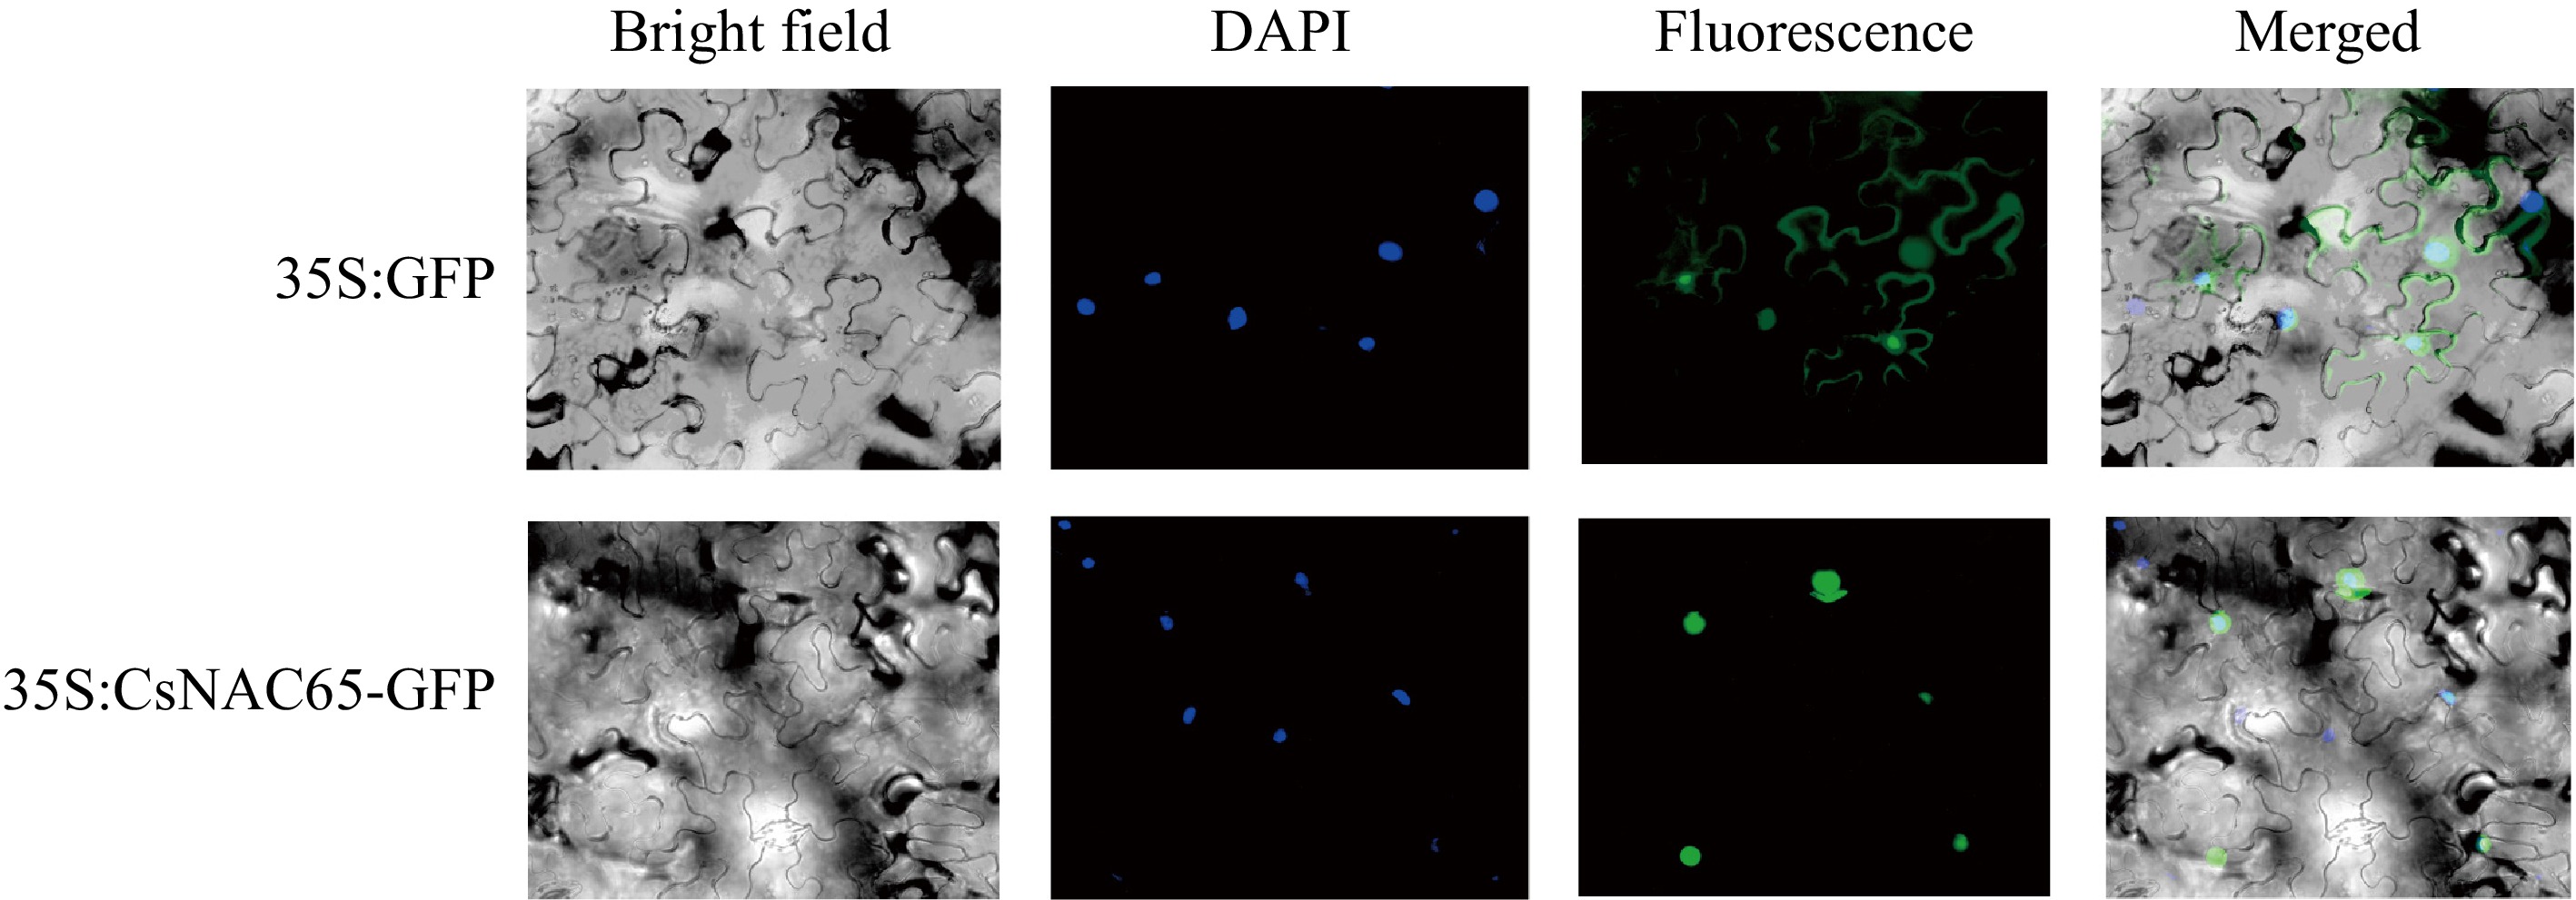
Figure 7.
Subcellular localization of CsNAC65 protein in tobacco epidermal cells. 35S:GFP, the vector used for transformation, in which the 35S promoter drives GFP expression; 35S:CsNAC65-GFP, the vector used for transformation, CsNAC65 is expressed fused to GFP driven by the 35S promoter. The scale bar represents 10 μm.
-
mg/g (DW) CK S5 S15 S30 Theobromine 0.65 ± 0.02c 1.59 ± 0.20a 1.09 ± 0.07b 1.28 ± 0.07b Gallic acid 0.16 ± 0.01c 0.37 ± 0.016a 0.18 ± 0.01c 0.25 ± 0.02b Theophylline 0.08 ± 0.01c 0.18 ± 0.01a 0.08 ± 0.01c 0.14 ± 0.01b CAF 32.62 ± 2.56b 42.01 ± 2.02a 29.99 ± 1.33b 39.81 ± 1.35a DL-C 5.77 ± 0.58a 4.85 ± 0.34b 3.96 ± 0.09c 2.56 ± 0.02d EC 12.20 ± 1.53a 8.66 ± 0.54b 7.30 ± 0.31bc 6.51 ± 0.35c ECG 31.55 ± 3.27a 28.21 ± 0.49b 22.88 ± 0.60c 20.15 ± 0.60c GCG 3.36 ± 0.38a 2.78 ± 0.10b 1.56 ± 0.27c 1.26 ± 0.30c EGC 40.36 ± 3.06a 31.93 ± 1.60b 26.95 ± 0.52c 20.85 ± 0.67d EGCG 97.20 ± 4.40a 88.54 ± 2.17b 78.88 ± 1.46c 68.78 ± 2.74d Total catechins 190.42 ± 3.96a 163.29 ± 3.146b 141.53 ± 1.49c 118.06 ± 6.59d The values are expressed as means ± SD (n = 3), with different letters indicating significant differences (p < 0.05) as determined by one-way ANOVA and the Duncan test. DW, dry weight. Table 1.
Presents the effect of shading on the catechin components of tea leaves (mg/g).
Figures
(7)
Tables
(1)