-
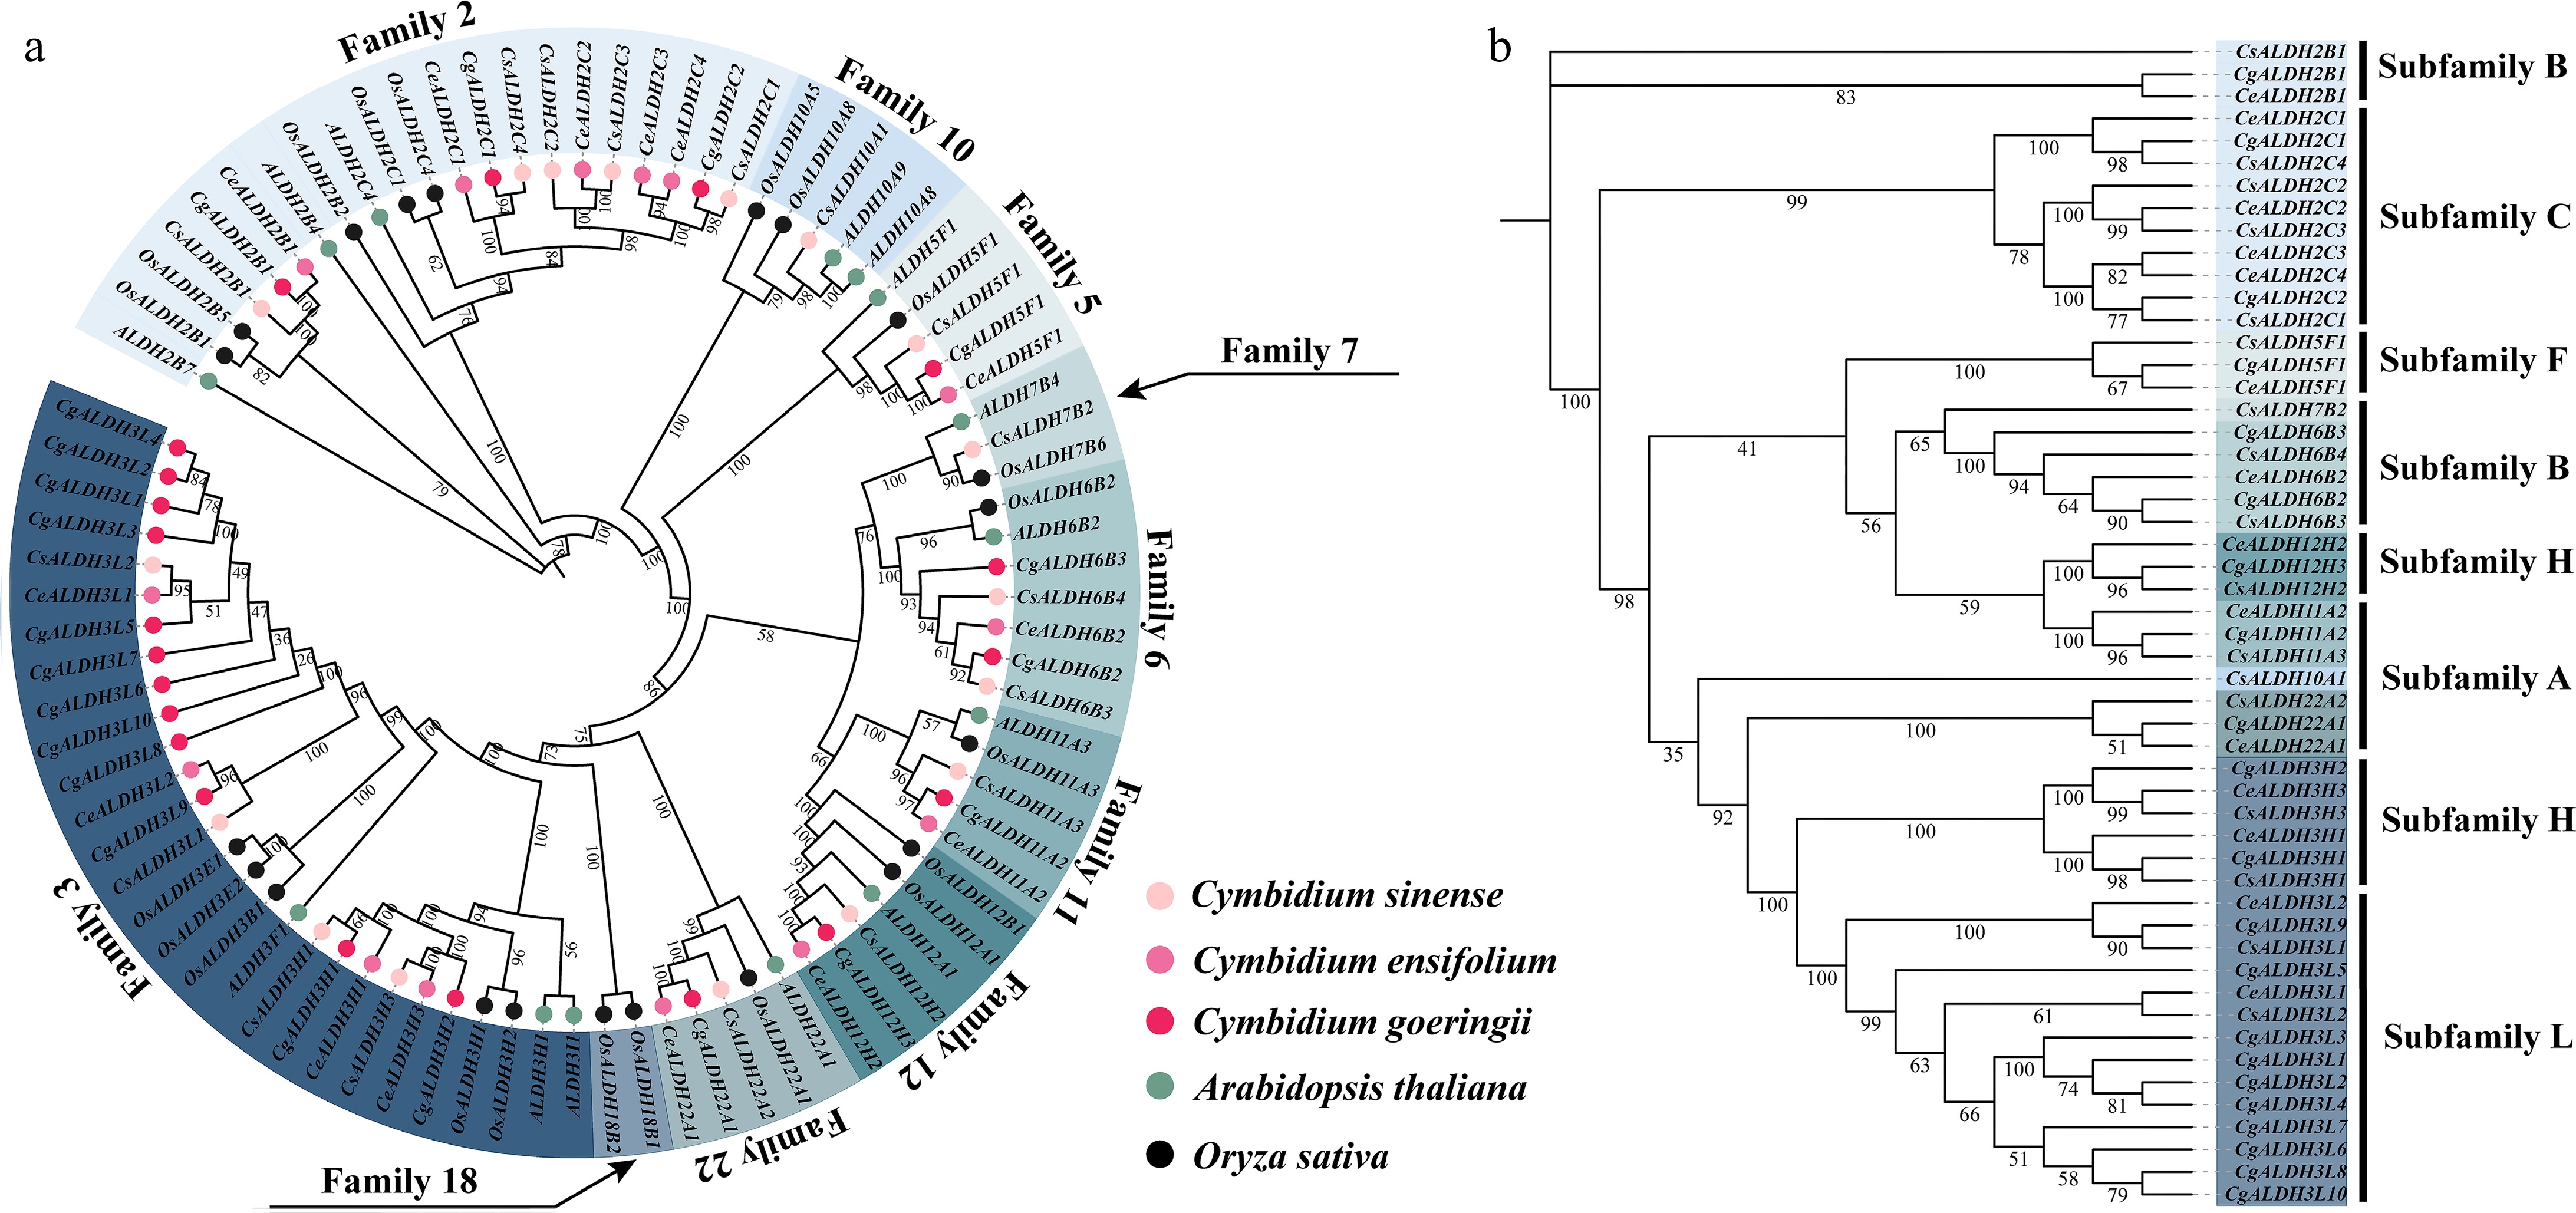
Figure 1.
Phylogenetic analysis of ALDH family members. (a) Phylogenetic tree constructed using ALDH family members from C. sinense, C. ensifolium, C. goeringii, A. thaliana, and O. sativa. (b) In the phylogenetic tree derived from C. sinense, C. ensifolium, and C. goeringii, the text on the right indicates the classification of protein subfamilies. These subfamilies are categorized into seven groups (A, B, C, F, H, and L), with subfamily L being a newly identified group in this study.
-
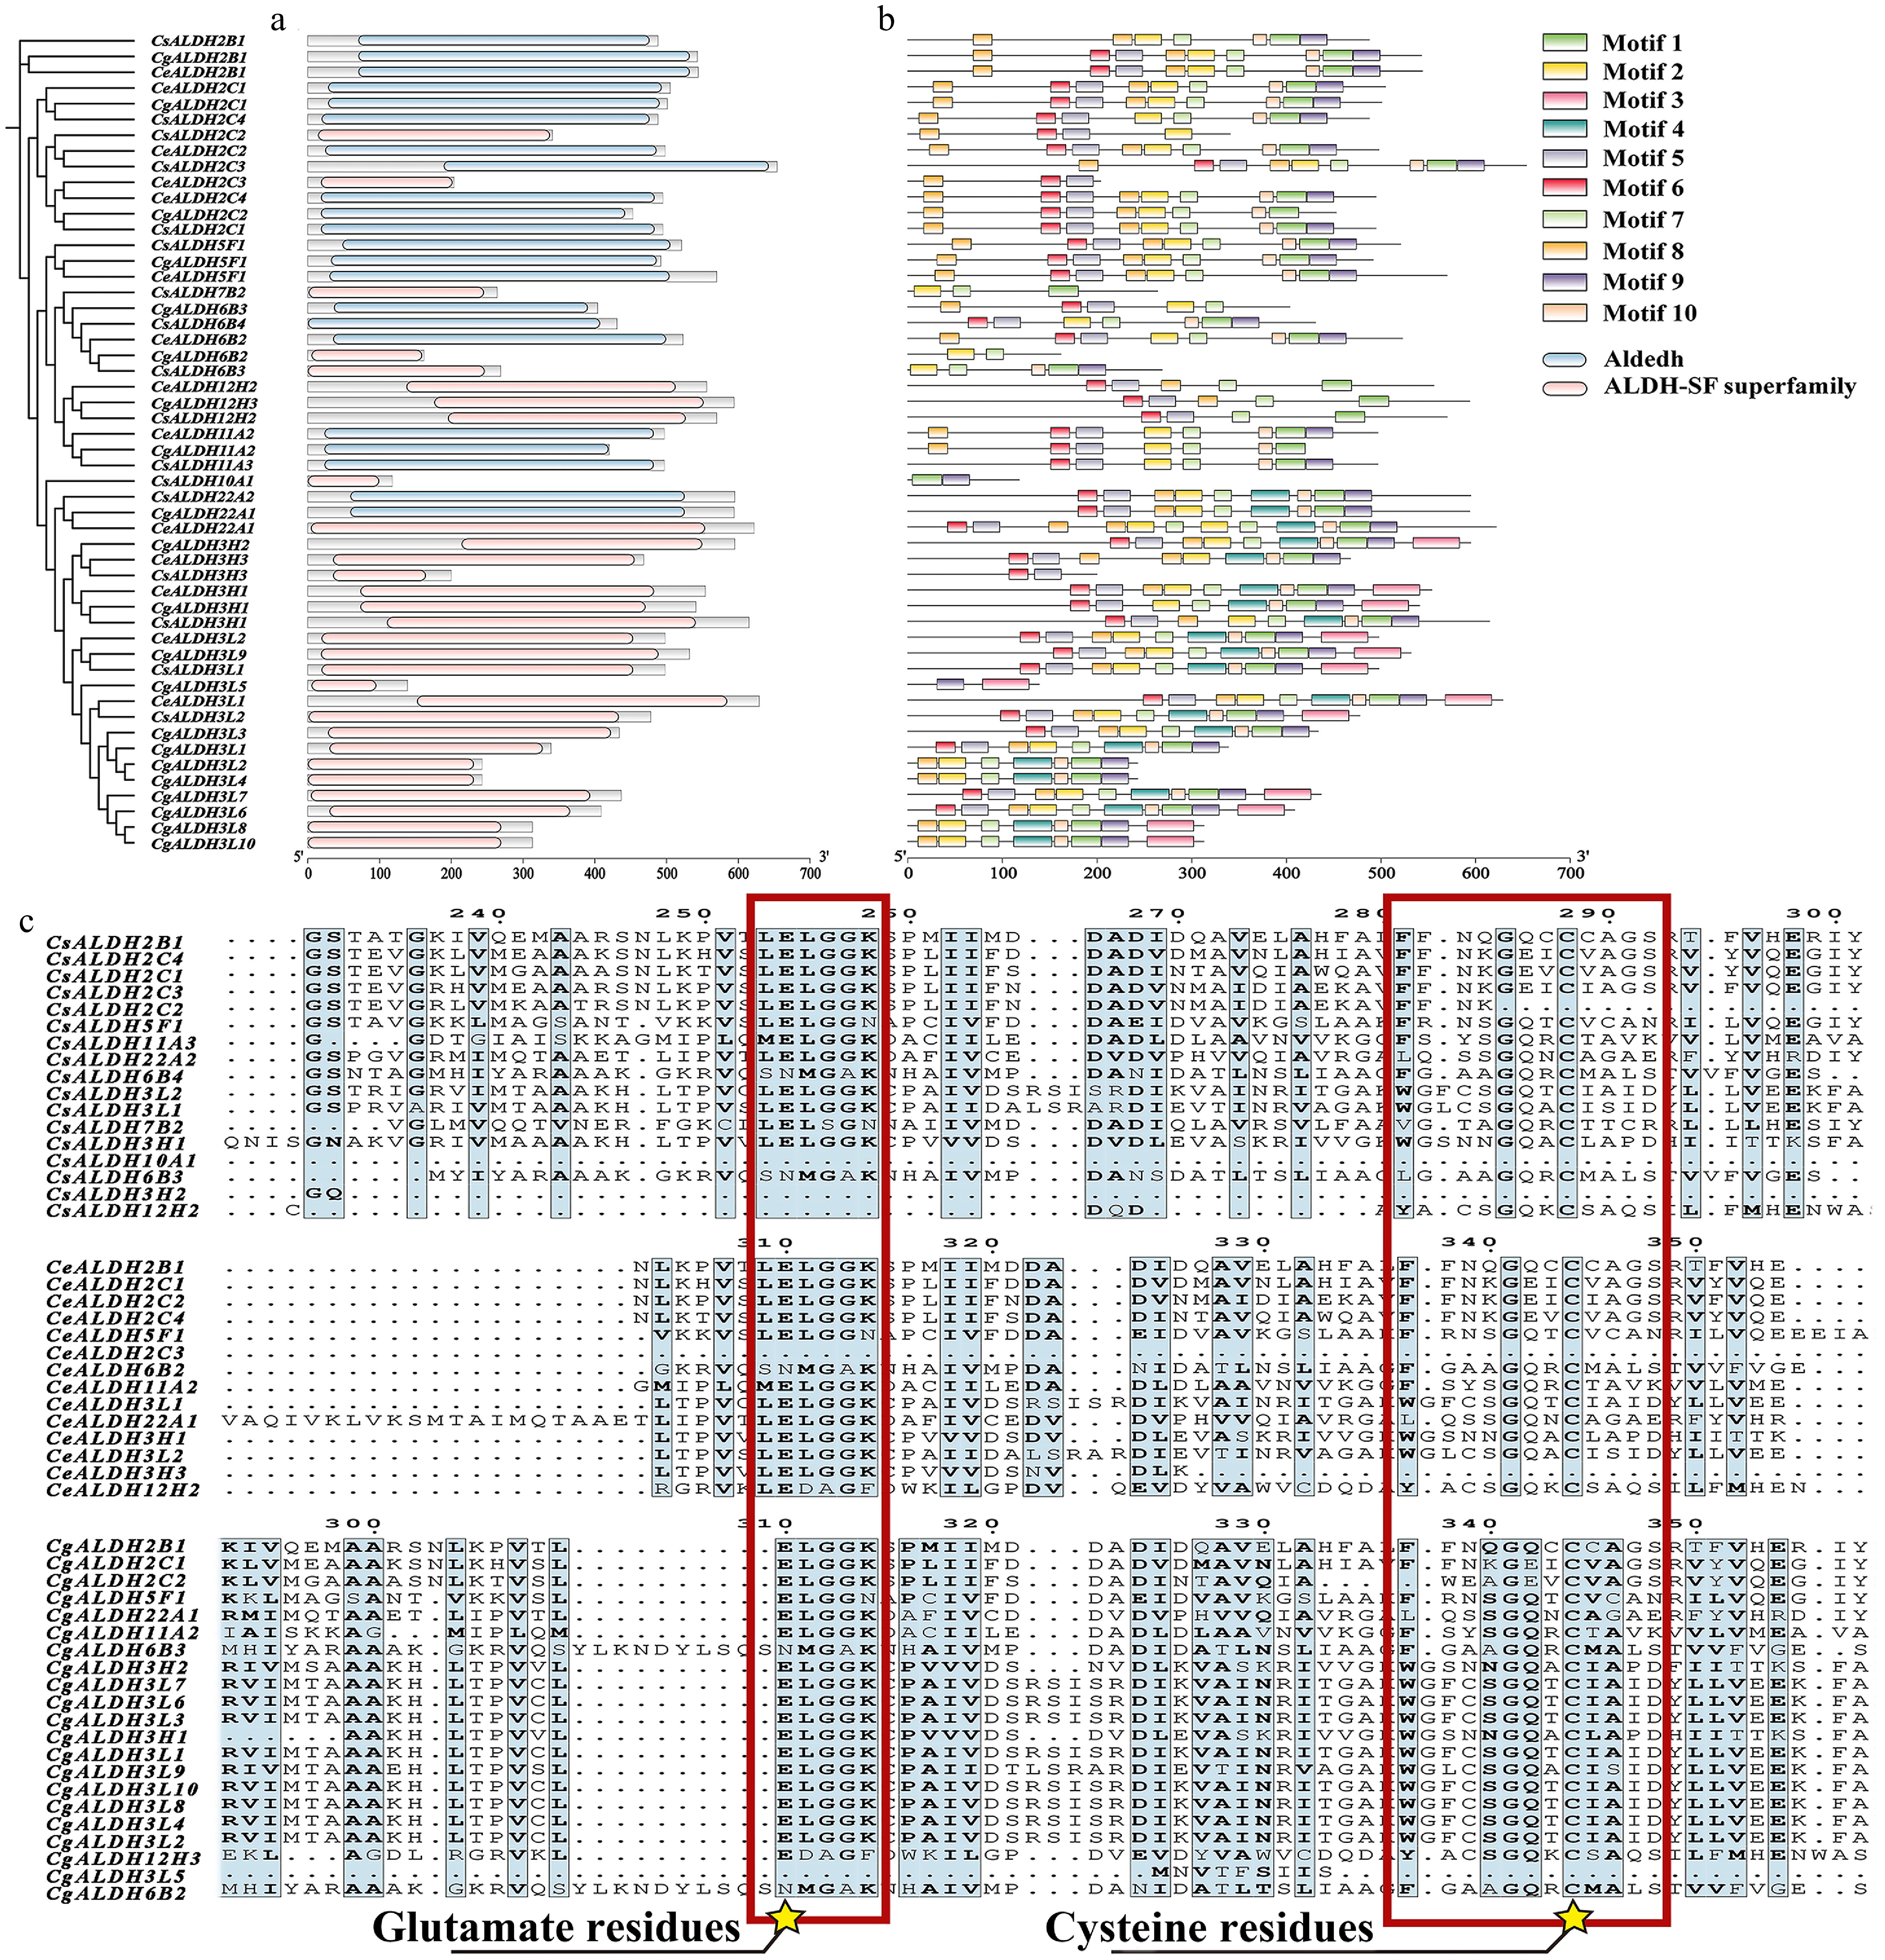
Figure 2.
Conserved domain analysis and multiple sequence alignment of the CsALDH, CeALDH, and CgALDH gene families. (a) Conserved domains, where blue represents the Aldedh domain (PF00171) and pink represents the ALDH-SF superfamily domain (PF00171). (b) Motifs of proteins, with different colors representing distinct motifs numbered from 1 to 10. The scale at the bottom allows for estimation of protein lengths. (c) Multiple sequence alignment of all identified proteins. Conserved motifs and active sites of glutamic acid residues and conserved motifs and active sites of cysteine residues are marked with red squares and yellow star symbols.
-
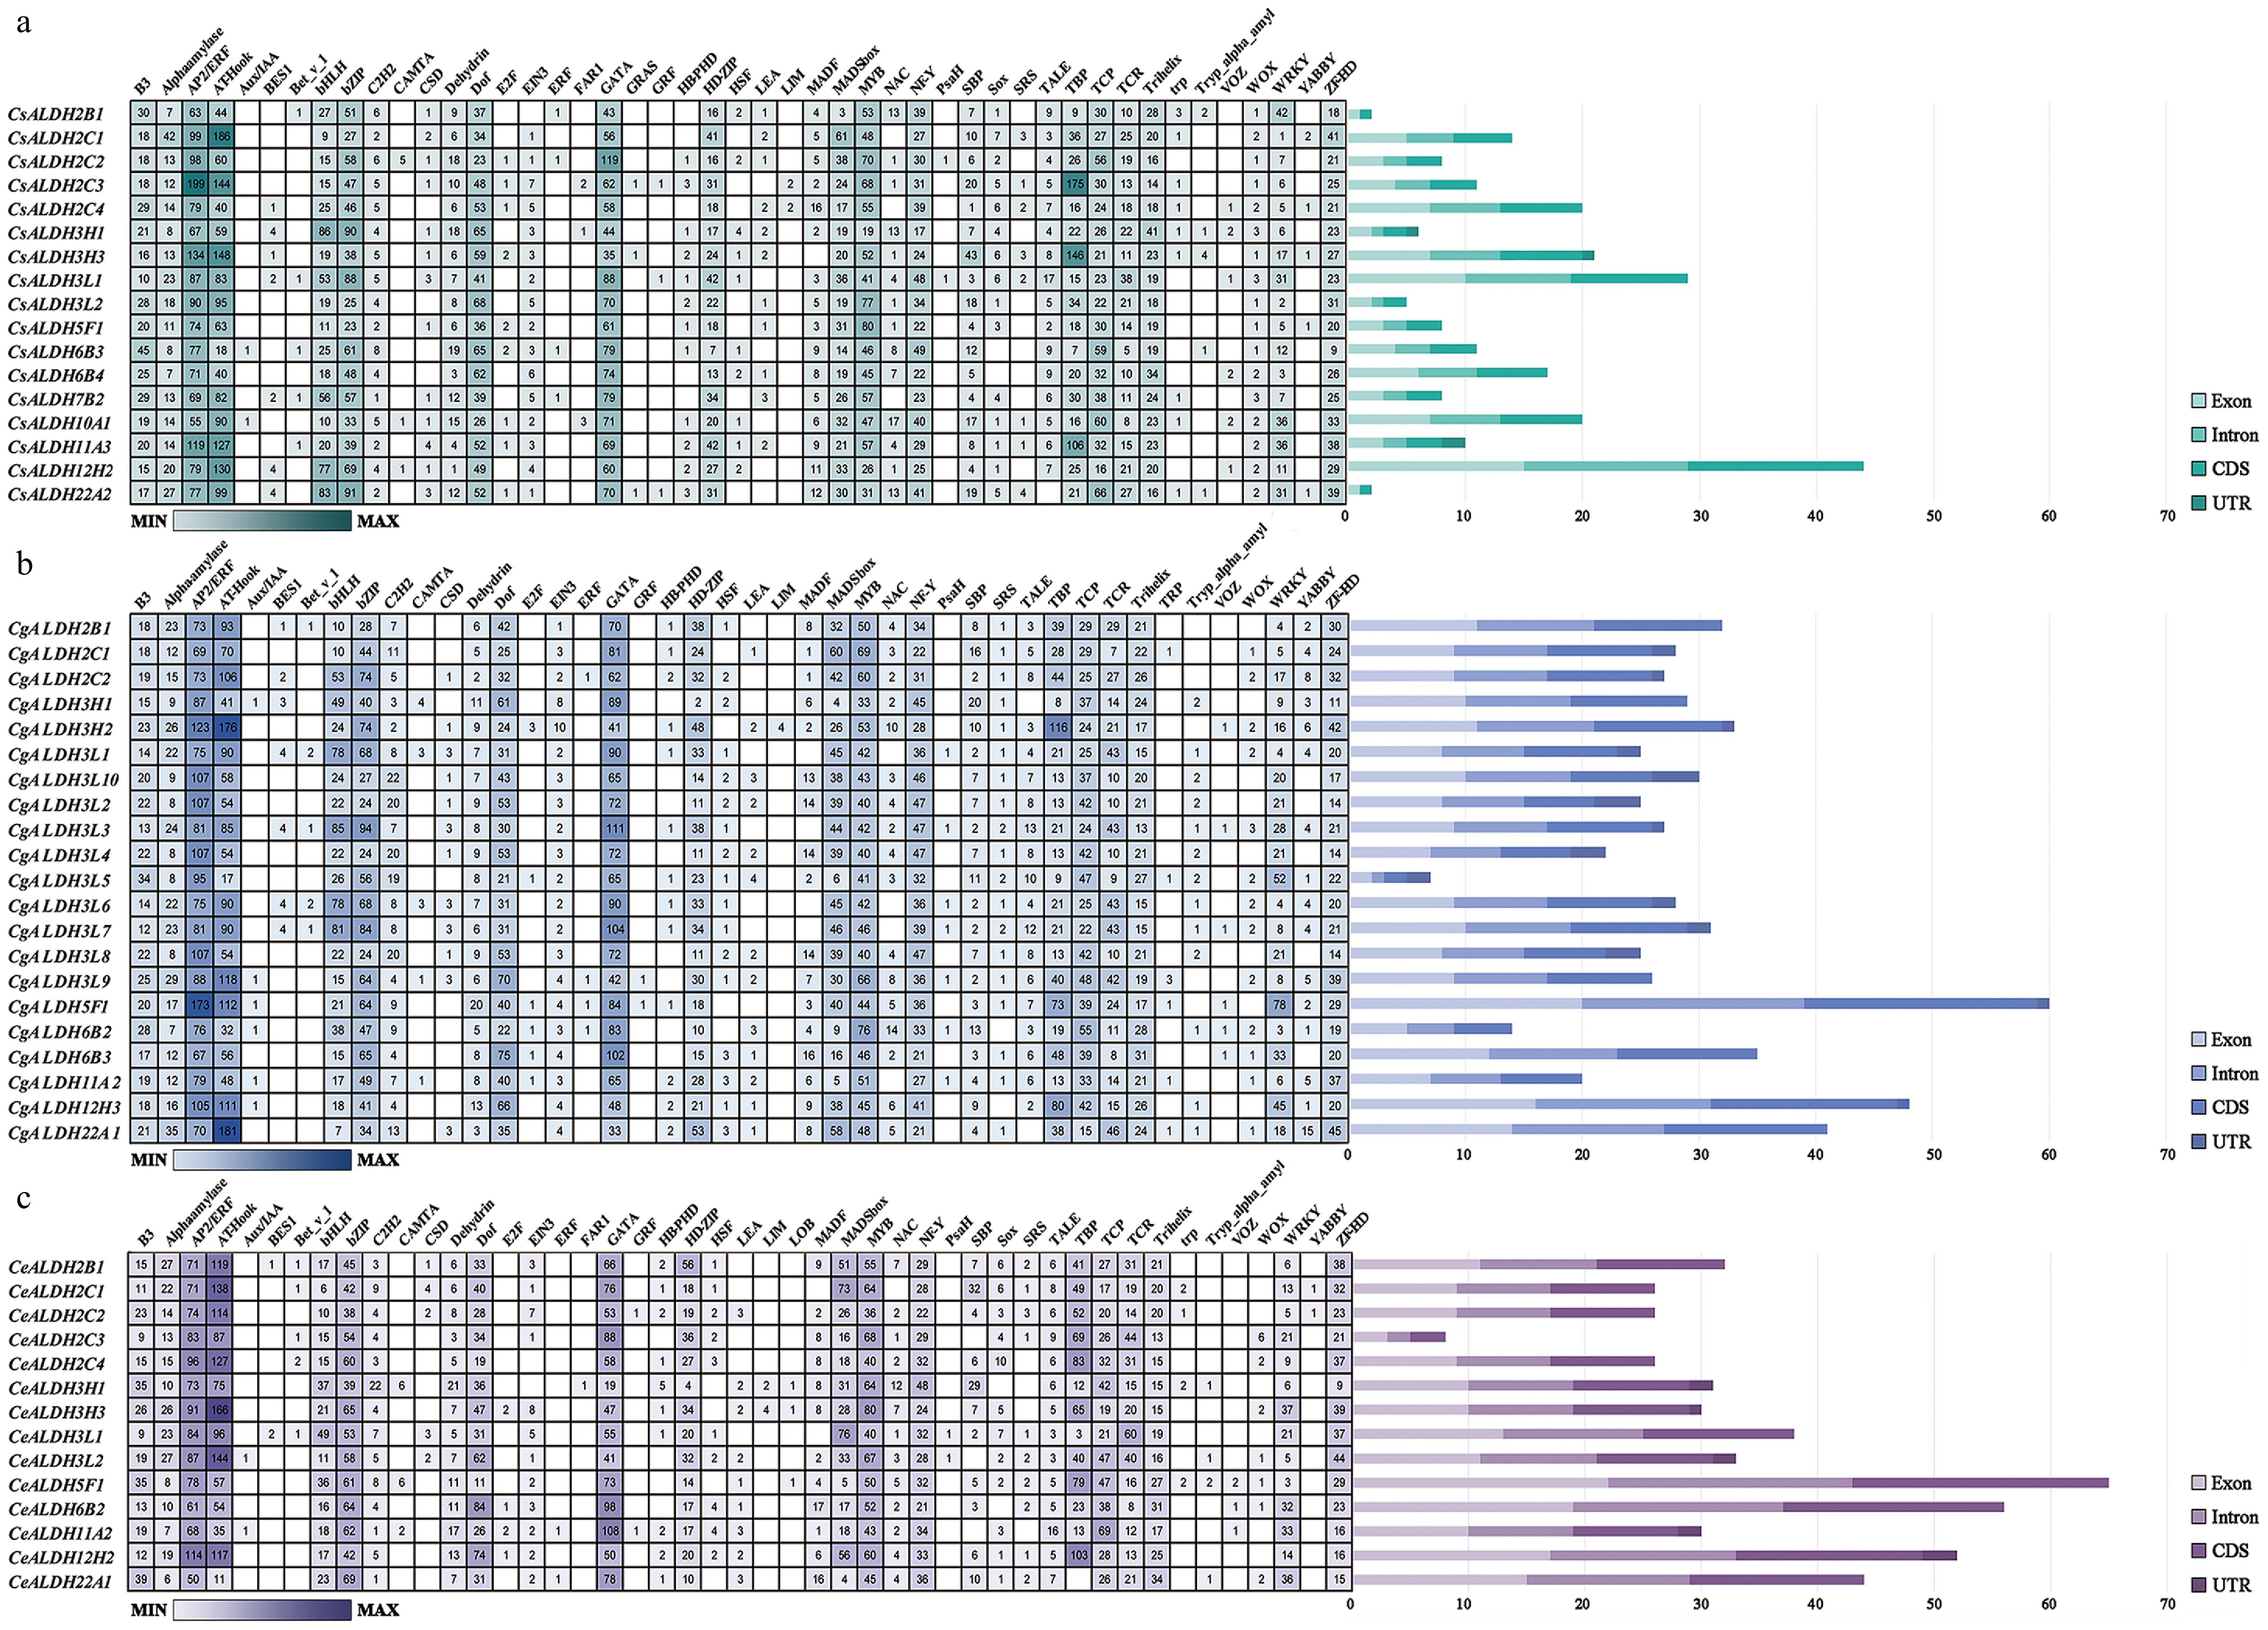
Figure 3.
Cis-element prediction and gene structure analysis. The gene structure of each ALDH family member is visualized, depicting the counts of exons, introns, CDSs, and UTRs. Distinct colors are used to differentiate these structural components. (a) C. sinense. (b) C. goeringii. (c) C. ensifolium. The quantity can be estimated based on the scale at the bottom.
-
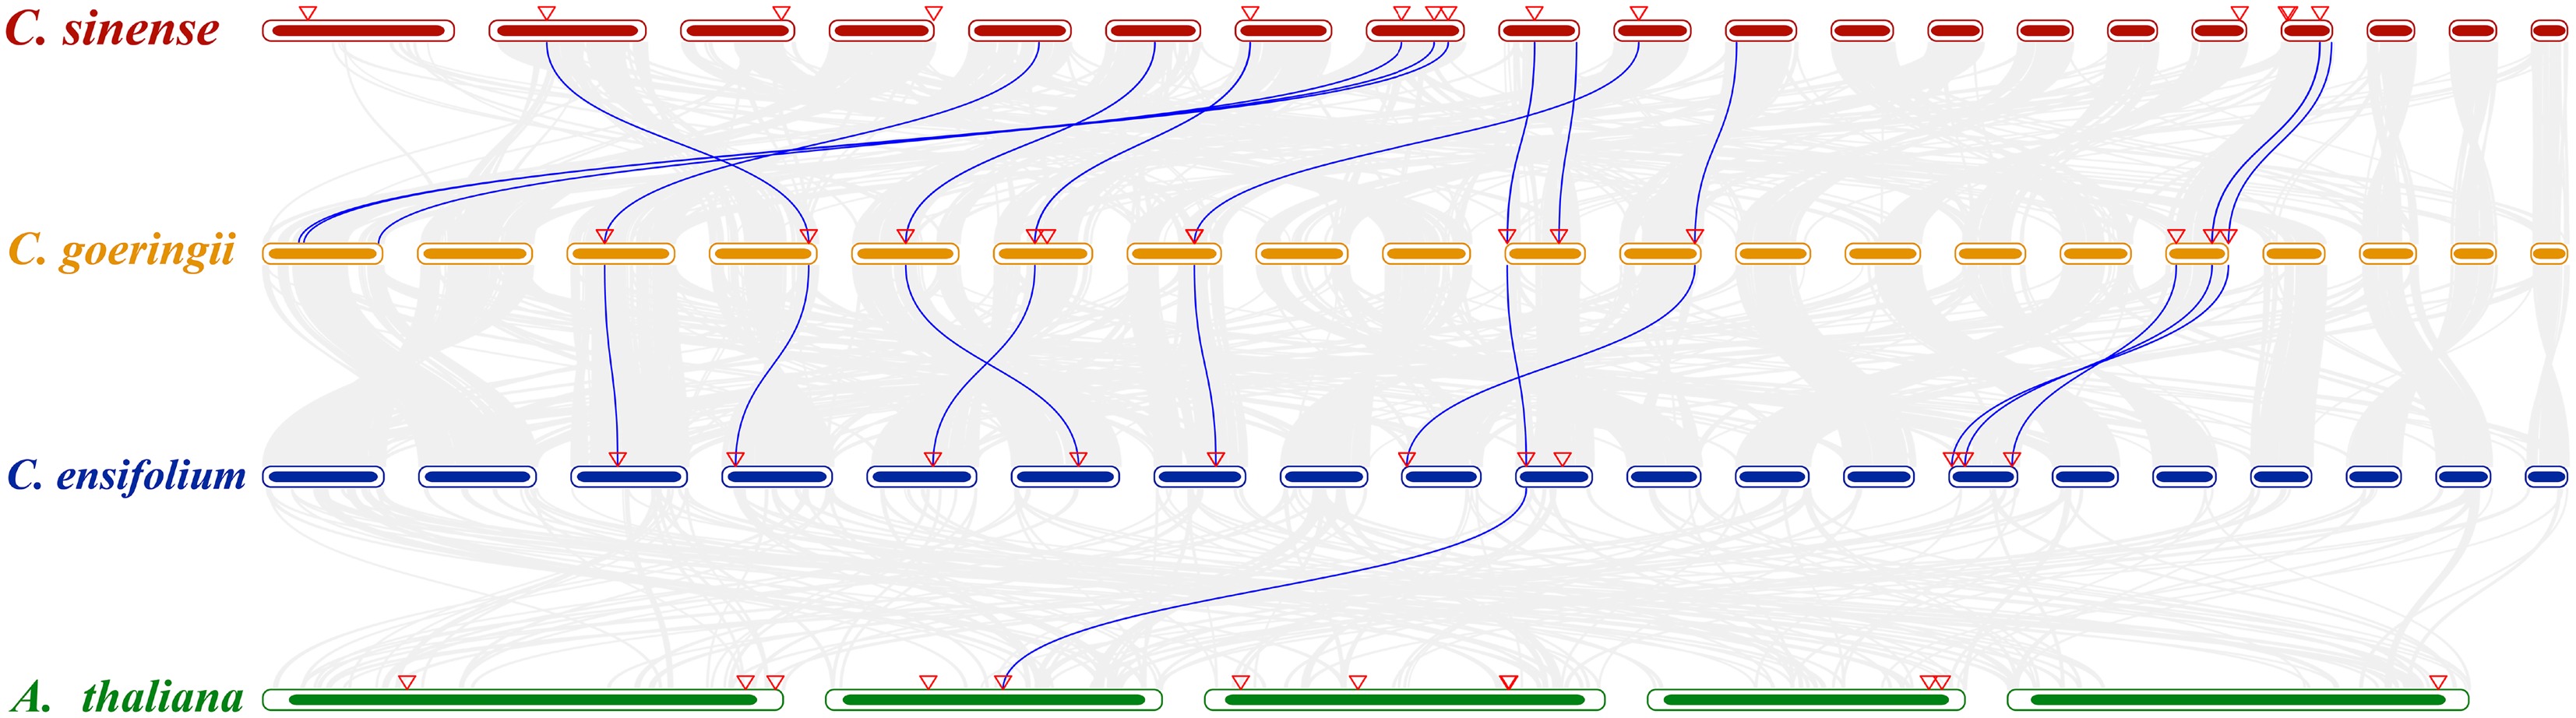
Figure 4.
Collinearity analysis between C. sinense, C. goeringii, C. ensifolium, and A. thaliana. The chromosomes of orchids are arranged from left to right as Chr01 to Chr20. The chromosomes of A. thaliana are arranged from left to right as Chr01 to Chr05. The gray lines in the background indicate collinear blocks within the three genomes. The blue lines highlight syntenic ALDH pairs. Red triangles indicate ALDH localization.
-
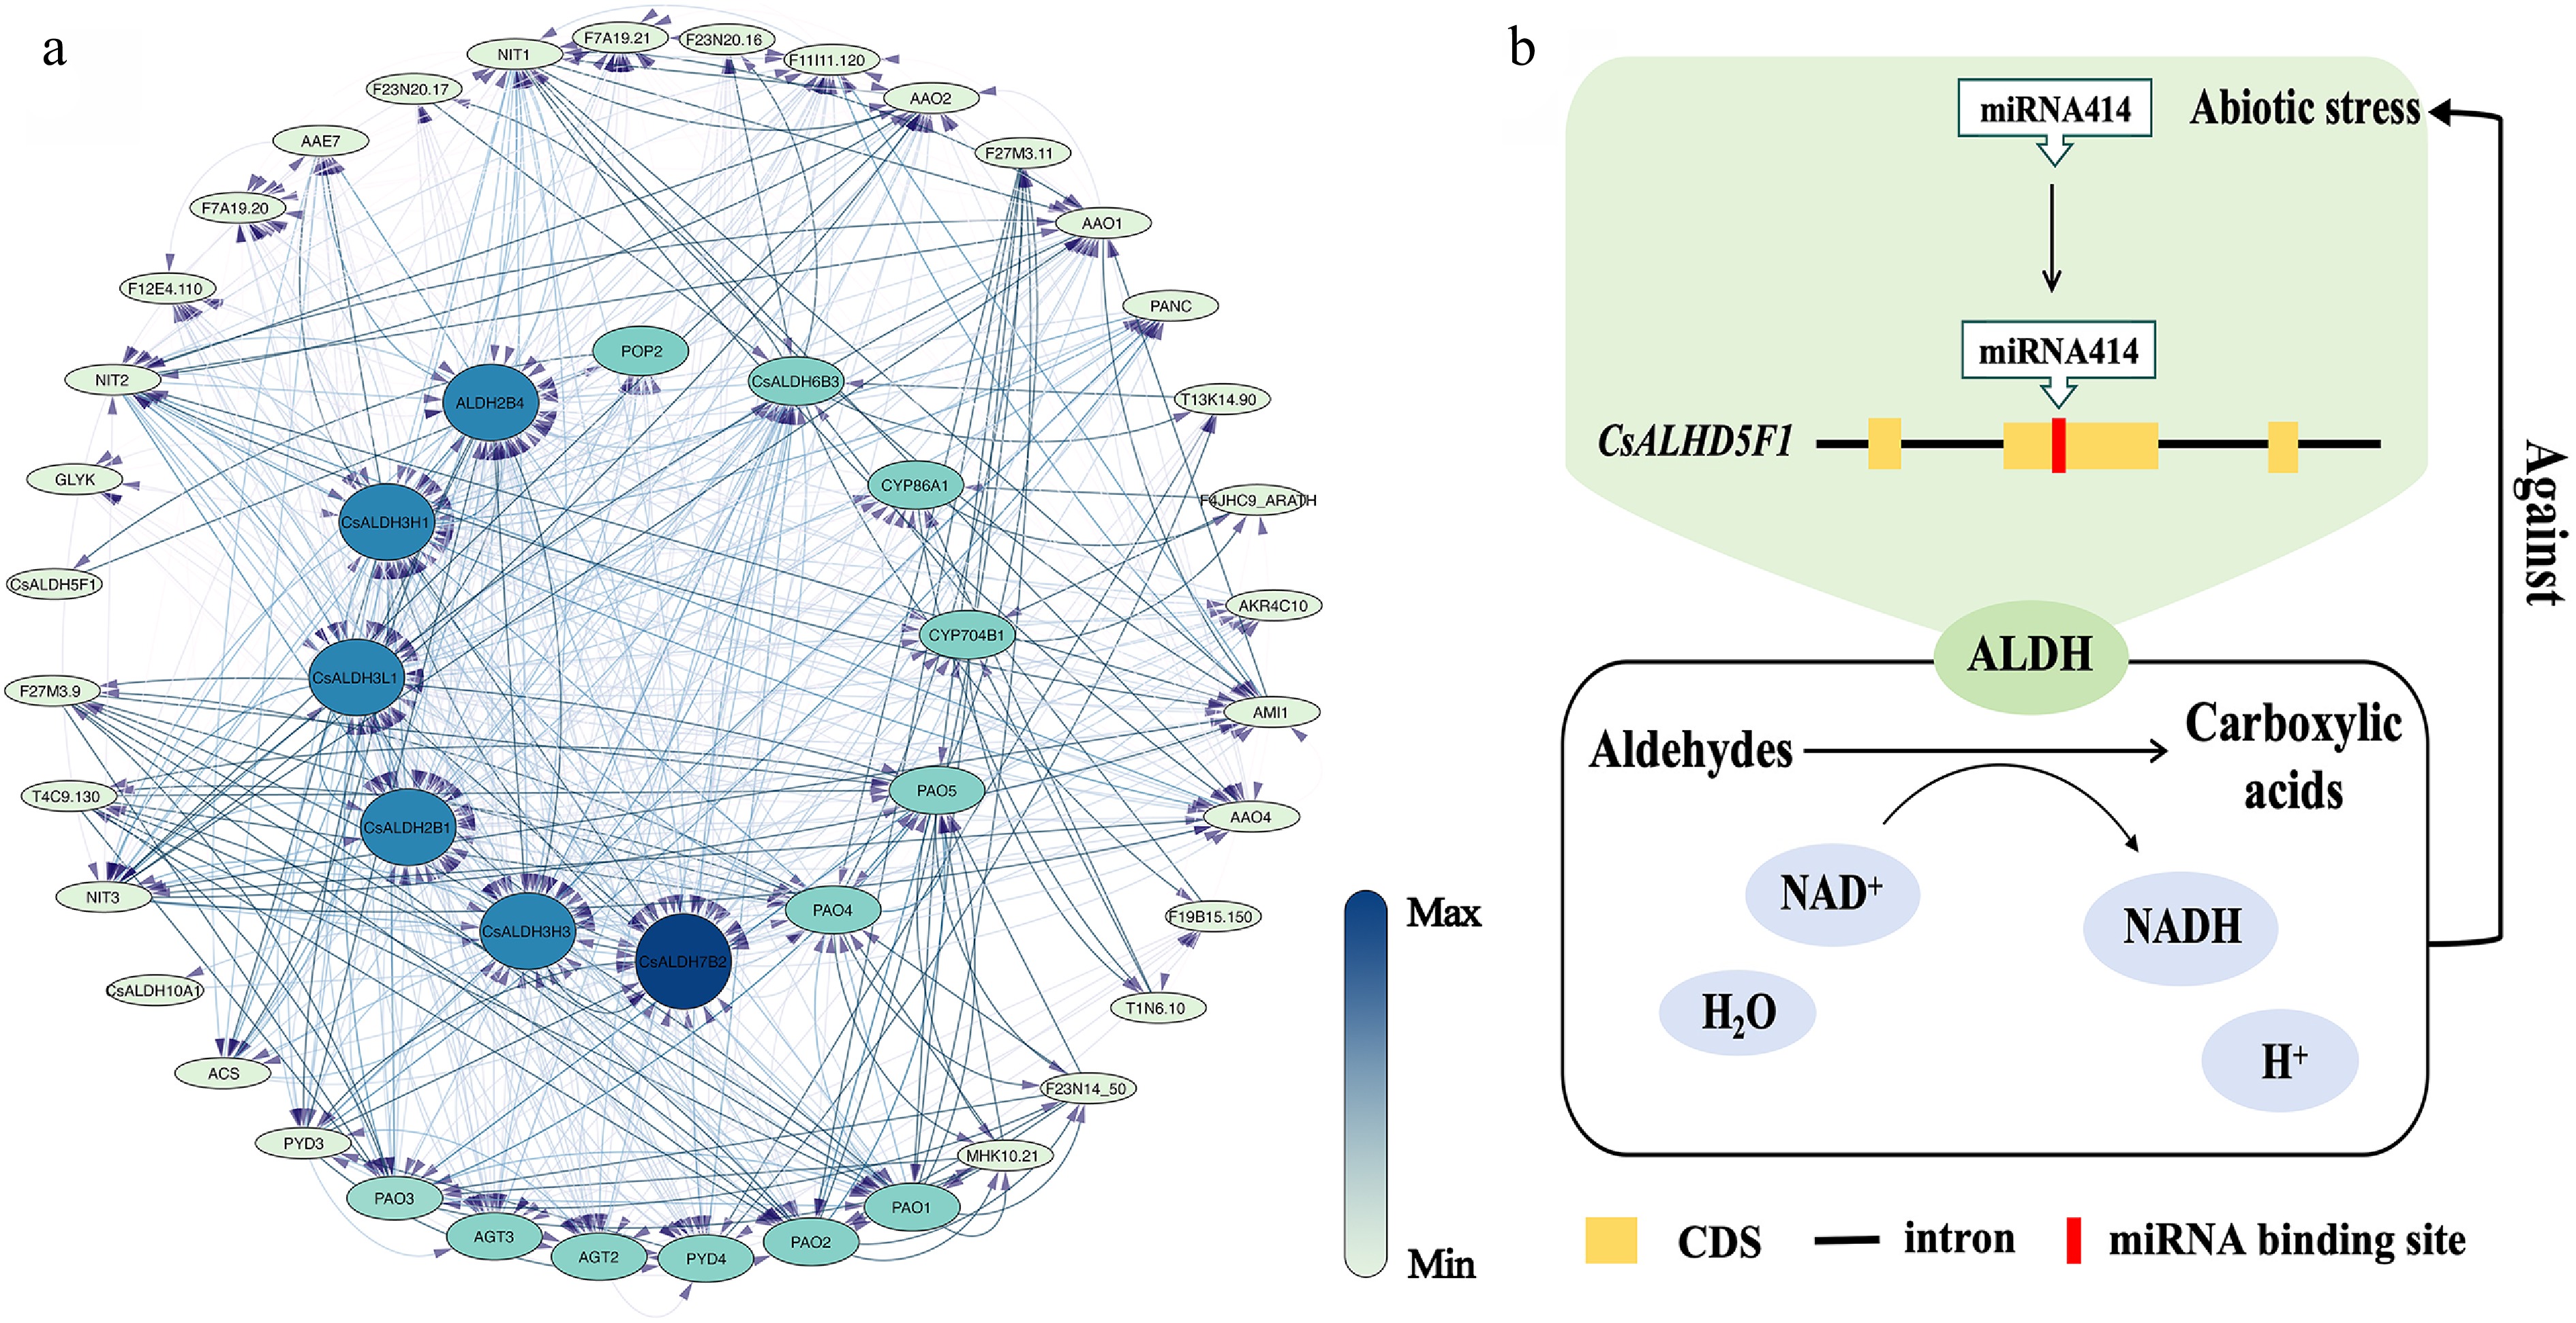
Figure 5.
(a) The PPI network of CsALDH. Each ellipse represents a protein, and lines connect pairs of interacting proteins. The strength of the interactions can be estimated using the color bar on the right. (b) Response pattern diagram of CsALDH5F1 under abiotic stress.
-
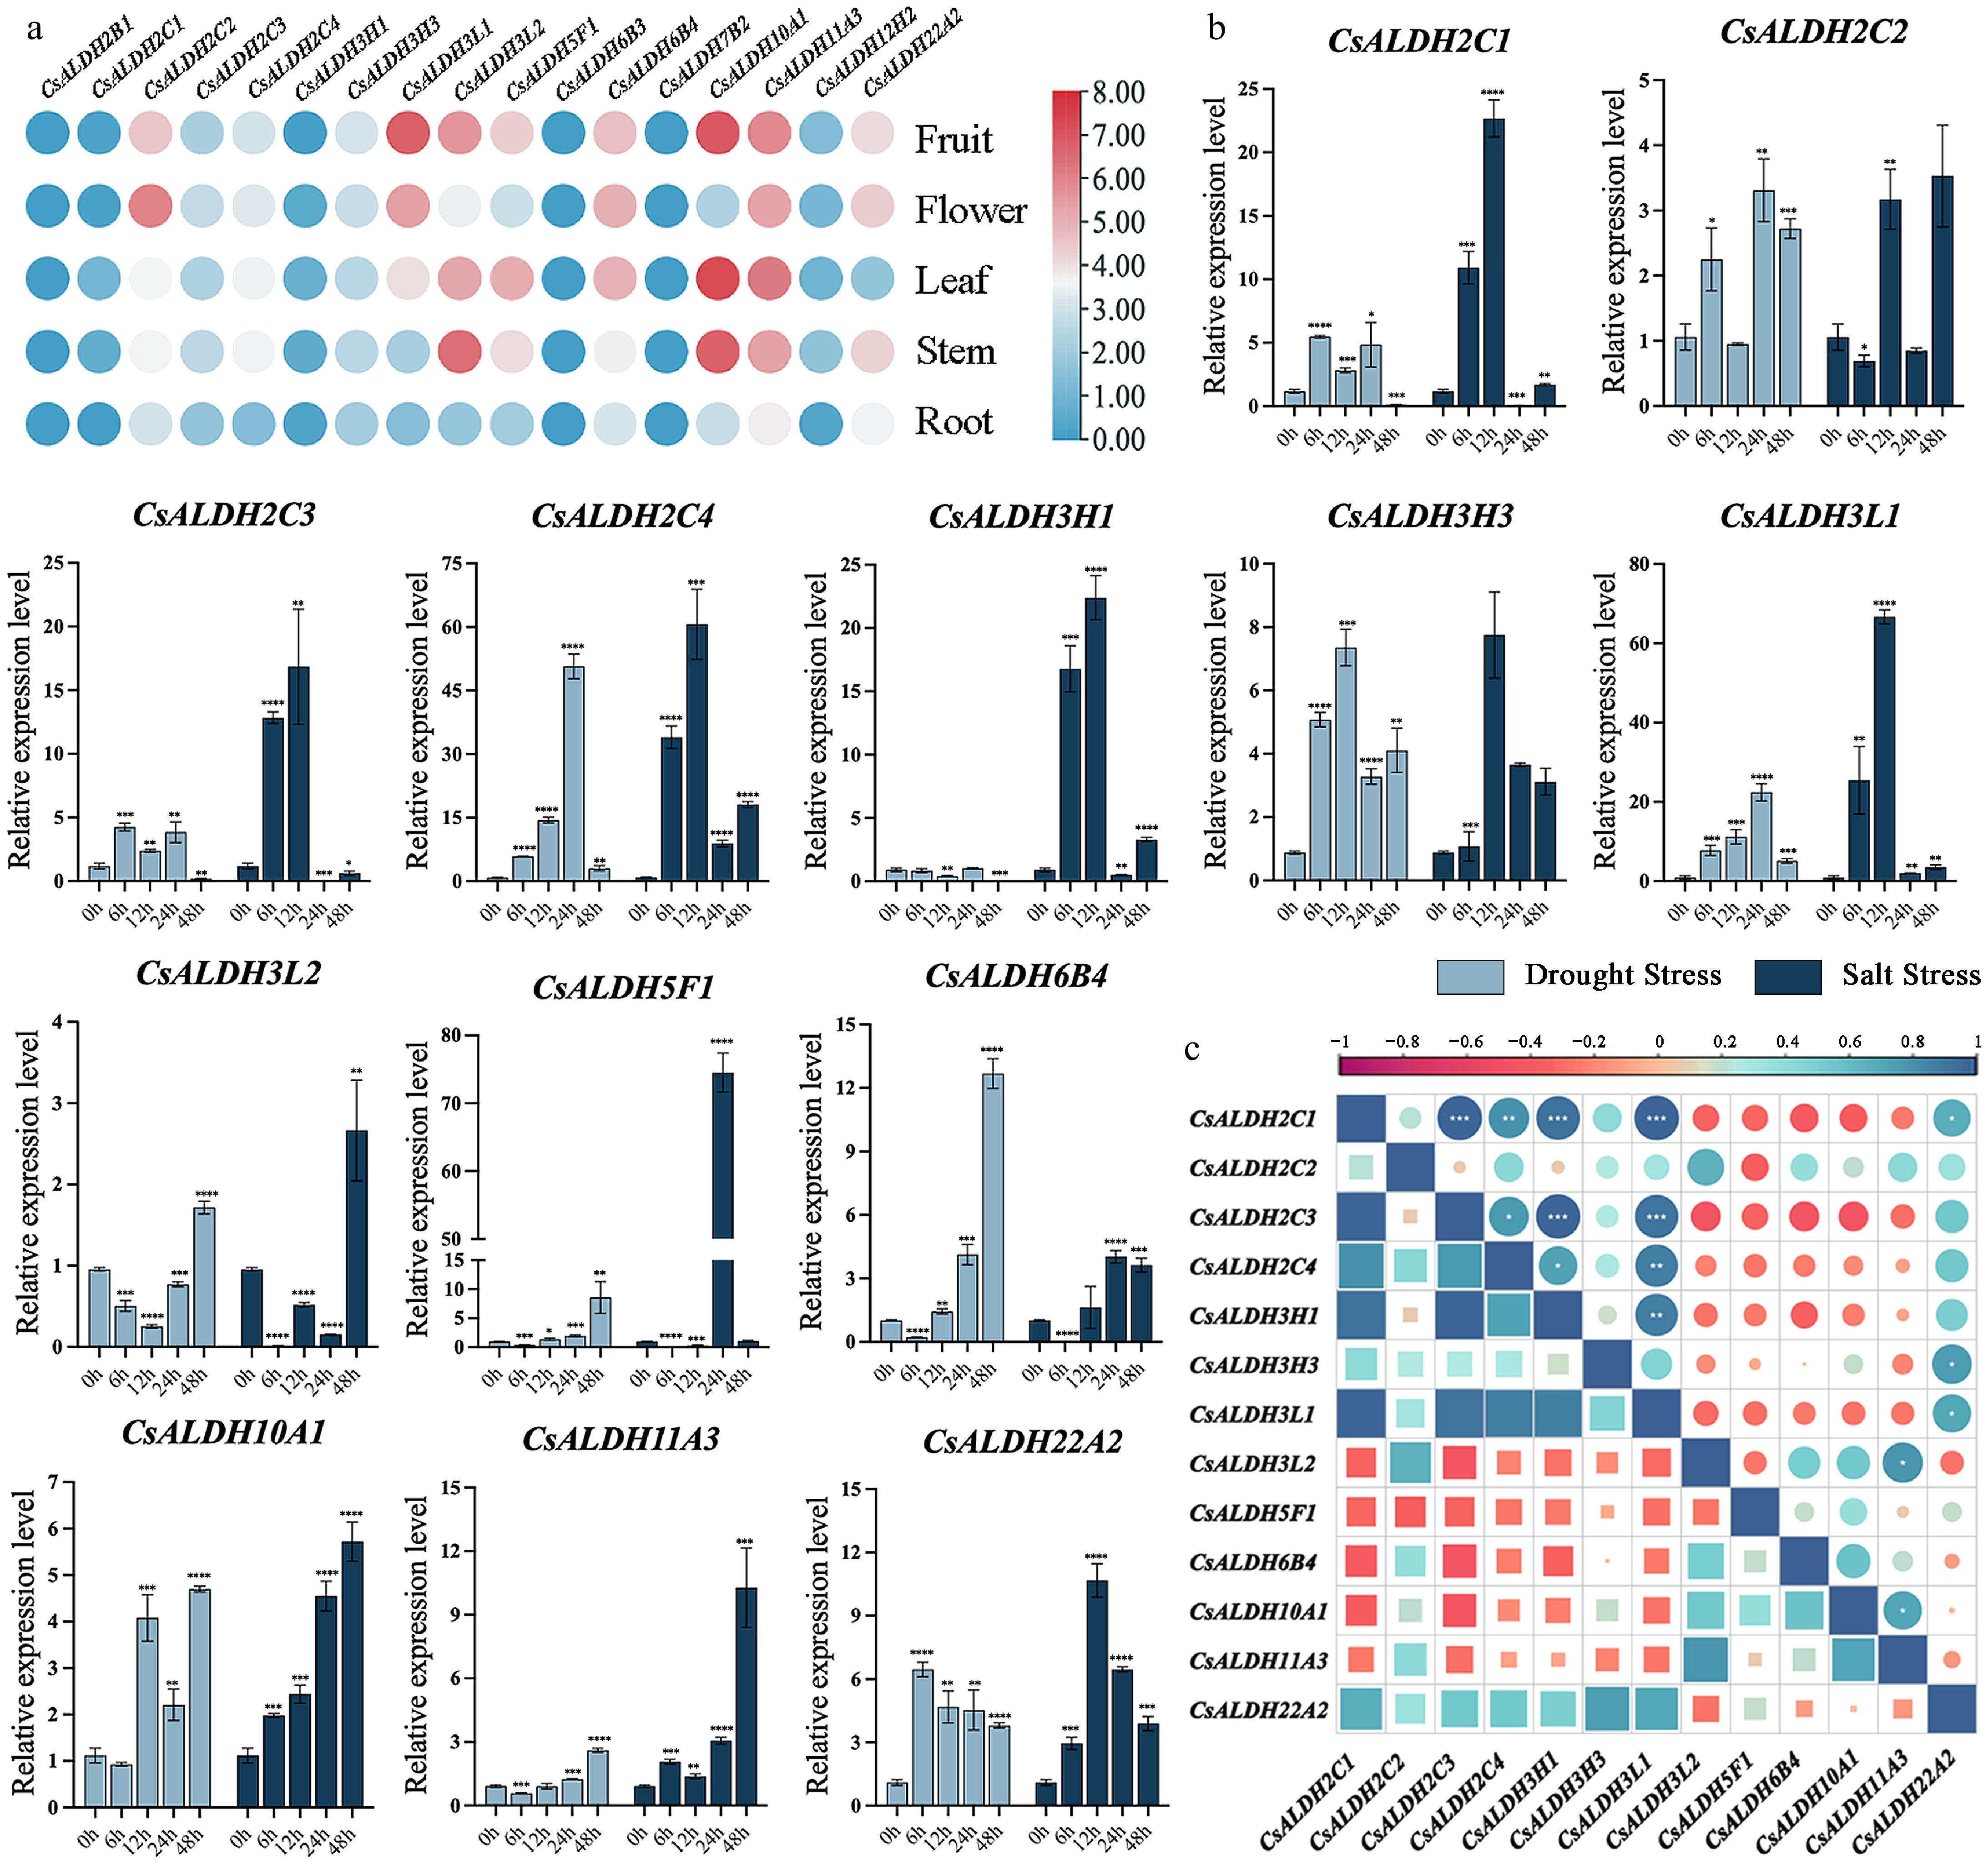
Figure 6.
(a) The heatmap of ALDHs expression in different tissues of C. sinense. (b) Expression patterns of ALDHs in C. sinense leaves at different time points after drought and salt stress. The x-axis represents time points (0 h as the control group, 6, 12, 24, and 48 h as experimental groups). The y-axis indicates the relative expression levels after exposure to stress for different durations. Light blue bars represent drought stress, while dark blue bars represent salt stress. The symbols *, **, ***, and **** denote significant differences at p < 0.05, p < 0.01, p < 0.001, and p < 0.0001, respectively. (c) Correlation analysis of qRT-PCR results. Correlation strengths are indicated by the graduated scale above.
-
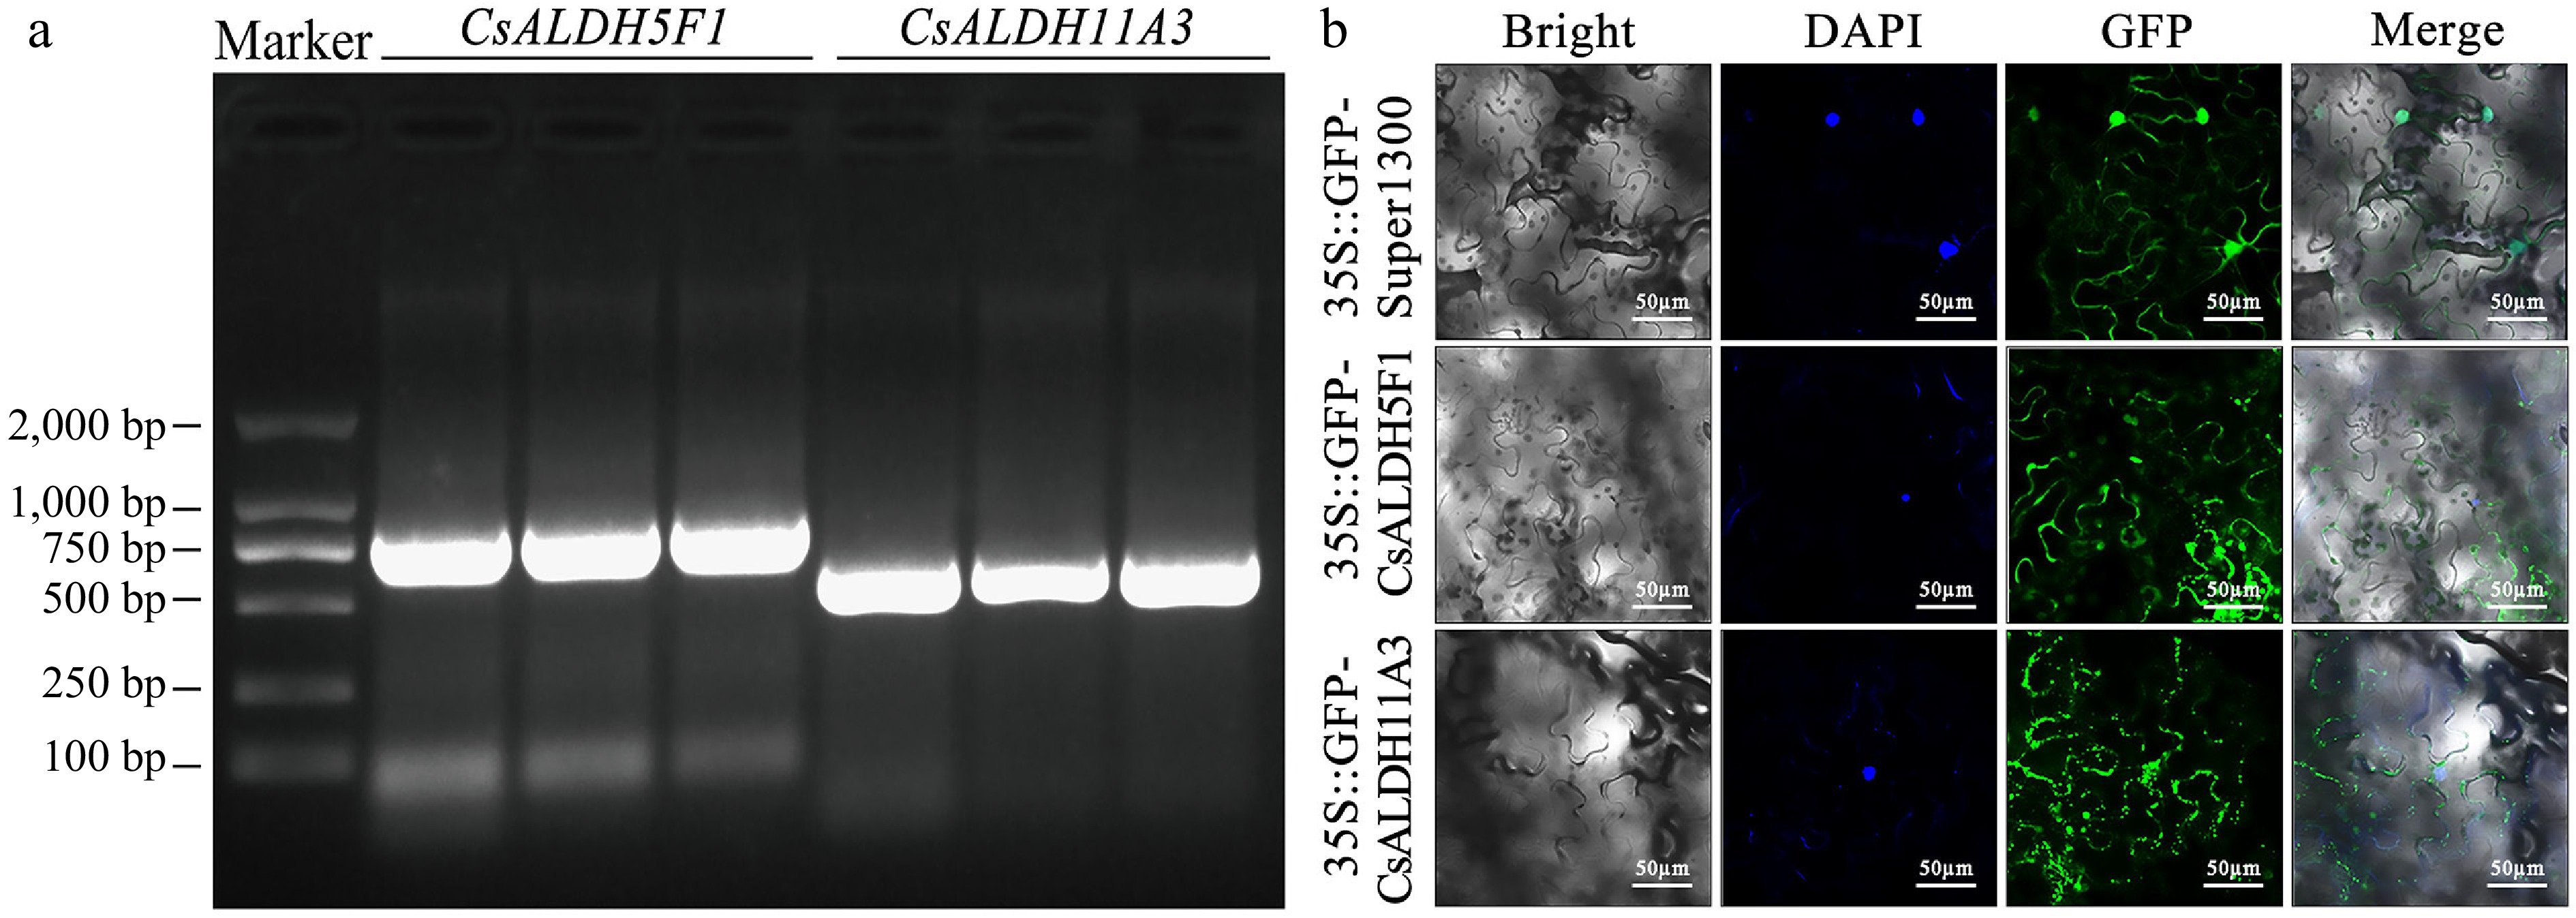
Figure 7.
(a) Agarose gel electrophoresis of PCR-amplified DNA full-length sequences. All samples exhibited a single band at the expected size, confirming the successful amplification of the target genes. (b) Subcellular localization of CsALDH5F1 and CsALDH11A3 in N. benthamiana epidermal cells.
Figures
(7)
Tables
(0)