-
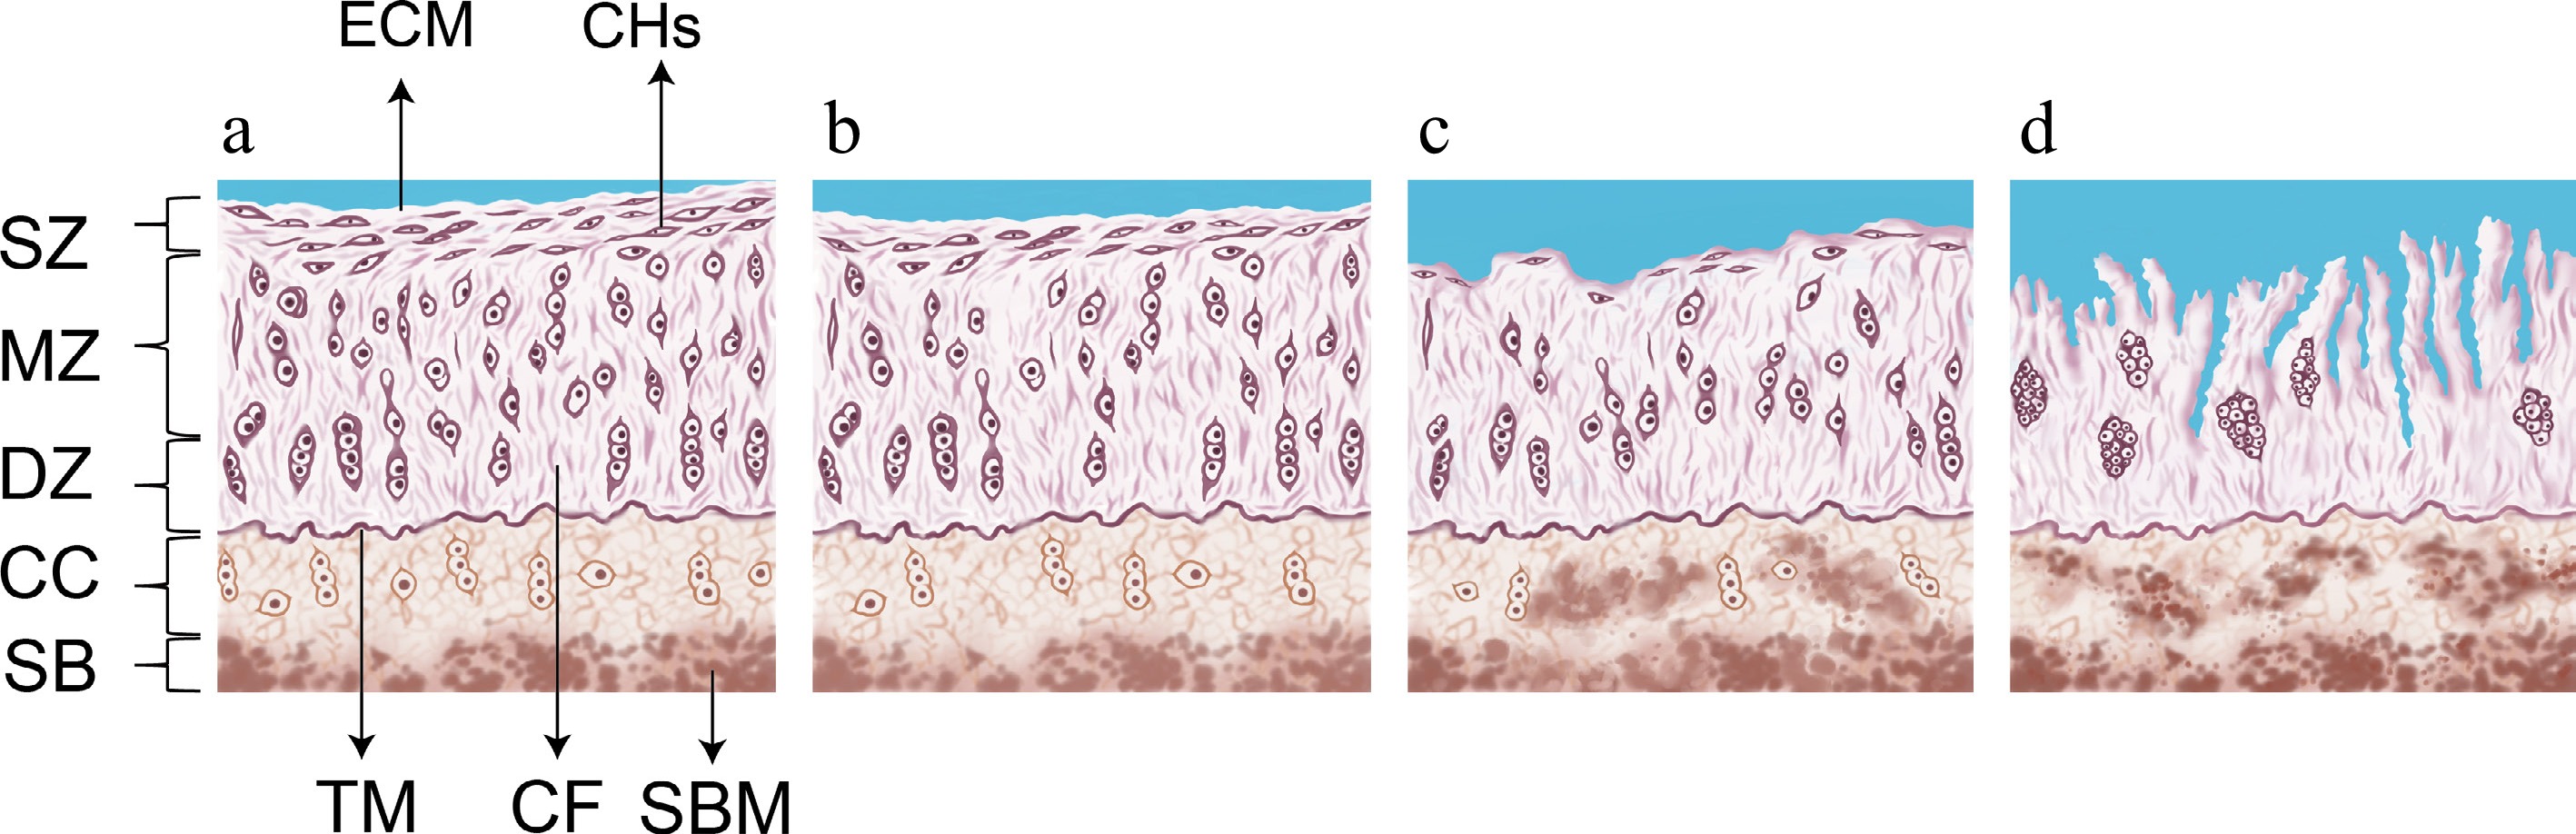
Figure 1.
Schematic diagram of the progression of articular cartilage degeneration. (a) Healthy joint cartilage. (b) Stage 0 to 1 of articular cartilage degeneration. (c) Stage 2 of articular cartilage degeneration. (d) Stage 3 of articular cartilage degeneration. ECM, extracellular matrix; CHs, chondrocytes; TM, tidemark; CF, collagen fibres; SBM, subchondralbone marrow; SZ, superficial zone; MZ, middle zone; DZ, deep zone; CC, calcified cartilage; SB, subchondral bone. Note: This figure was illustrated by Yatong Yang, one of the authors of this review. The histological evaluation criteria depicted were adapted from the concepts described in Vincent & Wann[38], with context-specific modifications introduced in this study.
Figures
(1)
Tables
(0)