-
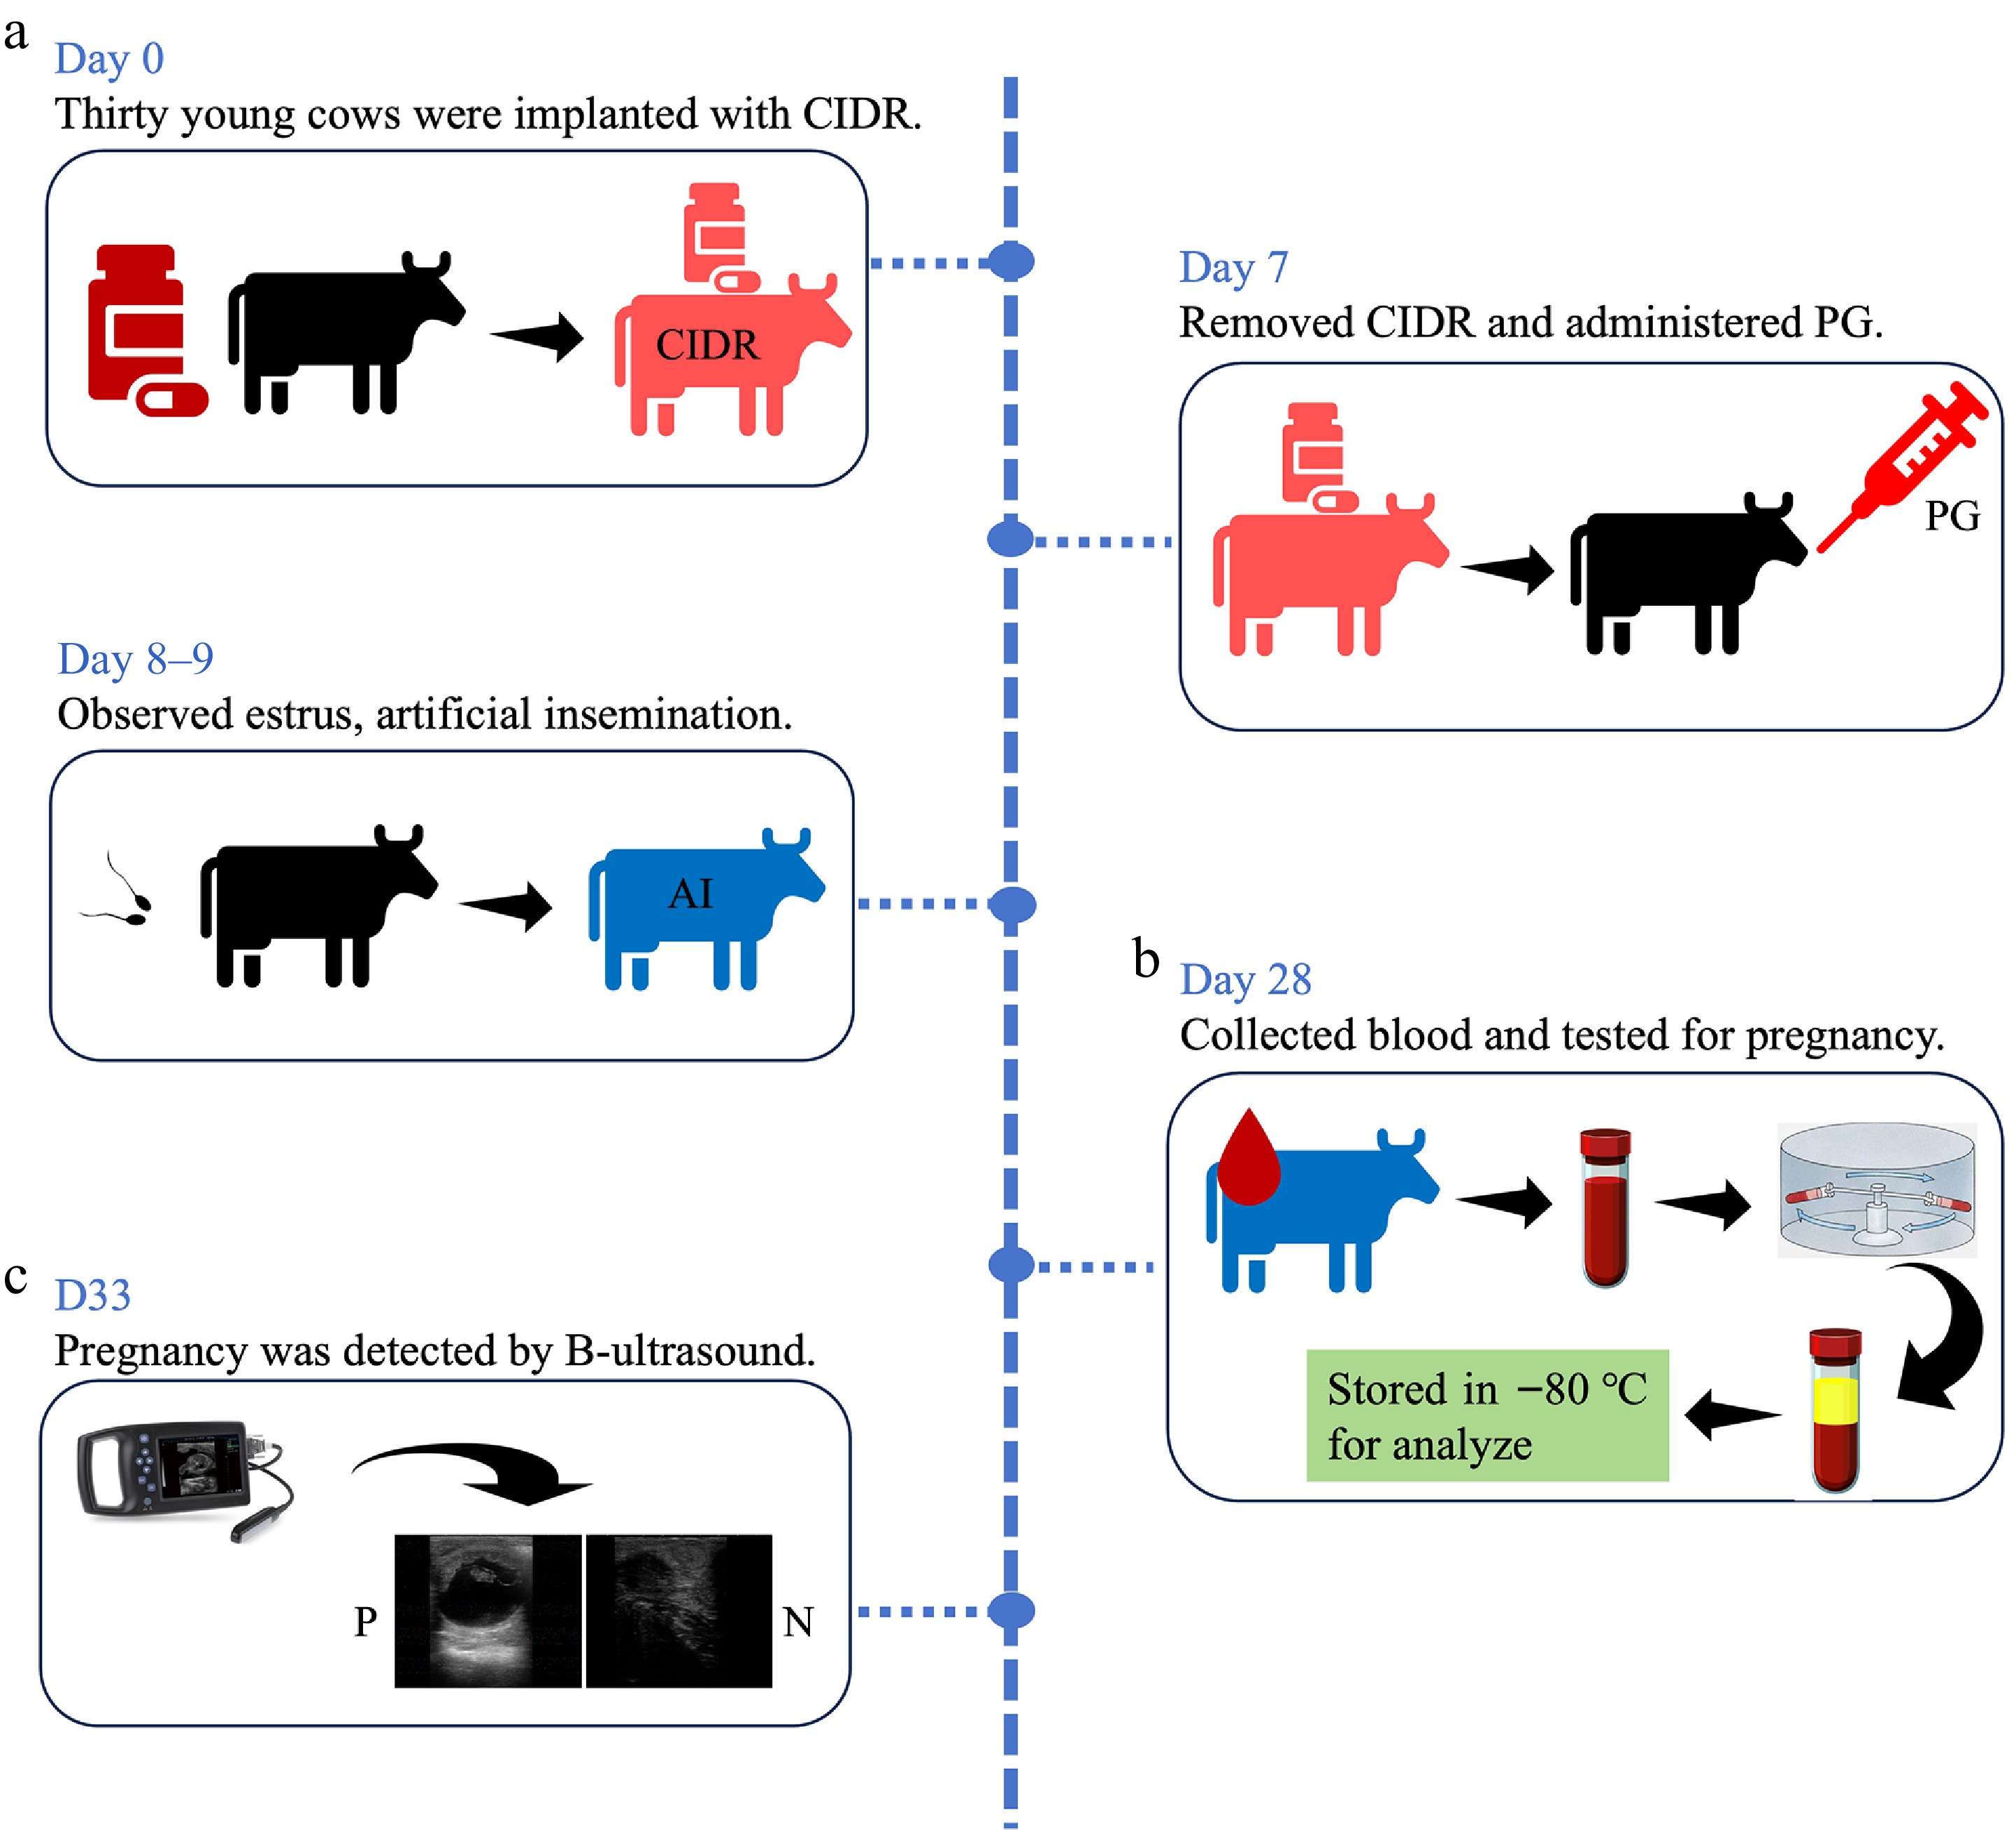
Figure 1.
Experimental design and pregnancy diagnosis. (a) Experimental design for AI and sample collection for each group. (b) Results for pregnancy diagnosis using rapid visual test kits. (c) The results for pregnancy diagnosis using B mode ultrasound.
-
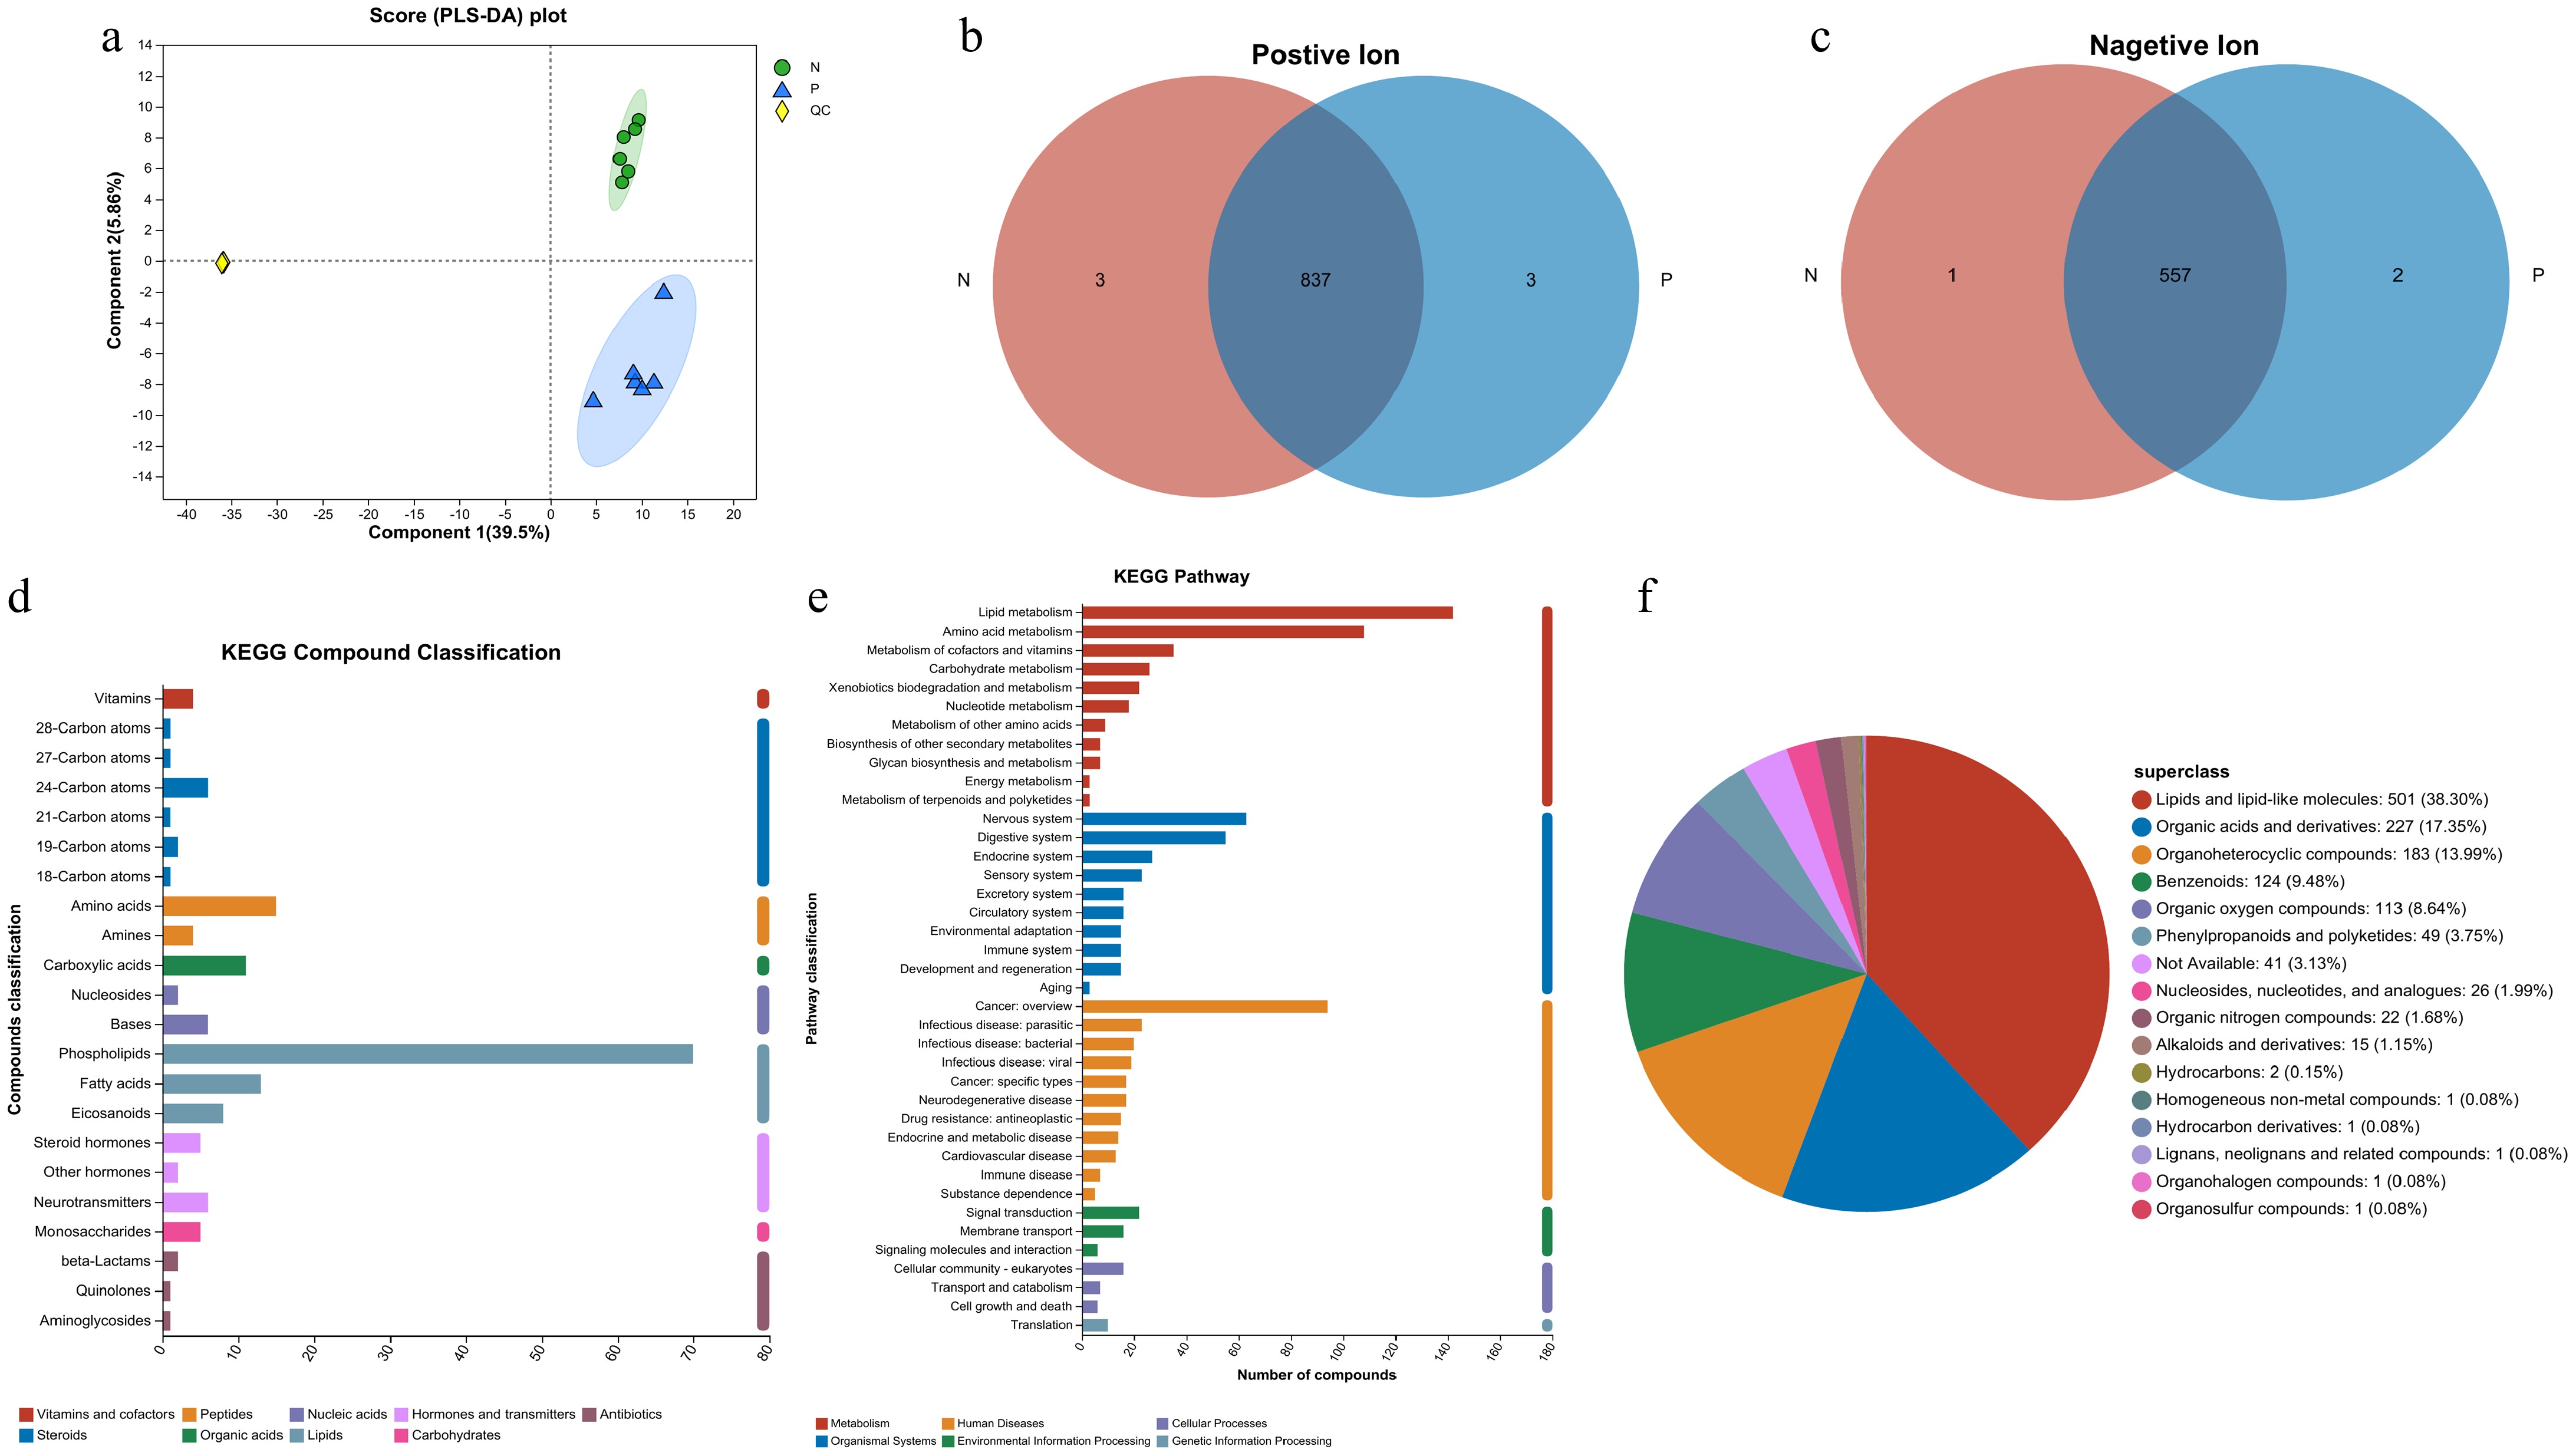
Figure 2.
Analysis of the metabolites detected in the serum samples. (a) PLS-DA analysis score chart. (b), (c) Venn diagrams for sample comparison (P represents the pregnant cows and N represents the non-pregnant cows). (d) Classification of metabolites based on KEGG Compounds analyses. (e) Classification of pathways based on KEGG. (f) Pie chart of compounds classification based on the HMDB database.
-
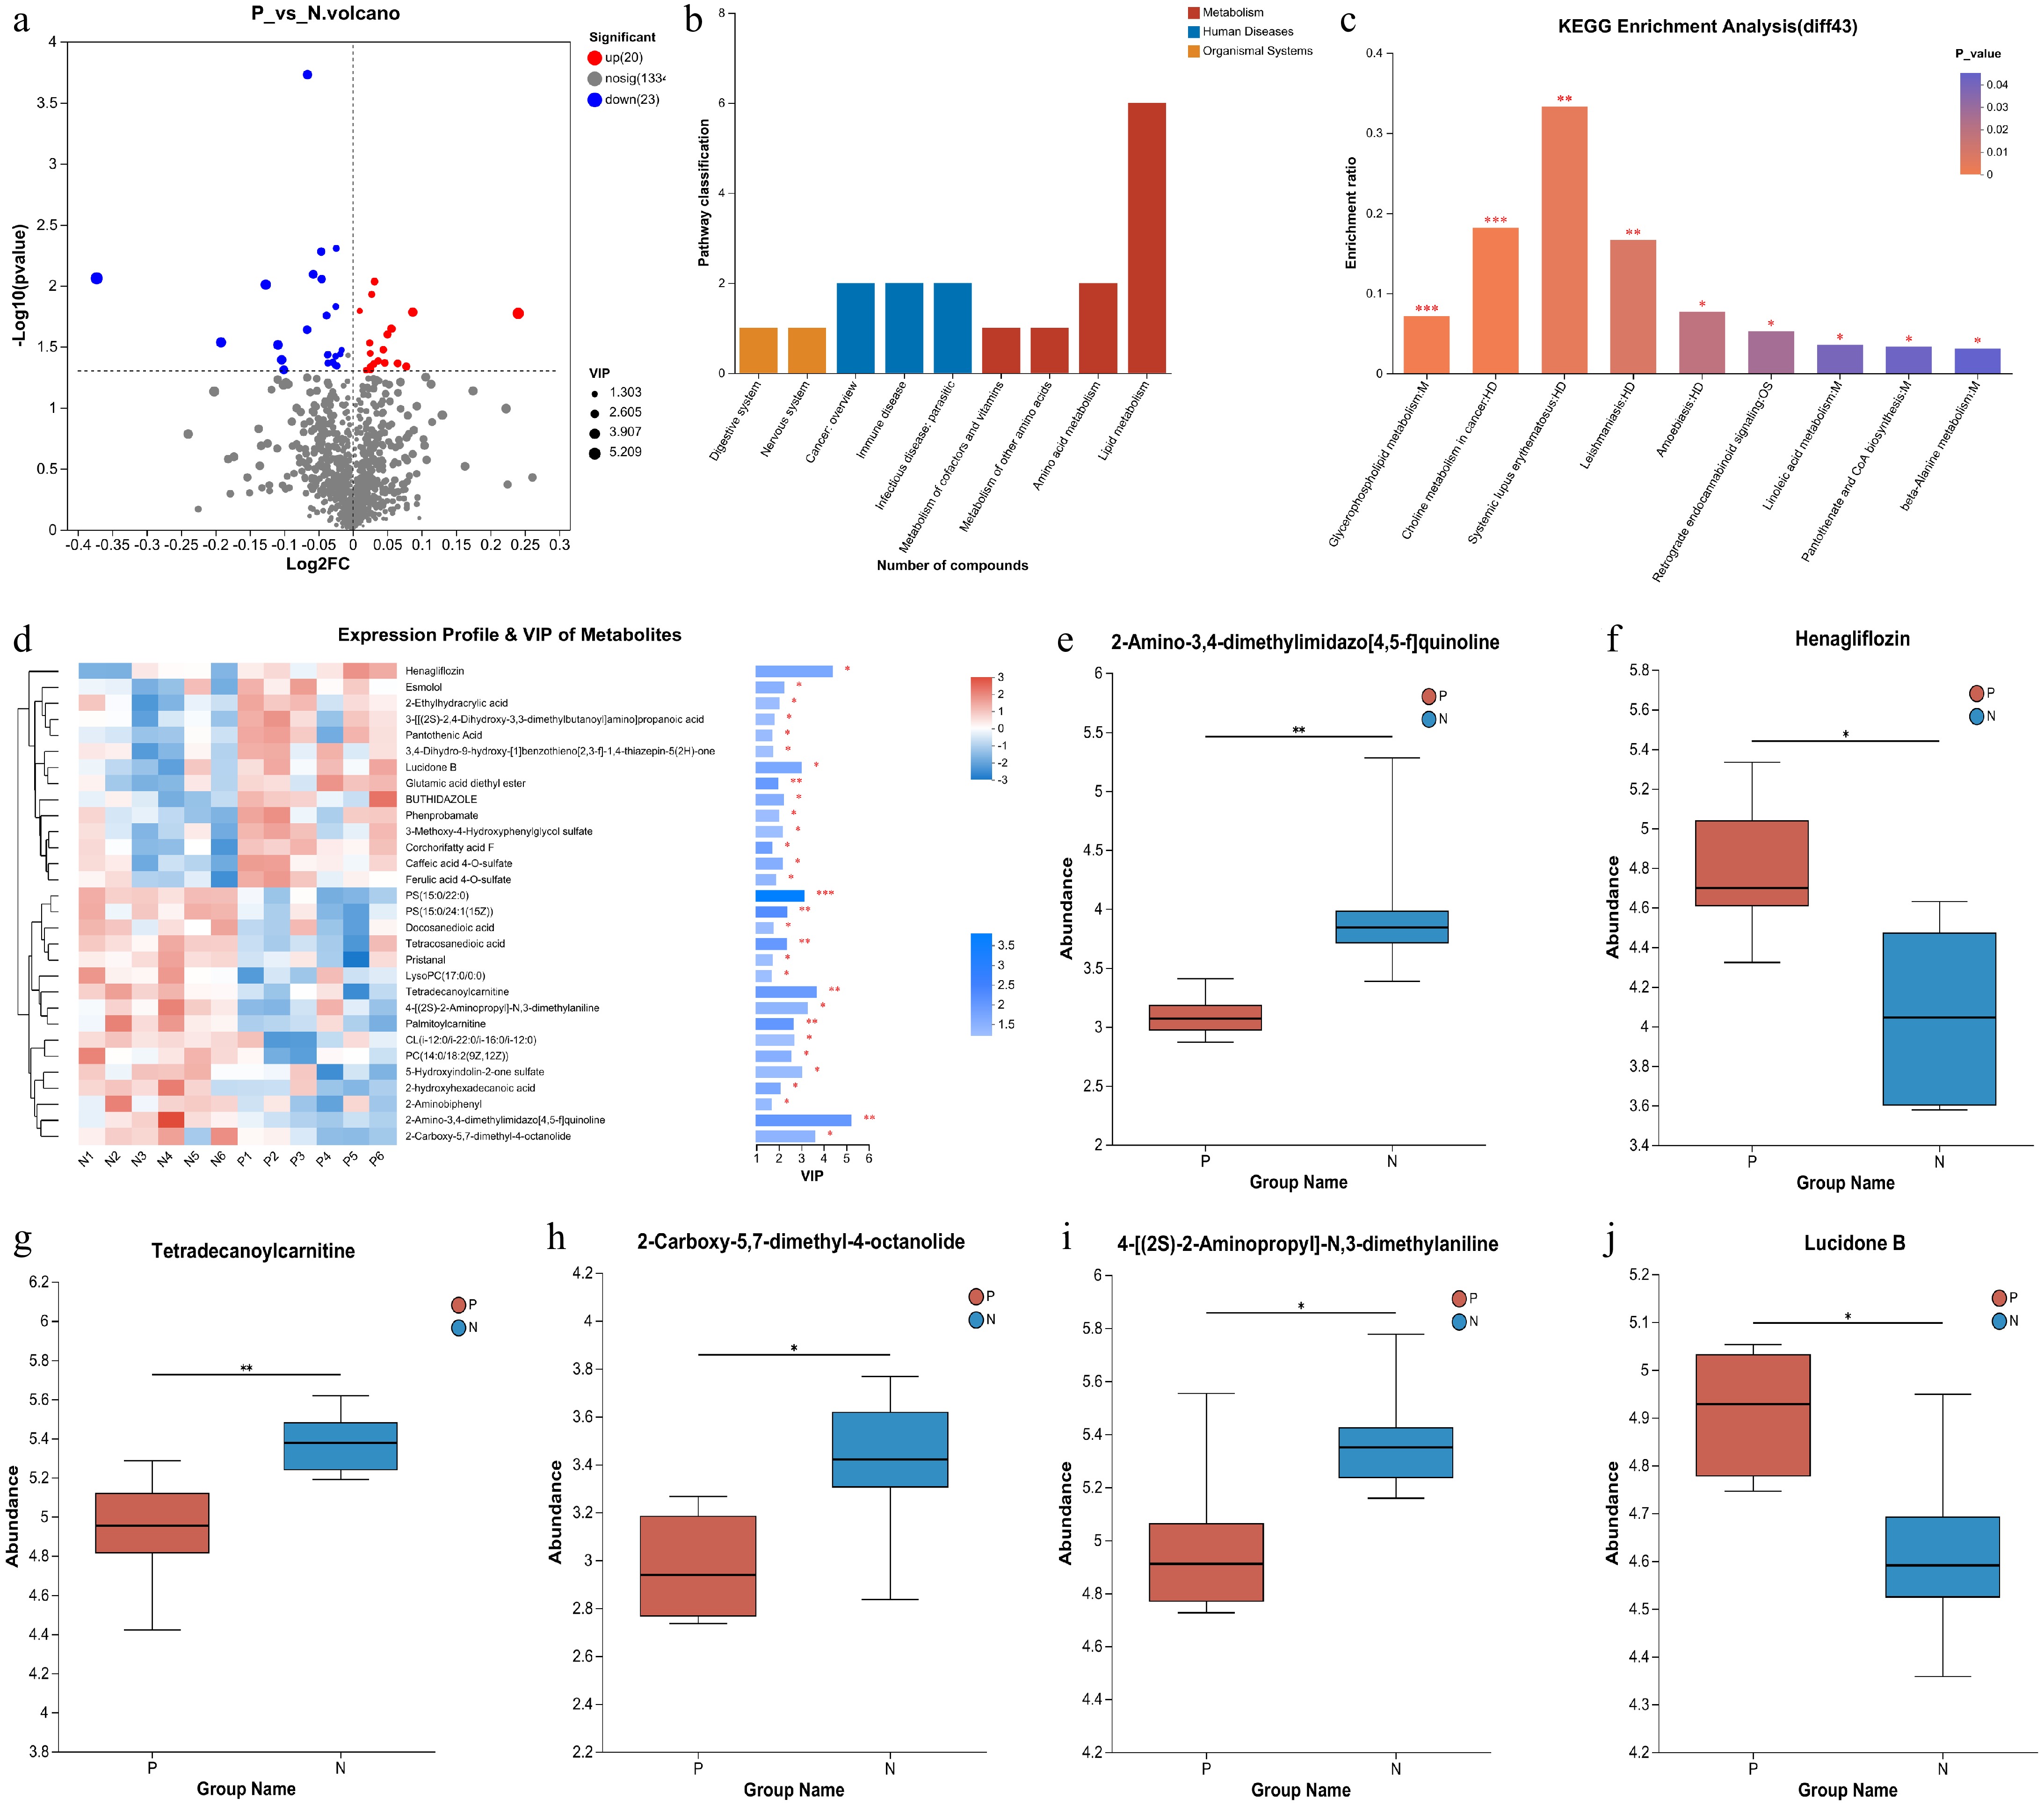
Figure 3.
Analysis of the differential metabolites between pregnant and non-pregnant cows at 28-d post AI. (a) Volcano plot for differential metabolites. The red dots represent the up-regulated metabolites and the blue dots represent the down-regulated metabolites. (b) KEGG classification of the 43 differential metabolites. (c) KEGG pathway enrichment analyses of the 43 differential metabolites. (d) Expression profile of the 43 differential metabolites and their VIP values. (e)−(j) The differential metabolites ranked as the top six based on their VIP values.
-
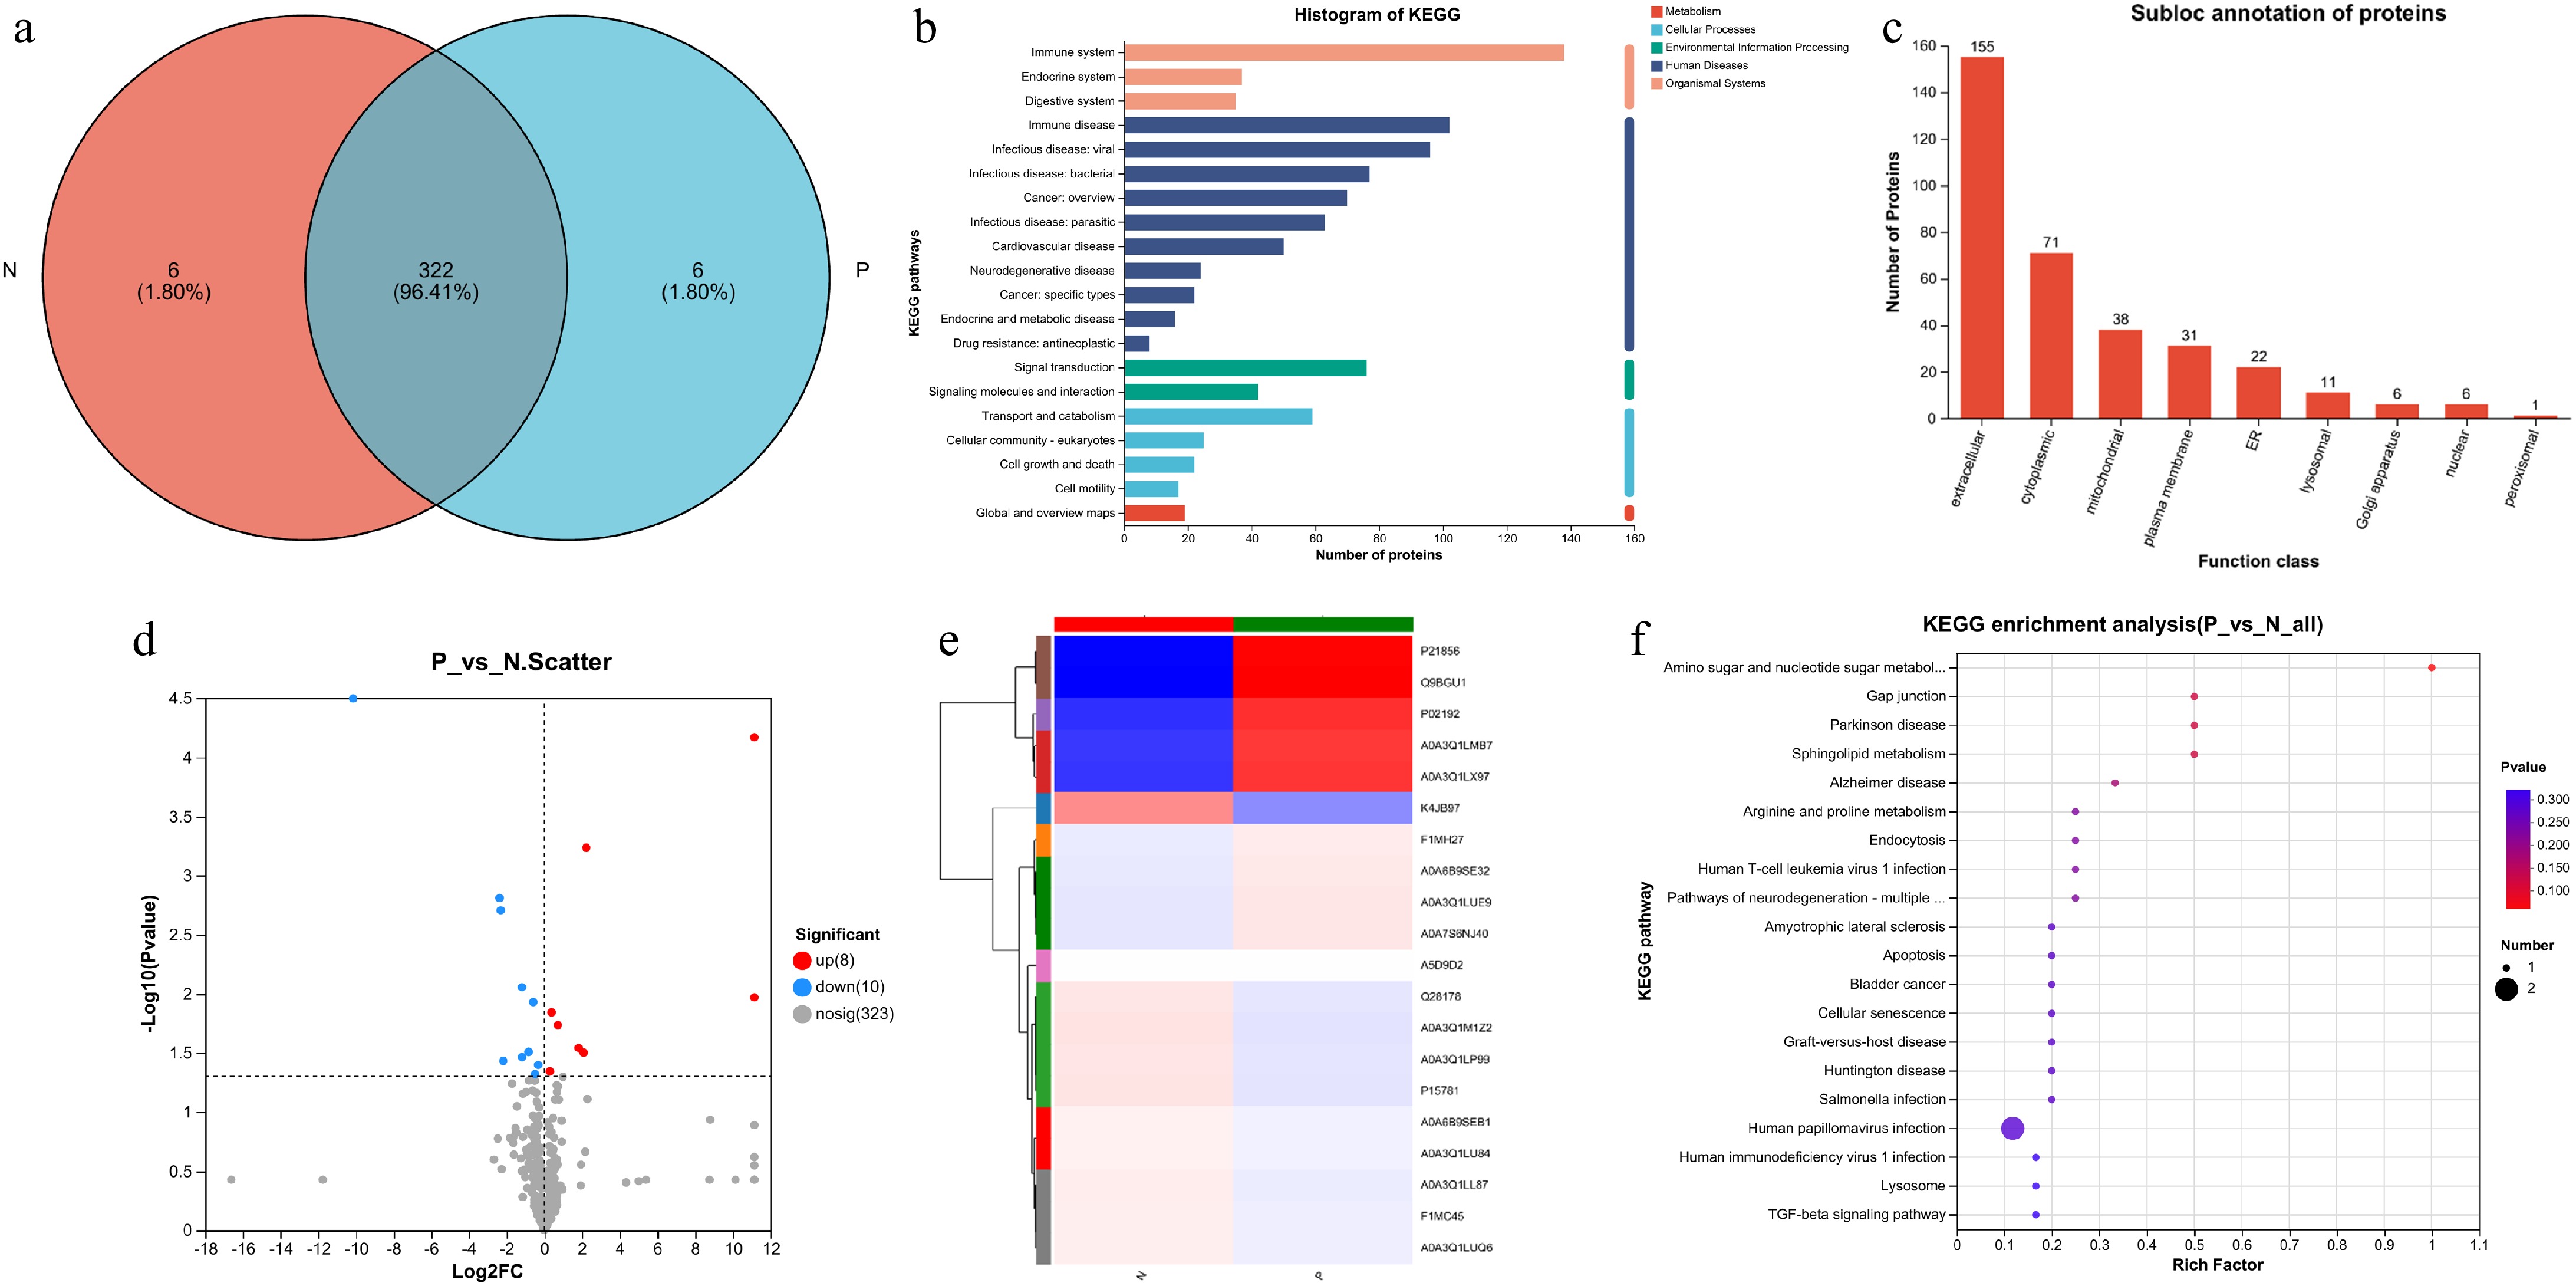
Figure 4.
Proteomic analysis of serum from cows. (a) Venn diagrams for the comparison of samples. (b) Total protein function annotation based on KEGG pathway enrichment analysis. (c) Subcellular localization analysis of the proteins. (d) Volcano plot of proteins detected in cows. The red dots represent the up-regulated proteins and the blue dots represent the down-regulated proteins. (e) Heatmap of all the 18 differential proteins between the two groups. (f) KEGG pathway enrichment analysis for all the 18 differential proteins between the two groups.
-
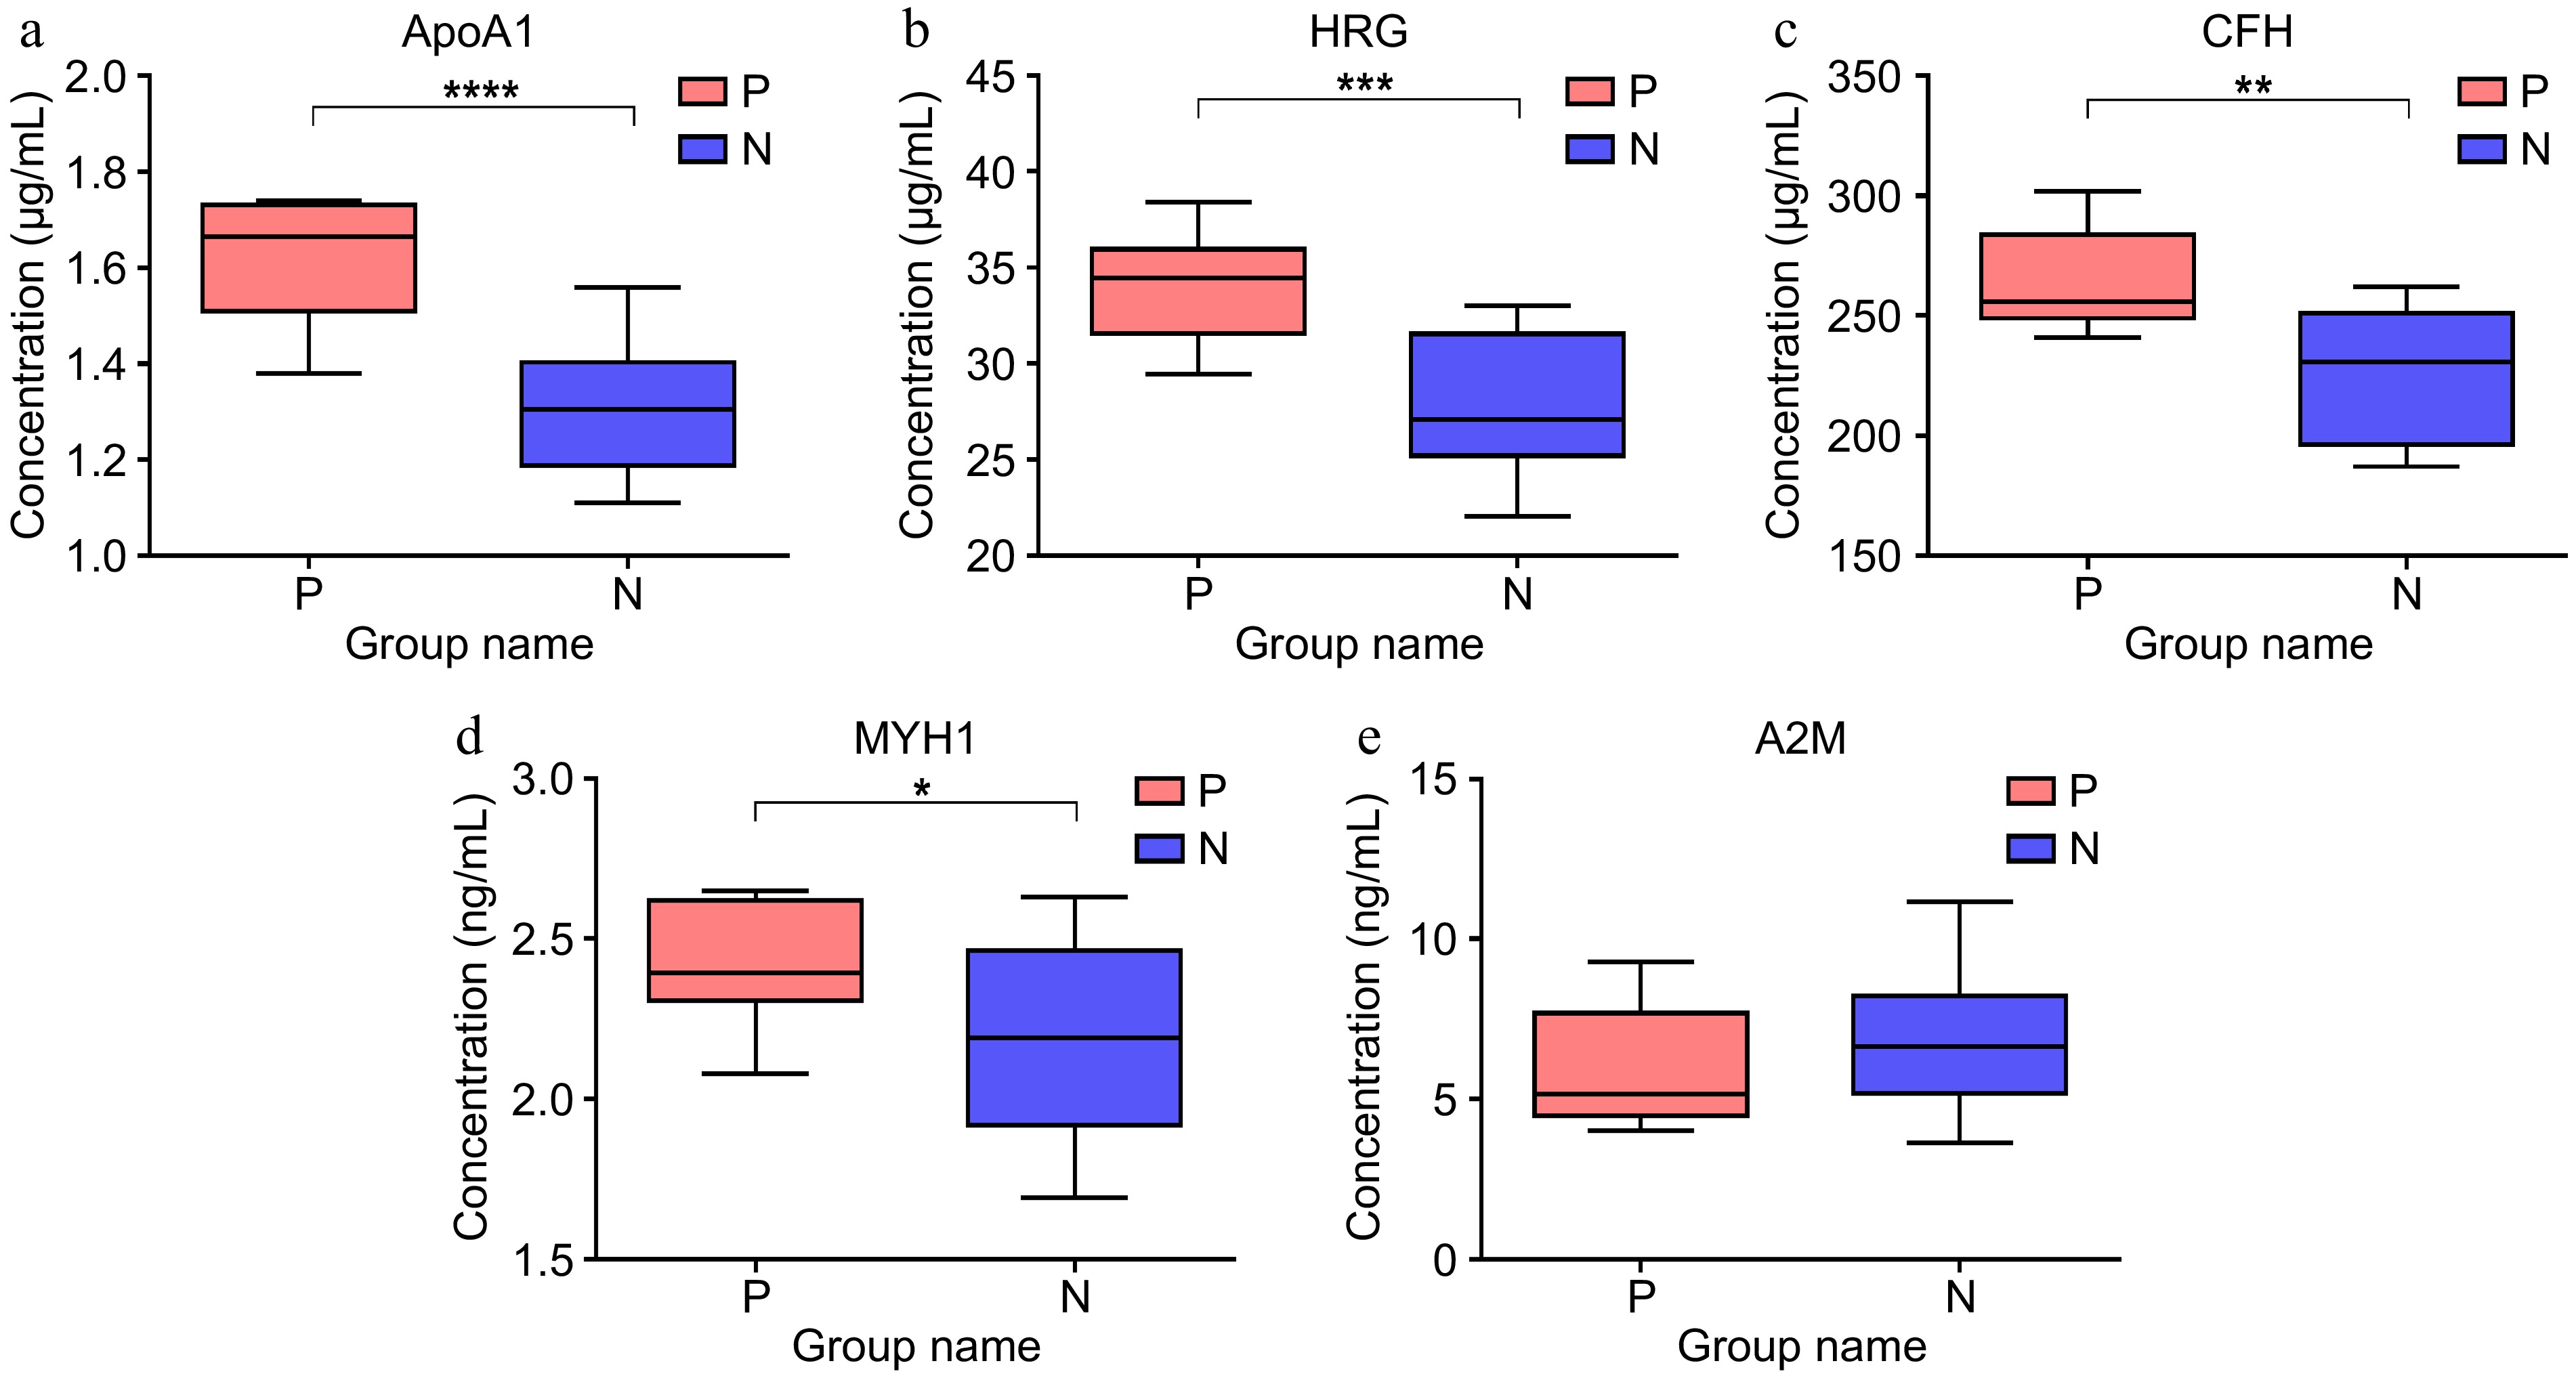
Figure 5.
The level of protein in the serum of pregnant (n = 8), and non-pregnant cows (n = 22) at 28-d post AI examined by ELISA. (a) Level of Apolipoprotein A-Ι (APOA1). (b) Level of Histidine-rich glycoprotein (HRG). (c) Level of Complement factor H (CFH). (d) Level of Myosin heavy chain1 (MYH1). (e) Level of Alpha-2-macroglobulin variant 4 (A2M).
-
Metabolite Regulate p-value FC (P/N) Glutamic acid diethyl ester Up 0.009258 1.0222 2-Amino-3,4-dimethylimidazo[4,5-f]quinoline Down 0.008703 0.7724 Xi-4-Hydroxy-4-methyl-2-cyclohexen-1-one Down 0.01485 0.983 4-Heptenoic acid Down 0.03647 0.9874 CL(i-12:0/i-22:0/i-16:0/i-12:0) Down 0.04905 0.9328 PC(14:0/18:2(9Z,12Z)) Down 0.02298 0.9549 Corchorifatty acid F Up 0.0118 1.0192 12-hydroxyicosanoic acid Down 0.03376 0.9888 Palmitoylcarnitine Down 0.008085 0.9609 4-[(2S)-2-Aminopropyl]-N,3-dimethylaniline Down 0.03061 0.9273 Tetradecanoylcarnitine Down 0.009815 0.916 Harmalol Down 0.03669 0.9754 Butyl 4-aminobenzoate Down 0.03791 0.9828 Cerulenin Up 0.04648 1.0181 4-(1-Hydroxy-2-methoxyethyl)-5-(hydroxymethyl)-2-methylpyridin-3-ol Down 0.04323 0.9752 LysoPC(17:0/0:0) Down 0.04554 0.9841 2-Aminobiphenyl Down 0.03701 0.9748 3-[[(2S)-2,4-Dihydroxy-3,3-dimethylbutanoyl]amino]propanoic acid Up 0.04388 1.0214 Caffeic acid 4-O-sulfate Up 0.02259 1.04 3,4-Dihydro-9-hydroxy-[1]benzothieno[2,3-f]-1,4-thiazepin-5(2H)-one Up 0.04879 1.018 3-Allylphenol sulfate Up 0.02949 1.0172 BUTHIDAZOLE Up 0.02255 1.0395 P-coumaroyltriacetic acid lactone Up 0.01615 1.007 Pristanal Down 0.04499 0.9827 Tetracosanedioic acid Down 0.008841 0.9692 Docosanedioic acid Down 0.04257 0.9799 2-Hydroxymyristic Acid Down 0.004952 0.9834 2-hydroxyhexadecanoic acid Down 0.01758 0.9739 Henagliflozin Up 0.01689 1.1815 PS (15:0/22:0) Down 0.0001862 0.9553 PS (15:0/24:1(15Z)) Down 0.00526 0.9687 Phenprobamate Up 0.04342 1.0463 2-Naphthalenesulfonic acid Up 0.04935 1.0135 Esmolol Up 0.02516 1.0356 2-Carboxy-5,7-dimethyl-4-octanolide Down 0.02919 0.8756 4-Methyl-1,4-dihydropyridine-3,5-dicarbaldehyde Up 0.03592 1.0178 Ferulic acid 4-O-sulfate Up 0.03354 1.0312 3-Methoxy-4-Hydroxyphenylglycol sulfate Up 0.04608 1.0554 Ascorbic acid 2-sulfate Up 0.04618 1.018 Lucidone B Up 0.01651 1.0623 2-Ethylhydracrylic acid Up 0.04302 1.0328 Pantothenic Acid Up 0.04141 1.0259 5-Hydroxyindolin-2-one sulfate Down 0.04056 0.9308 Table 1.
Differential metabolites between pregnant and non-pregnant cows at 28-d post AI.
-
Accession number Description Relative abundance (P) Relative abundance (N) FC (P/N) p value (P/N) P15497 Apolipoprotein A1 174,509.6198 218,067.4792 0.8003 0.04 A0A6B9SEB1 Ig lamda chain variable region 15,494.6764 35,129.2435 0.4411 0.03427 A0A3Q1LUE9 Ig-like domain-containing protein 36,403.3216 7,784.272 4.677 0.000571 K4JB97 Alpha-2-macroglobulin variant 4 20.7204 23,522.3625 0.000881 2.20E-05 P19035 Apolipoprotein C-III 3,963.2901 5,955.4715 0.6655 0.01173 A0A3Q1LS74 Complement factor H 4,146.1947 3,191.1589 1.299 0.01435 A0A3Q1LU84 Ig-like domain-containing protein 368.7632 838.5748 0.4397 0.008791 F1MH27 chitinase 452.6277 128.7039 3.517 0.02871 A0A6B9SE32 Ig lamda chain variable region 271.1981 64.0567 4.234 0.03137 Q28178 Thrombospondin-1 50.6508 229.5105 0.2207 0.03698 P20959 Insulin-like growth factor-binding protein 3 86.1332 121.951 0.7063 0.04771 Q3SYR5 Apolipoprotein C-IV 54.5581 97.5879 0.5591 0.03094 A0A3Q1LP99 Proteolipid protein 1 12.841 63.9644 0.2008 0.001958 Q3T0A3 Complement factor D 29.4928 24.0432 1.227 0.04539 P15467 Ribonuclease 4 31.1259 18.9549 1.642 0.01838 P15781 Pulmonary surfactant-associated protein B 3.0214 15.637 0.1932 0.001538 Q9BGU1 Histidine-rich glycoprotein 606.8527 0 2260 0.000058 A0A3Q1LMB7 Myosin Heavy Chain 1 19.9331 0 2260 0.01072 Table 2.
Differential proteins between pregnant and non-pregnant cows at 28-d post AI.
Figures
(5)
Tables
(2)