-
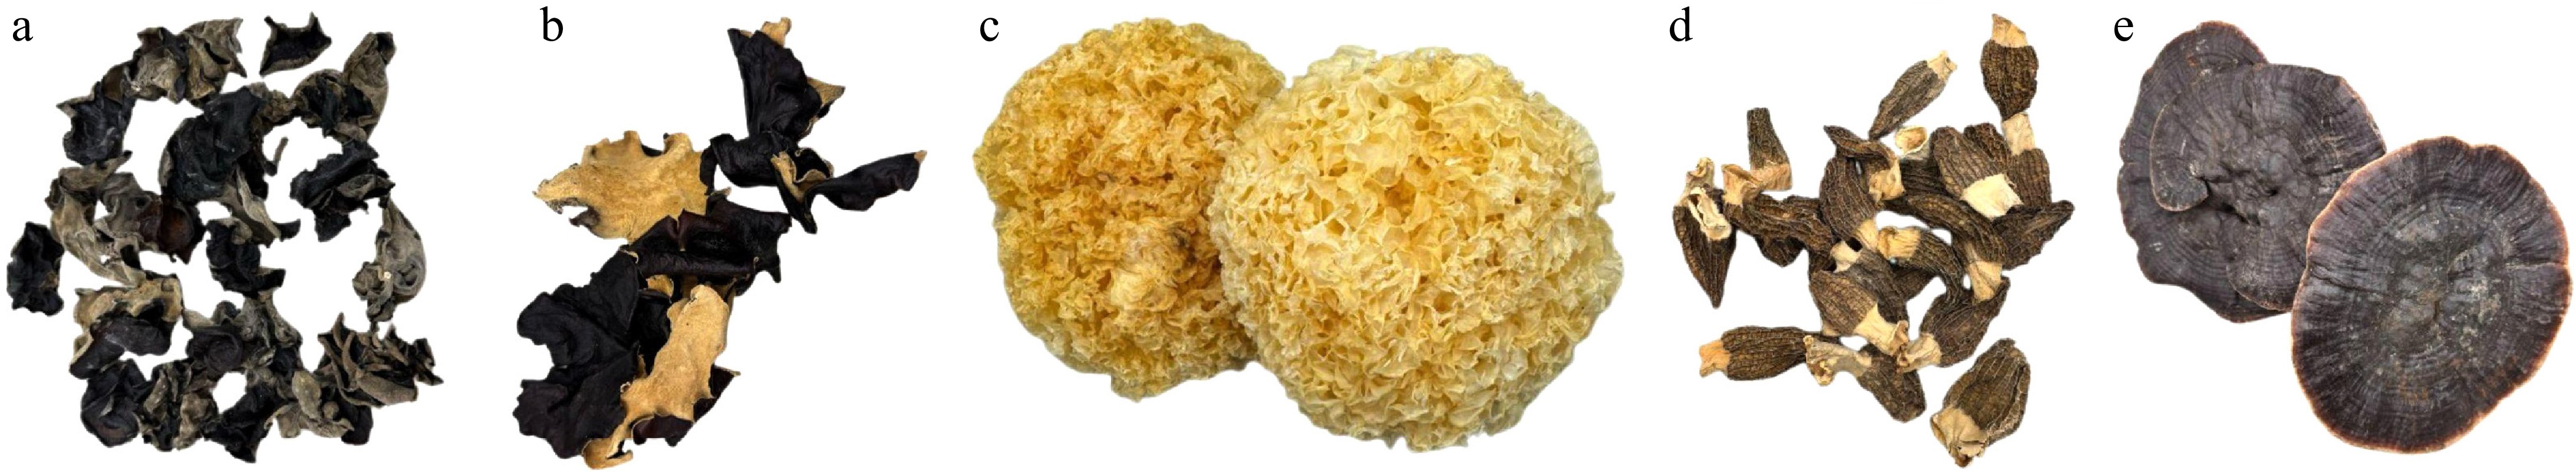
Figure 1.
Photograph of five selected commercially available edible mushrooms (dried) in the Philippines. (a) Auricularia auricula-judae (Bull.) J.Schröt. (wood ear). (b) Auricularia cornea Ehrenb. (cloud ear). (c) Tremella fuciformis Berk. (snow fungus). (d) Morchella esculenta Fr. (yellow morel). (e) Ganoderma sichuanense J.D. Zhao & X.Q. Zhang (reishi or lingzhi).
-
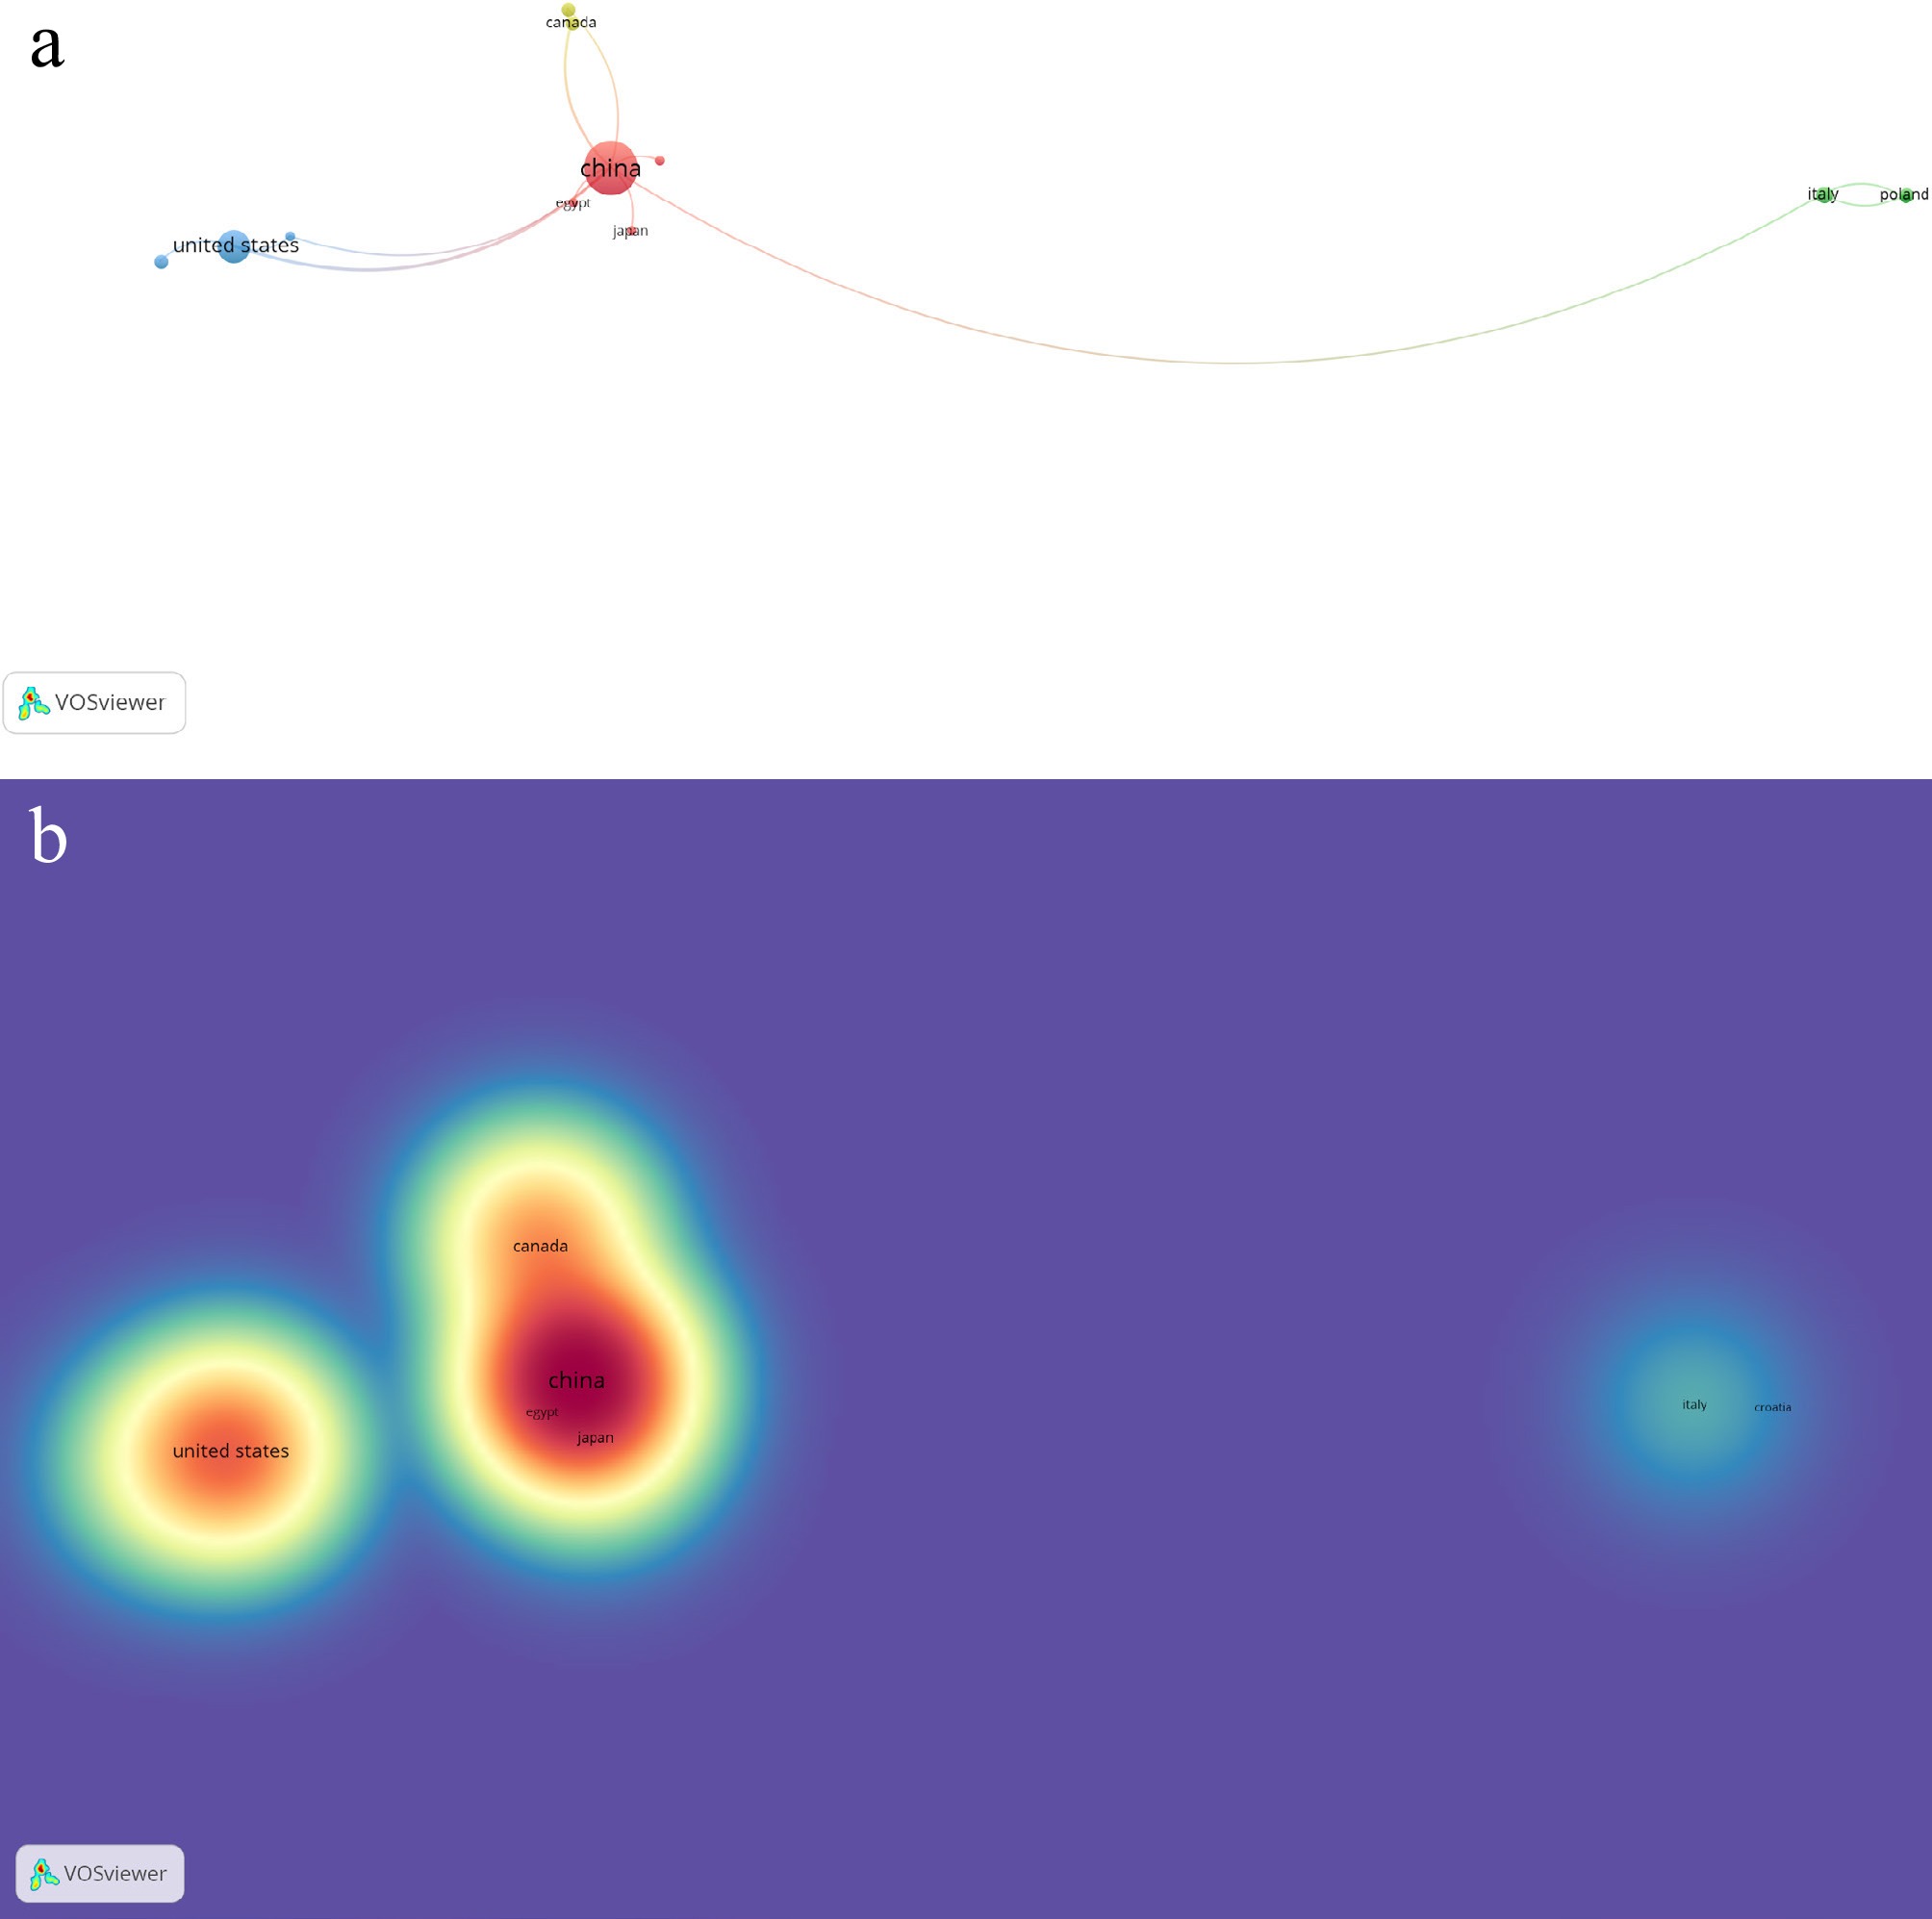
Figure 2.
(a) Network visualization of co-authorship with reference to associated countries on published works of Auricularia auricula-judae (Bull.) J.Schröt. (b) Density visualization of co-authorship with reference to citations on published works of Auricularia auricula-judae (Bull.) J.Schröt.
-
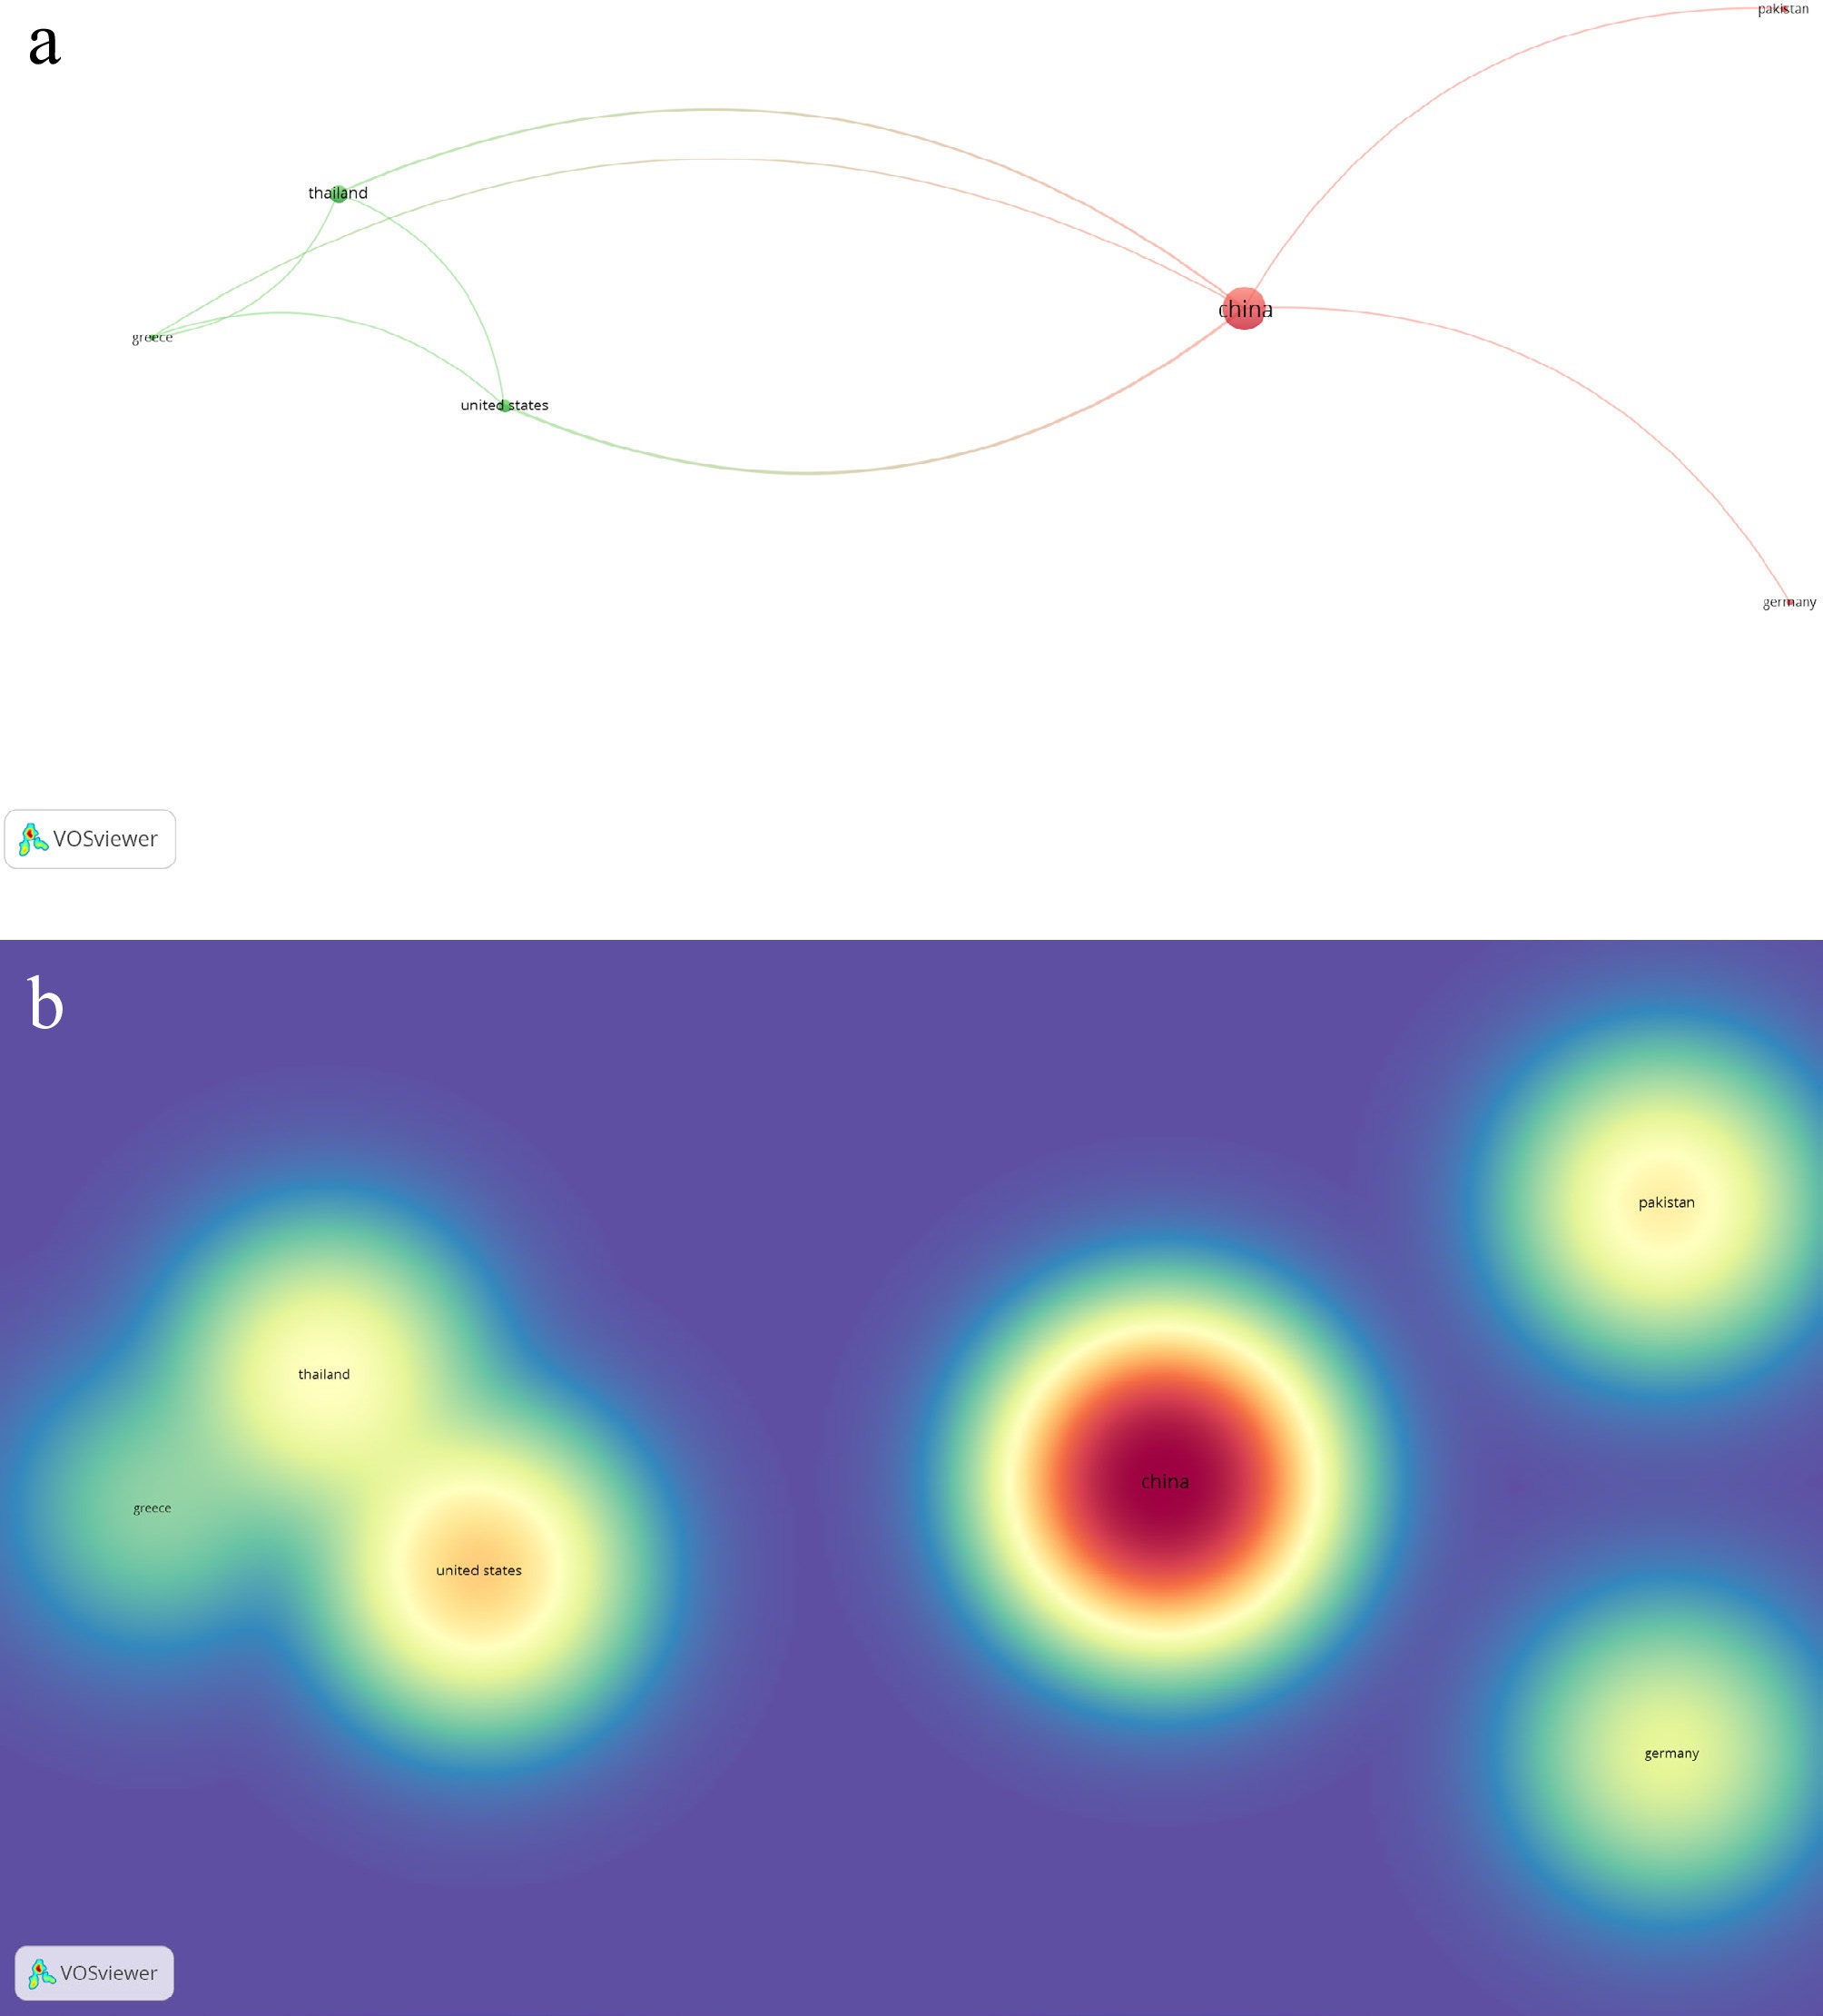
Figure 3.
(a) Network visualization of co-authorship with reference to associated countries on published works of Auricularia cornea Ehrenb. (b) Density visualization of co-authorship regarding citations of published works on Auricularia cornea Ehrenb.
-
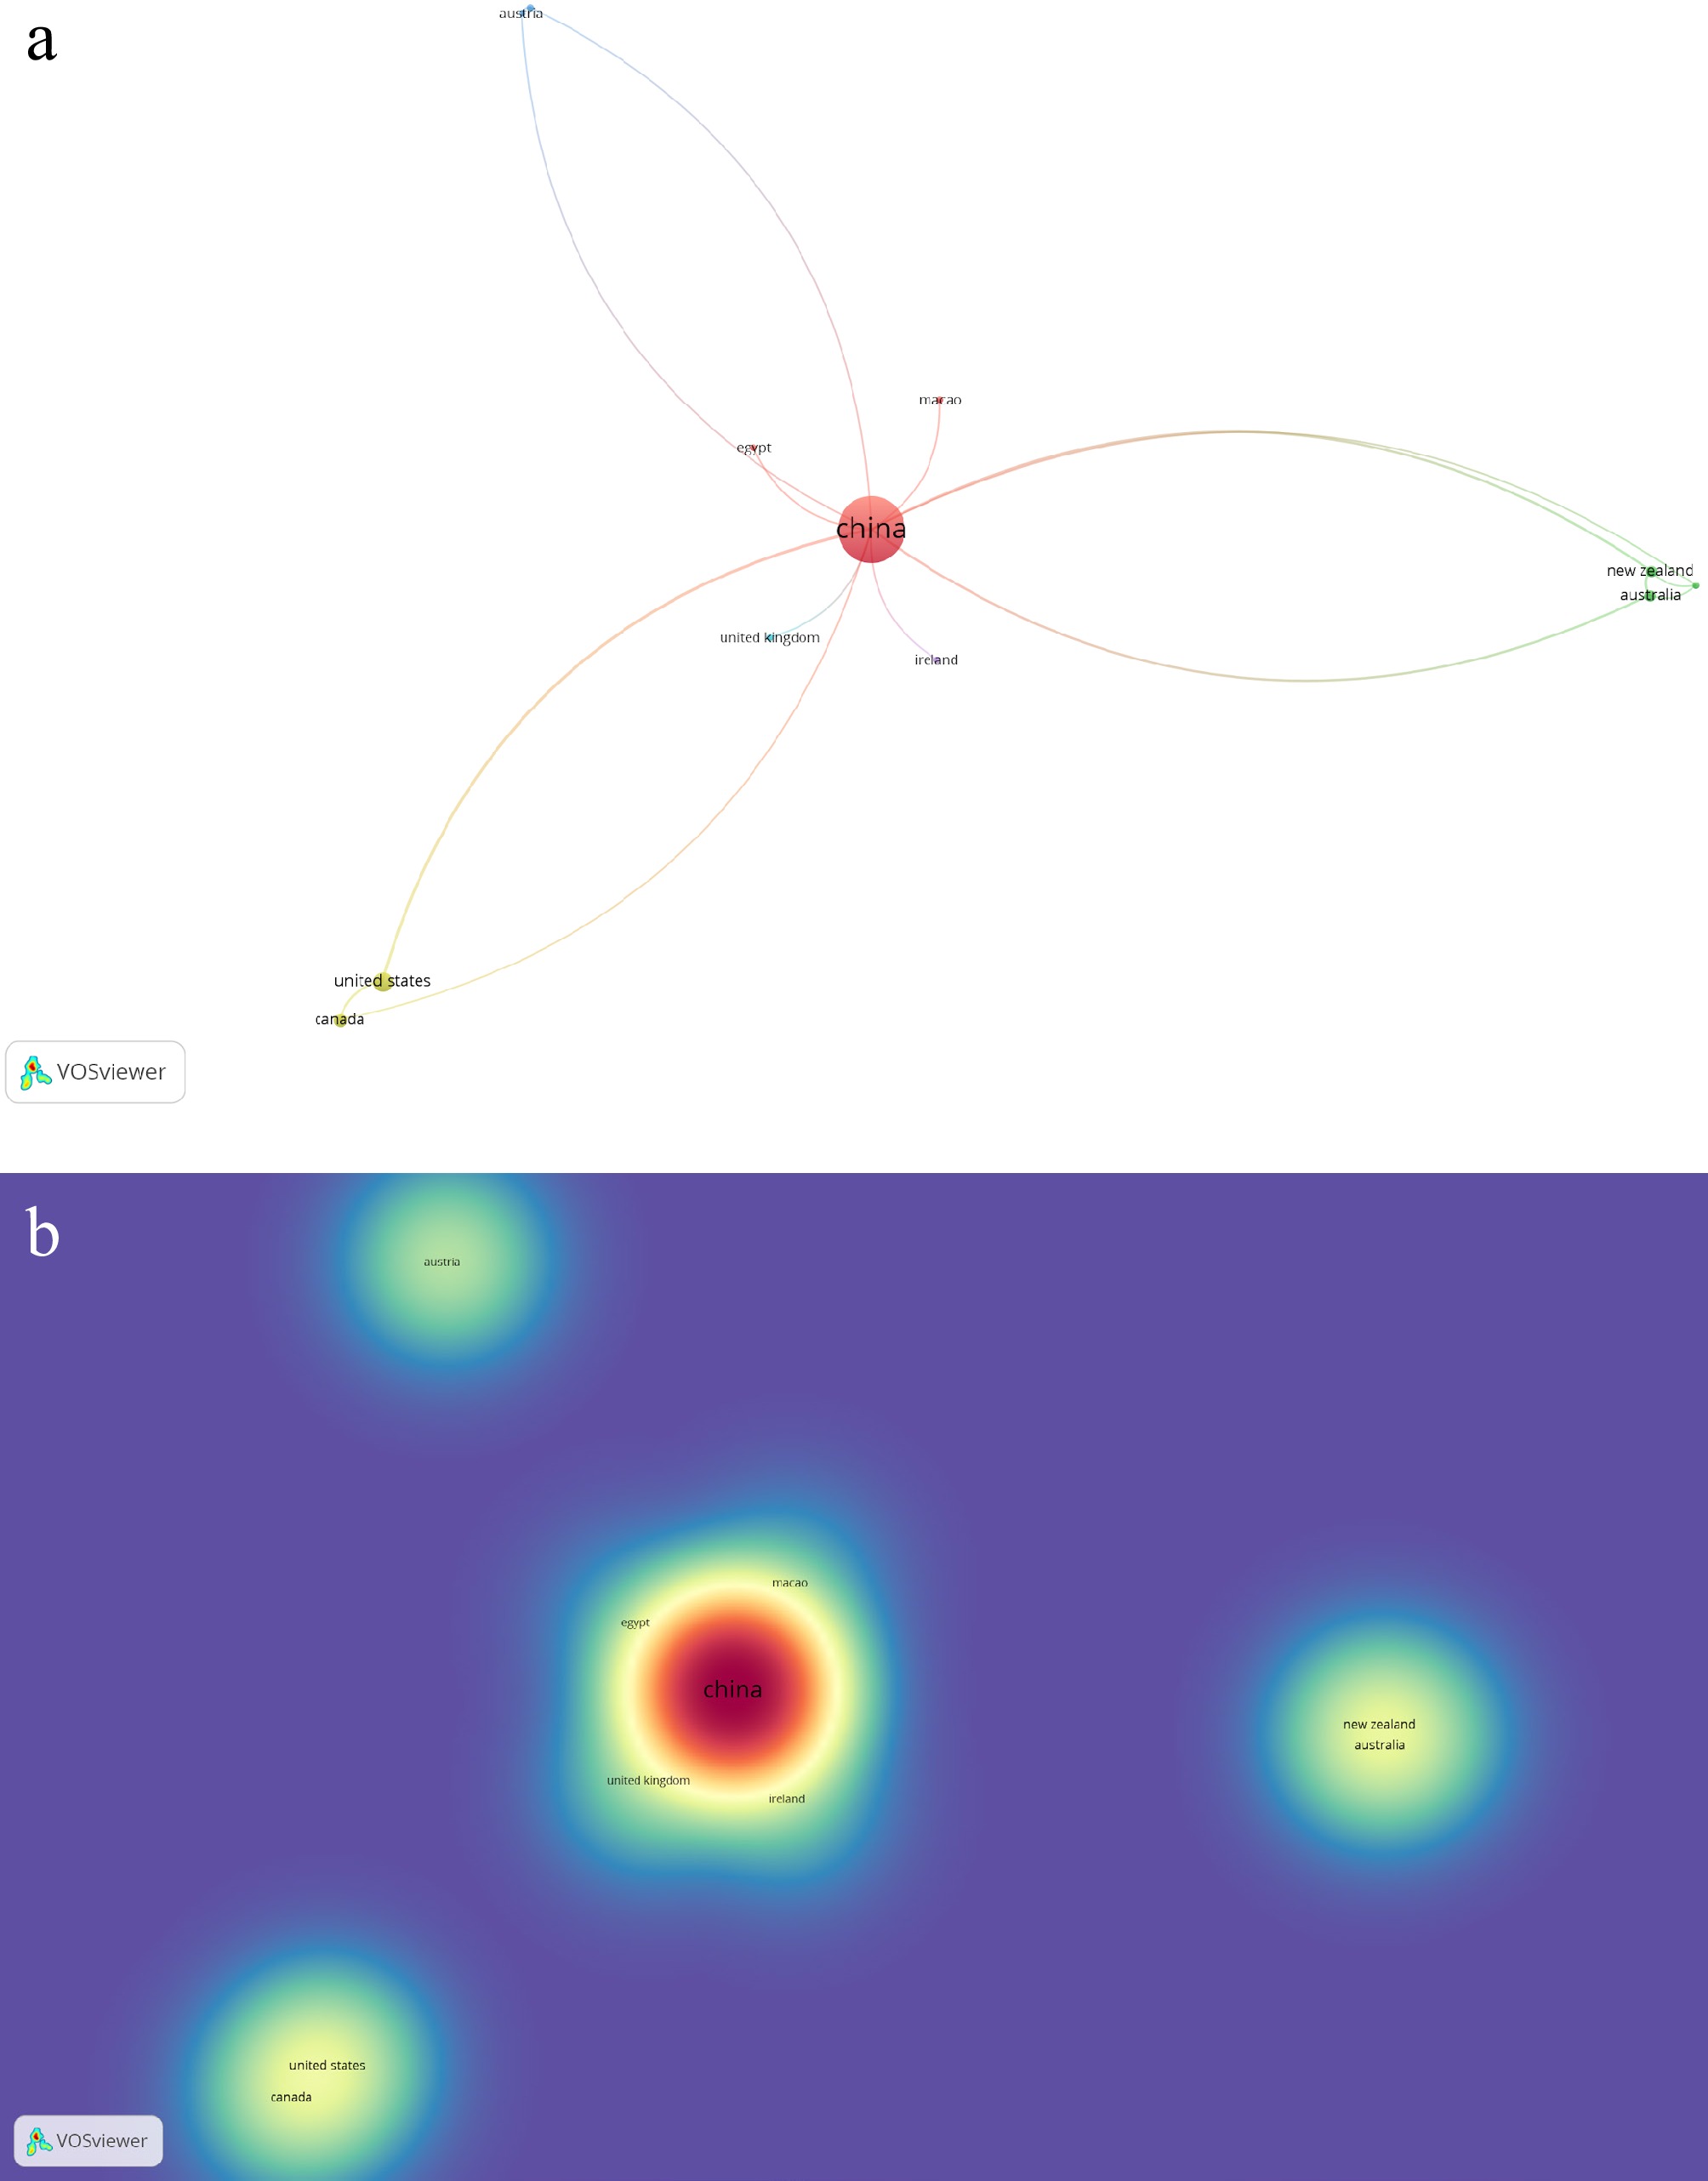
Figure 4.
(a) Network visualization of co-authorship with reference to associated countries on published works of Tremella fuciformis Berk. (b) Density visualization of co-authorship with reference to citations of published works on Tremella fuciformis Berk.
-
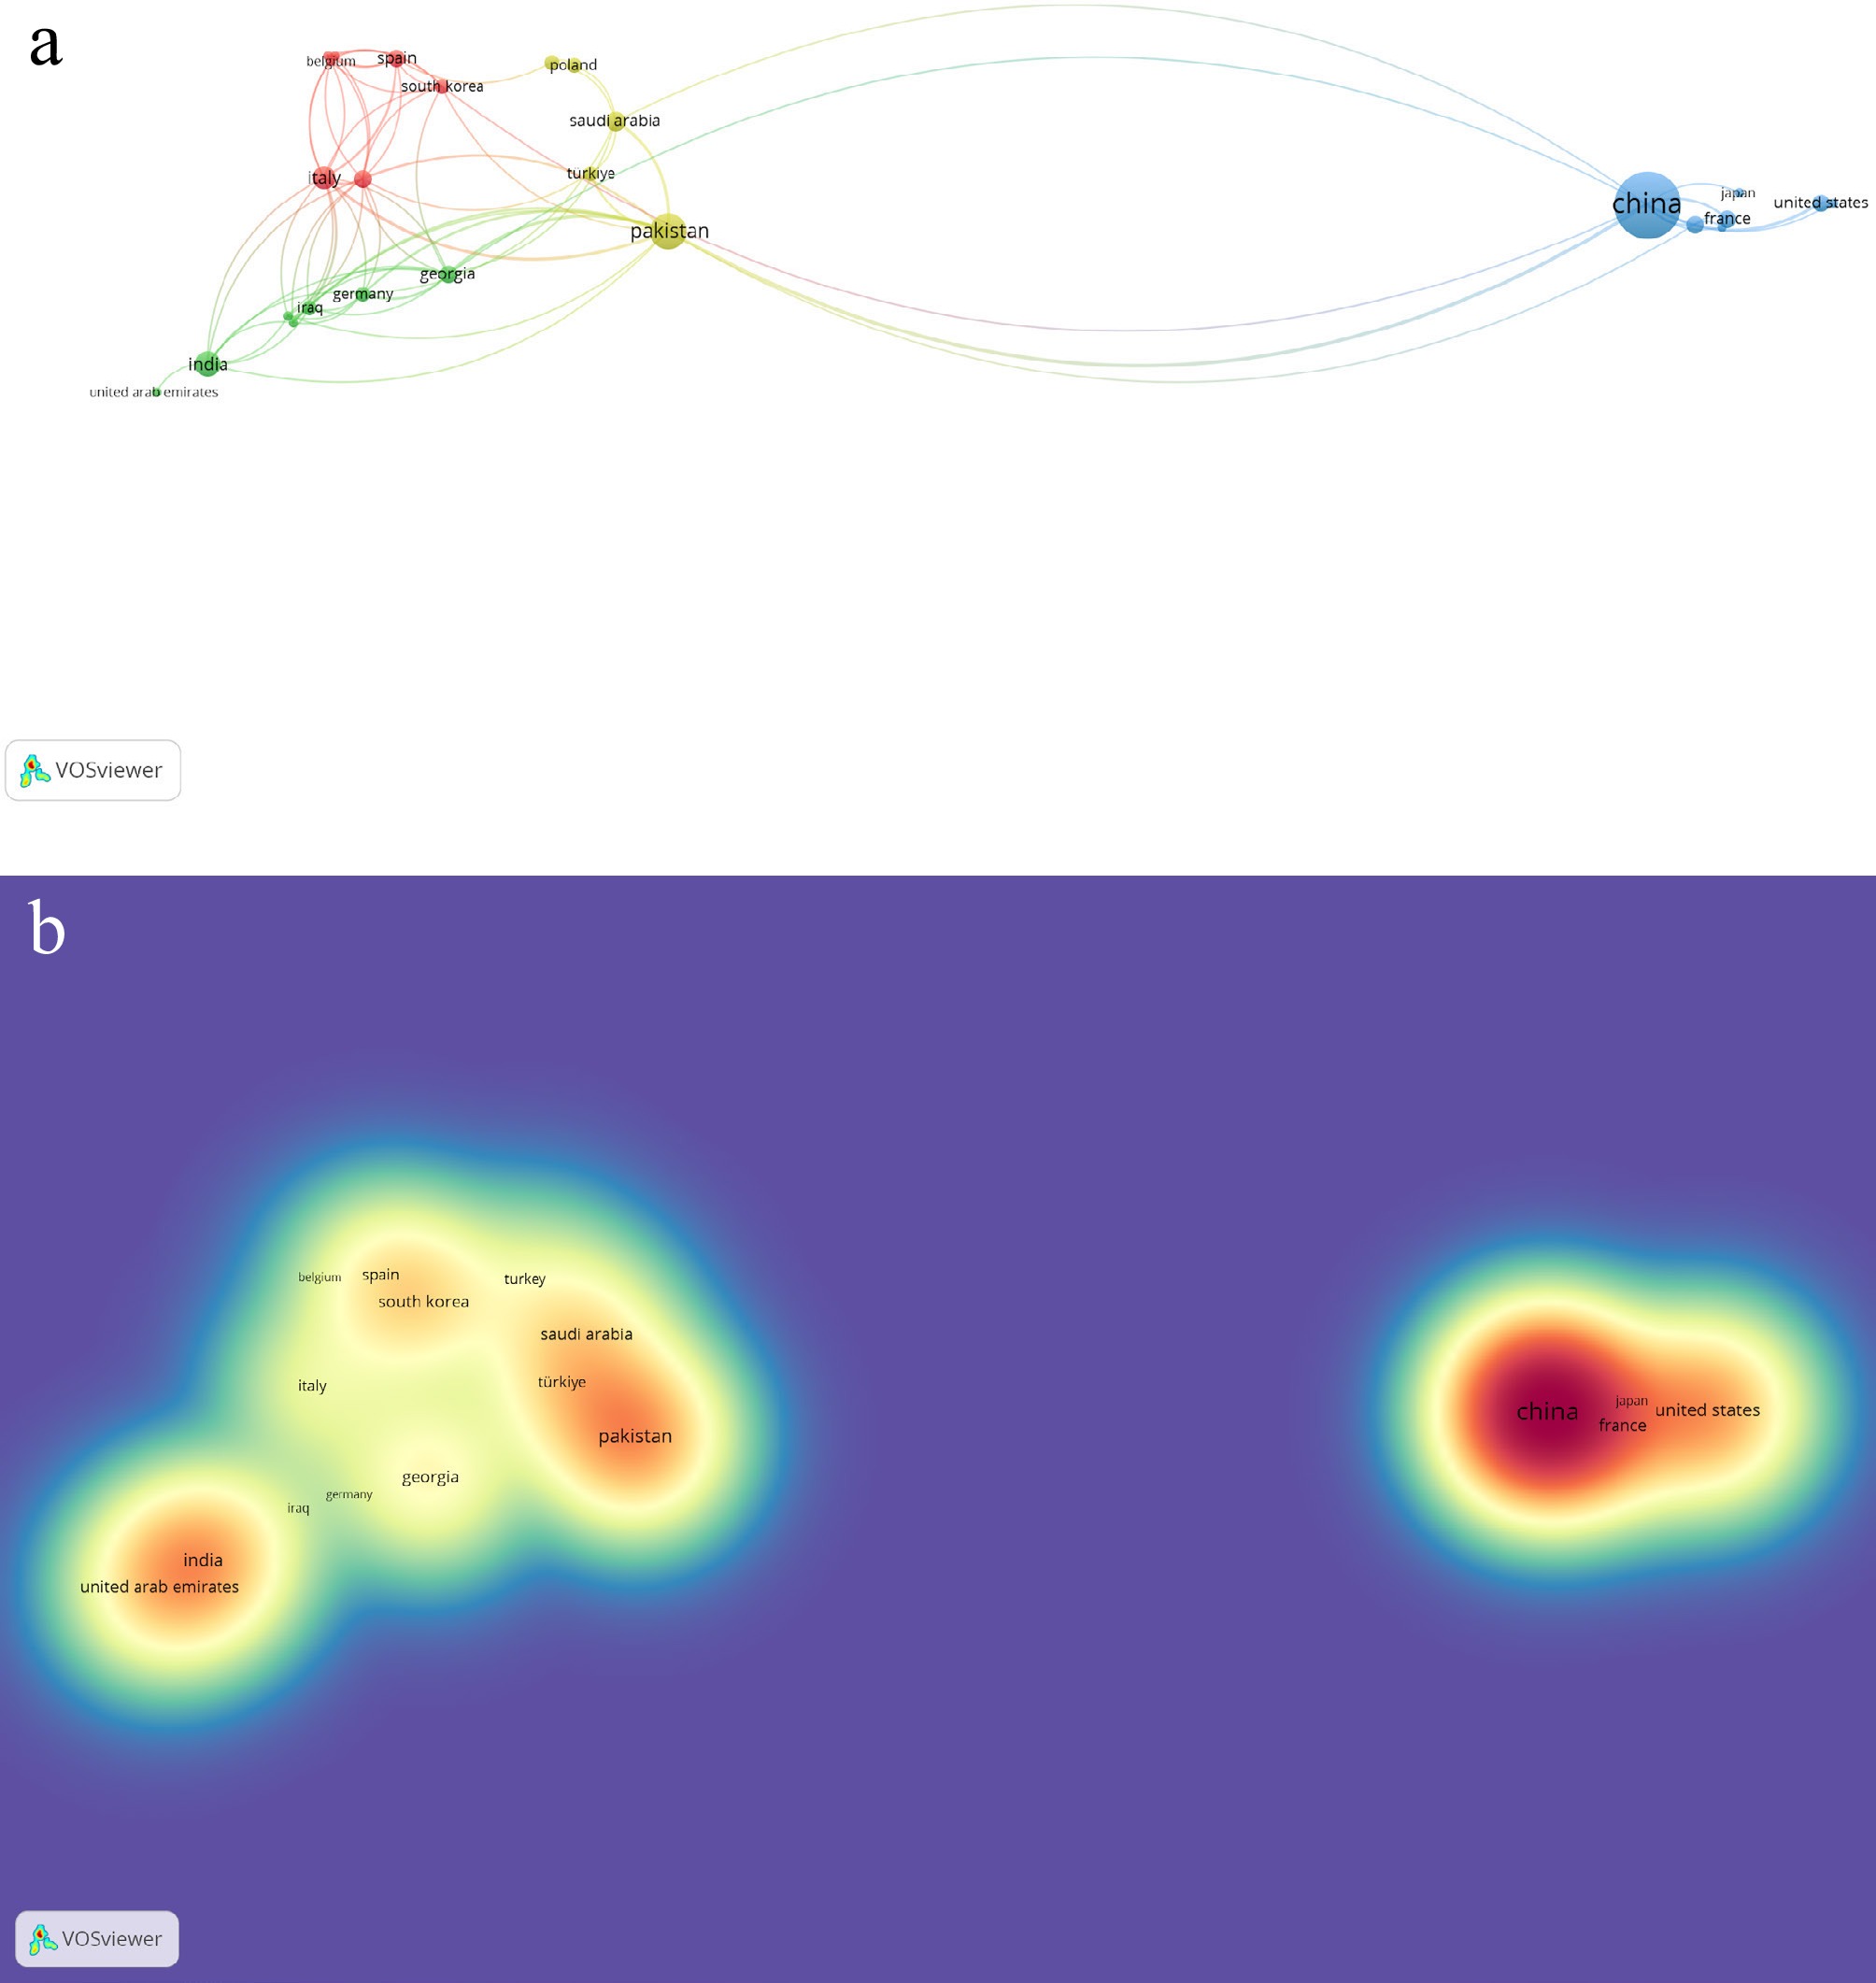
Figure 5.
(a) Network visualization of co-authorship regarding associated countries on published works of Morchella esculenta Fr. (b) Density visualization of co-authorship regarding citations of published works on Morchella esculenta Fr.
-
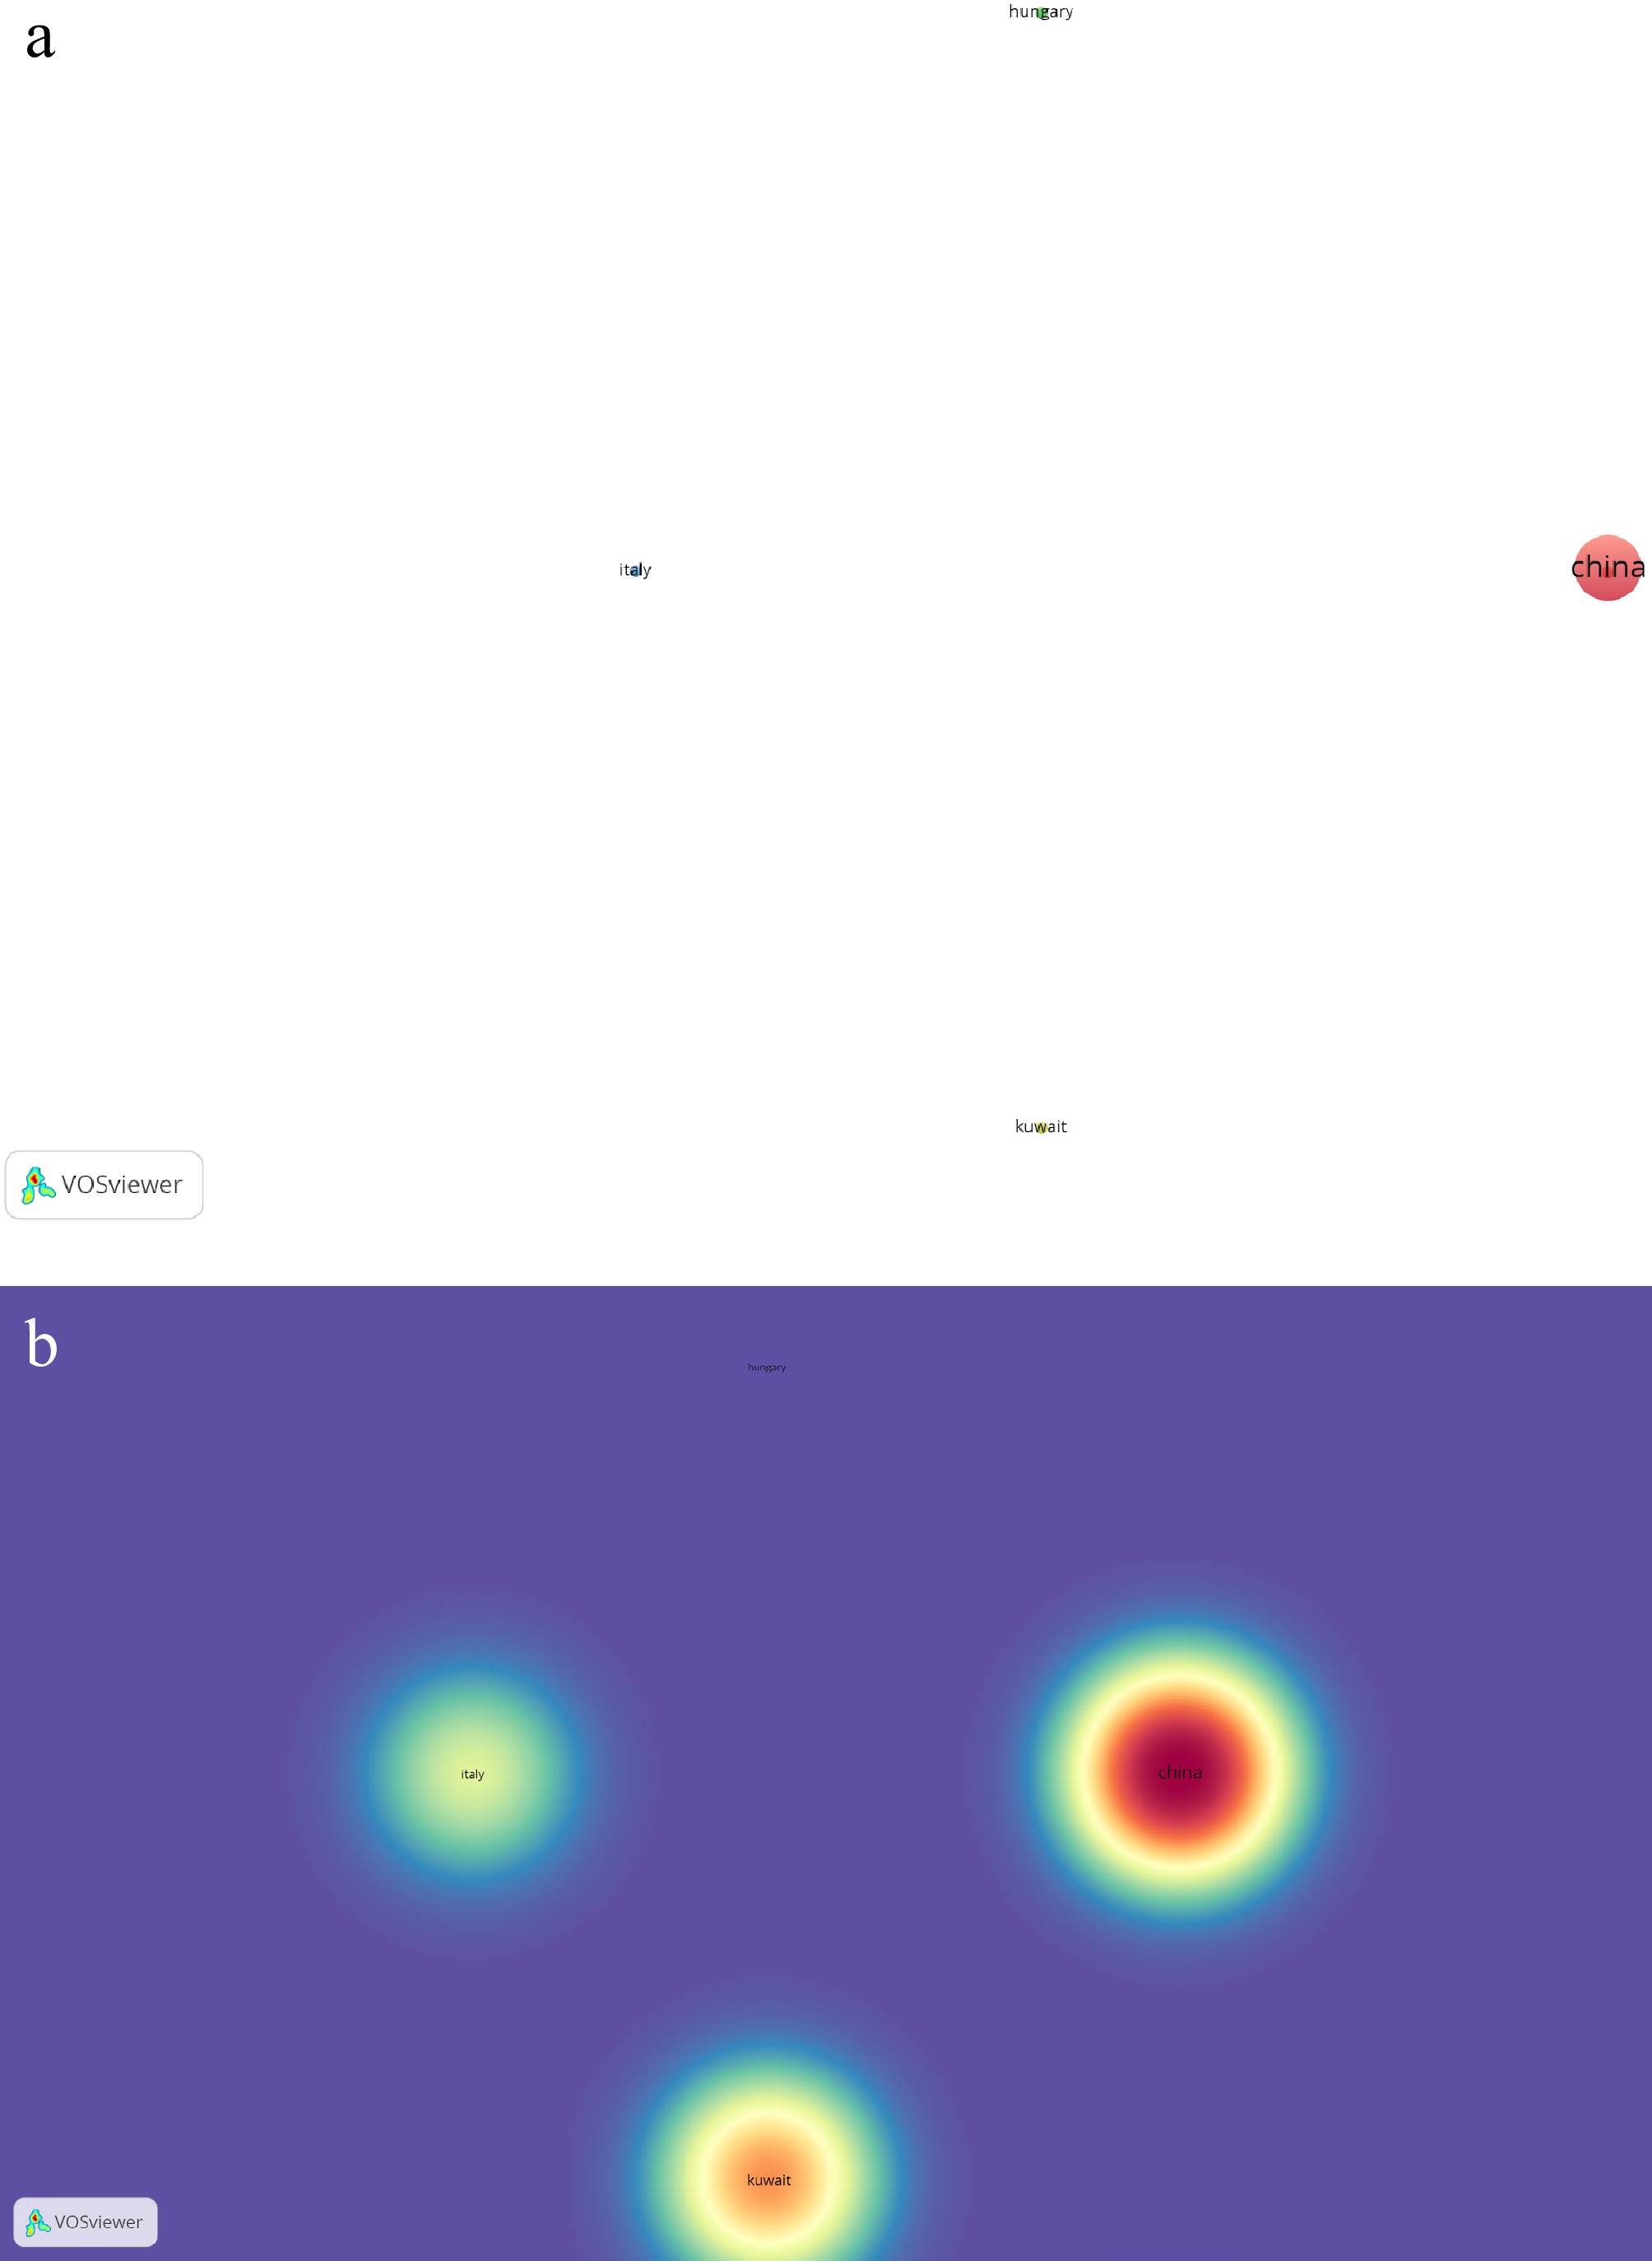
Figure 6.
(a) Network visualization of co-authorship with reference to associated countries on published works of Ganoderma sichuanense J.D. Zhao & X.Q. Zhang. (b) Density visualization of co-authorship with reference to associated countries on published works of Ganoderma sichuanense J.D. Zhao & X.Q. Zhang.
-
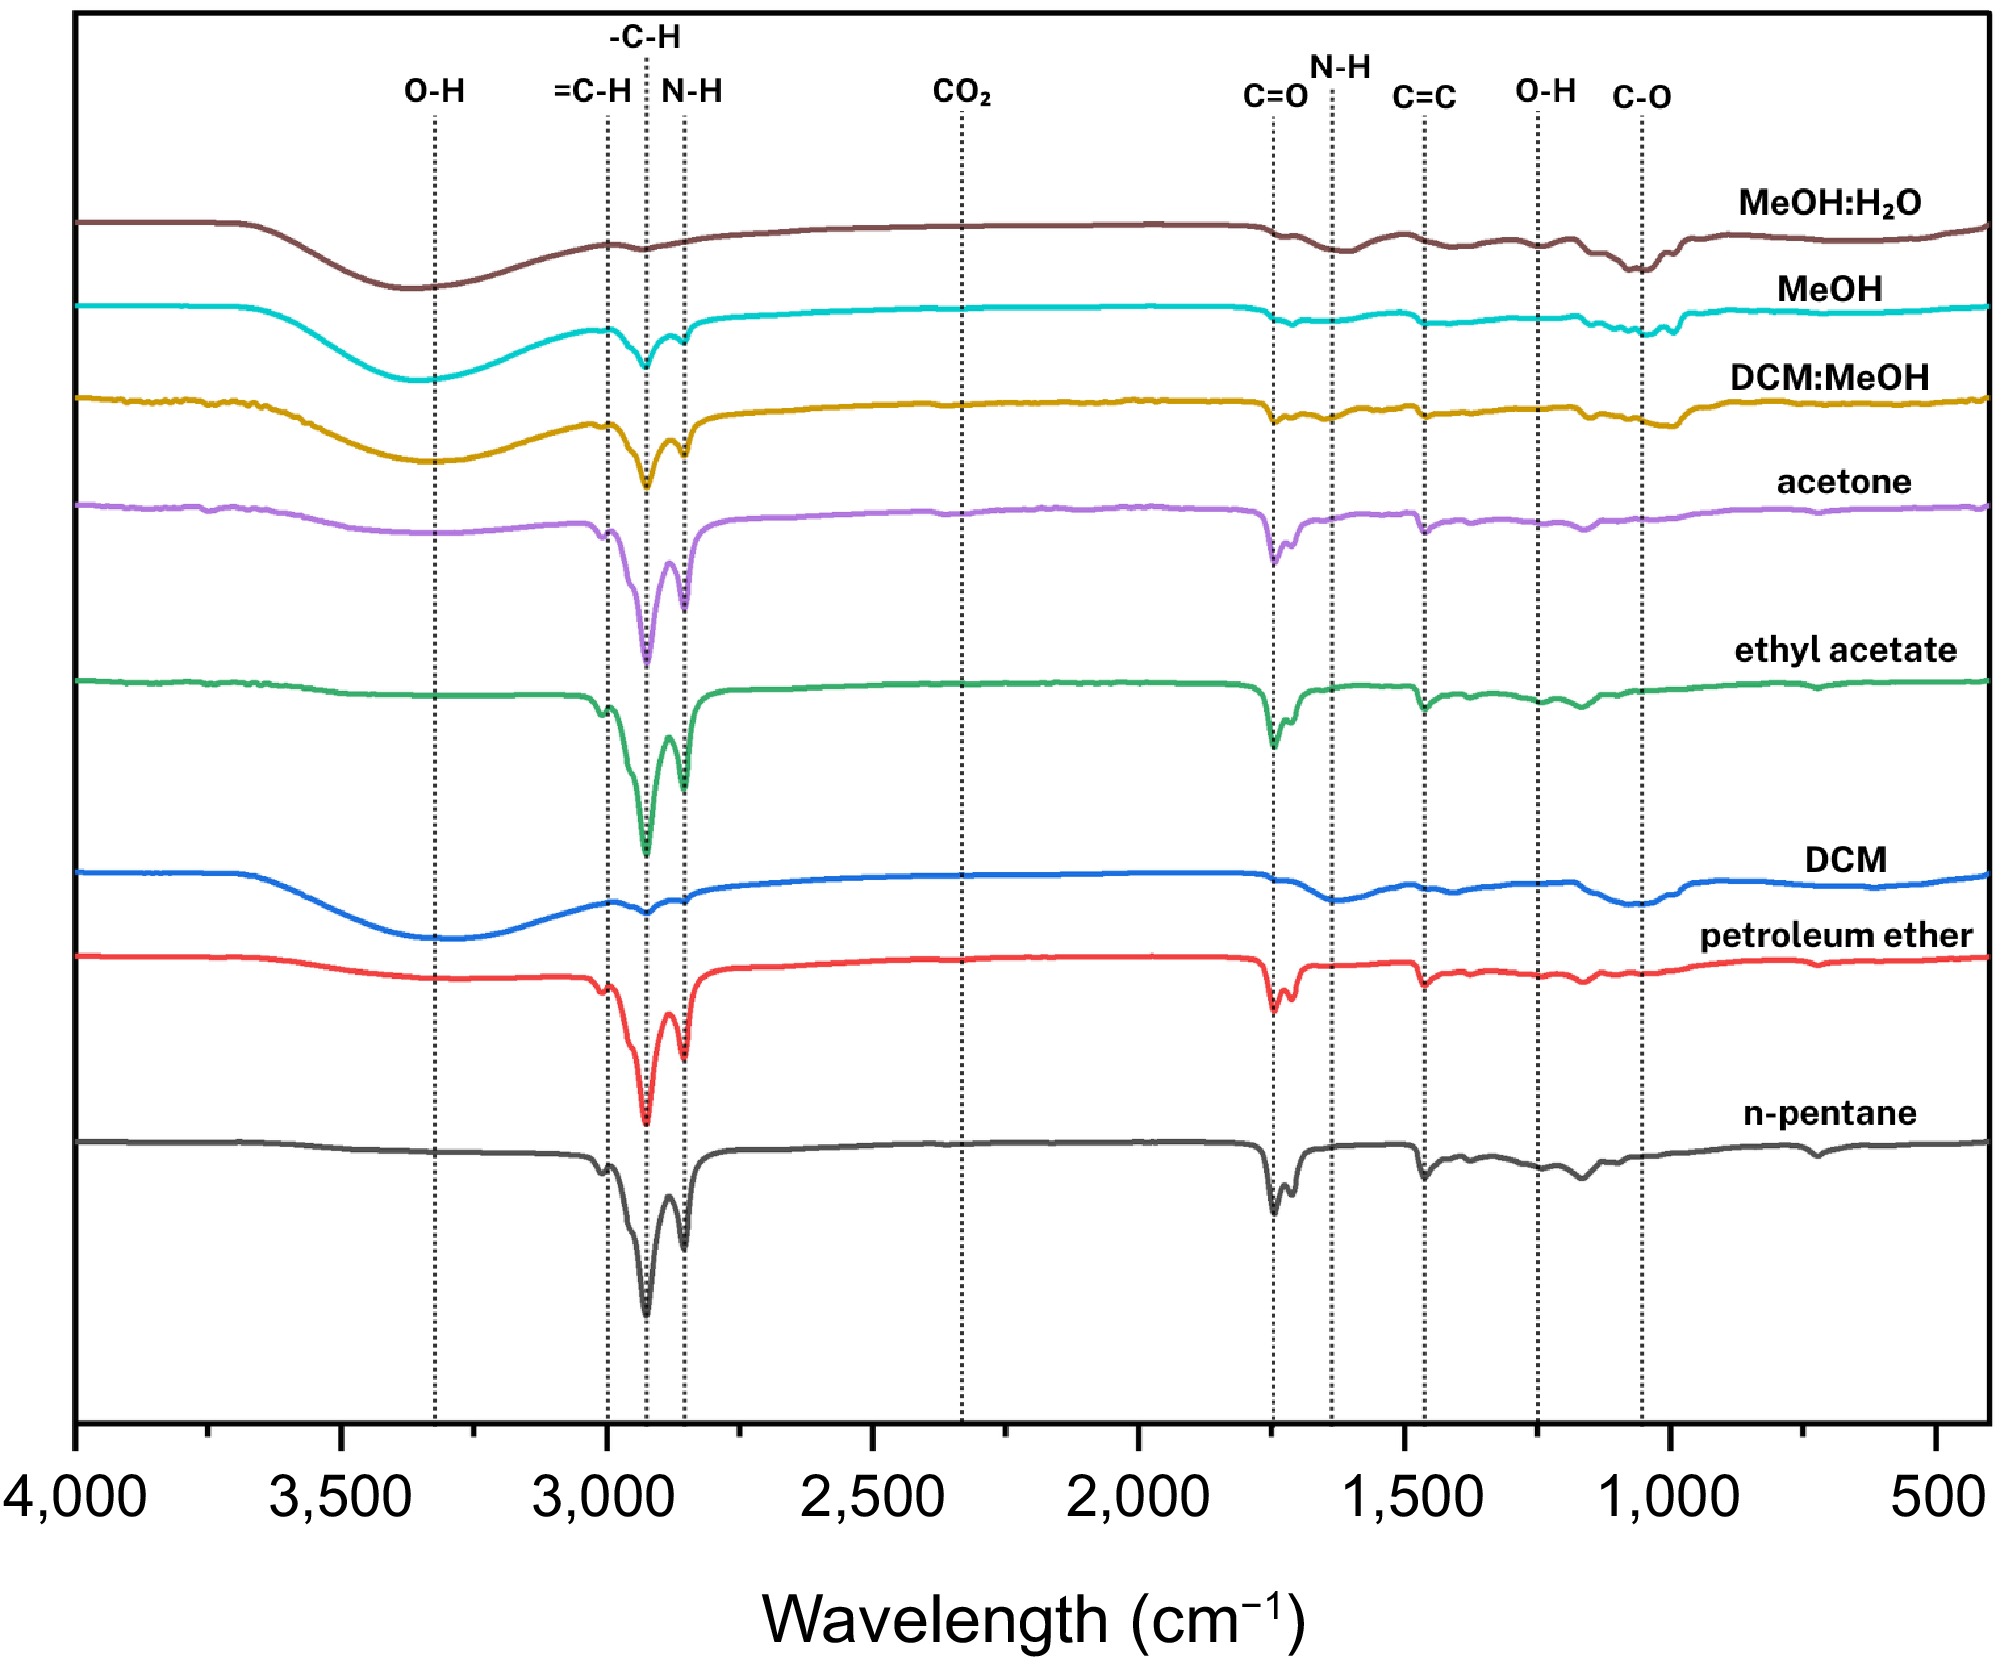
Figure 7.
Compilation of average FTIR spectra of solvent-assisted extractions of Auricularia auricula-judae (Bull.) J.Schröt.
-
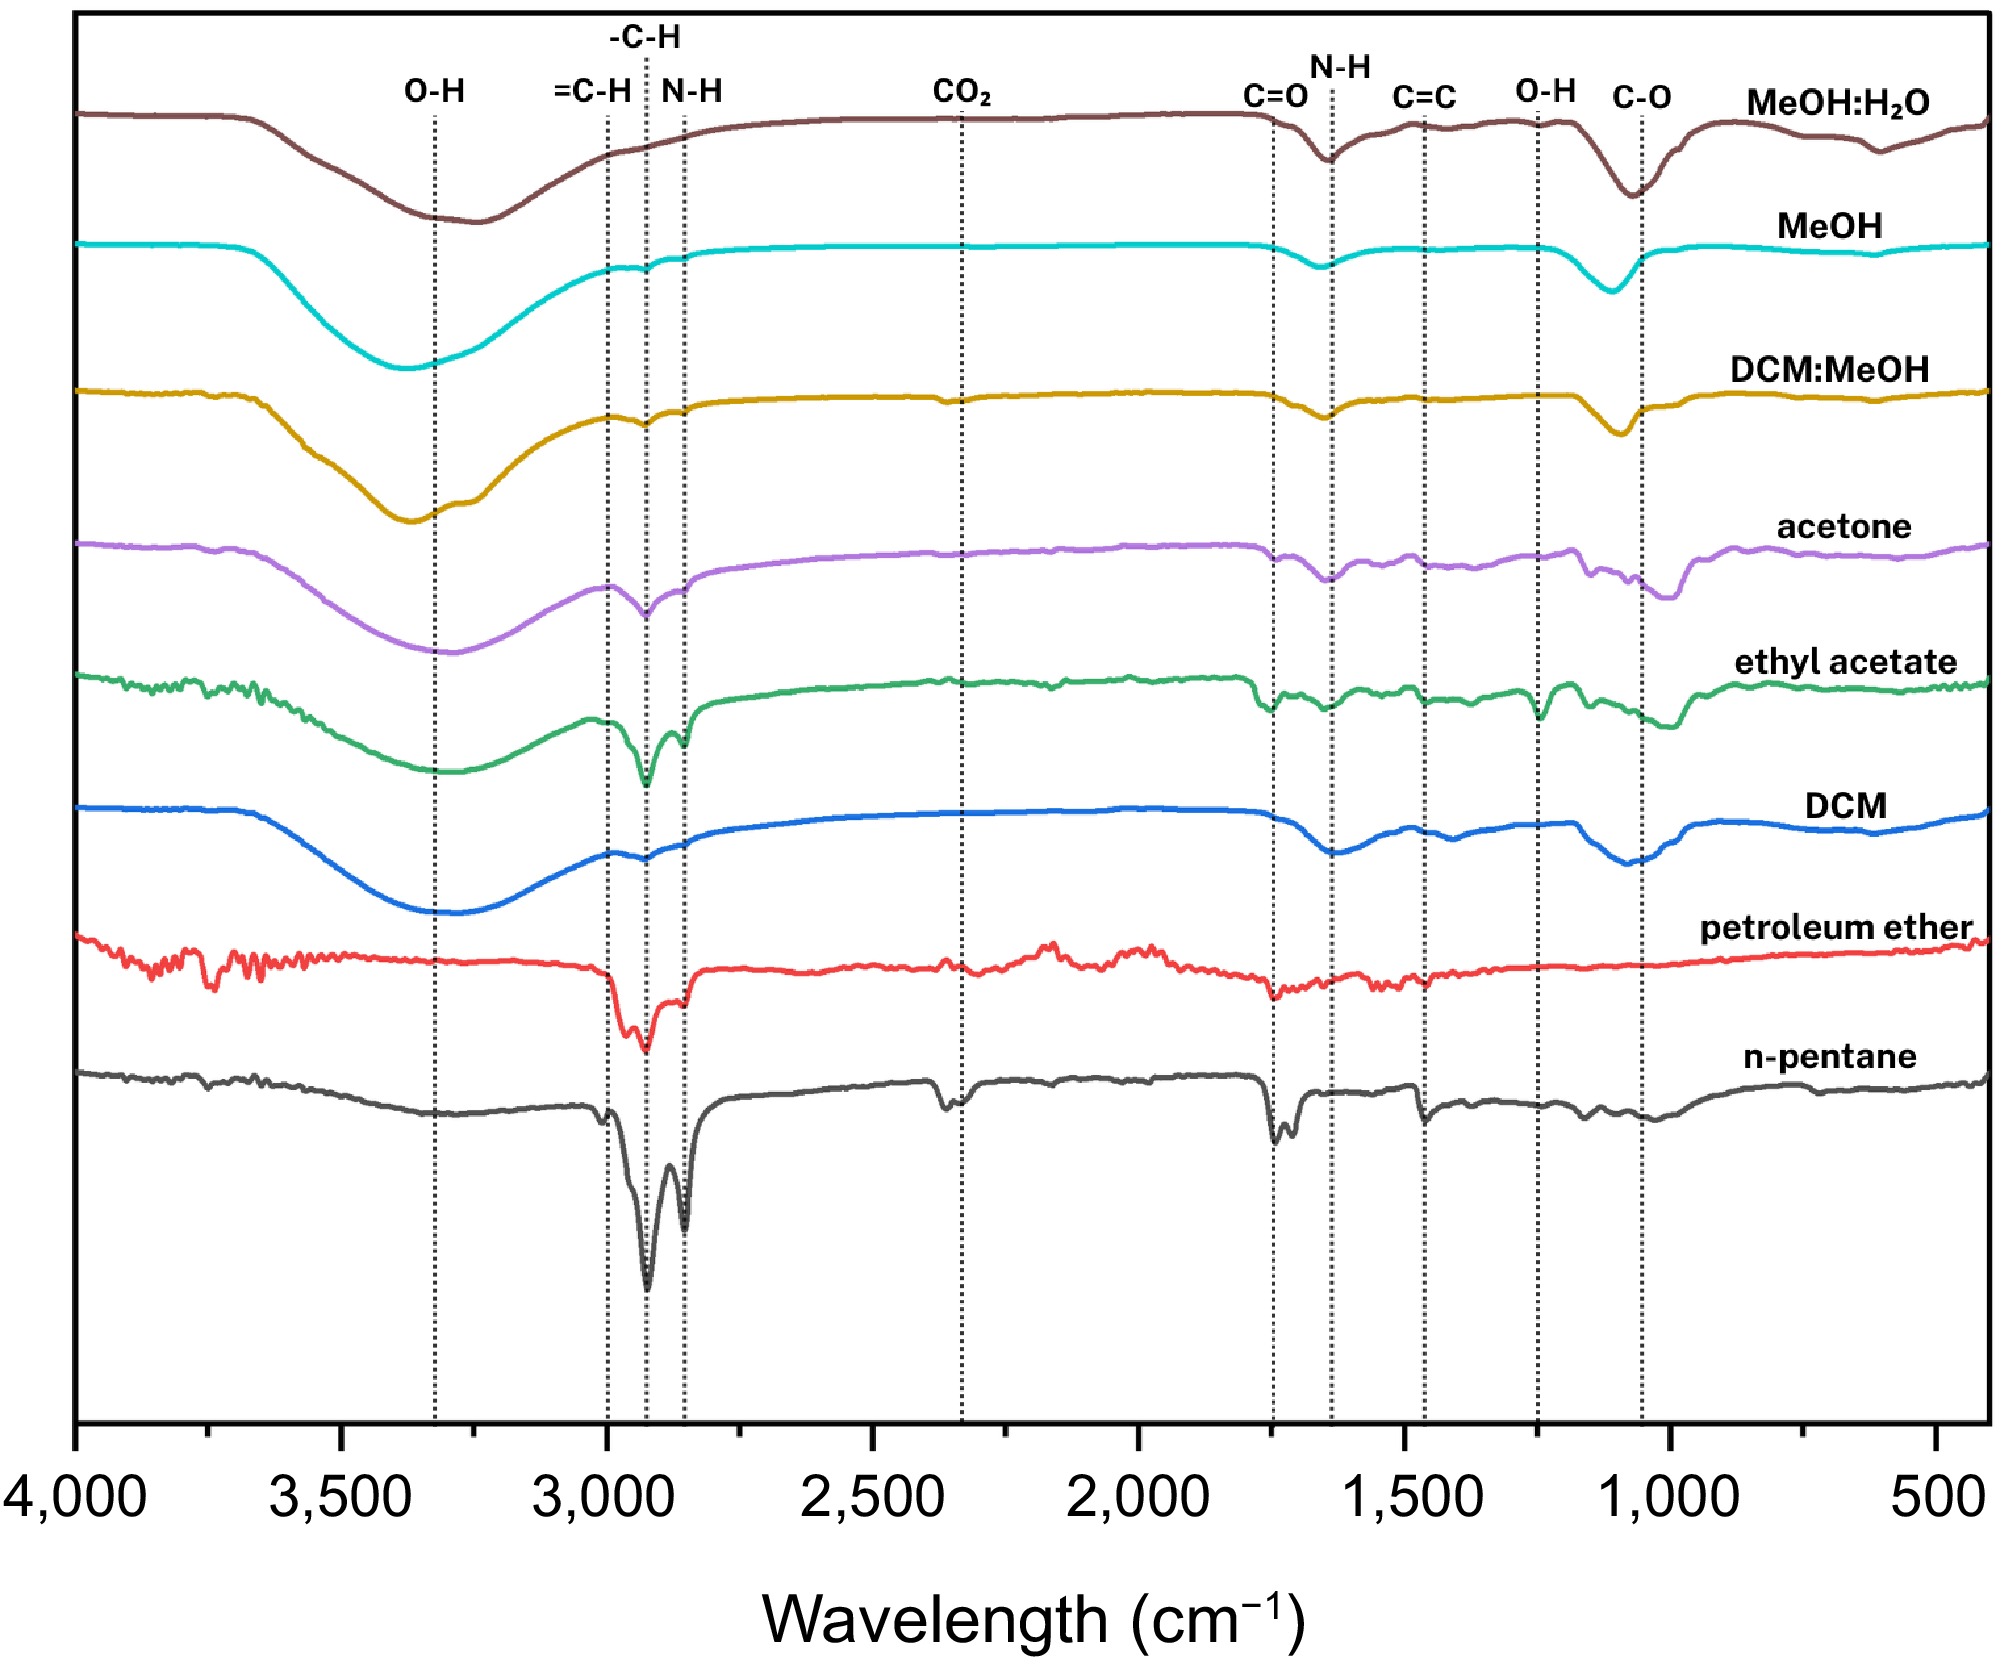
Figure 8.
Compilation of average FTIR spectra of solvent-assisted extraction of Auricularia cornea Ehrenb.
-
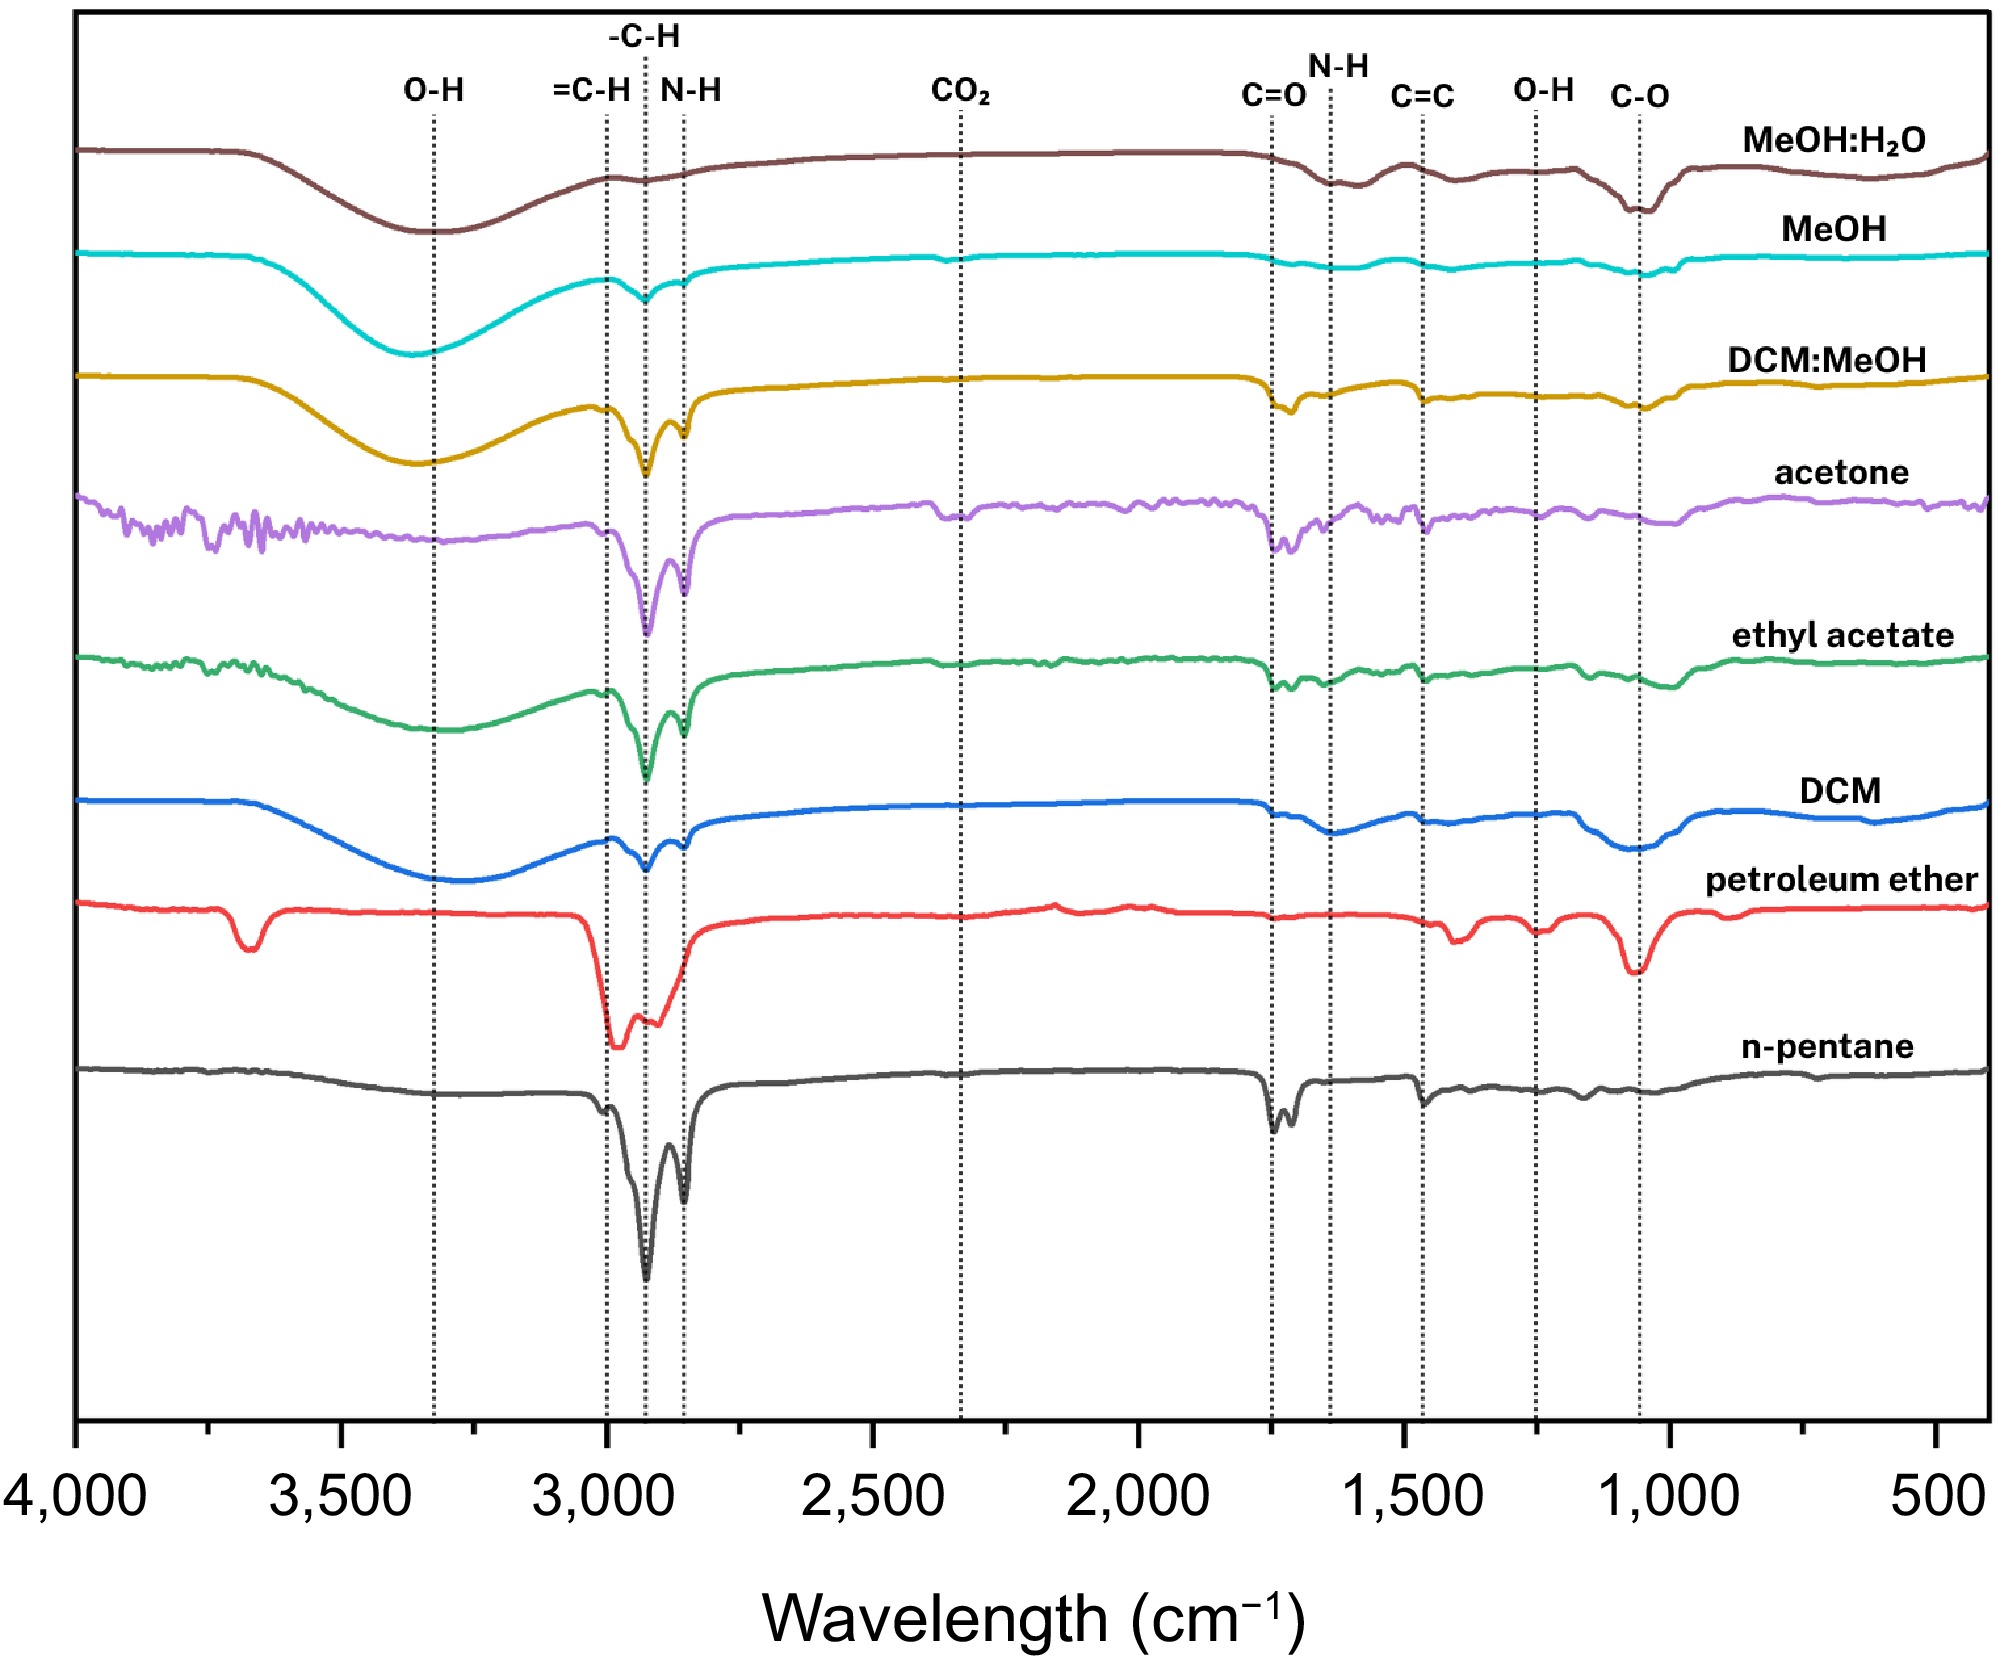
Figure 9.
Compilation of average FTIR spectra of solvent-assisted extraction of Tremella fuciformis Berk.
-
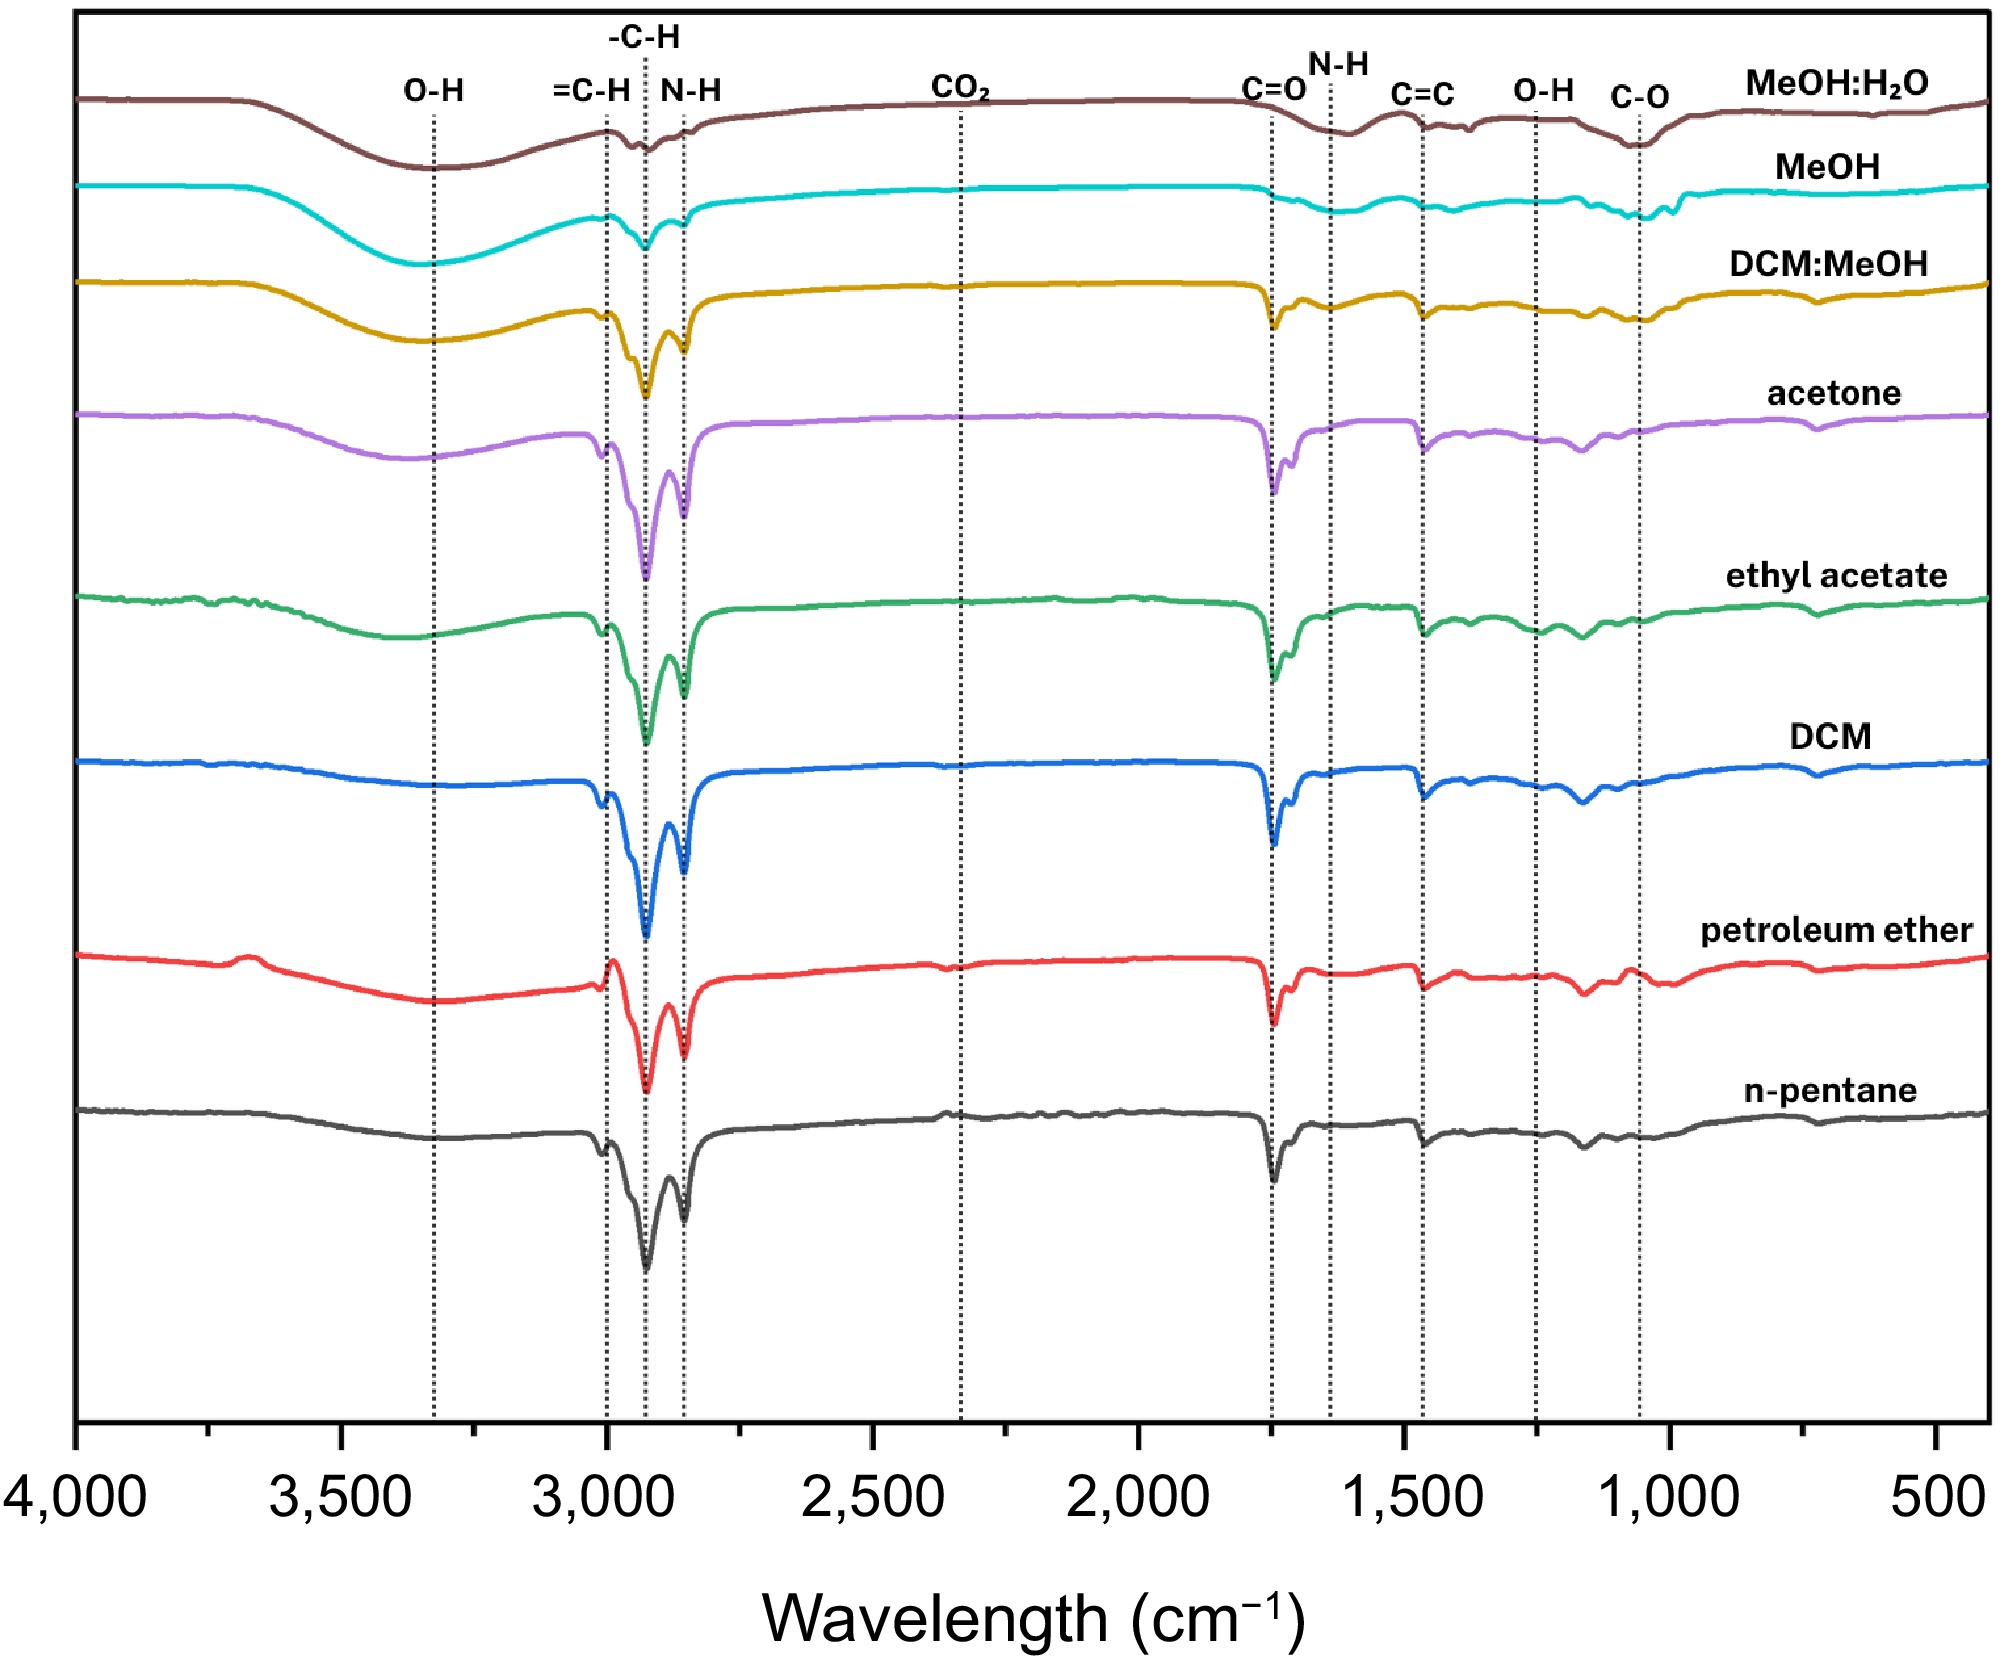
Figure 10.
Compilation of average FTIR spectra of solvent-assisted extraction of Morchella esculenta Fr.
-
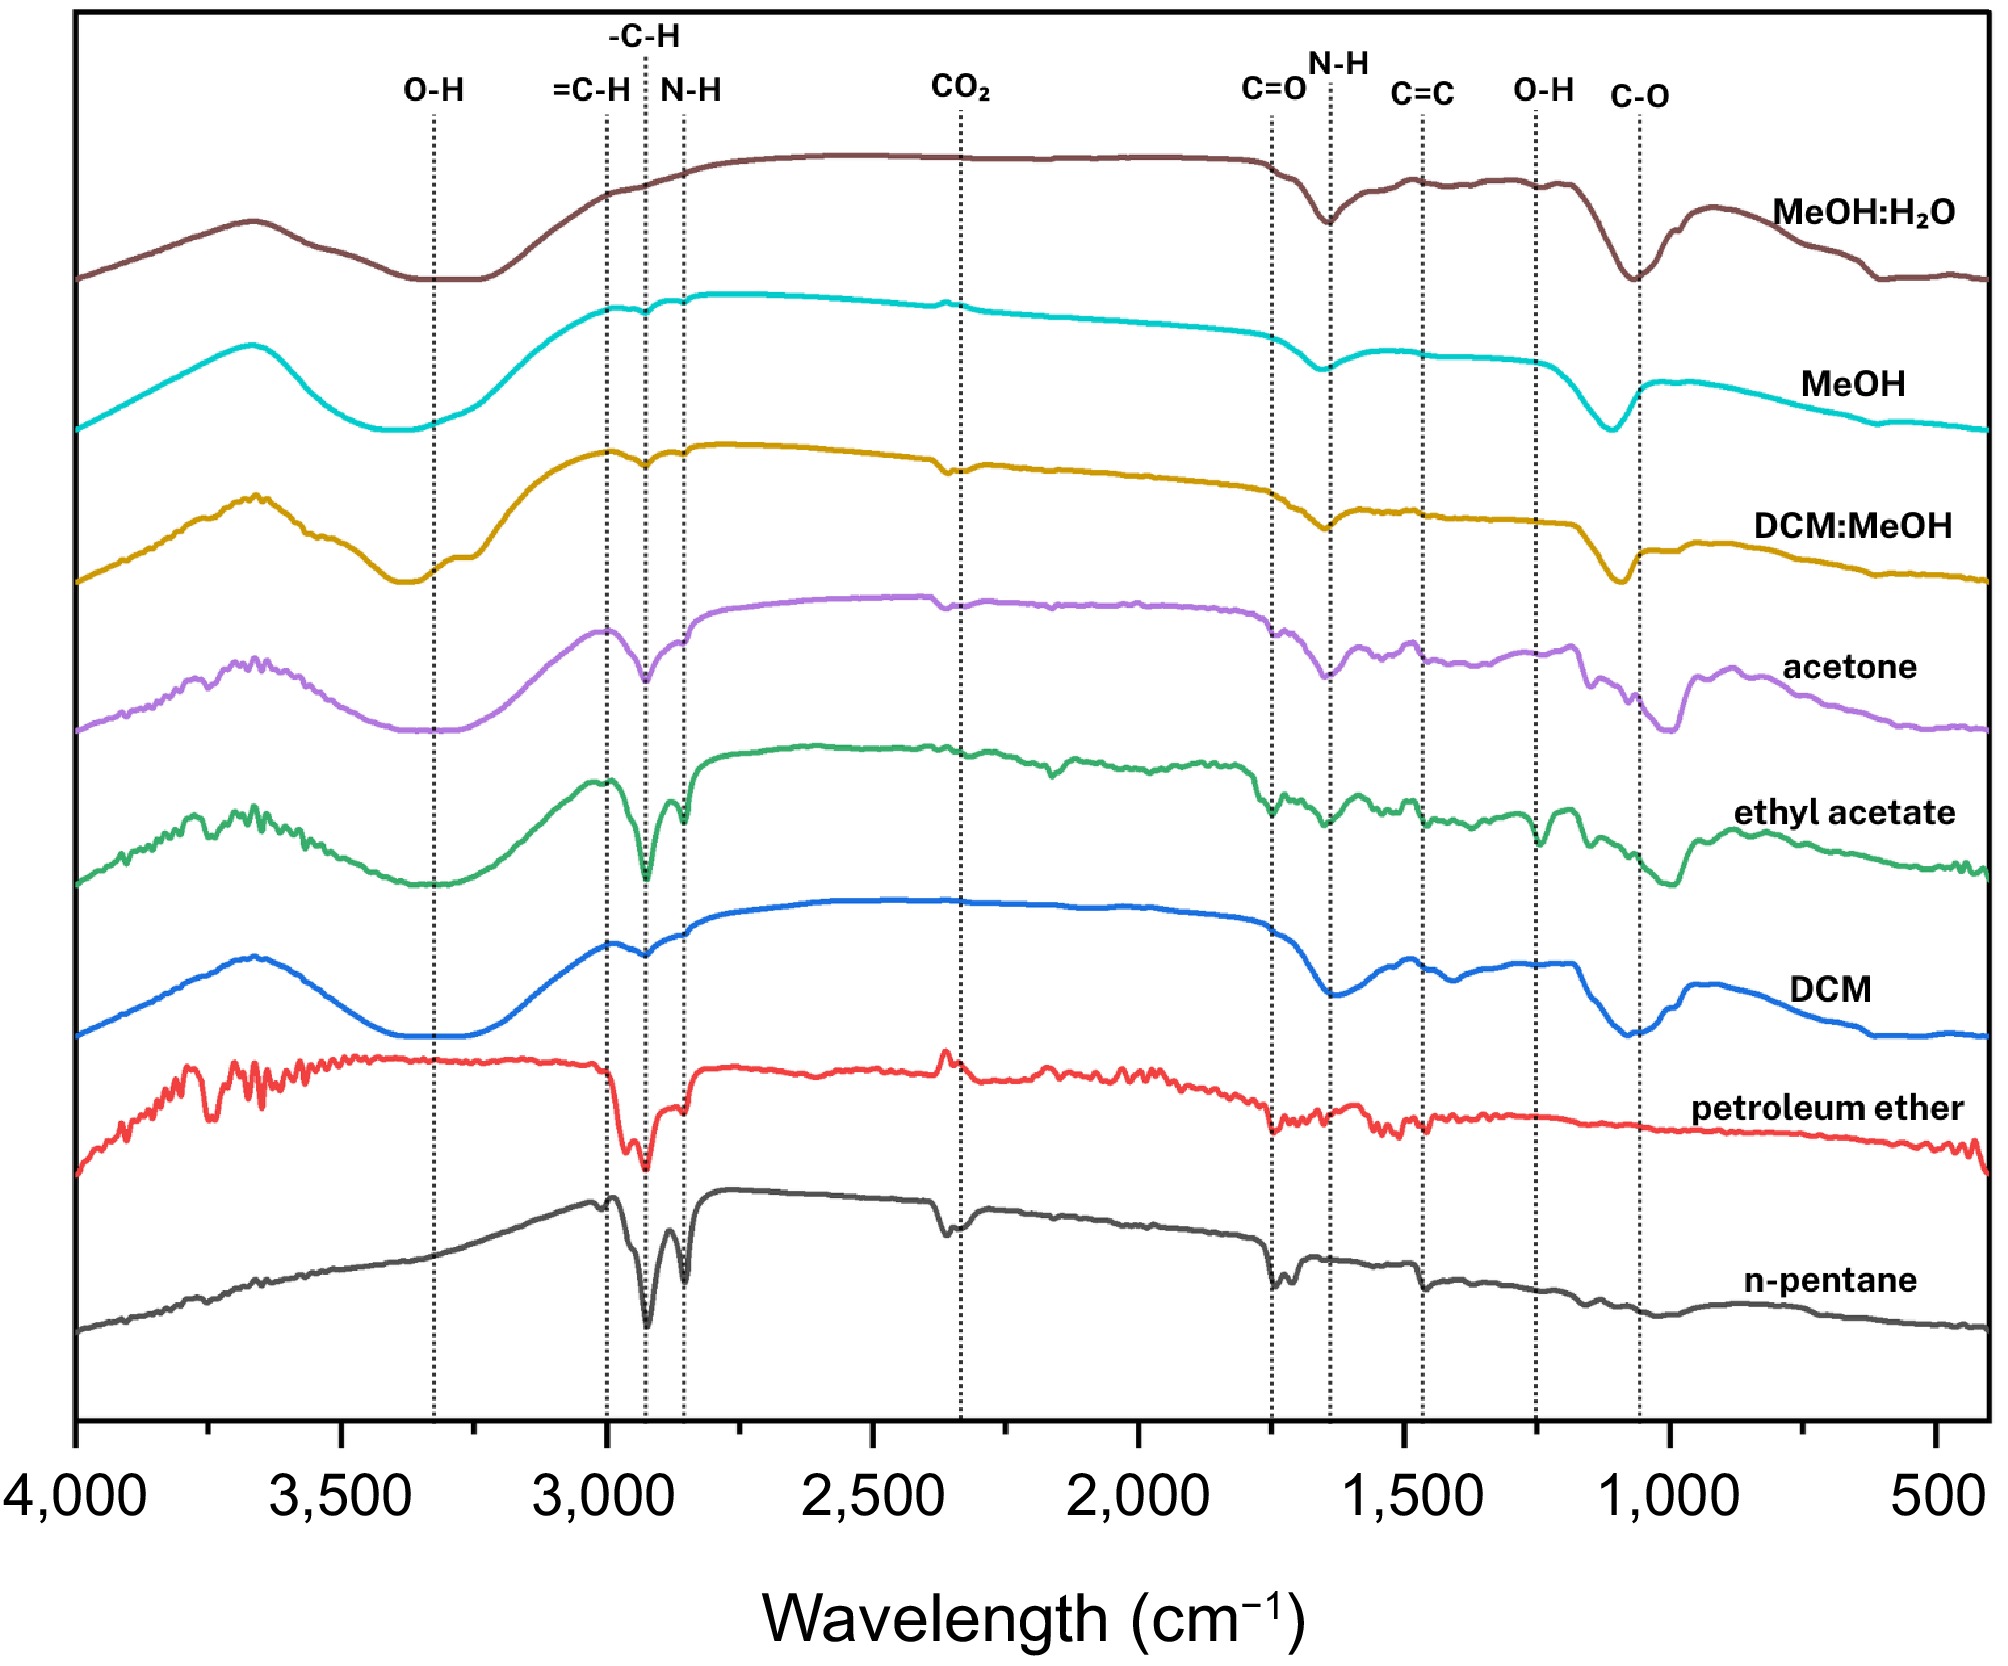
Figure 11.
Compilation of average FTIR spectra of solvent-assisted extraction of Ganoderma sichuanense J.D. Zhao & X.Q. Zhang.
-
Species Total publications No. of countries Countries with collaborative links No. of clusters Most prominent cluster Top publishing countries Auricularia auricula-judae 77 34 12 4 China, the Czech Republic, Egypt, and Japan China (29), USA (11), Thailand (7), Indonesia (5), South Korea (5) Auricularia cornea 42 10 6 2 China, Germany, Pakistan China (34), Thailand (6), USA (3),
others (single publication each)Tremella fuciformis 101 21 12 6 China, Egypt, Macao China (72), Taiwan (10), USA (6),
Malaysia (5), Canada (3)Morchella esculenta 67 34 26 4 Canada, China, Egypt, France, Japan, Malaysia, and
the United StatesChina (40), Pakistan (12), India (6),
Italy (5), Saudi Arabia (4)Ganoderma sichuanense 8 5 5 4 China and Ghana China (5), Ghana (1), Hungary (1),
Italy (1), Kuwait (1)Table 1.
Bibliometric summary of selected edible fungal species.
-
Solvent extract Auricularia auricula-judae Auricularia cornea Tremella fuciformis Morchella esculenta Ganoderma sichuanense n-Pentane/
Petroleum Ether (Non-polar)Peaks at ~3,008.98, 2,925.68, 2,855.30, 1,745.07, 1,713.47,
1,464.99 cm−1; indicates
long-chain fatty acids,
phospholipidsSimilar peaks at ~3,008.66, 2,924.24, 2,853.87, 1,743.63, 1,710.60, 1,462.12 cm−1;
fatty acids and lipids
presentPeaks at ~3,008.66, 2,925.68, 2,853.87, 1,745.07, 1,710.60,
1,464.99 cm−1; indicative of a
lipid-rich profilePeaks at ~3,008.98, 2,925.68, 2,855.30, 1,743.63, 1,713.47,
1,464.99 cm−1; confirms fatty acids and estersPeaks at ~3,008.66, 2,925.68, 2,855.30, 1,743.63, 1,713.47,
1,464.99 cm−1; consistent with fatty acid and phospholipid contentDCM (Medium polarity) Broad peak at 3,301.98 cm−1 (O-H/N-H), diminished C-H, C=C at 1,627.29 cm−1, C-O at 1,052.78 cm−1, amide band at 617.60 cm−1 Peak at 3,305.35 cm−1 (O-H/N-H), weaker C-H stretches, C=C at 1,625.86 cm−1, C-O
at 1,052.78 cm−1, amide
band at 617.60 cm−1Peak at 3,301.98 cm−1, reduced C-H, C=C at 1,625.86 cm−1, C-O at 1,052.78 cm−1,
amide ~617.60 cm−1Broad 3,305.35 cm−1 (O-H/N-H), C=C at 1,625.86 cm−1, C-O at 1,052.78 cm−1, amide at 617.60 cm−1 Peak at 3,305.35 cm−1, diminished C-H, C=C at 1,625.86 cm−1, C-O at 1,052.78 cm−1, amide
band at 617.60 cm−1Ethyl Acetate (Semi-polar) Peaks at ~3,008.98, 2,925.68, 2,855.30, 1,745.07, 1,713.47, 1,457.81, 1,240.94,
1,164.81 cm−1; mid- to short-chain fatty acid acetatesPeaks at ~3,008.66, 2,924.24, 2,853.87, 1,743.63, 1,710.60, 1,457.81, 1,243.81,
1,161.94 cm−1; fatty acid acetates presentPeaks at ~3,008.98, 2,925.68, 2,853.87, 1,743.63, 1,710.60, 1,457.81, 1,243.81, 1,164.81 cm−1;
acetates of fatty
acids detectedPeaks at ~3,008.98, 2,925.68, 2,855.30, 1,745.07, 1,710.60, 1,457.81, 1,243.81,
1,164.81 cm−1; esters and acetates prominentPeaks at ~3,008.98, 2,925.68, 2,855.30, 1,743.63, 1,710.60, 1,457.81, 1,243.81,
1164.81 cm−1; acetates
and esters significantAcetone
(Semi-polar)Peaks at ~3,008.98, 2,924.24, 2,853.87, 1,743.63, 1,710.60, 1,457.81, 1,161.94 cm−1; consistent with free
fatty acidsPeaks at ~3,008.66, 2,924.24, 2,853.87, 1,743.63, 1,710.60, 1,457.81, 1,161.94 cm−1;
fatty acids evidentPeaks at ~3,008.98, 2,925.68, 2,855.30, 1,745.07, 1,710.60, 1,457.81, 1,164.81 cm−1; free fatty acids and esters detected Peaks at ~3,008.98, 2,925.68, 2,855.30, 1,745.07, 1,710.60, 1,457.81, 1,164.81 cm−1; fatty acids dominant Peaks at ~3,008.98, 2,925.68, 2,855.30, 1,743.63, 1,710.60, 1,457.81, 1,164.81 cm−1; fatty acids and esters prominent DCM: MeOH Crude Extract (Polar) The peak at 3,337.89 cm−1 (O-H or N-H from glucans), strong signals indicating polysaccharides and proteins Broad peak at
~3,337.89 cm−1,
indicating glucans
and protein contentSimilar broad peak at ~3,337.89 cm−1; polysaccharides and proteins present Broad ~3,337.89 cm−1
peak confirming polysaccharides (glucans) and protein structuresPeak at ~3,337.89 cm−1, strong signal of glucans and protein-associated
O-H/N-H stretchesTable 2.
Summary of FTIR spectroscopy findings for selected mushroom species.
Figures
(11)
Tables
(2)