-
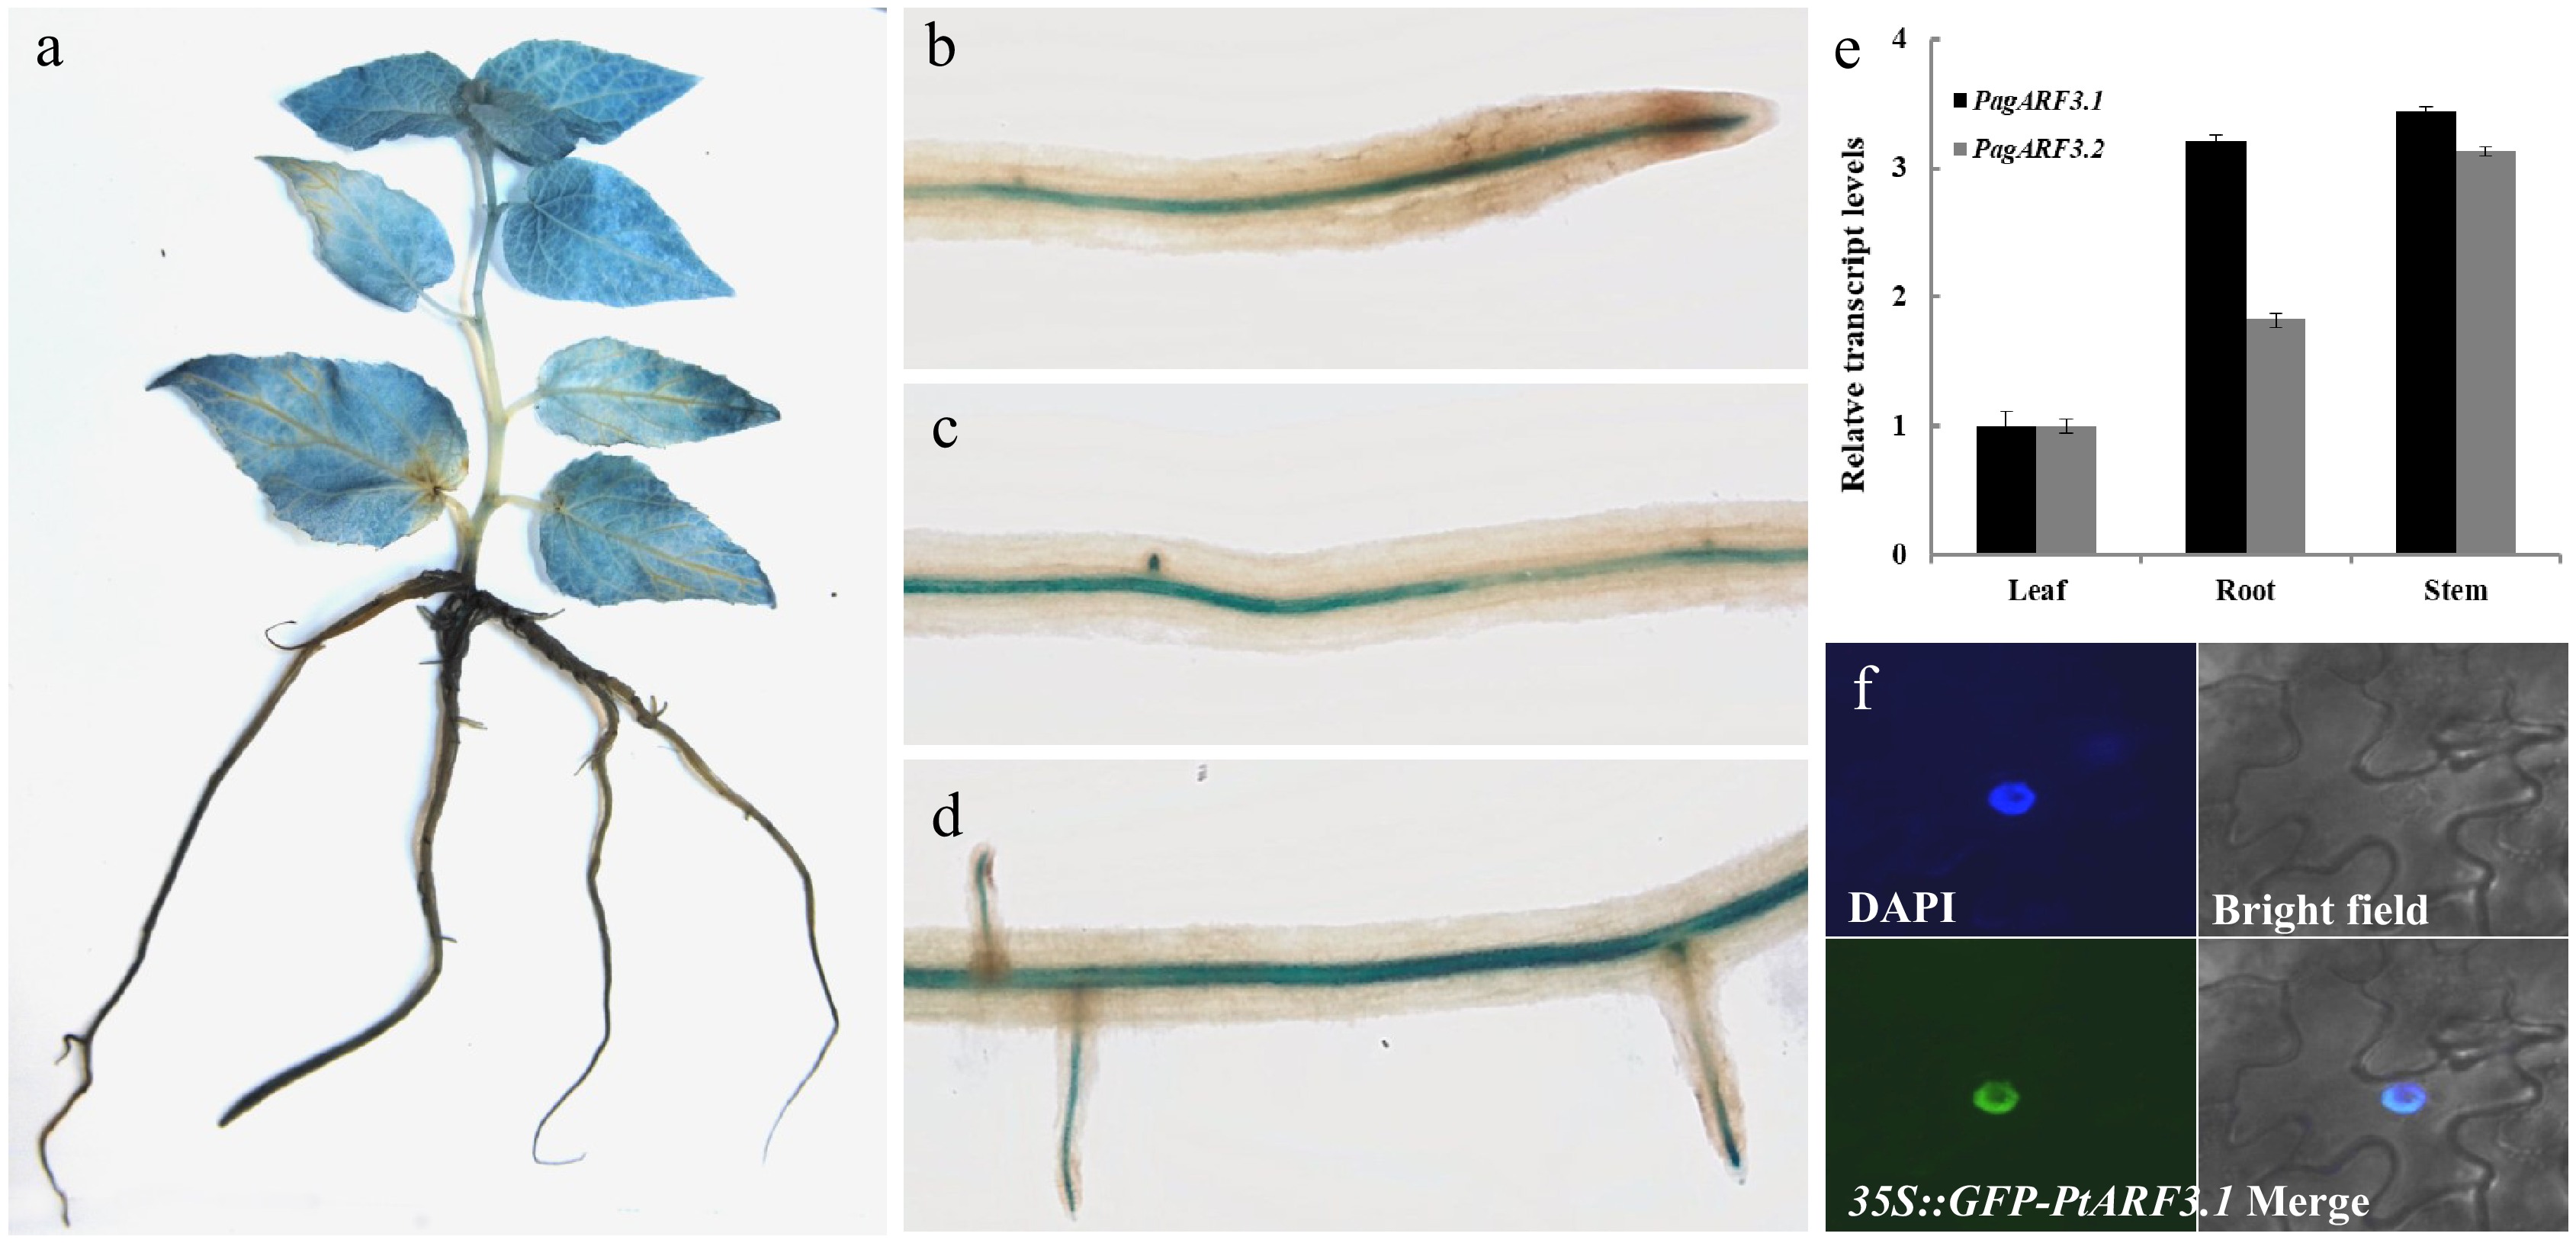
Figure 1.
Expression patterns and subcellular localization of PagARF3.1. GUS-staining assays of PagARF3.1 in (a) 3-week-old sapling and (b)−(d) root. (e) The expression of PagARF3.1 in roots, leaf, and stem. (f) The nuclear localization of PagARF3.1.
-
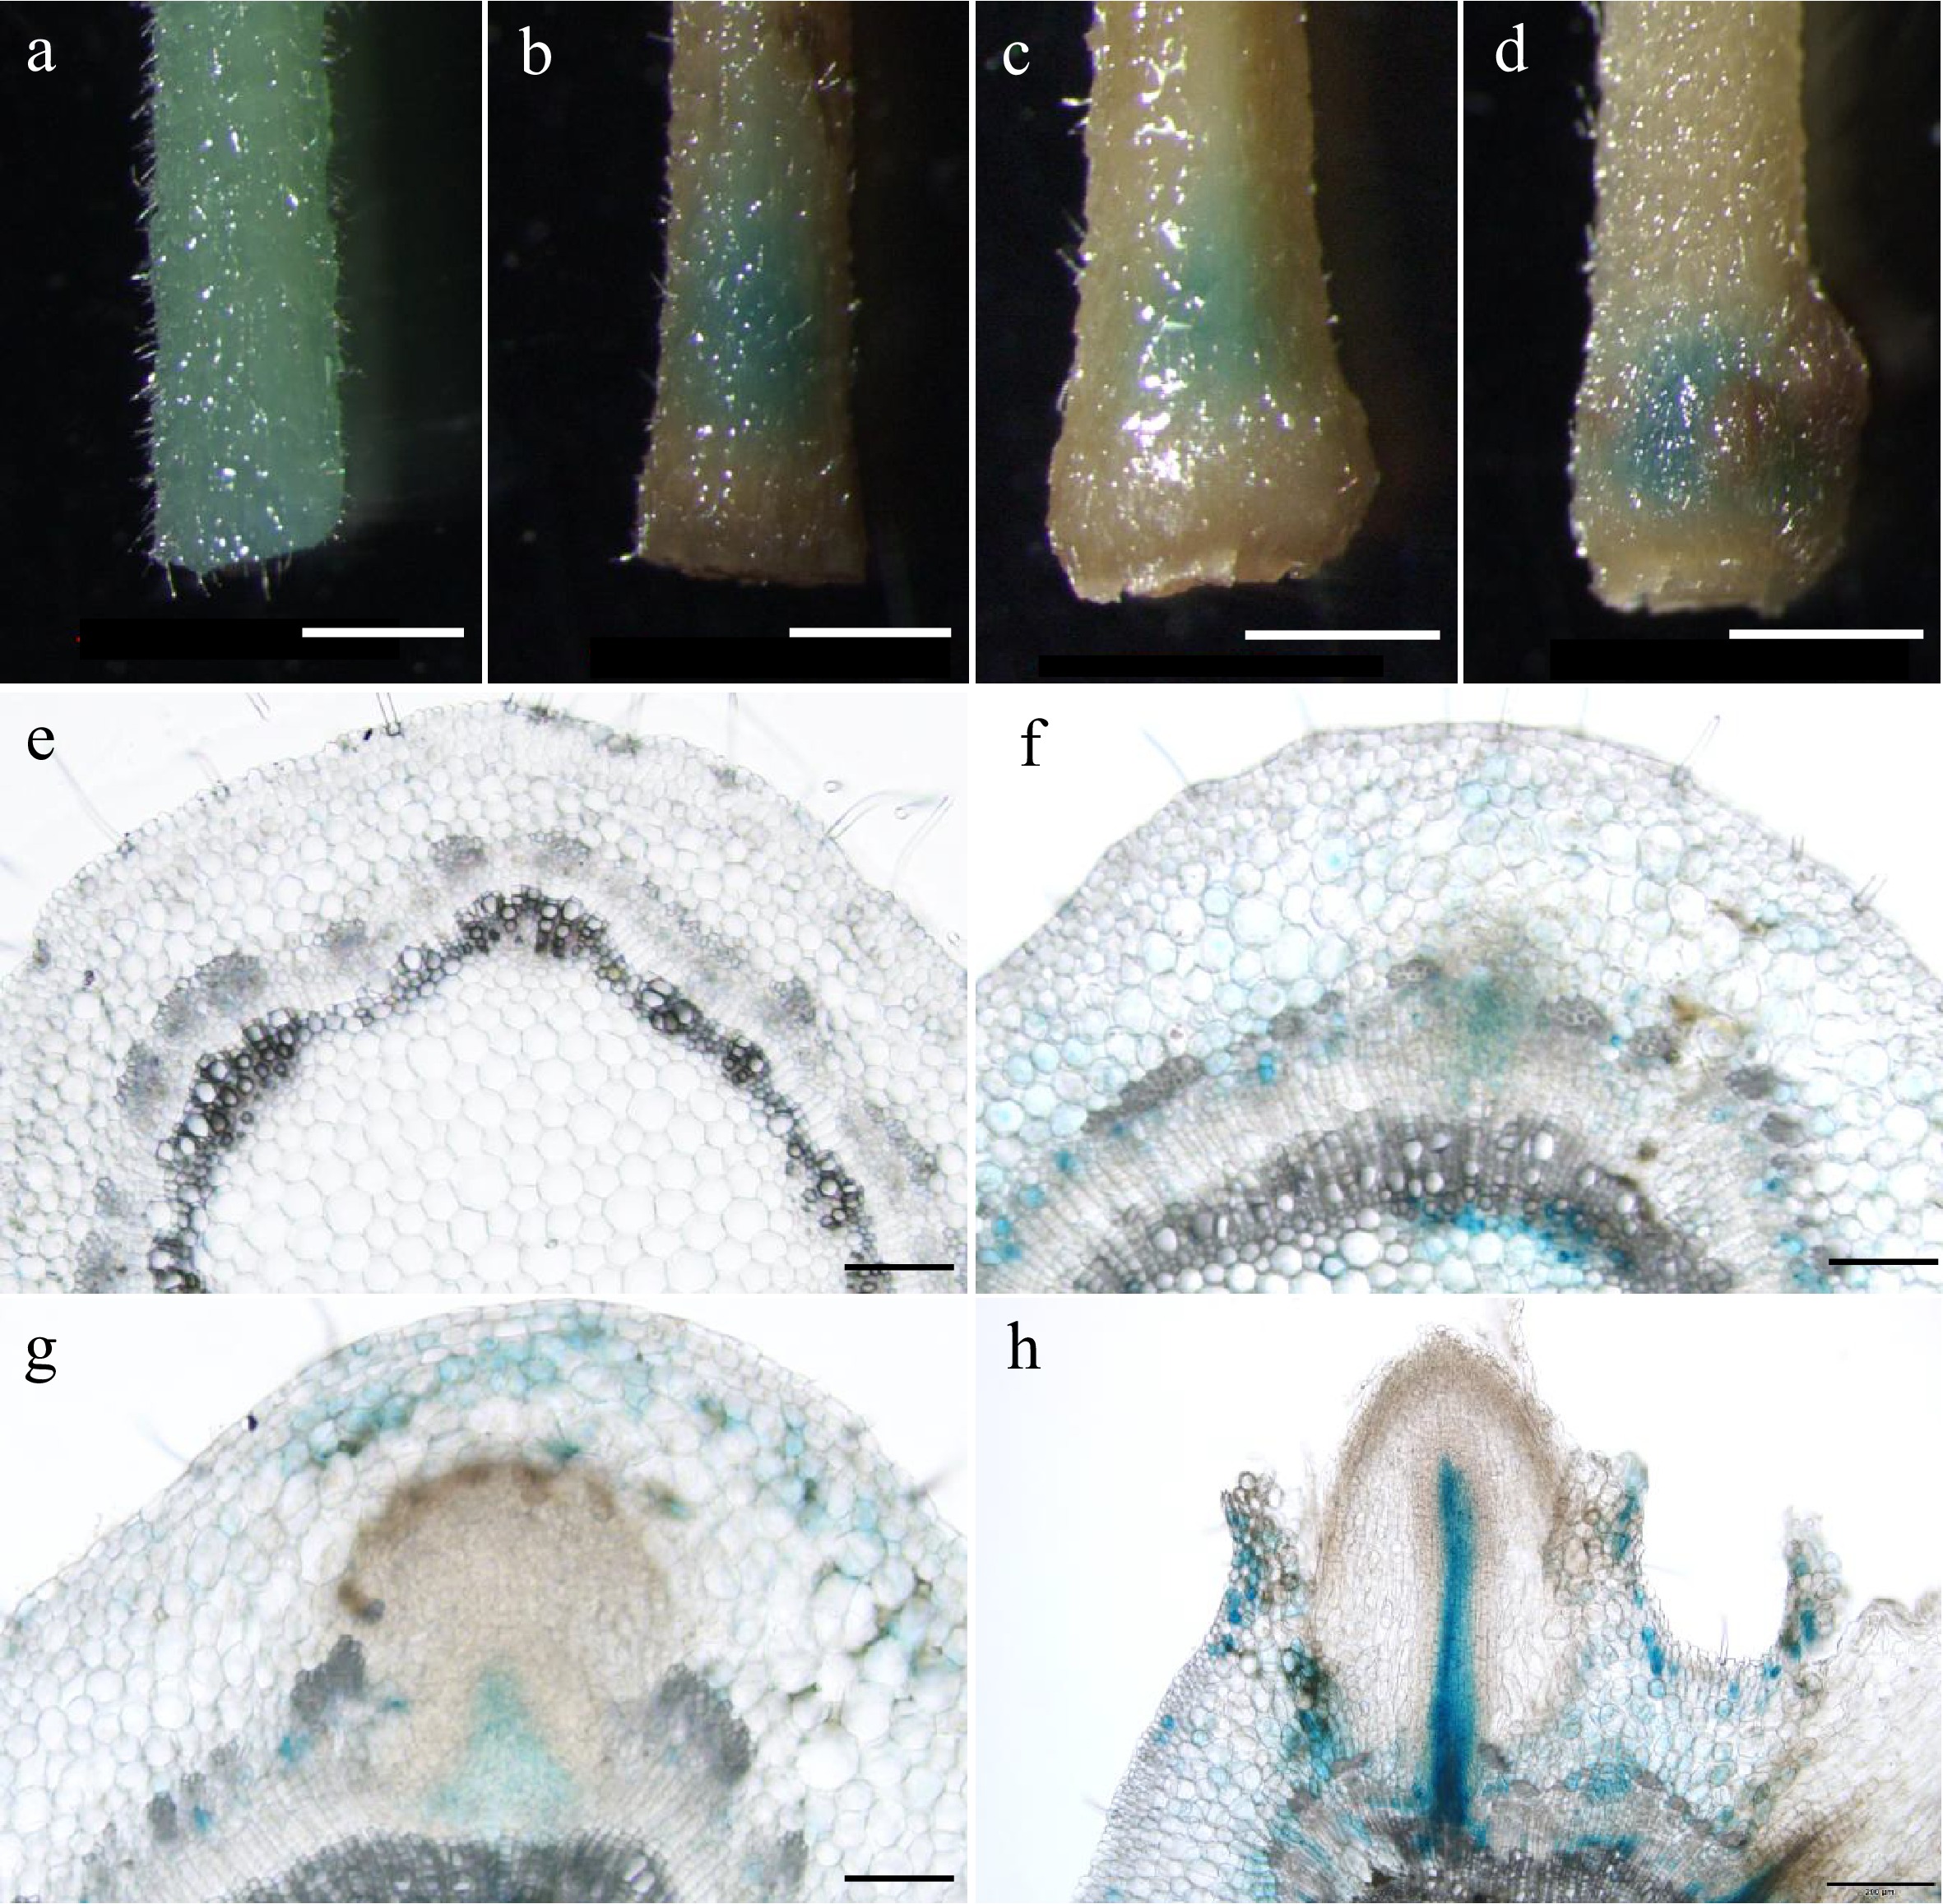
Figure 2.
Expression patterns of PagARF3.1 during AR formation. GUS staining of proPagARF3.1::GUS (a)−(d) leafy stems, and their (e)−(h) transverse sections; the samples were collected at (a), (e) 0 d, (b), (f) 3 d, (c), (g) 4 d, (d), (h) 6 d. Scale bars: (a)−(d) 1 mm; (e)−(g) 50 µm; (h), 200 µm
-
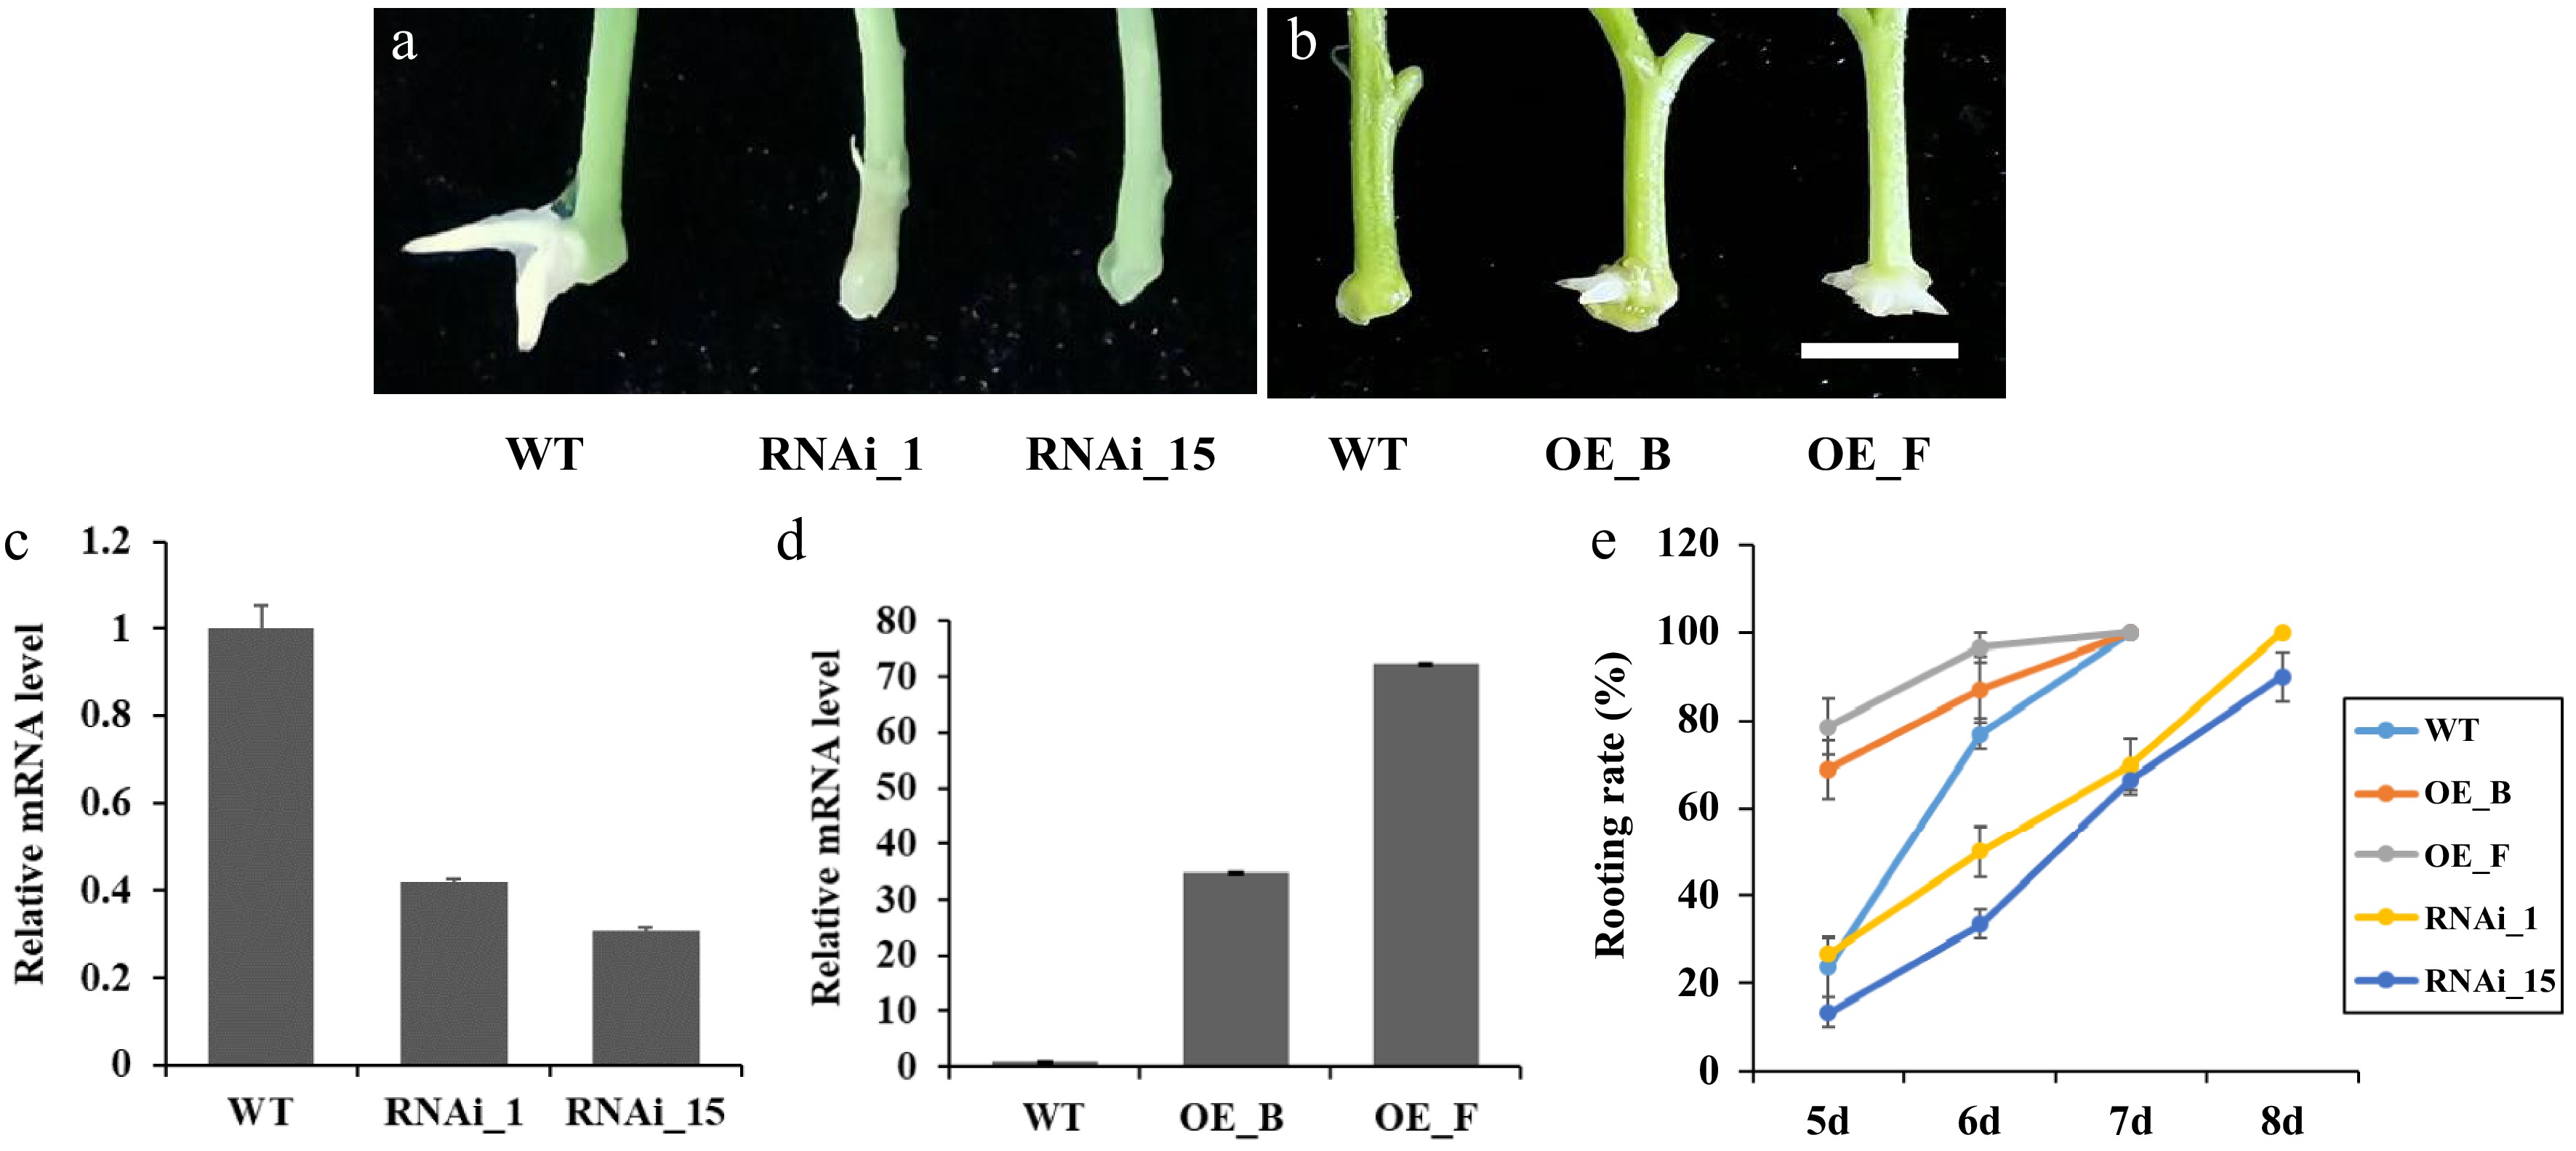
Figure 3.
Manipulation of PagARF3.1 expression affects the AR development of transgenic poplar. (a) Representative images of the AR formation of WT and RNAi_1 and RNAi_15 after 7 d excision. (b) Representative images of the AR formation of WT and OE_B and OE_F after 5 d excision. Bars = 5 mm. (c) RT-qPCR analysis of PagARF3.1 transcripts in the WT and overexpression lines. (d) RT-qPCR analysis of PagARF3.1 transcripts in the wild type and RNAi lines. (e) Rooting rates of wild type, OE, and RNAi lines.
-
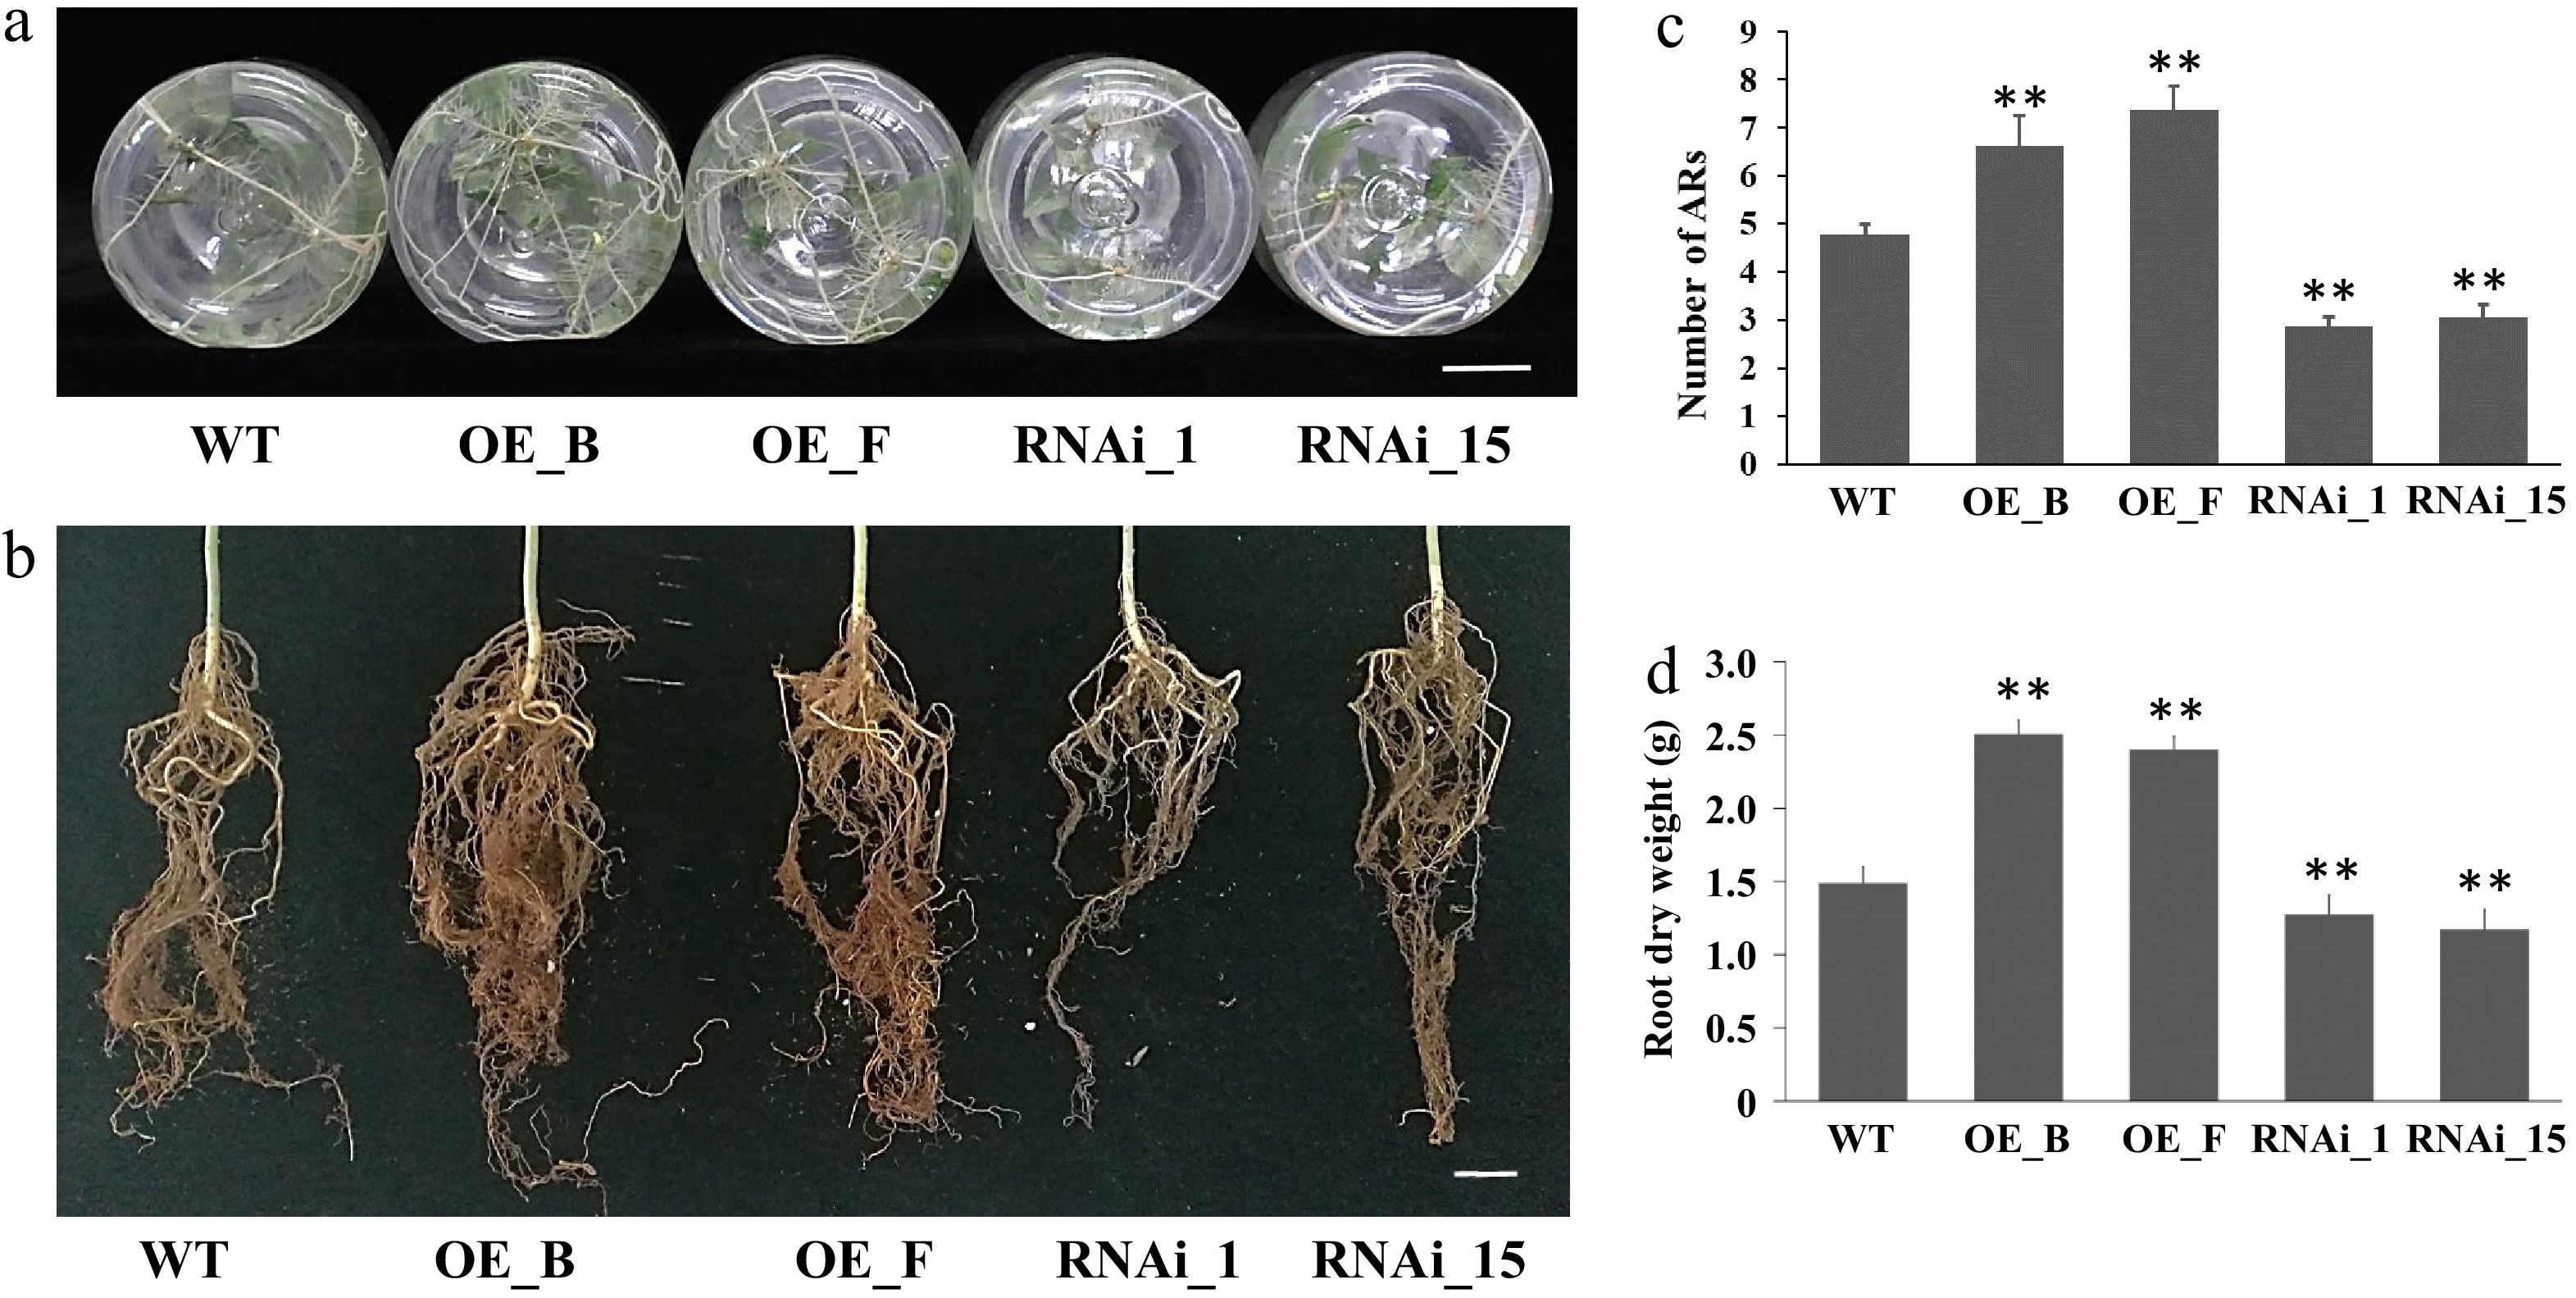
Figure 4.
ARs from leafy stems of PagARF3.1 RNAi lines, OE lines, and WT. (a) AR systems of WT, OE, and RNAi line after 4 weeks of transfer to rooting induction medium. (b) AR system from 3 month old plants in soil. (c) Number of adventitious roots per cutting in WT, OE, and RNAi line. (d) The dry weight of ARs from 3 month old plants. Bars = 2 cm. Significant differences between WT and transgenic lines are indicated with asterisks. Significance analysis was performed by Student's t-test (** p < 0.01).
-
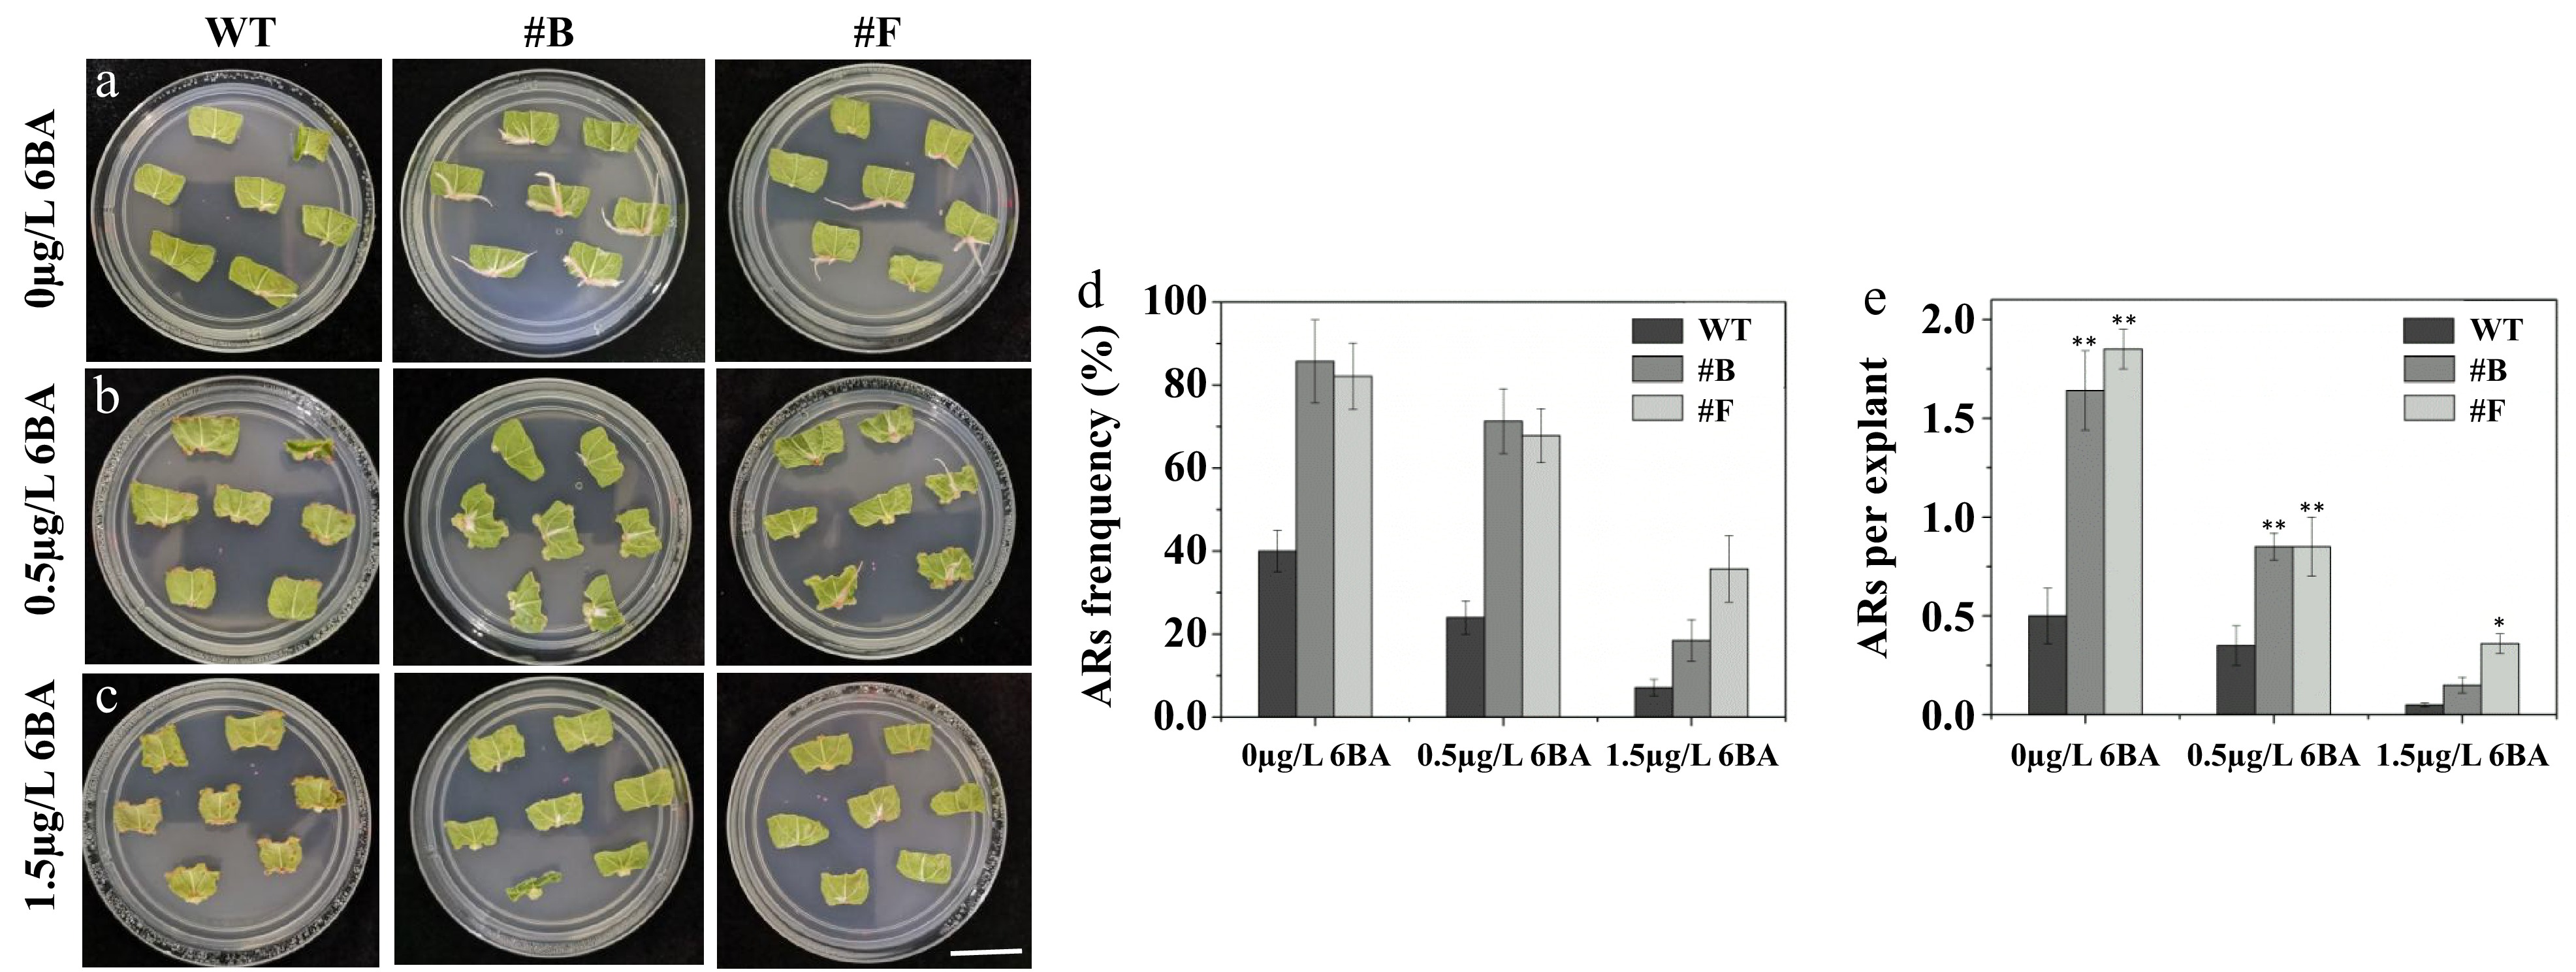
Figure 5.
PagARF3.1 promotes AR formation via the cytokinin pathway. Comparison of AR formation from leaf explants between the WT and the overexpression line (#B, #F) of PagARF3.1 treated with (a) 0 µg/L 6-BA, (b) 0.5 µg/L 6-BA. (c) 1.5 µg/L 6-BA. Comparison of (d) AR formation frequency, and (e) the numbers of AR. Significance analysis was performed by Student's t-test (* p < 0.05 and ** p < 0.01). Bar = 2 cm.
-
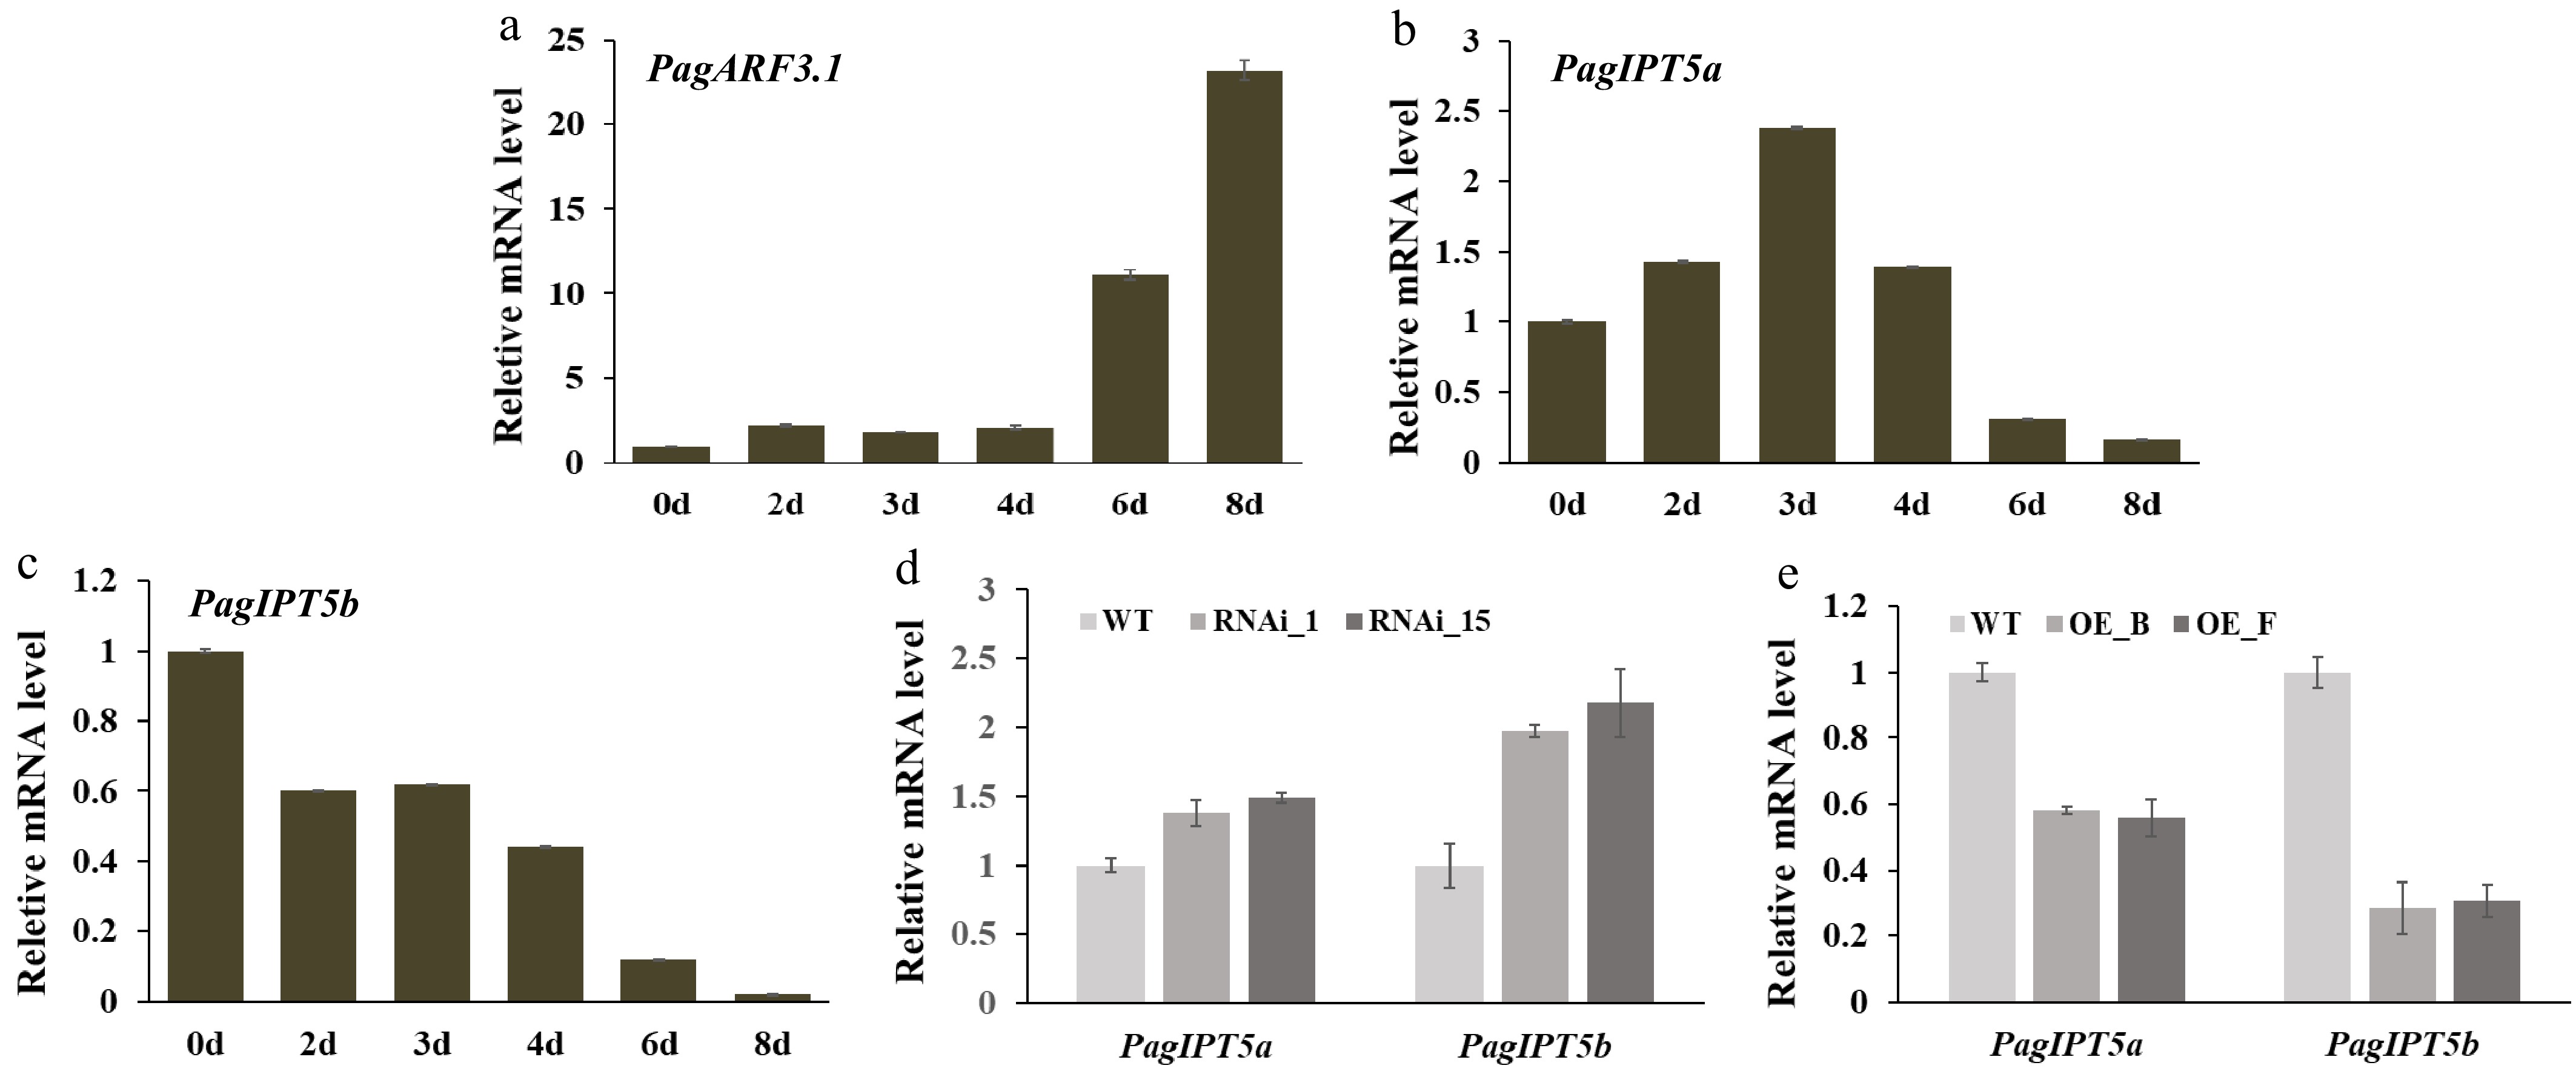
Figure 6.
PagARF3.1 negatively regulates PagIPT5a and PagIPT5b expression. (a)−(c) RT-qPCR analysis of PagARF3.1, PagIPT5a, and PagIPT5b during AR induction. (d), (e) PagIPT5a and PagIPT5b expression levels in PagARF3.1 RNAi and OE lines.
-
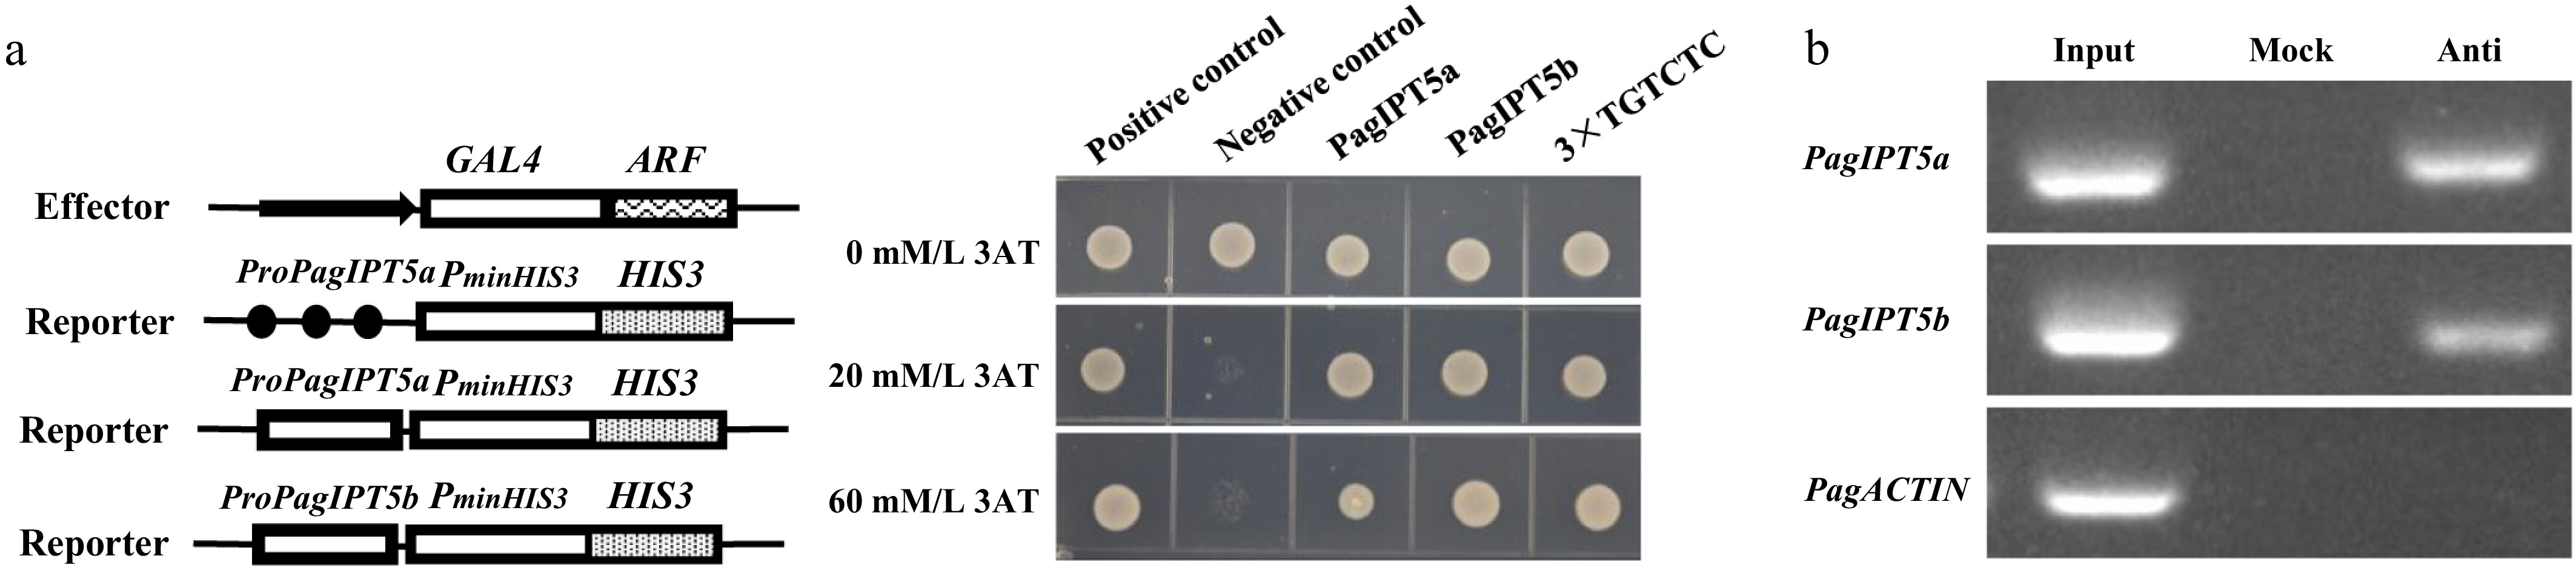
Figure 7.
PagARF3.1 directly binds to the promoters of PagIPT5a and PagIPT5b. (a) Yeast one-hybrid analysis, and (b) ChIP-PCR analyses showed that PagARF3.1 can directly bind to the PagIPT5a and PagIPT5b promoters. Input, chromatin preparation before immunoprecipitation. Mock, immunoprecipitated without anti-FLAG antibody. Anti, immunoprecipitated with anti-FLAG antibody.
Figures
(7)
Tables
(0)