-
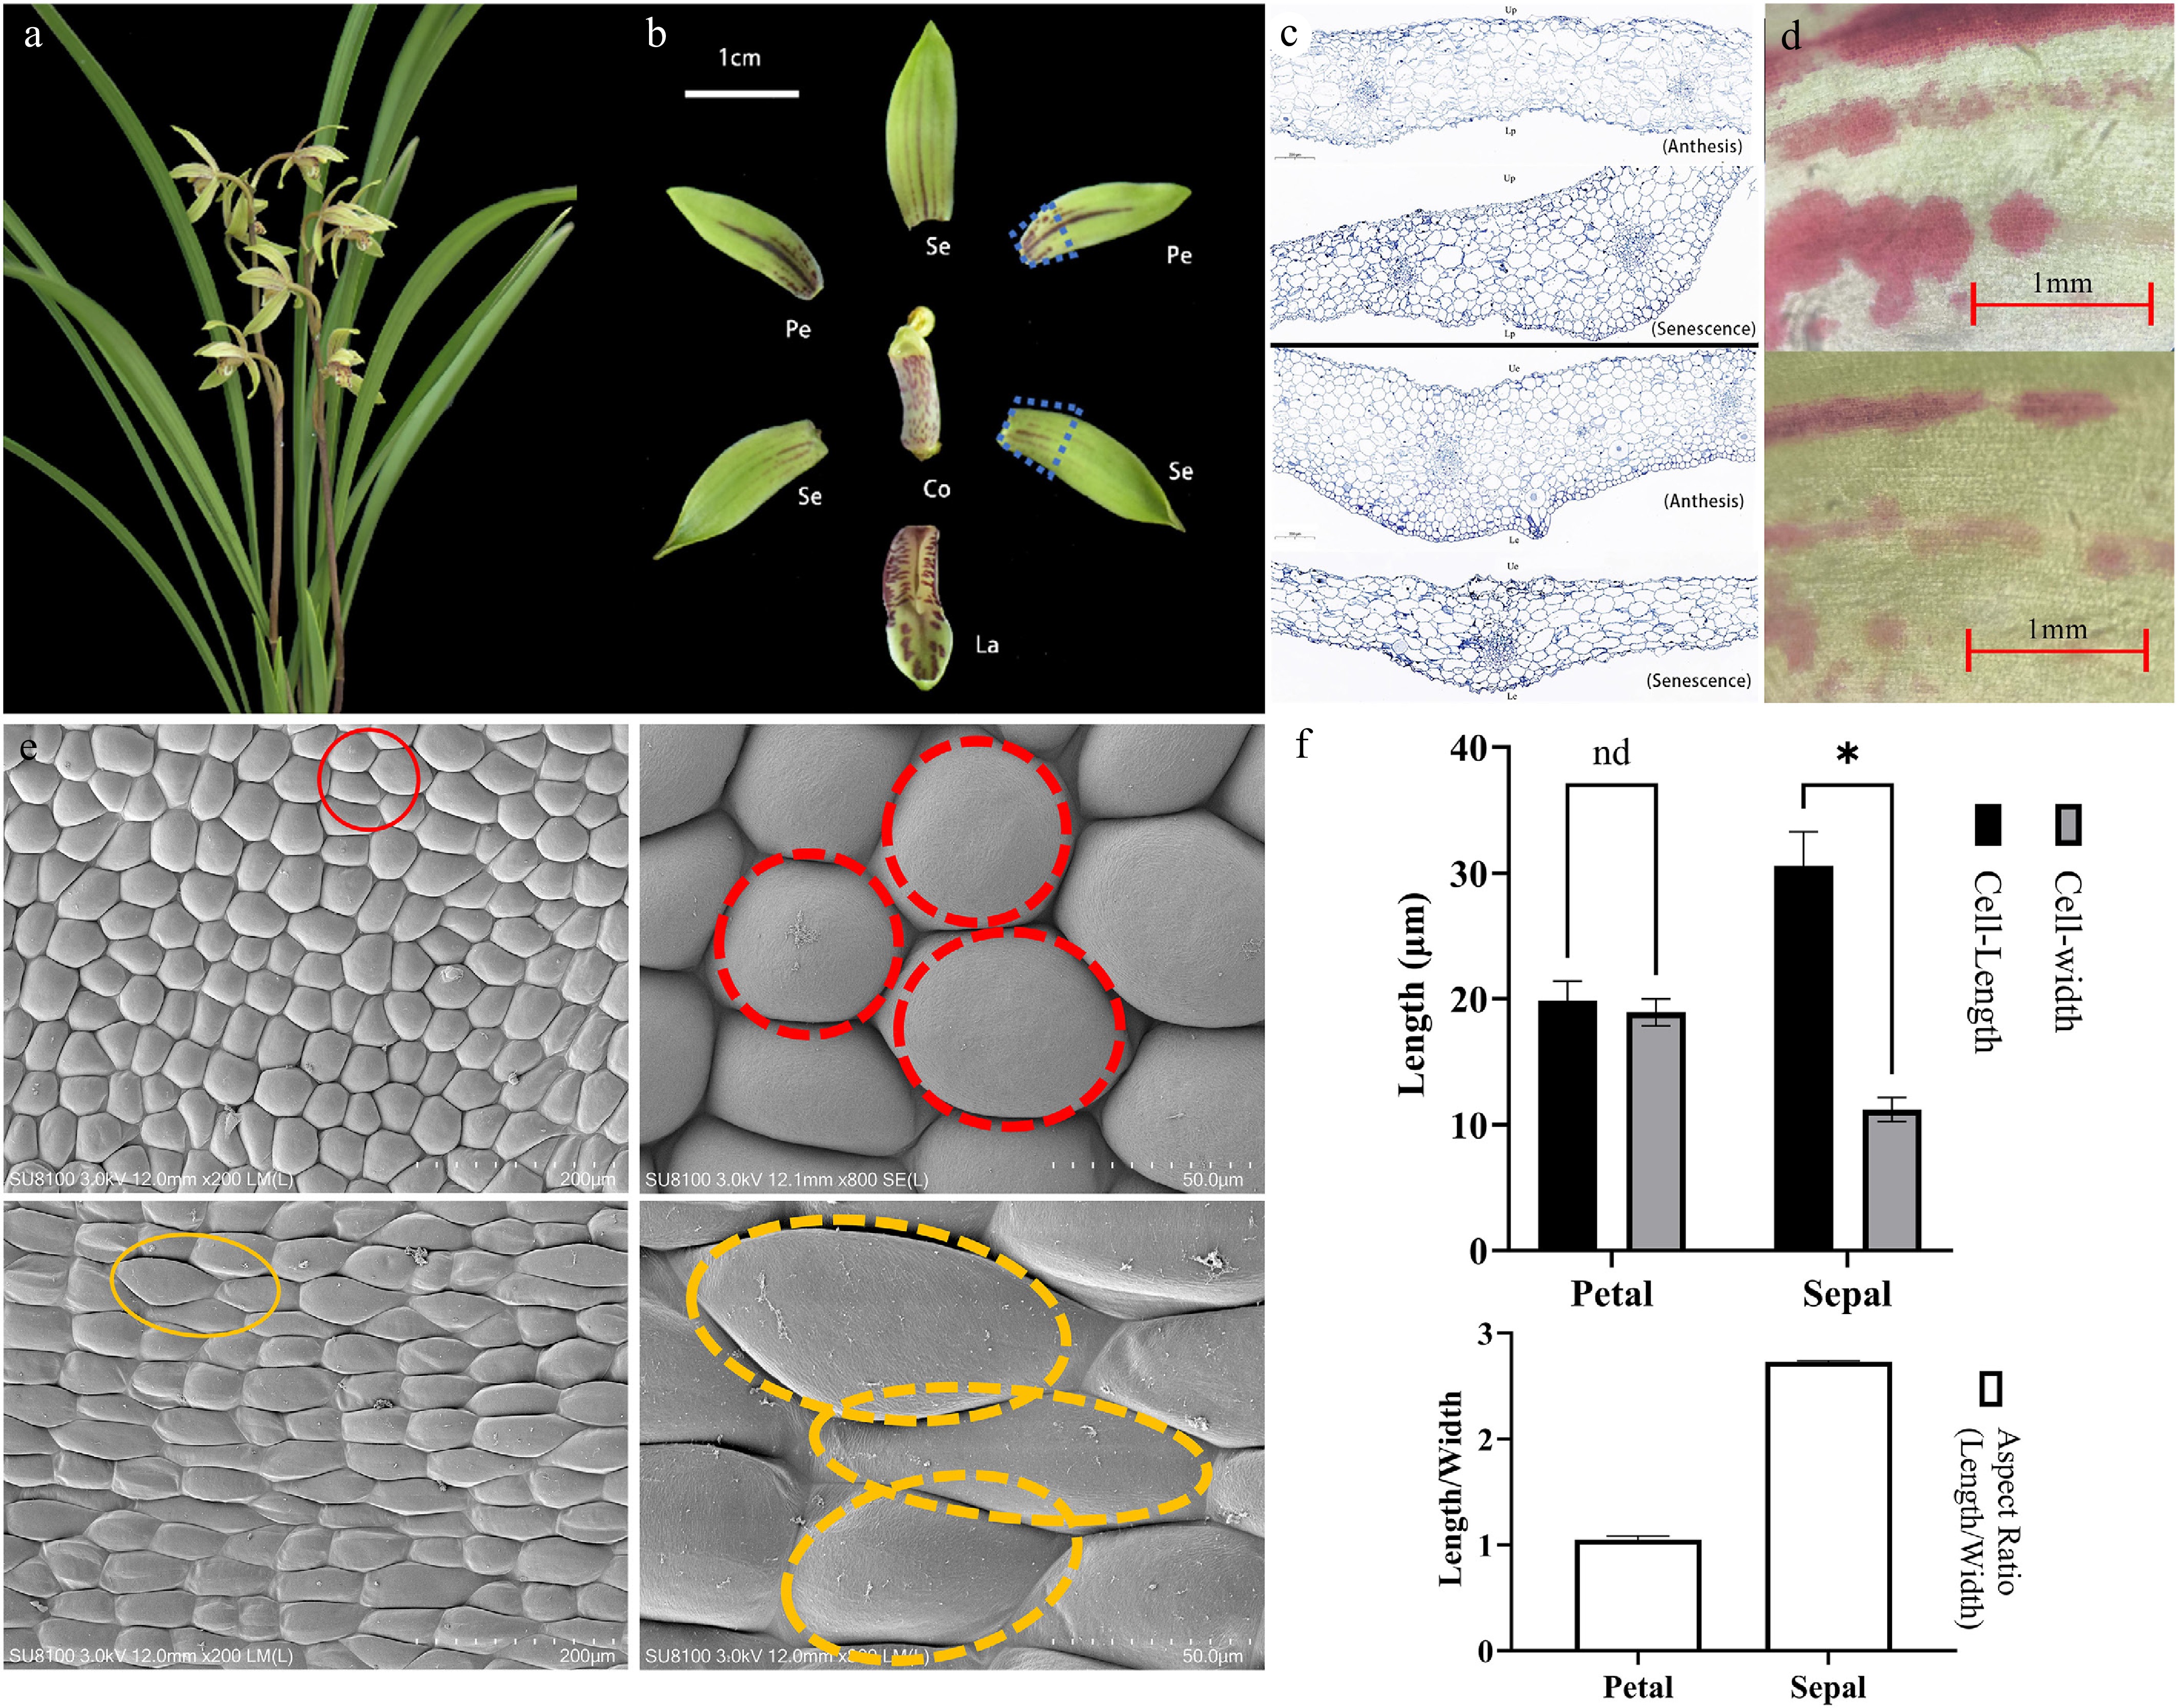
Figure 1.
Microscopic observations of floral structures during the full bloom period of C. ensifolium. (a) Fully bloomed flowers. (b) Characteristics of different floral parts. Se, sepal; Pe, petal; La, labellum; Co, column. (c) Longitudinal structural diagram of petals and sepals. (d) Pigment distribution on the epidermis of sepals and petals at anthesis and senescence stages, visualized by light microscopy. (e) Scanning electron microscopy (SEM) images of petal and sepal epidermal cells. The red and yellow circles indicate typical polygonal cells and elongated cells, respectively. (f) Quantitative analysis of cell size in petal and sepal epidermis. Asterisks indicate statistically significant differences (*, p < 0.0001).
-
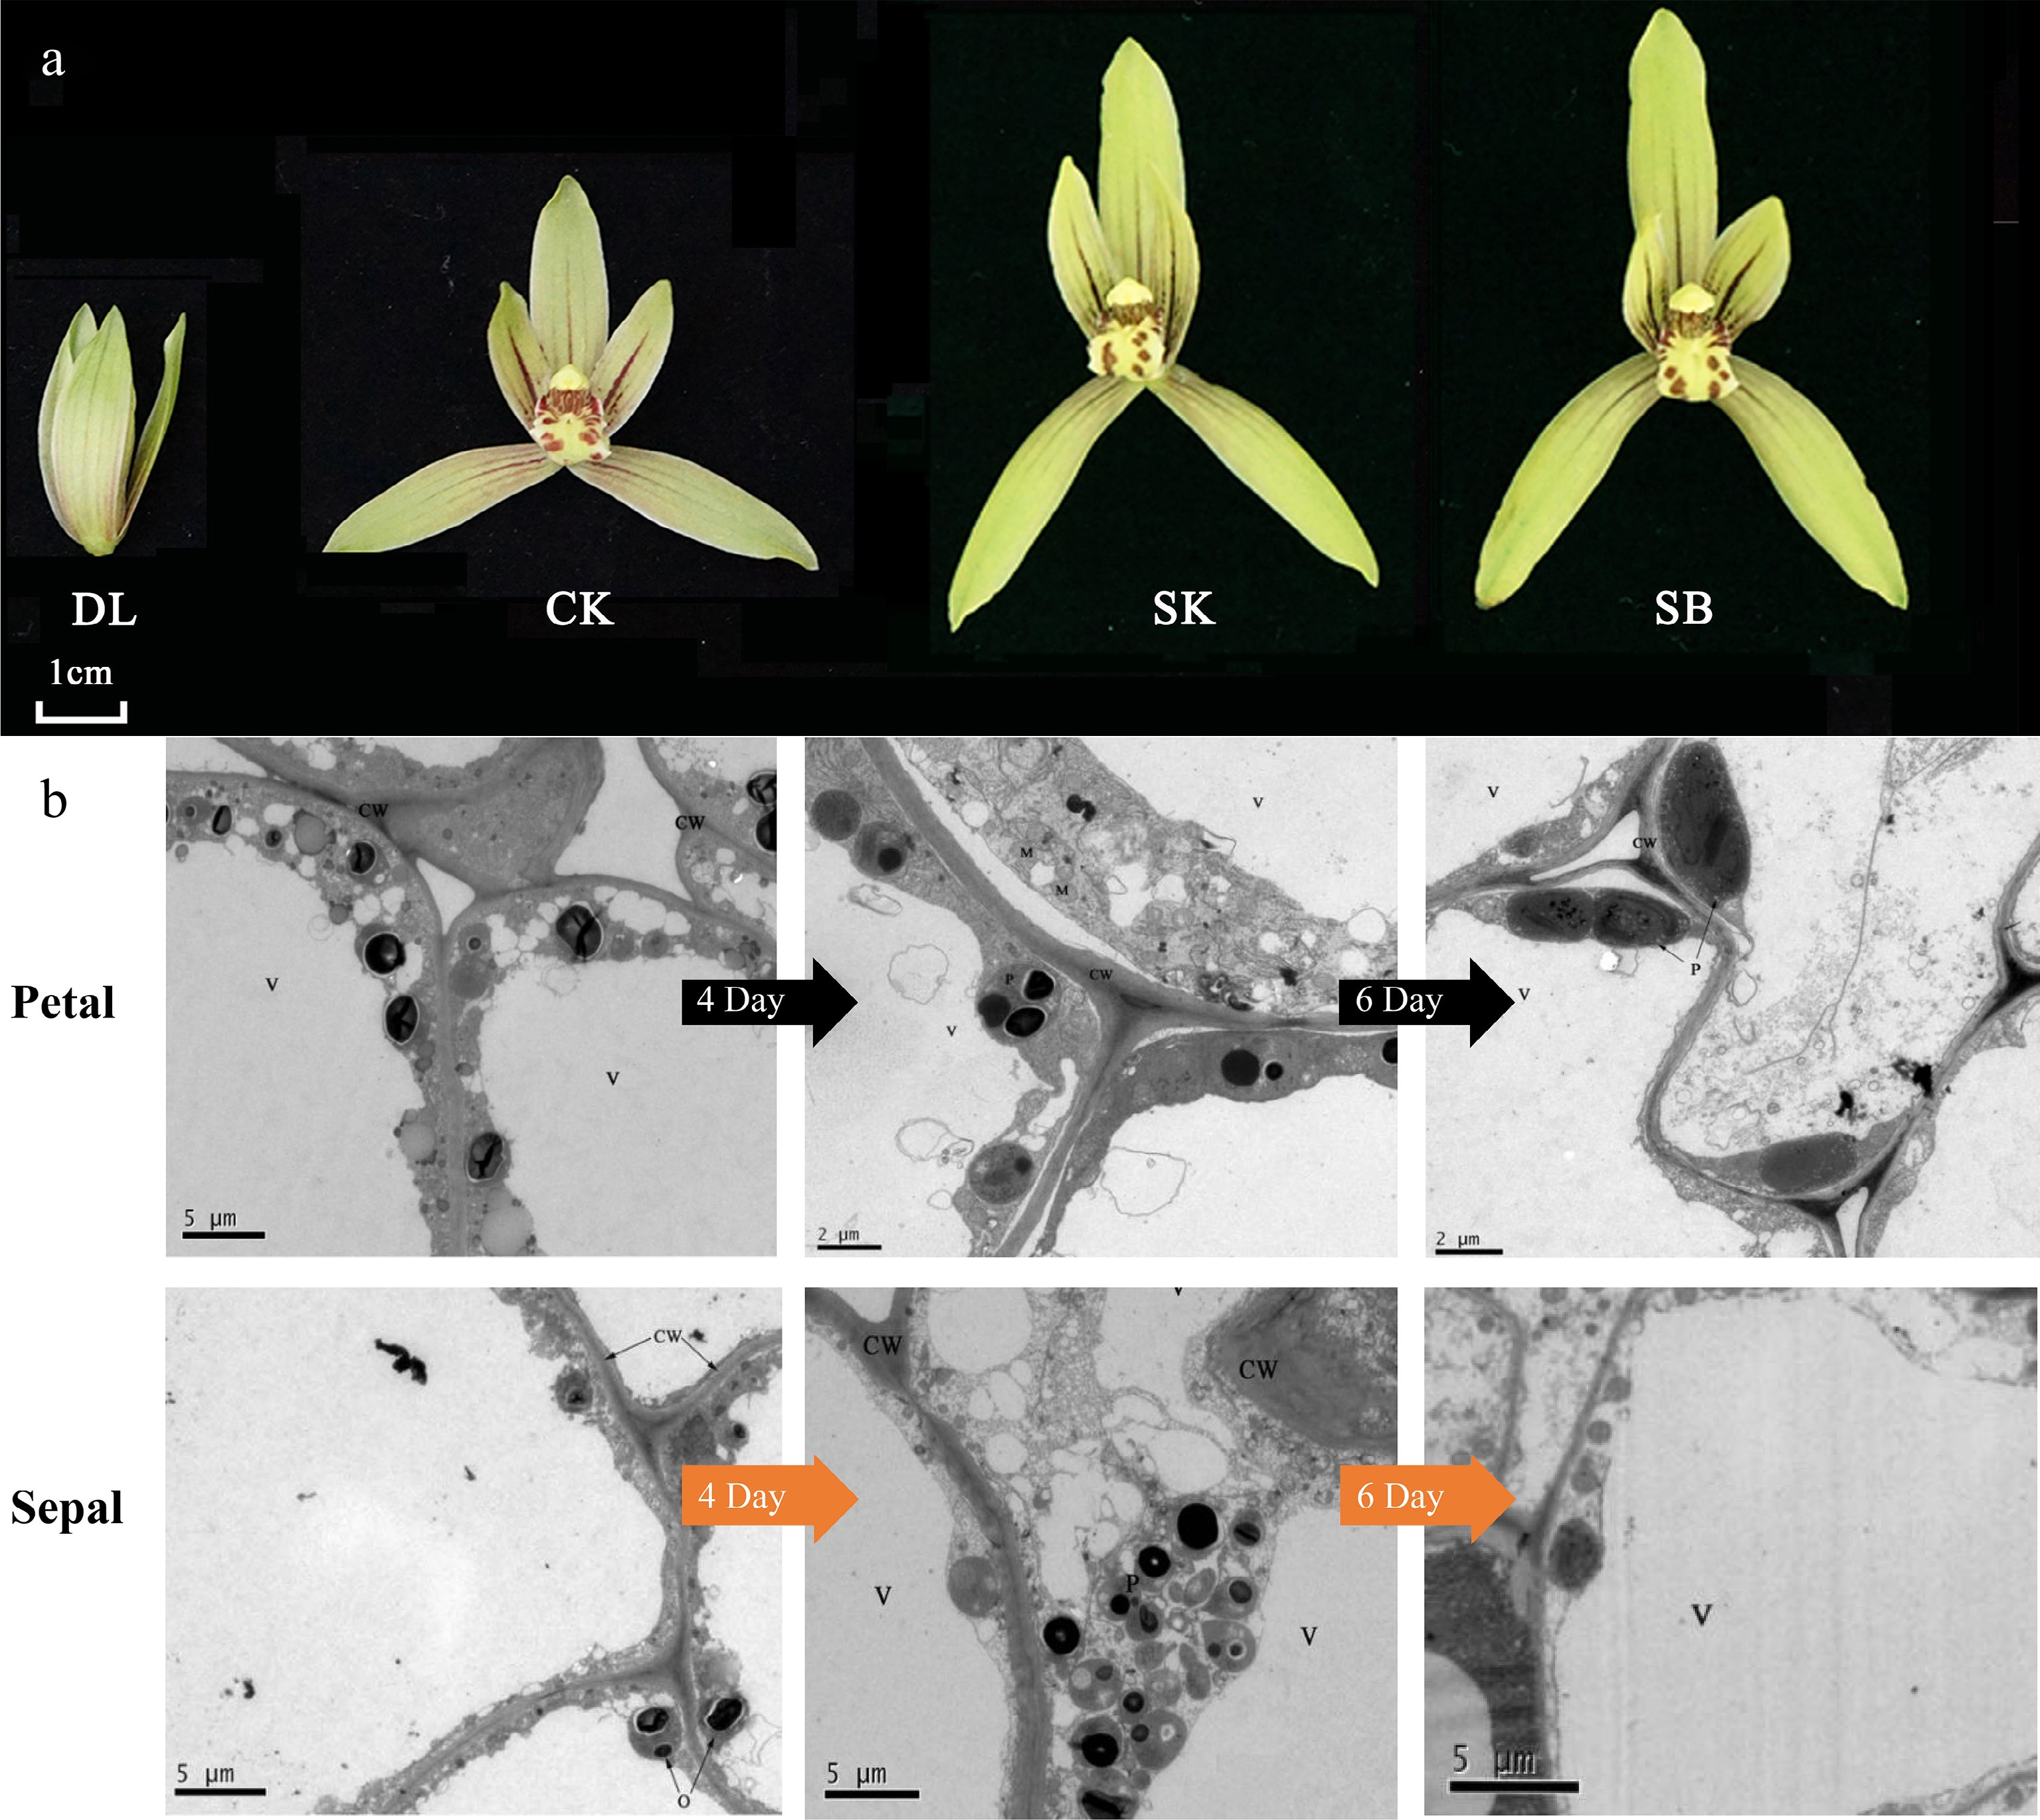
Figure 2.
Developmental stages and ultrastructural characteristics of floral epidermal cells in C. ensifolium. (a) The nine blooming stages of C. ensifolium. DL (bud stage), CK (initial blooming, day 0), SK (full bloom, day 4), and SB (senescence stage, day 10). (b) Ultrastructural features of sepal and petal epidermal cells at different flowering stages. 4D and 6D refer to flowers that have been open for 4 d and 6 d, respectively. CW: cell wall; V: vacuole; P: plastid; M: mitochondrion.
-
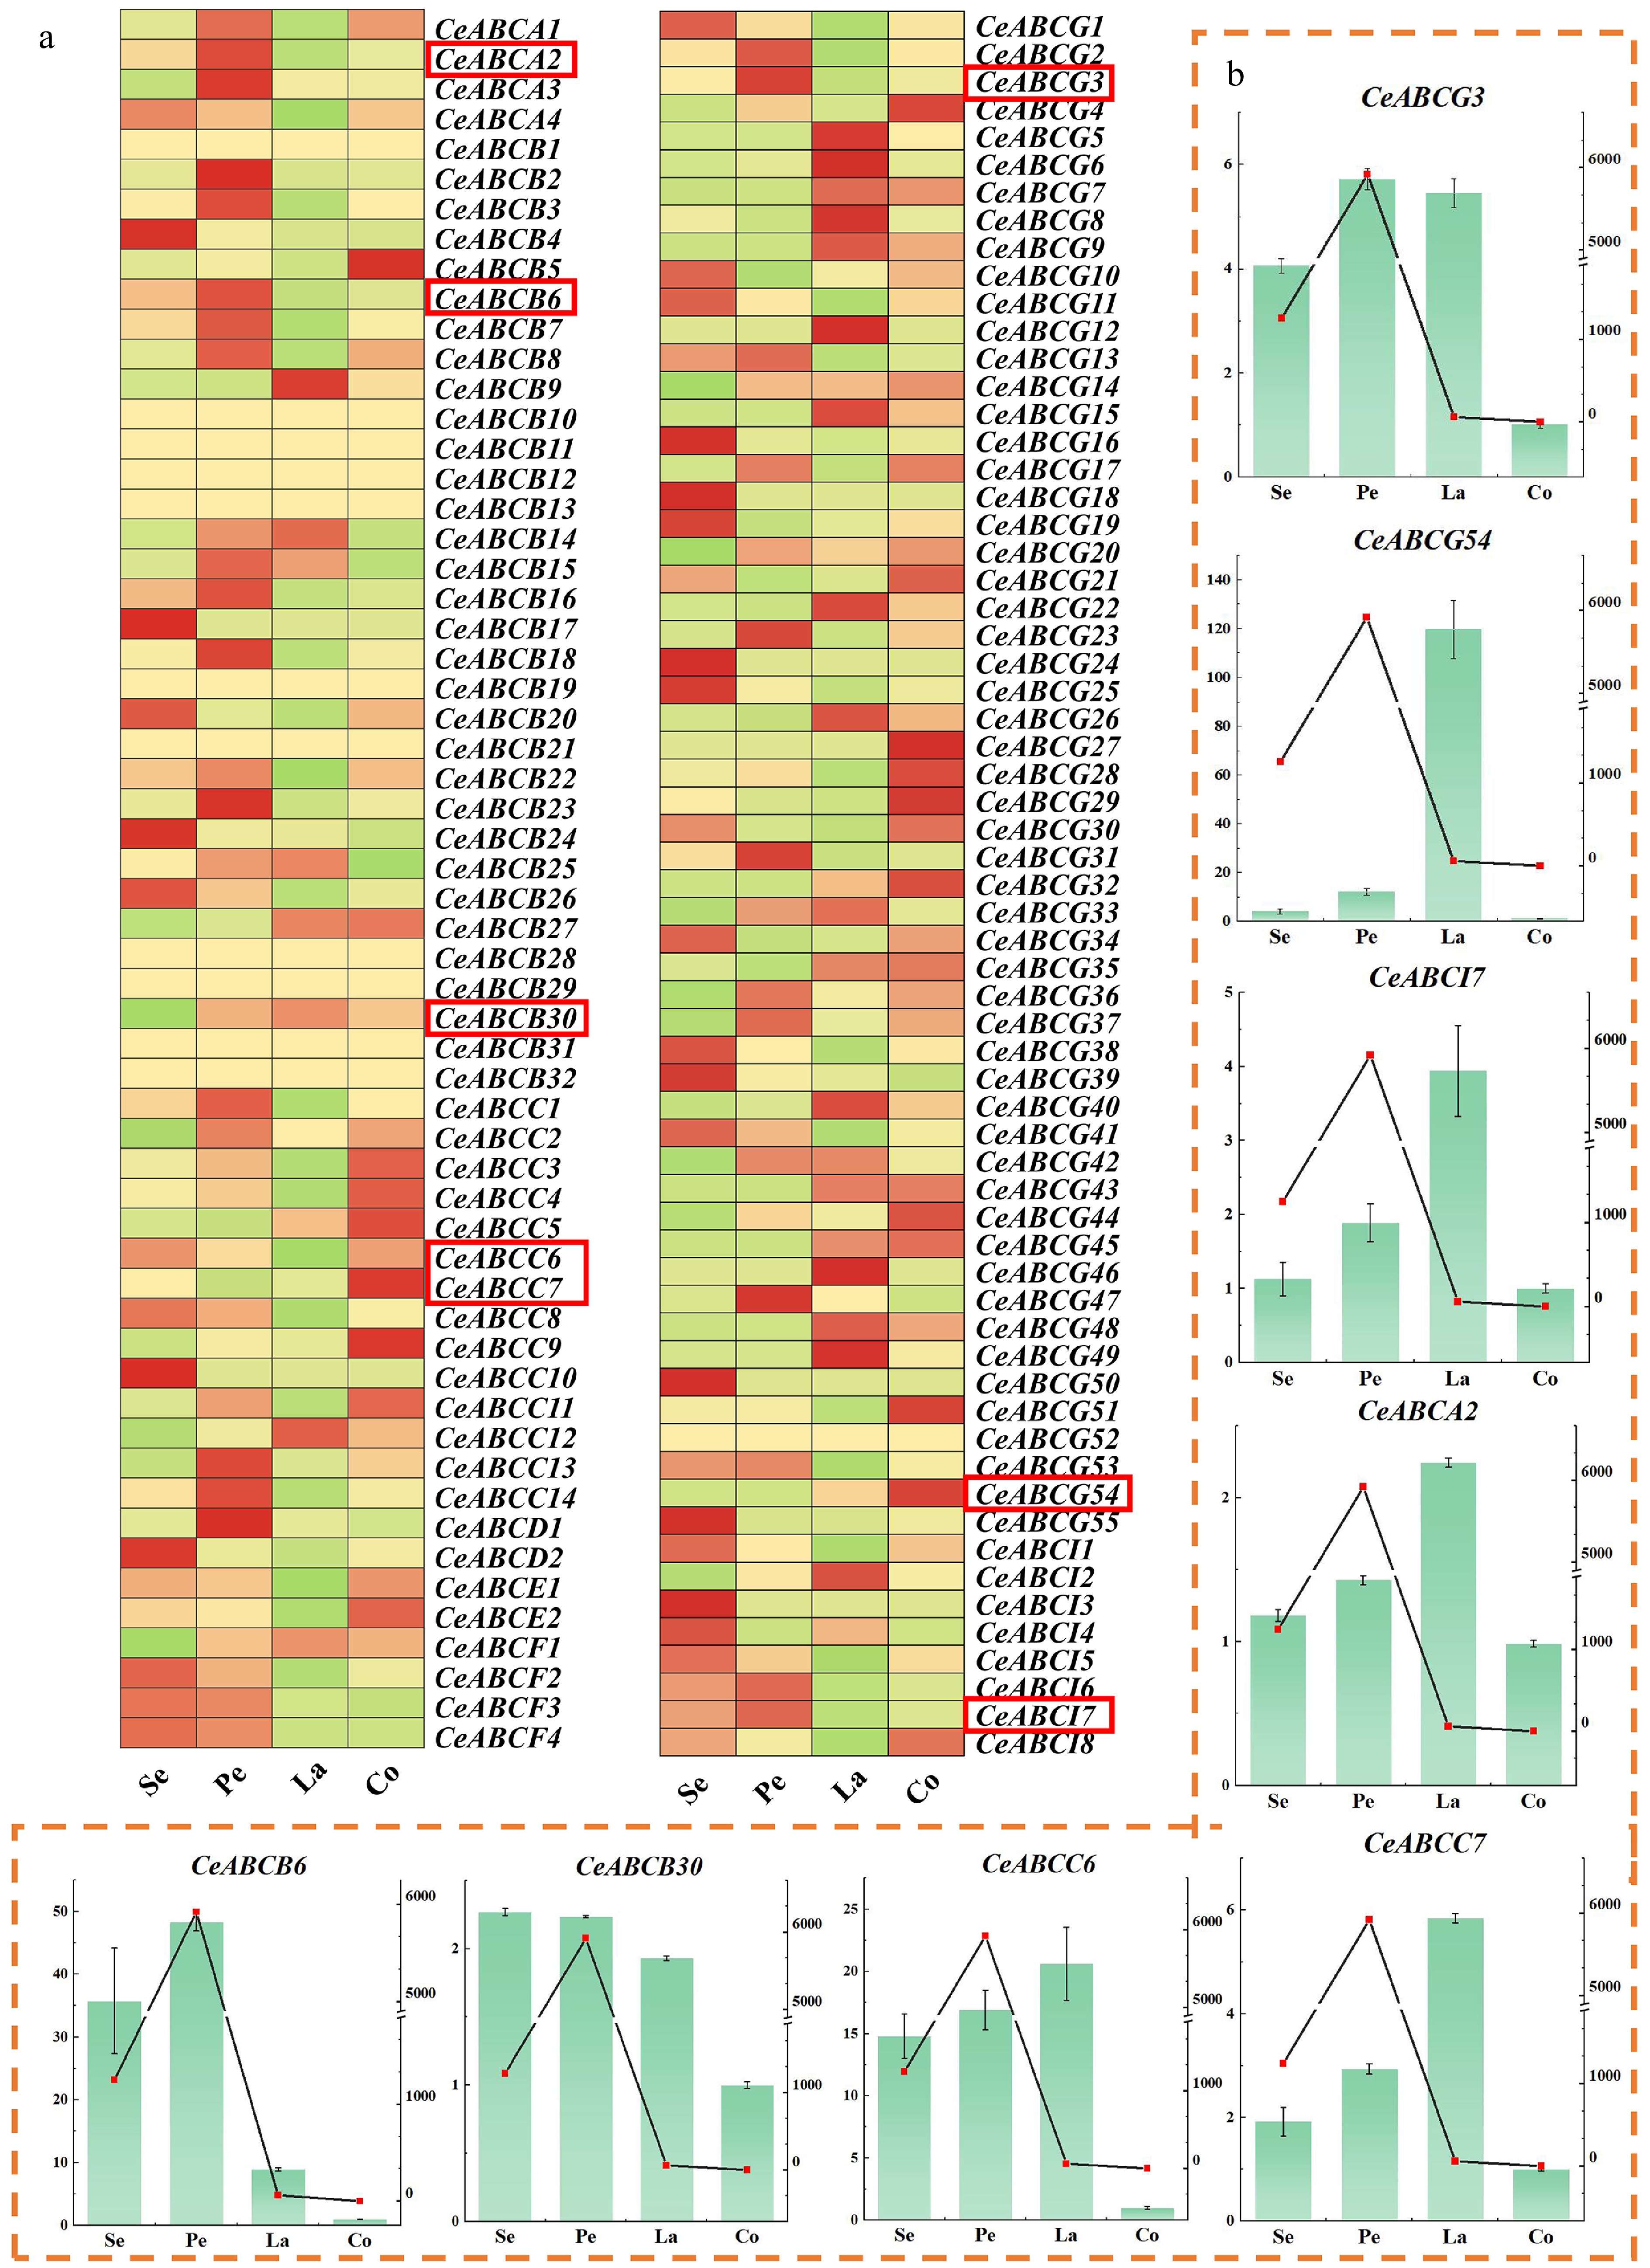
Figure 3.
Analysis of gene expression in different organs of flowers during the full bloom stage. (a) Transcriptional expression of the CeABCs gene in different parts during the blooming period of C. ensifolium in the transcriptome. Se, sepal; Pe, petal; La, labellum; Co, column. (b) The relative expression levels of genes in different parts of C. ensifolium were measured. The coordinates on the left and the bar chart indicate the multiple expressions of the gene relative to Co (column). The coordinates on the right and the line graph indicate the release of MeJA in that part.
-
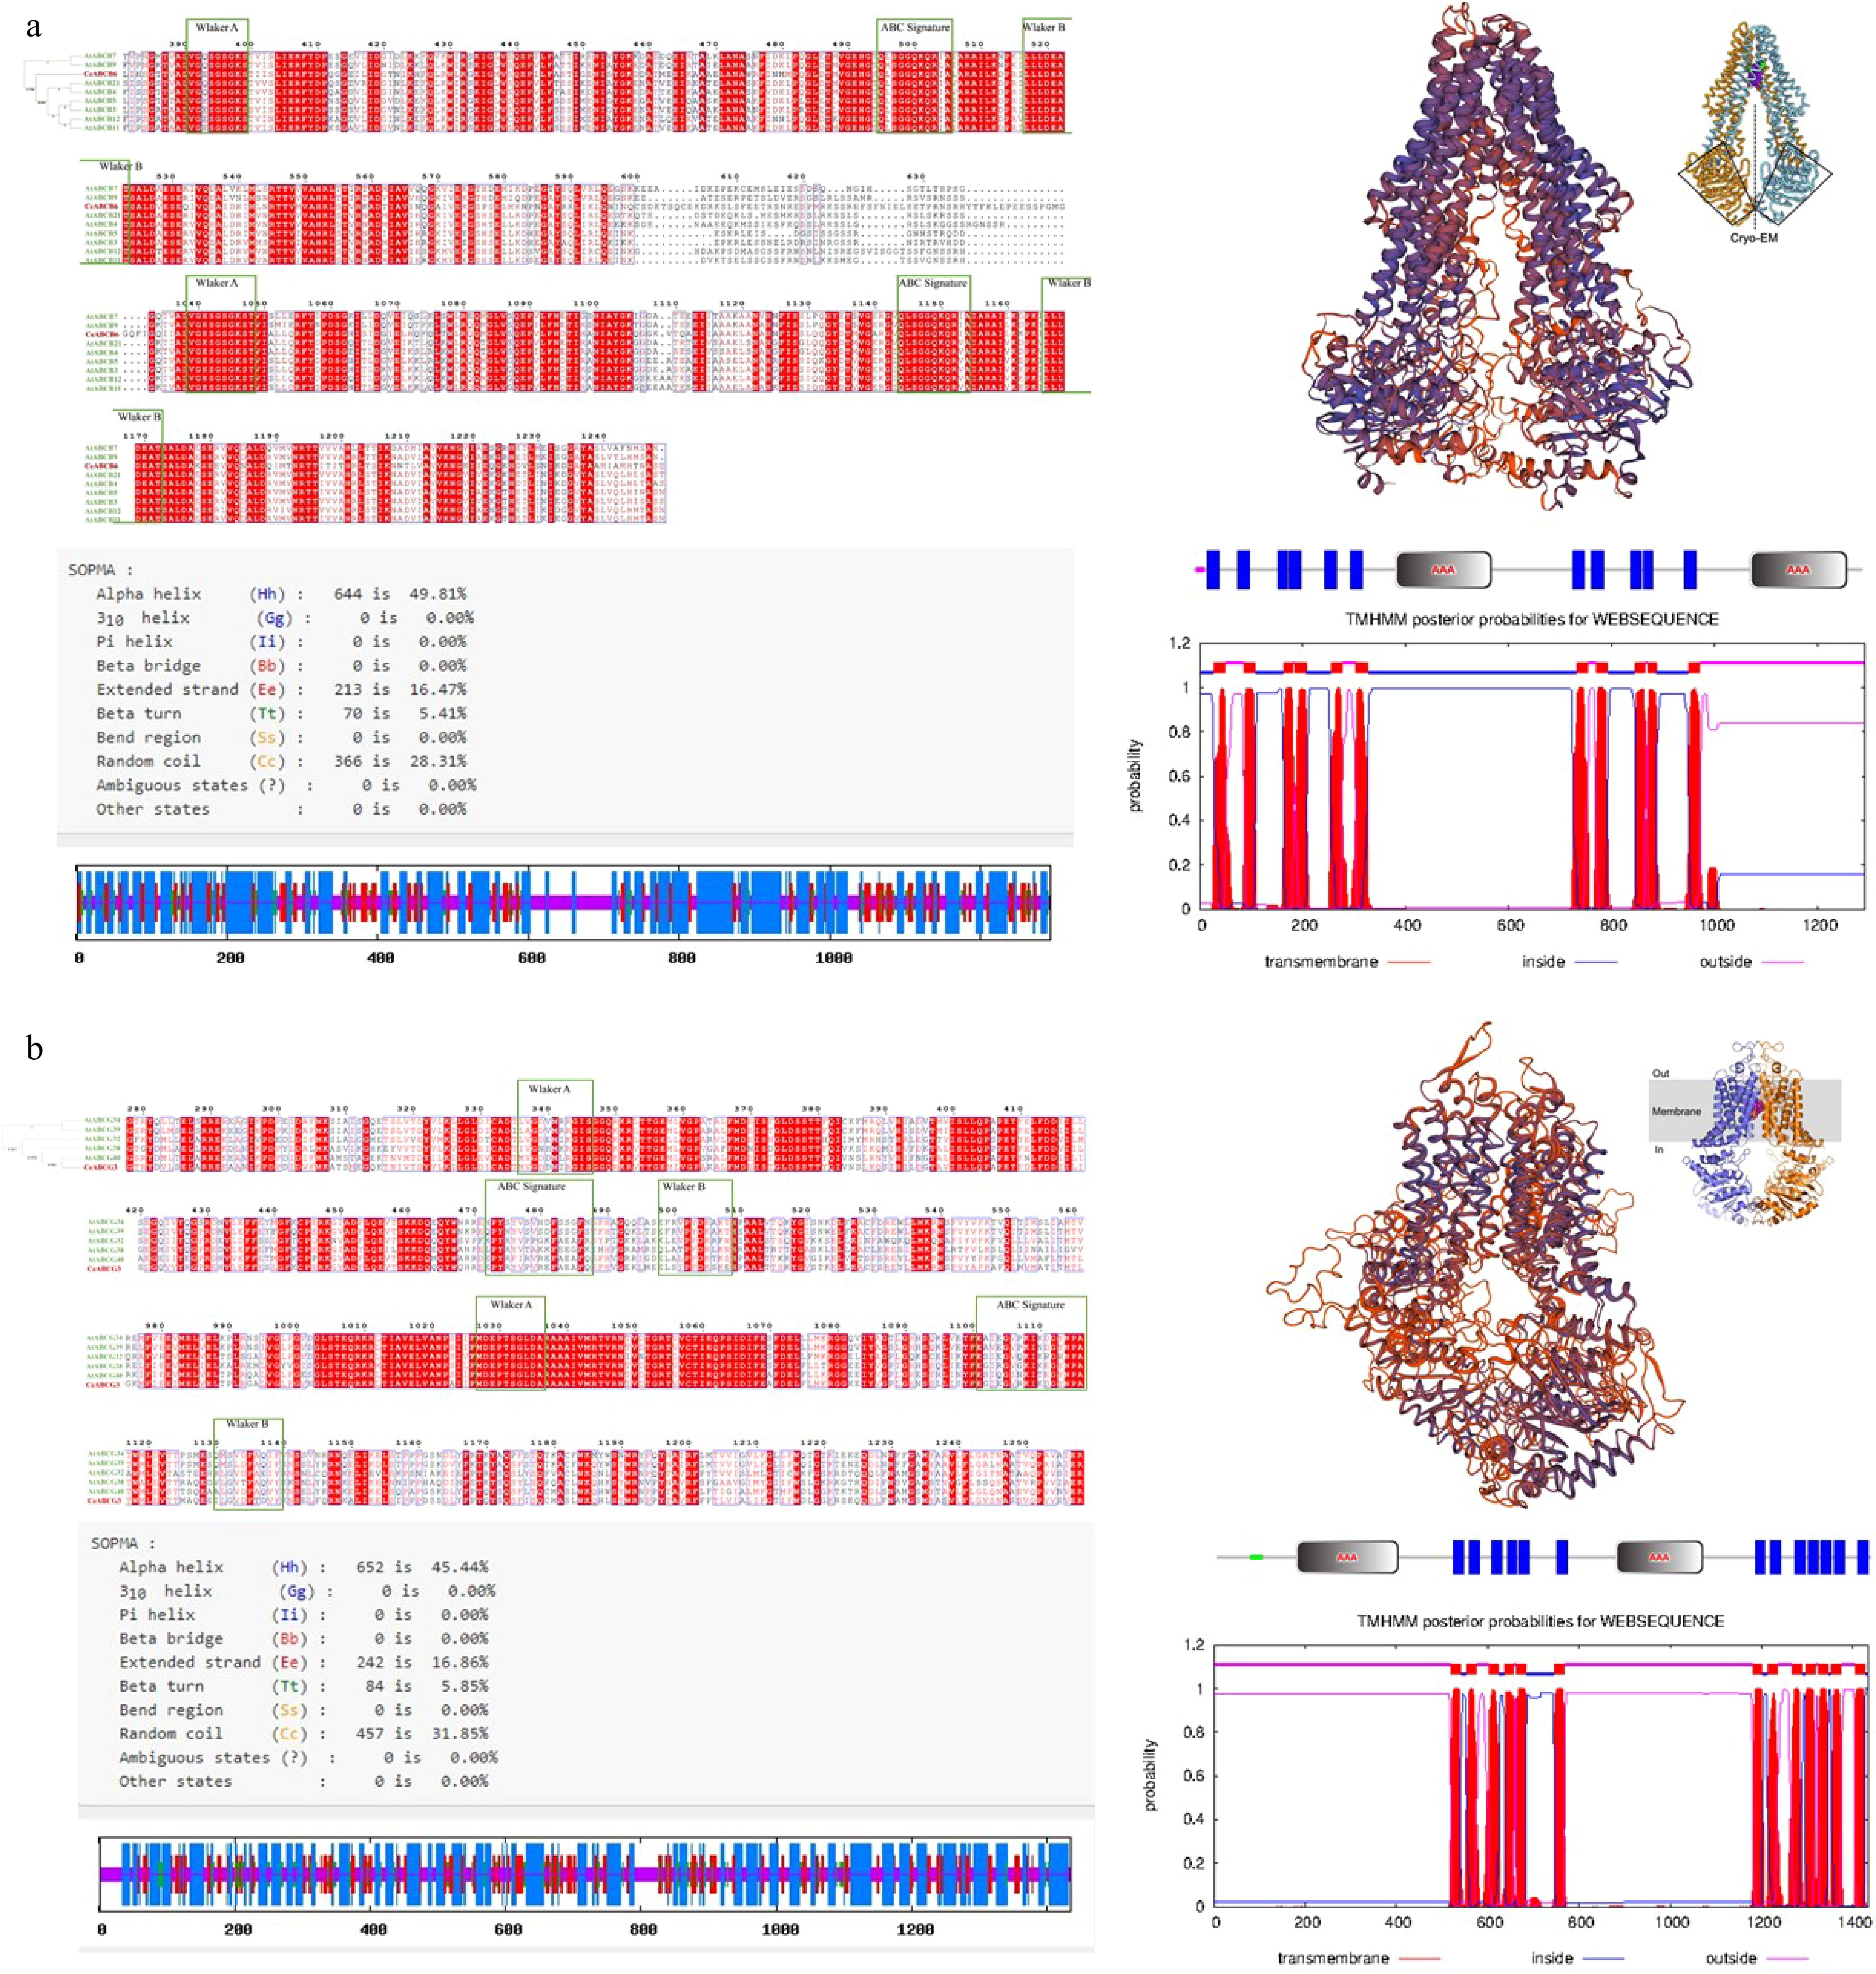
Figure 4.
Structural prediction and subcellular localization of CeABCB6 and CeABCG3. (a), (b) Amino acid sequence alignment, domain organization, transmembrane topology (TMHMM), and tertiary structure modeling of CeABCB6 and CeABCG3, respectively.
-
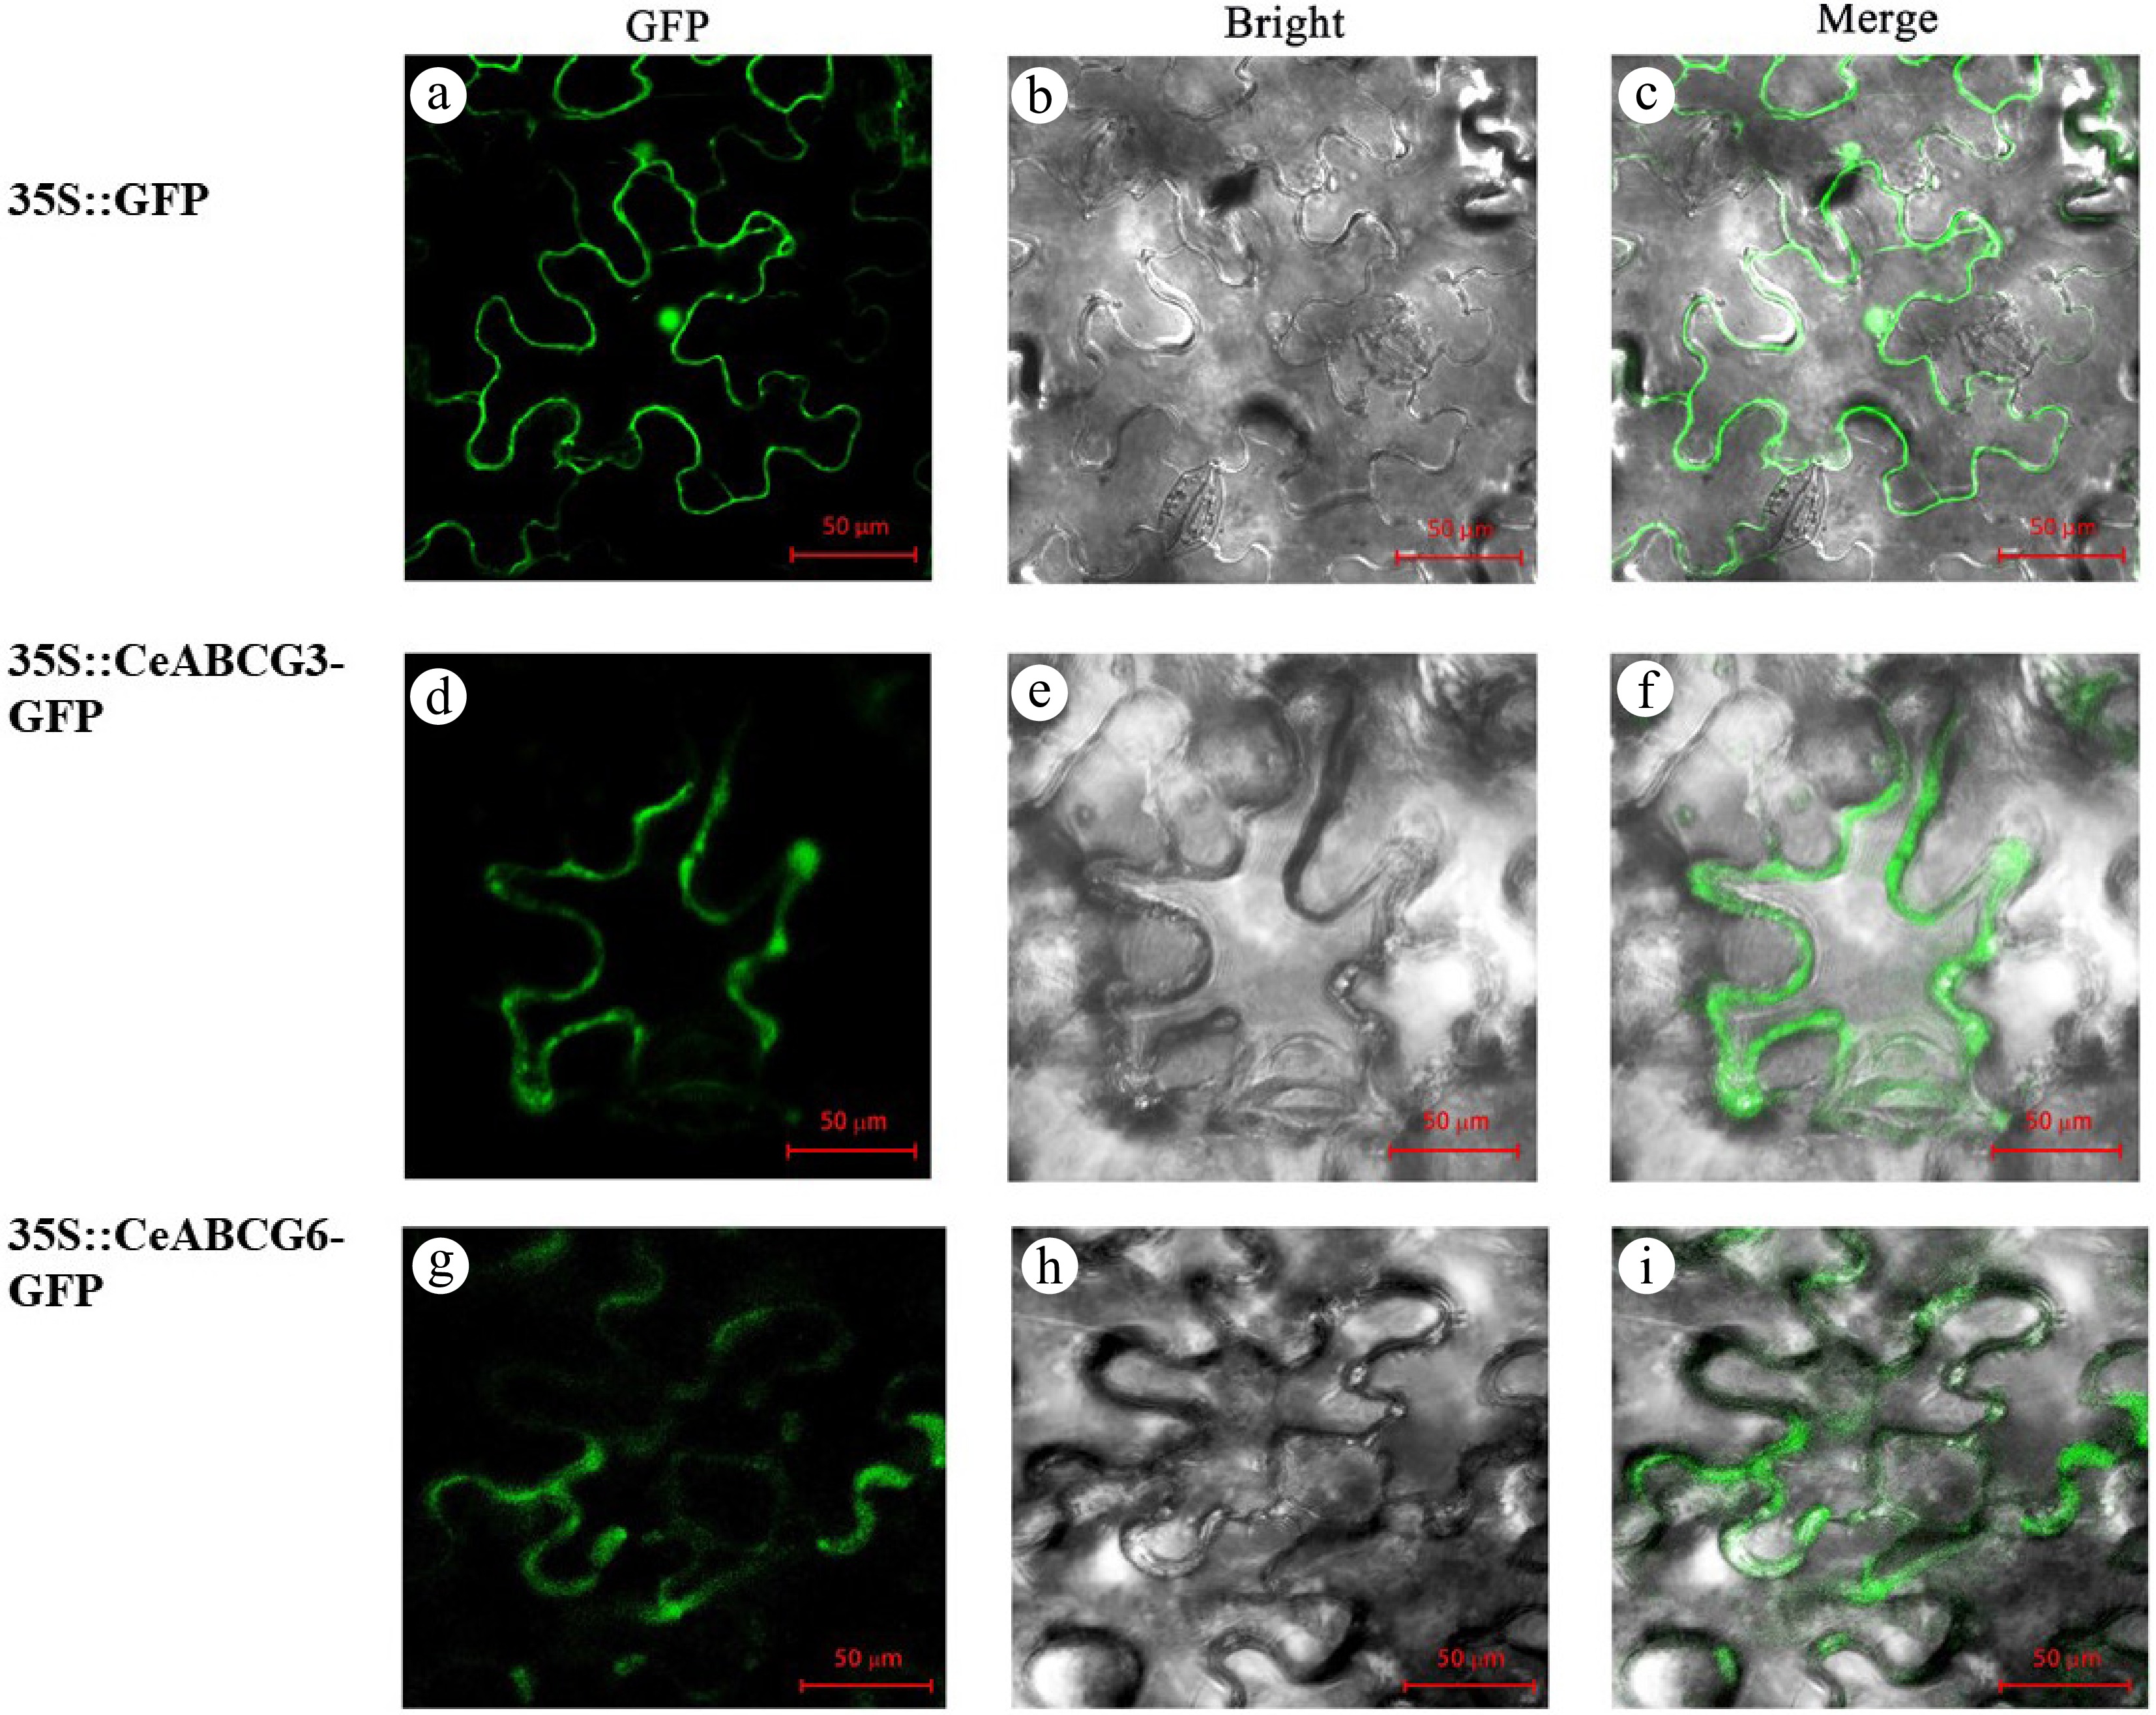
Figure 5.
Subcellular localization of CeABCB6-GFP and CeABCG3-GFP fusion proteins in Nicotiana benthamiana leaves. (a)–(c) 1302-GFP control. (d)–(f) 1302-CeABCG3-GFP. (g)–(i) 1302-CeABCB6-GFP. GFP, bright field, and merged channels are shown.
-
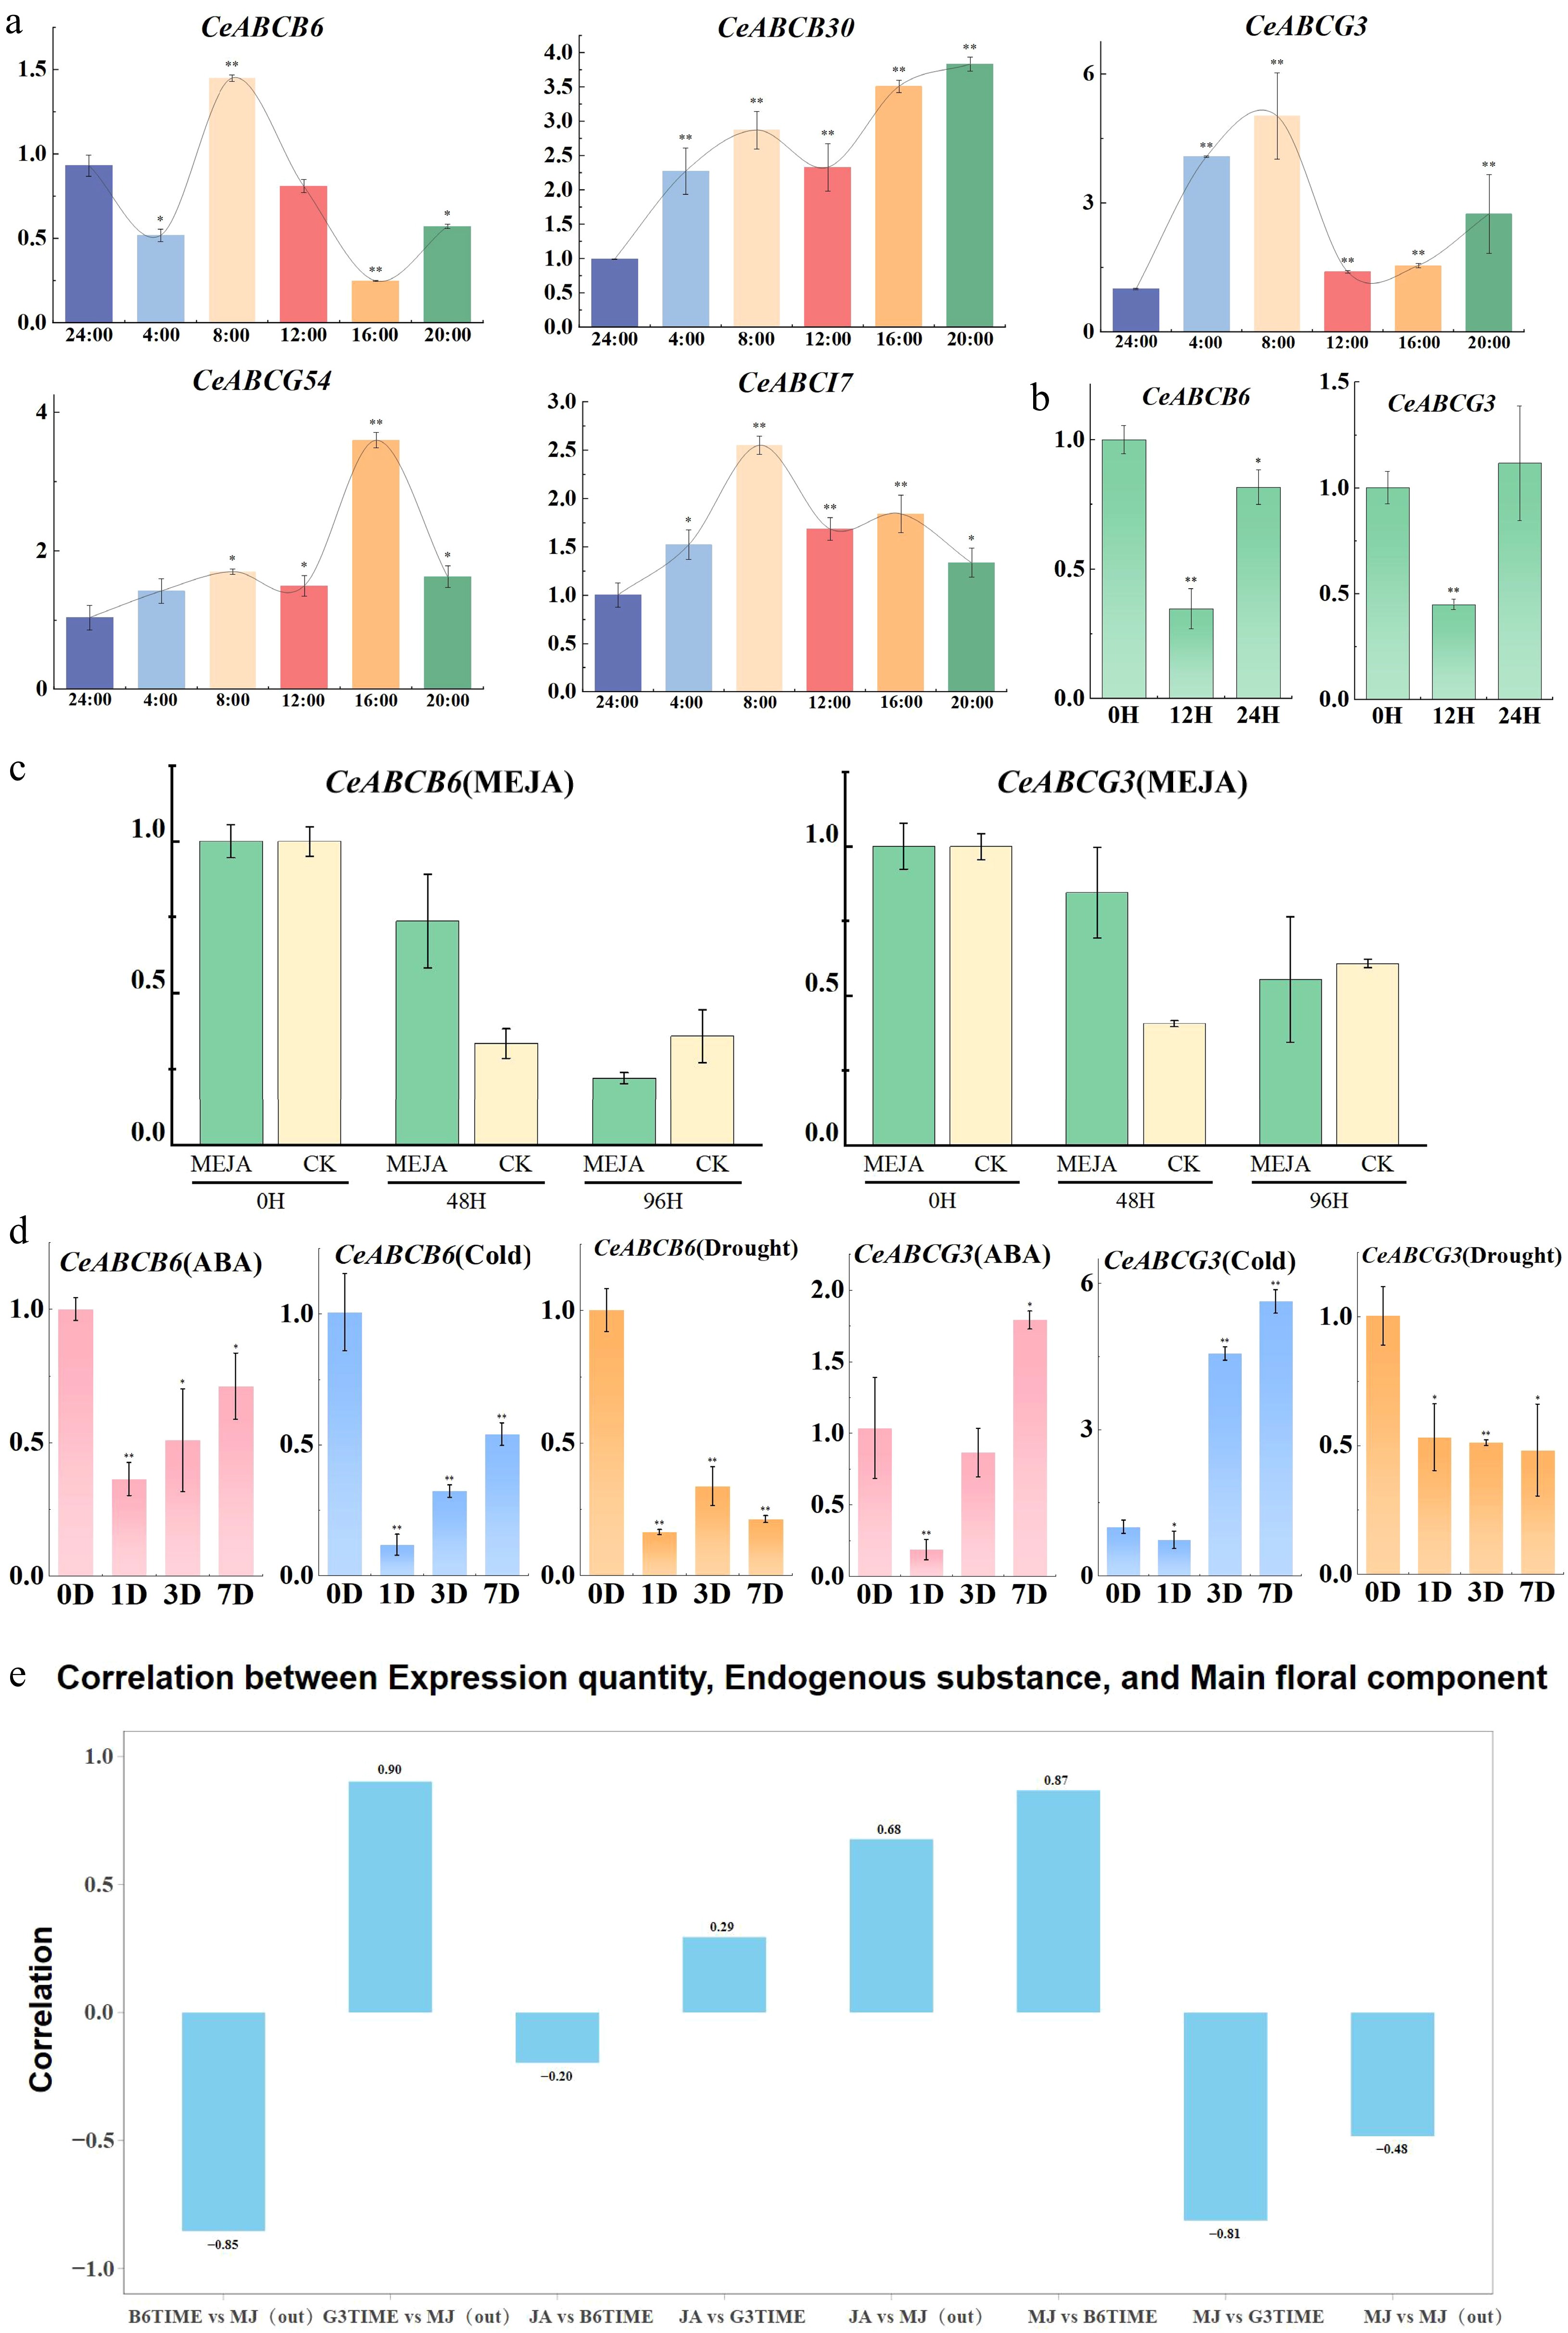
Figure 6.
Expression changes of CeABC genes under various conditions and their correlation with MeJA release. (a) Diurnal expression patterns of CeABC genes during flower blooming. (b) Relative expression changes of CeABCB6 and CeABCG3 under short-term MeJA treatment. (c) Relative expression changes of CeABCB6 and CeABCG3 under prolonged MeJA treatment, with CK serving as the untreated control. (d) Expression changes of CeABCB6 and CeABCG3 under various abiotic stresses. (e) Correlation analysis between CeABCB6 and CeABCG3 expression levels and MeJA release during flower blooming.
Figures
(6)
Tables
(0)