-
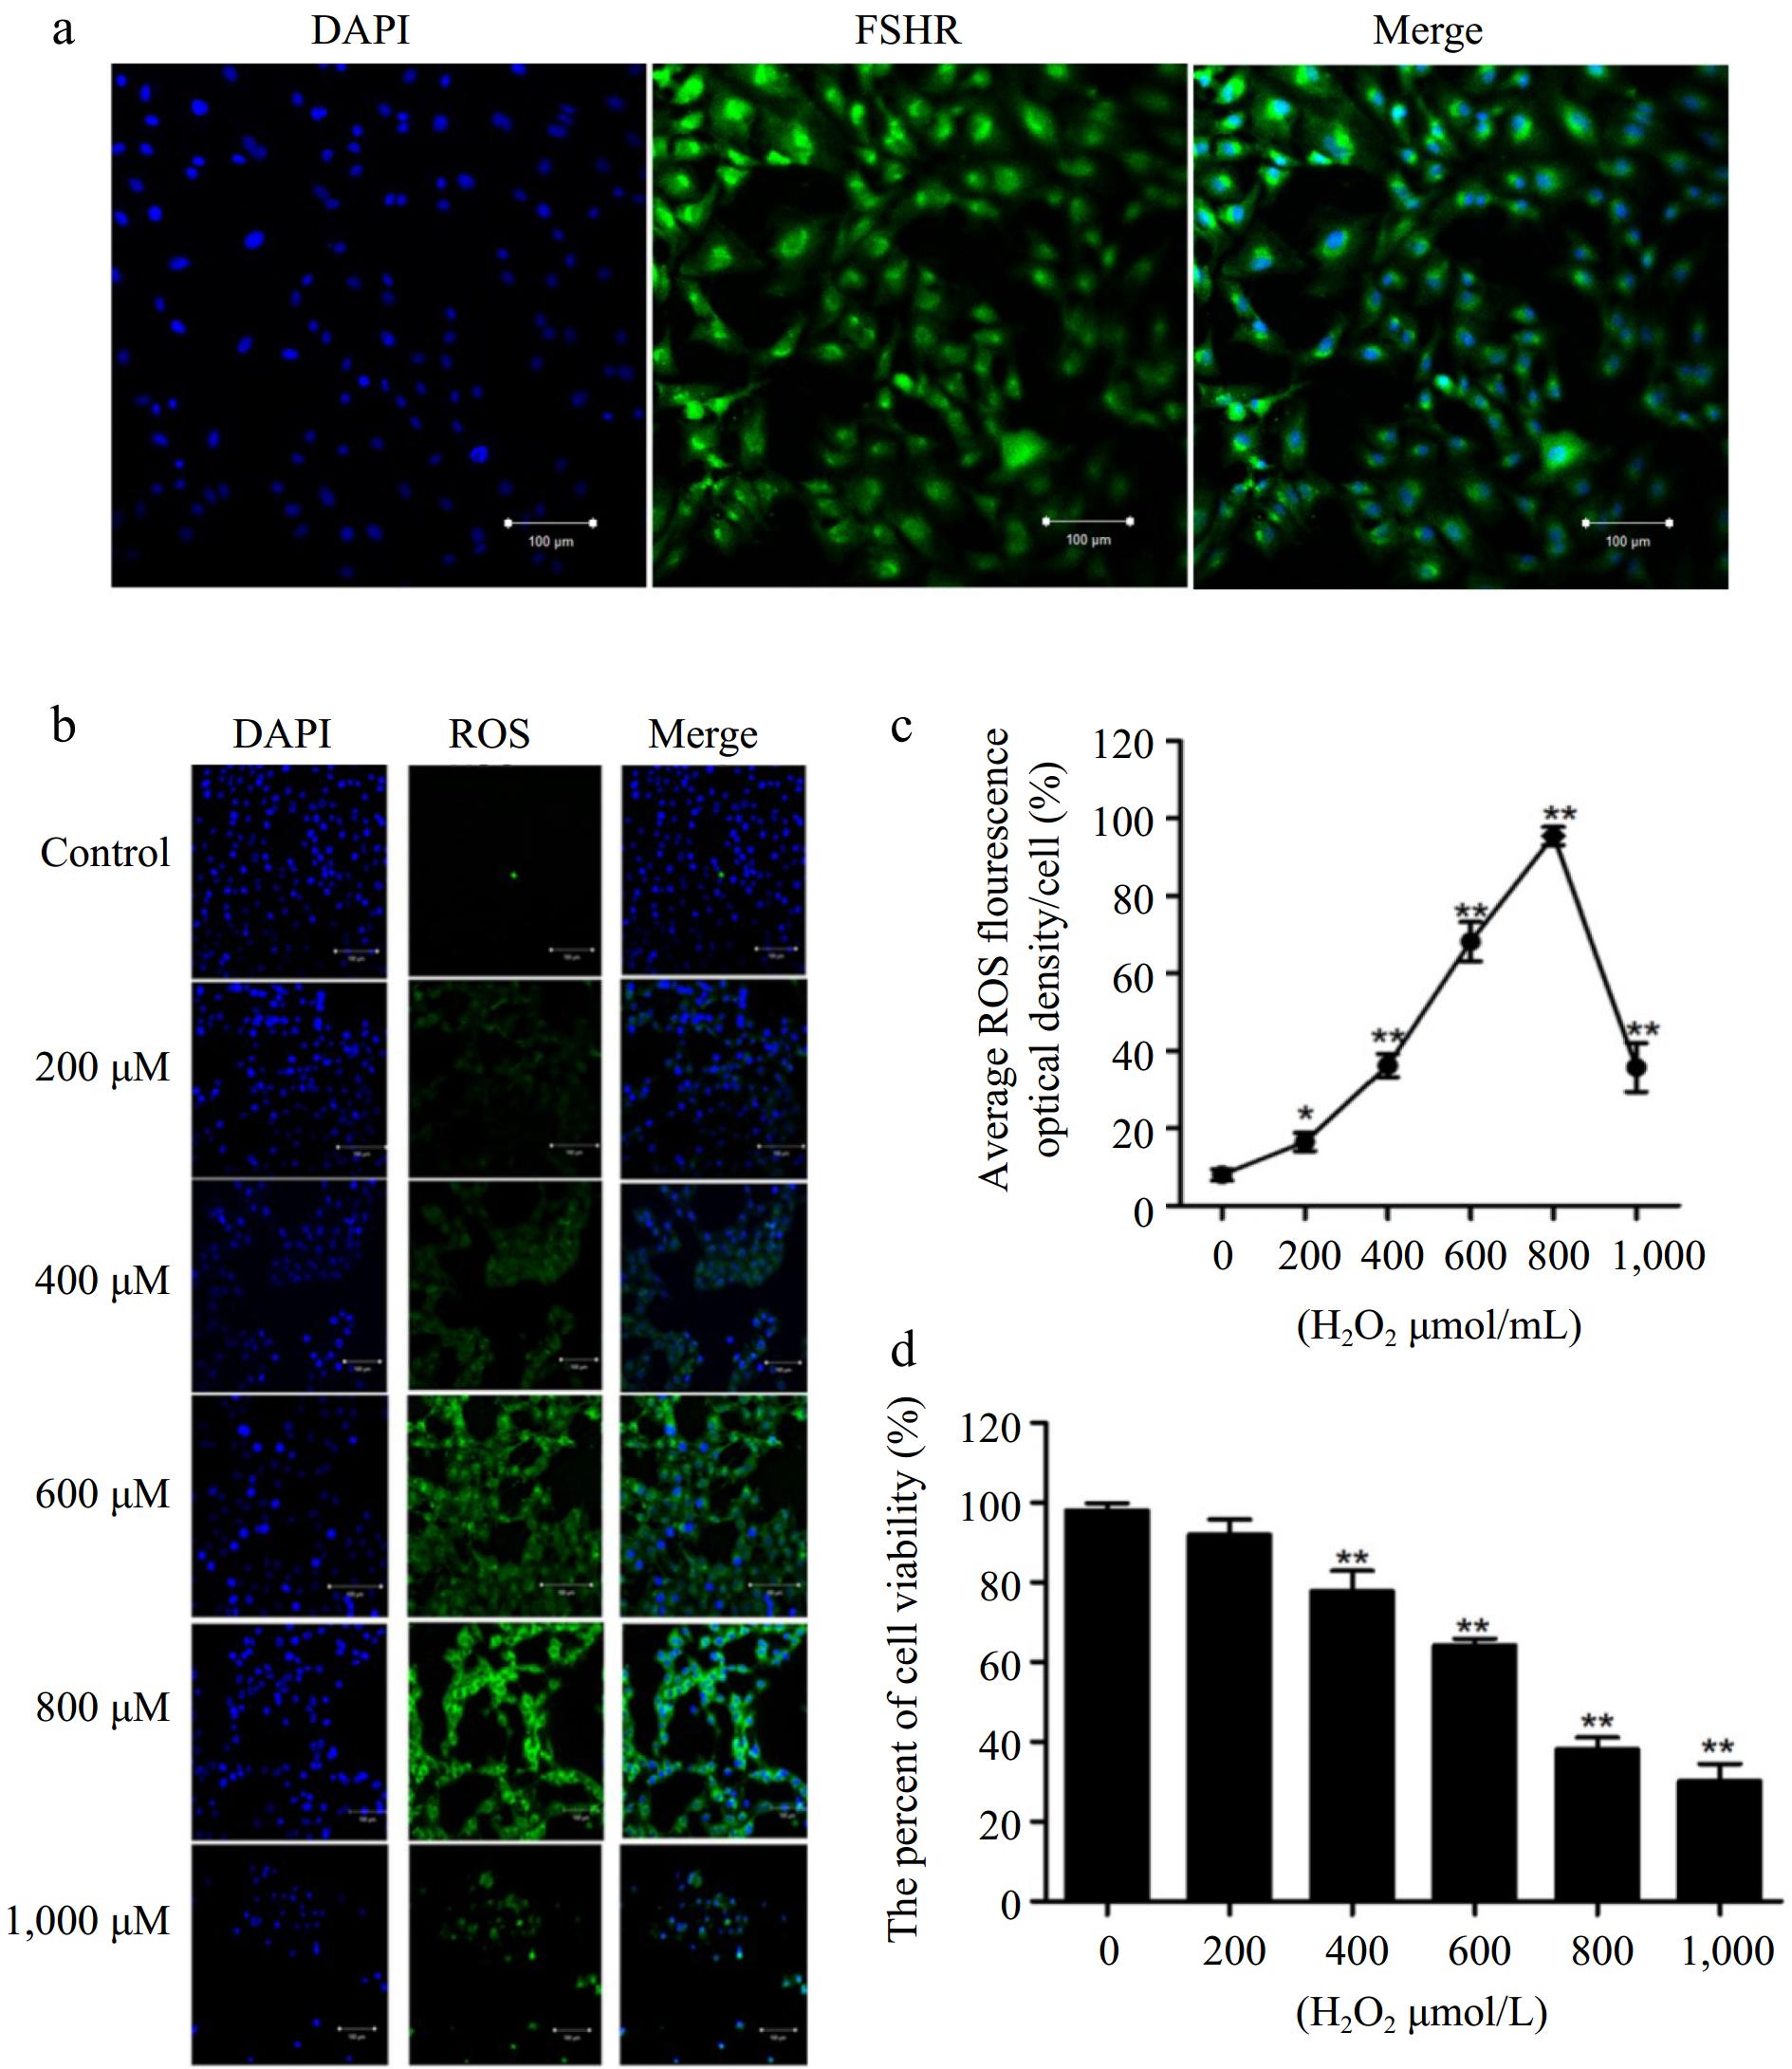
Figure 1.
Establishment of oxidative stress model in BGCs. (a) The BGCs were cultured in vitro and identified by immunofluorescence against FSHR. (b) Immunofluorescence labelling of ROS in the BGCs. (c) Quantification of intracellular ROS levels. (d) Cell viability of BGCs after exposure to H2O2 (0 to 1,000 μM) for 2 h. Data are expressed as mean ± SEM, n = 3. * p < 0.05, and ** p < 0.001. Scale bar, 100 μm.
-
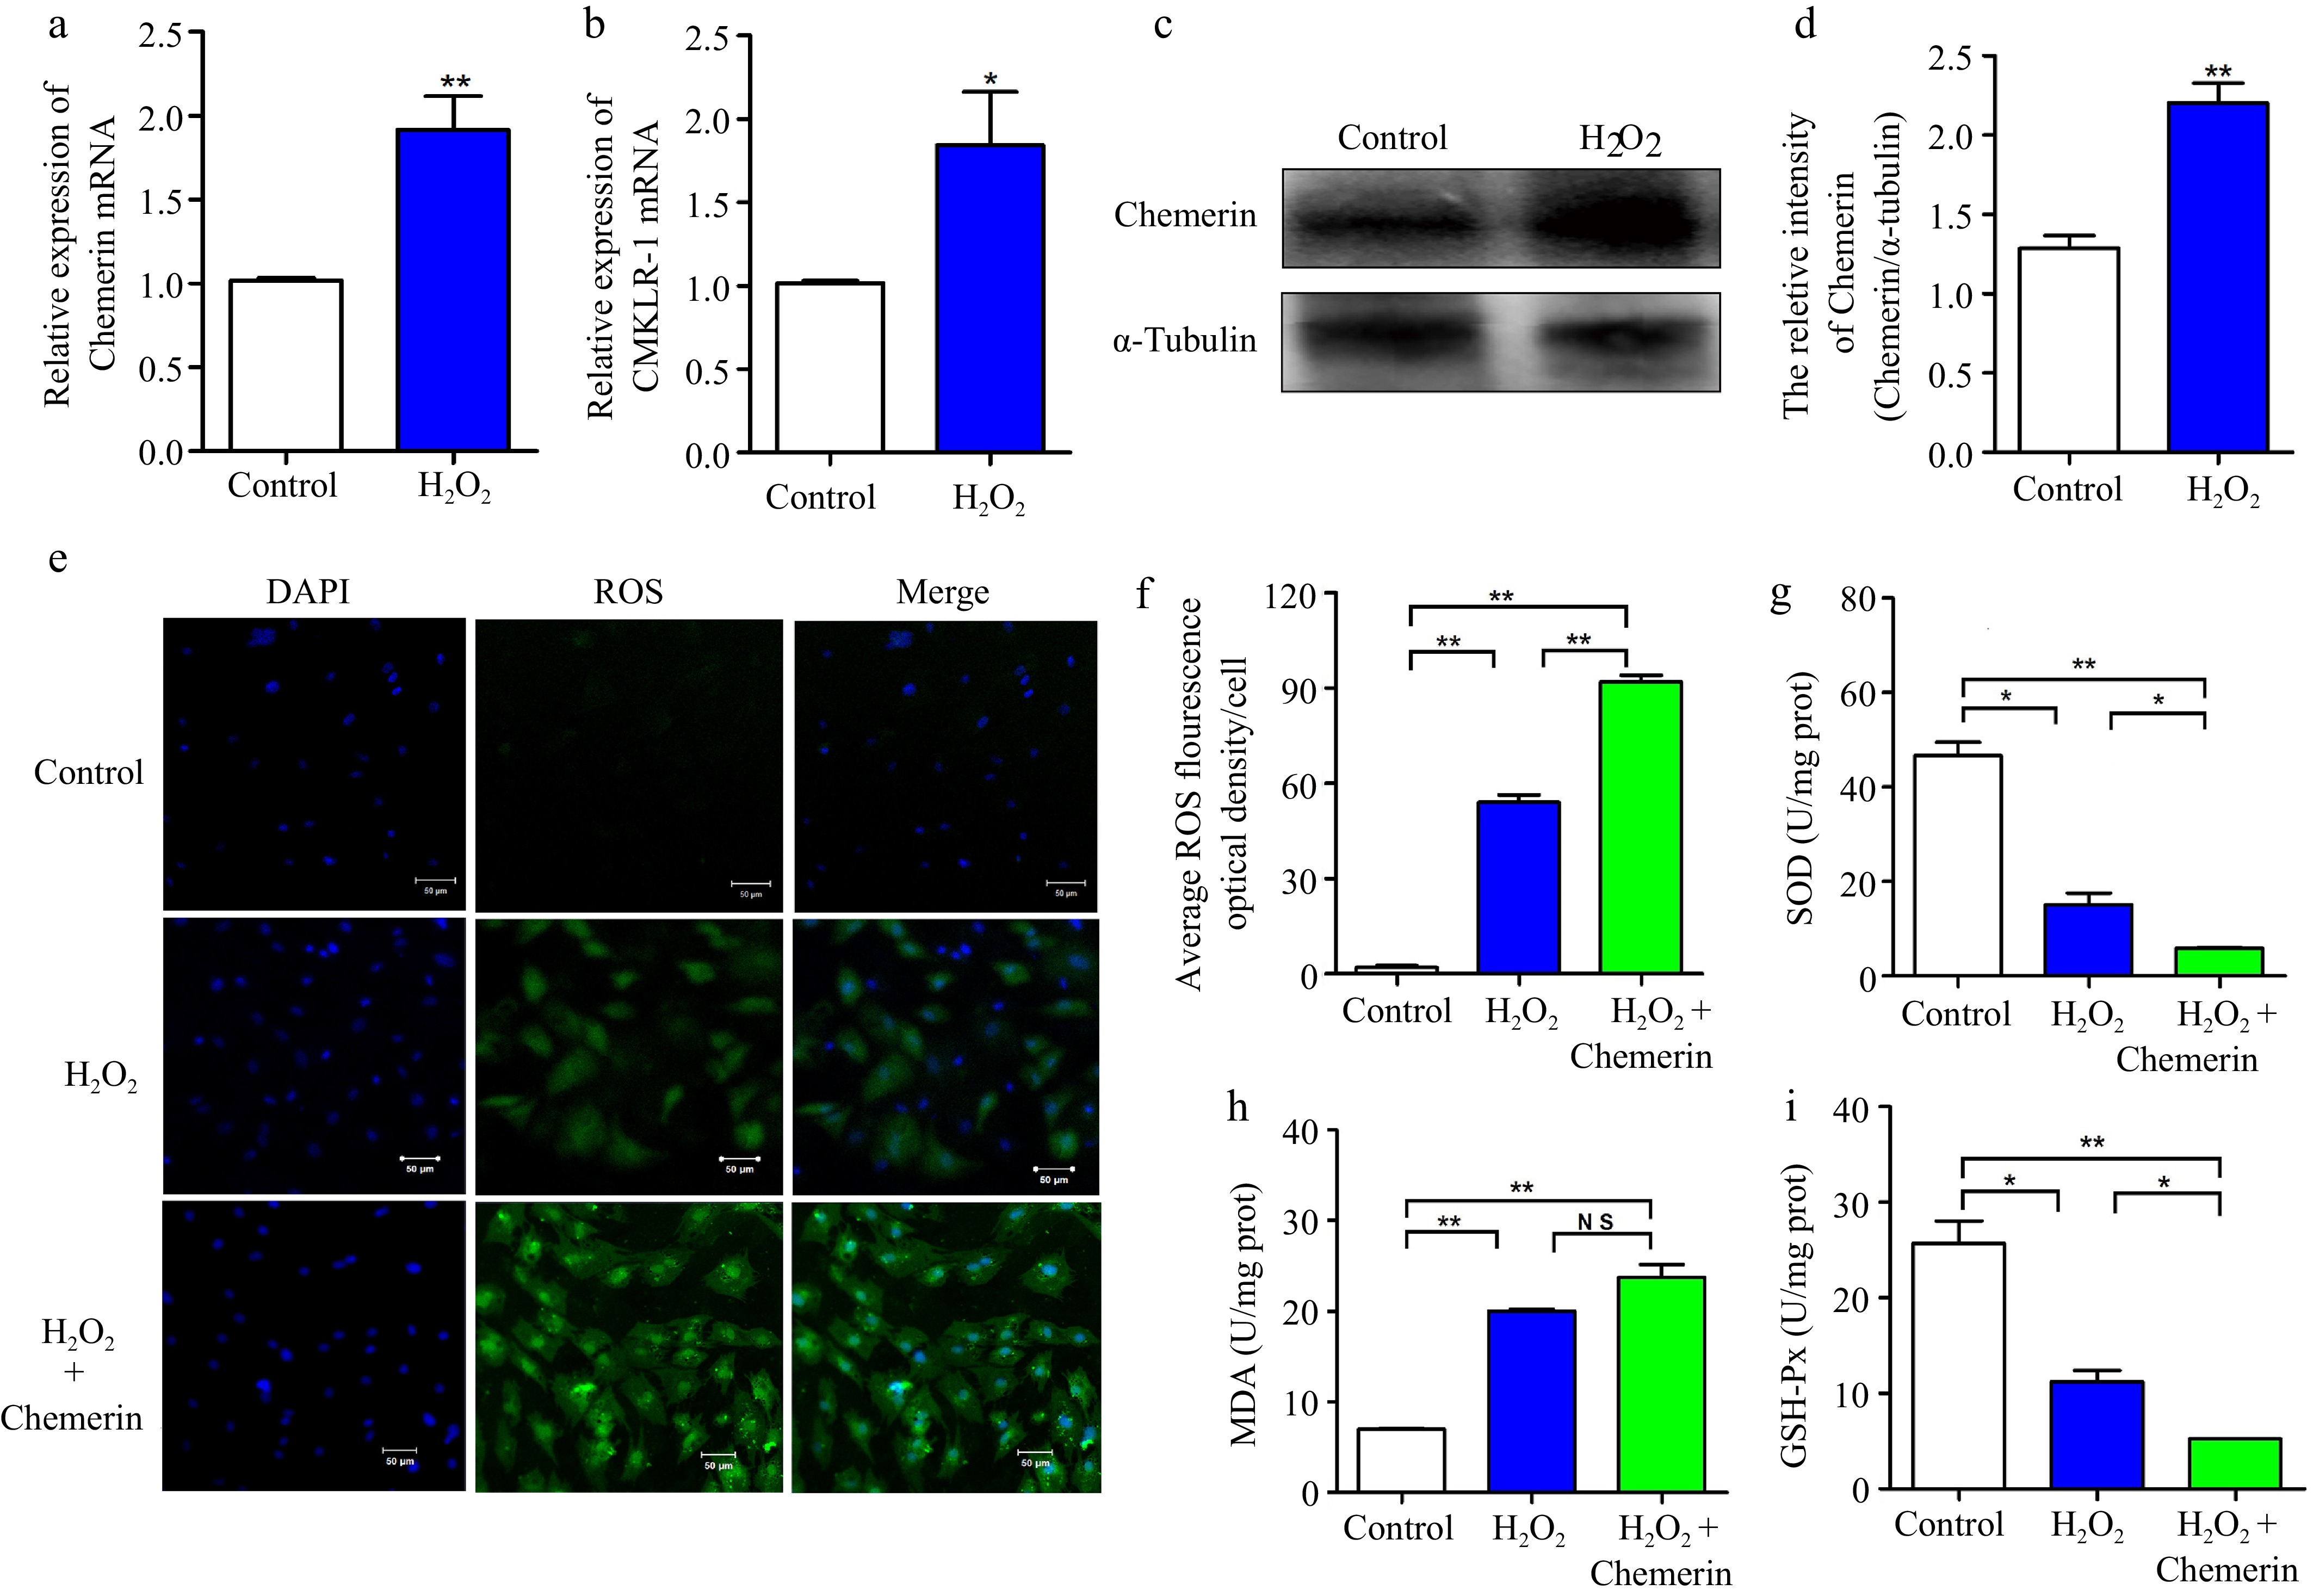
Figure 2.
Chemerin promotes oxidative stress in BGCs. (a), (b) Detection mRNA expressions of chemerin and CMKLR-1 after H2O2 treatment in BGCs by RT-qPCR. (c), (d) Detection protein expression of chemerin in BGCs by western blotting. α-Tubulin was used as the internal control for protein level normalization. (e) DCFH-DA assay for detection ROS content in BGCs exposed to H2O2 with or without chemerin. (f) Relative fluorescence intensity of ROS. (g)−(i) Effect of chemerin on the antioxidant enzymes in H2O2-induced BGCs. Data are expressed as mean ± SEM, n = 3. * p < 0.05, and ** p < 0.001, ns denotes not significant. Scale bar, 50 μm.
-
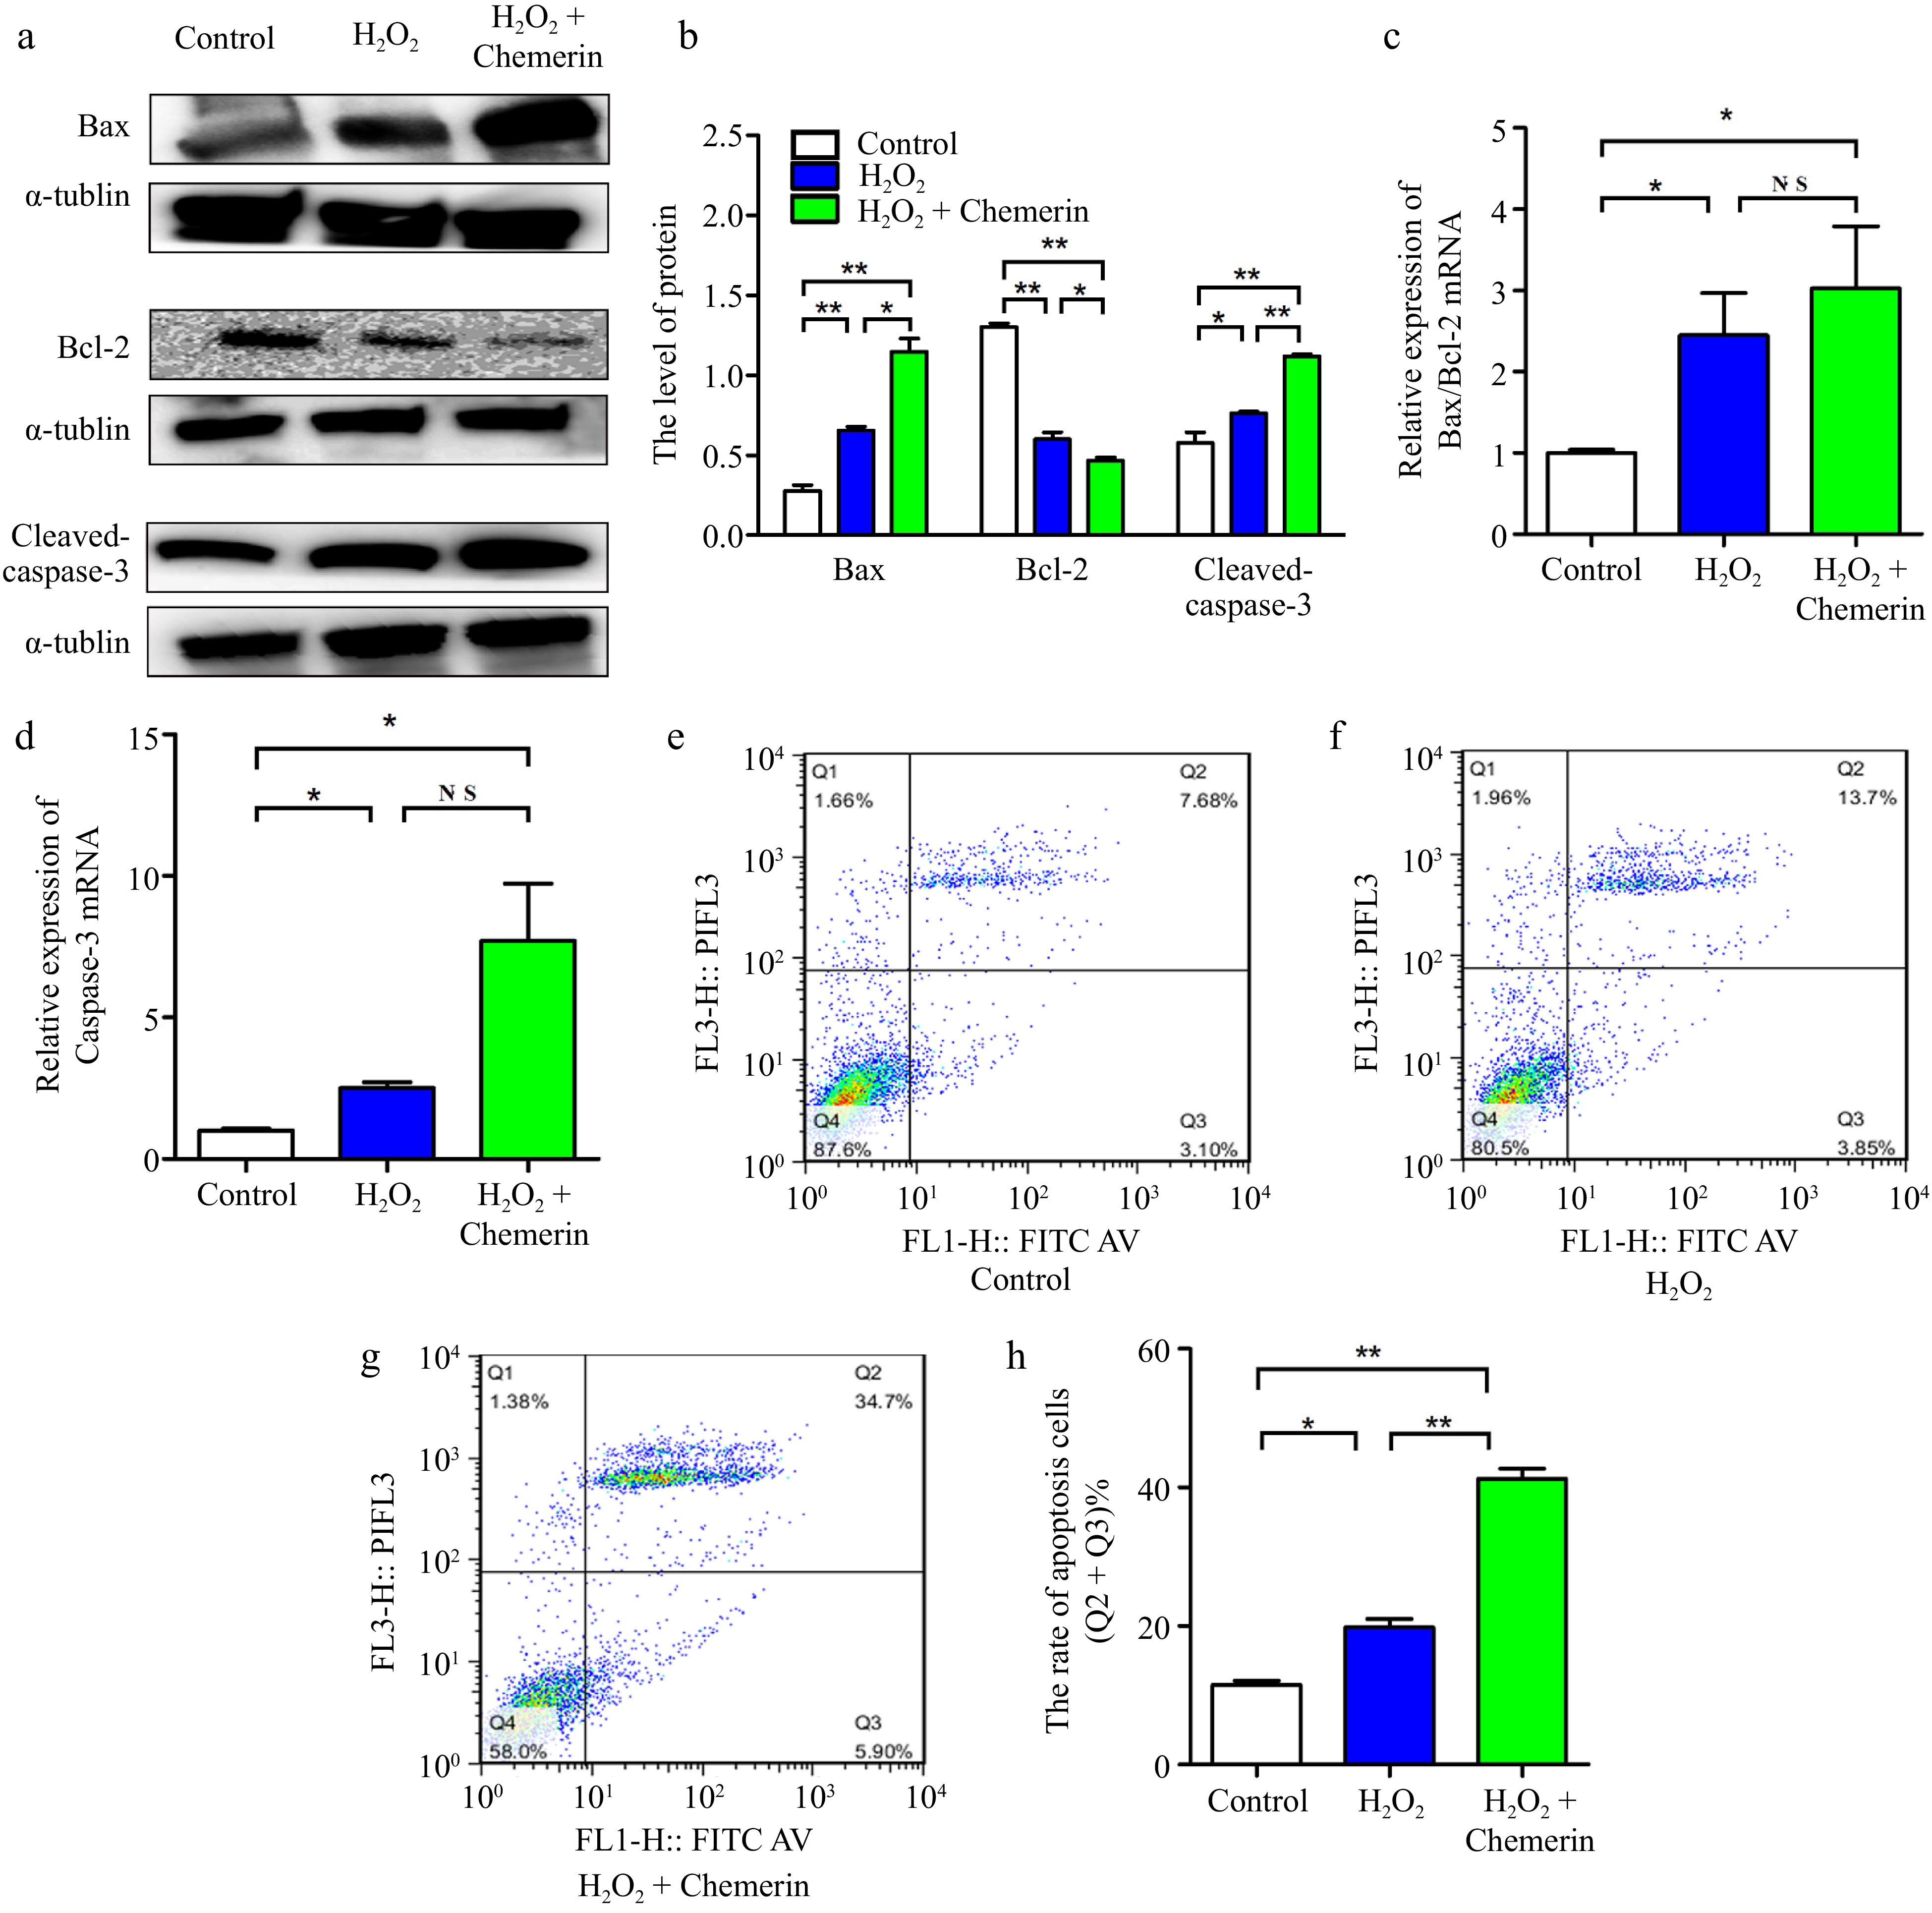
Figure 3.
Chemerin promotes apoptosis in BGCs. (a), (b) Cells were treated with H2O2, chemerin plus H2O2. Western blotting analysis of apoptosis-related proteins (Bax, Bcl-2, and Cleaved-caspase-3) expression and relative quantification in BGCs. (c), (d) RT-qPCR analysis of the relative mRNA expression levels of Bcl-2, Bax, and Caspase-3. (e)−(h) Flow cytometry analysis of cell apoptosis rate. Data are expressed as mean ± SEM, n = 3. * p < 0.05, and ** p < 0.001, ns denotes not significant.
-
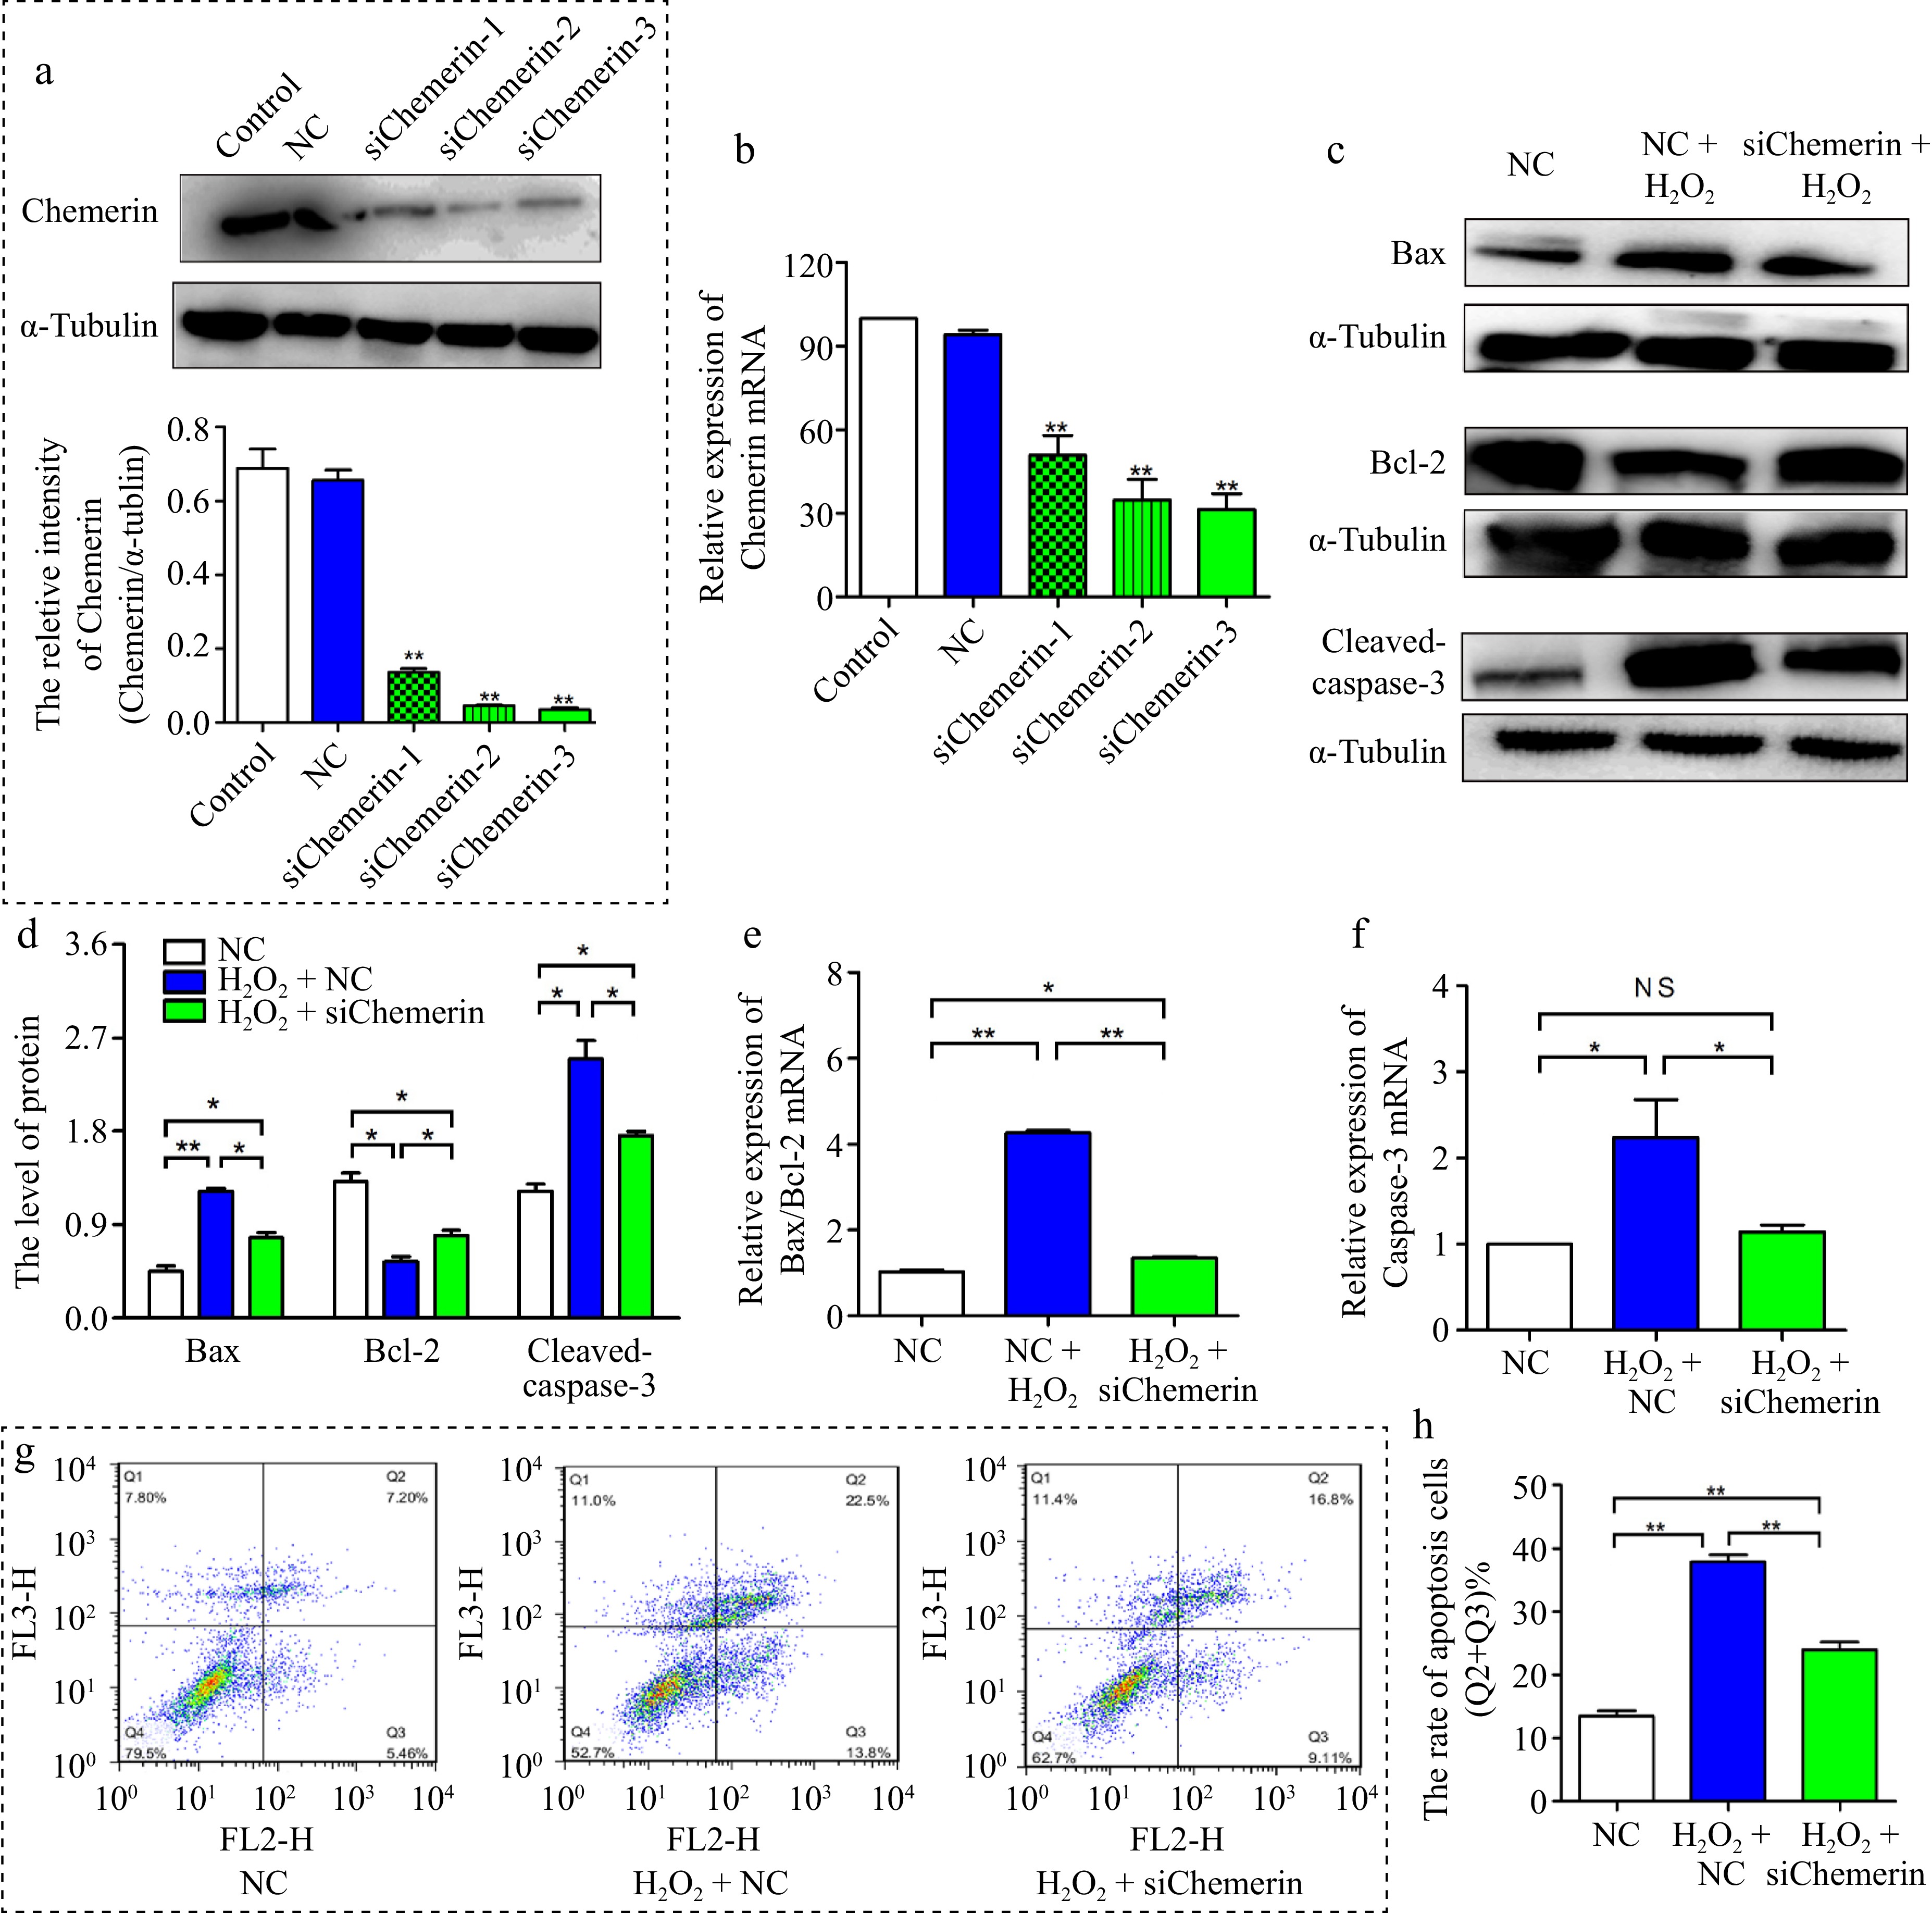
Figure 4.
Interfering chemerin inhibited oxidative stress-induced apoptosis in BGCs. (a), (b) BGCs were treated with si-NC, si-chemerin-1, si-chemerin-2, and si-chemerin-3. The interference efficiency of chemerin was detected at 72 and 48 h by Western blotting and RT-qPCR. (c), (d) Western blotting analysis of Bax, Bcl-2, and Cleaved-caspase-3 proteins expression in BGCs treated with H2O2 plus si-NC or si-chemerin-3. (e), (f) RT-qPCR analysis the levels of apoptosis-related genes (Bax, Bcl-2, and Caspase-3). (g), (h) Flow cytometry analysis the apoptosis rate in BGCs. Data are expressed as mean ± SEM. n = 3. *p < 0.05, and **p < 0.001, ns denotes not significant.
-
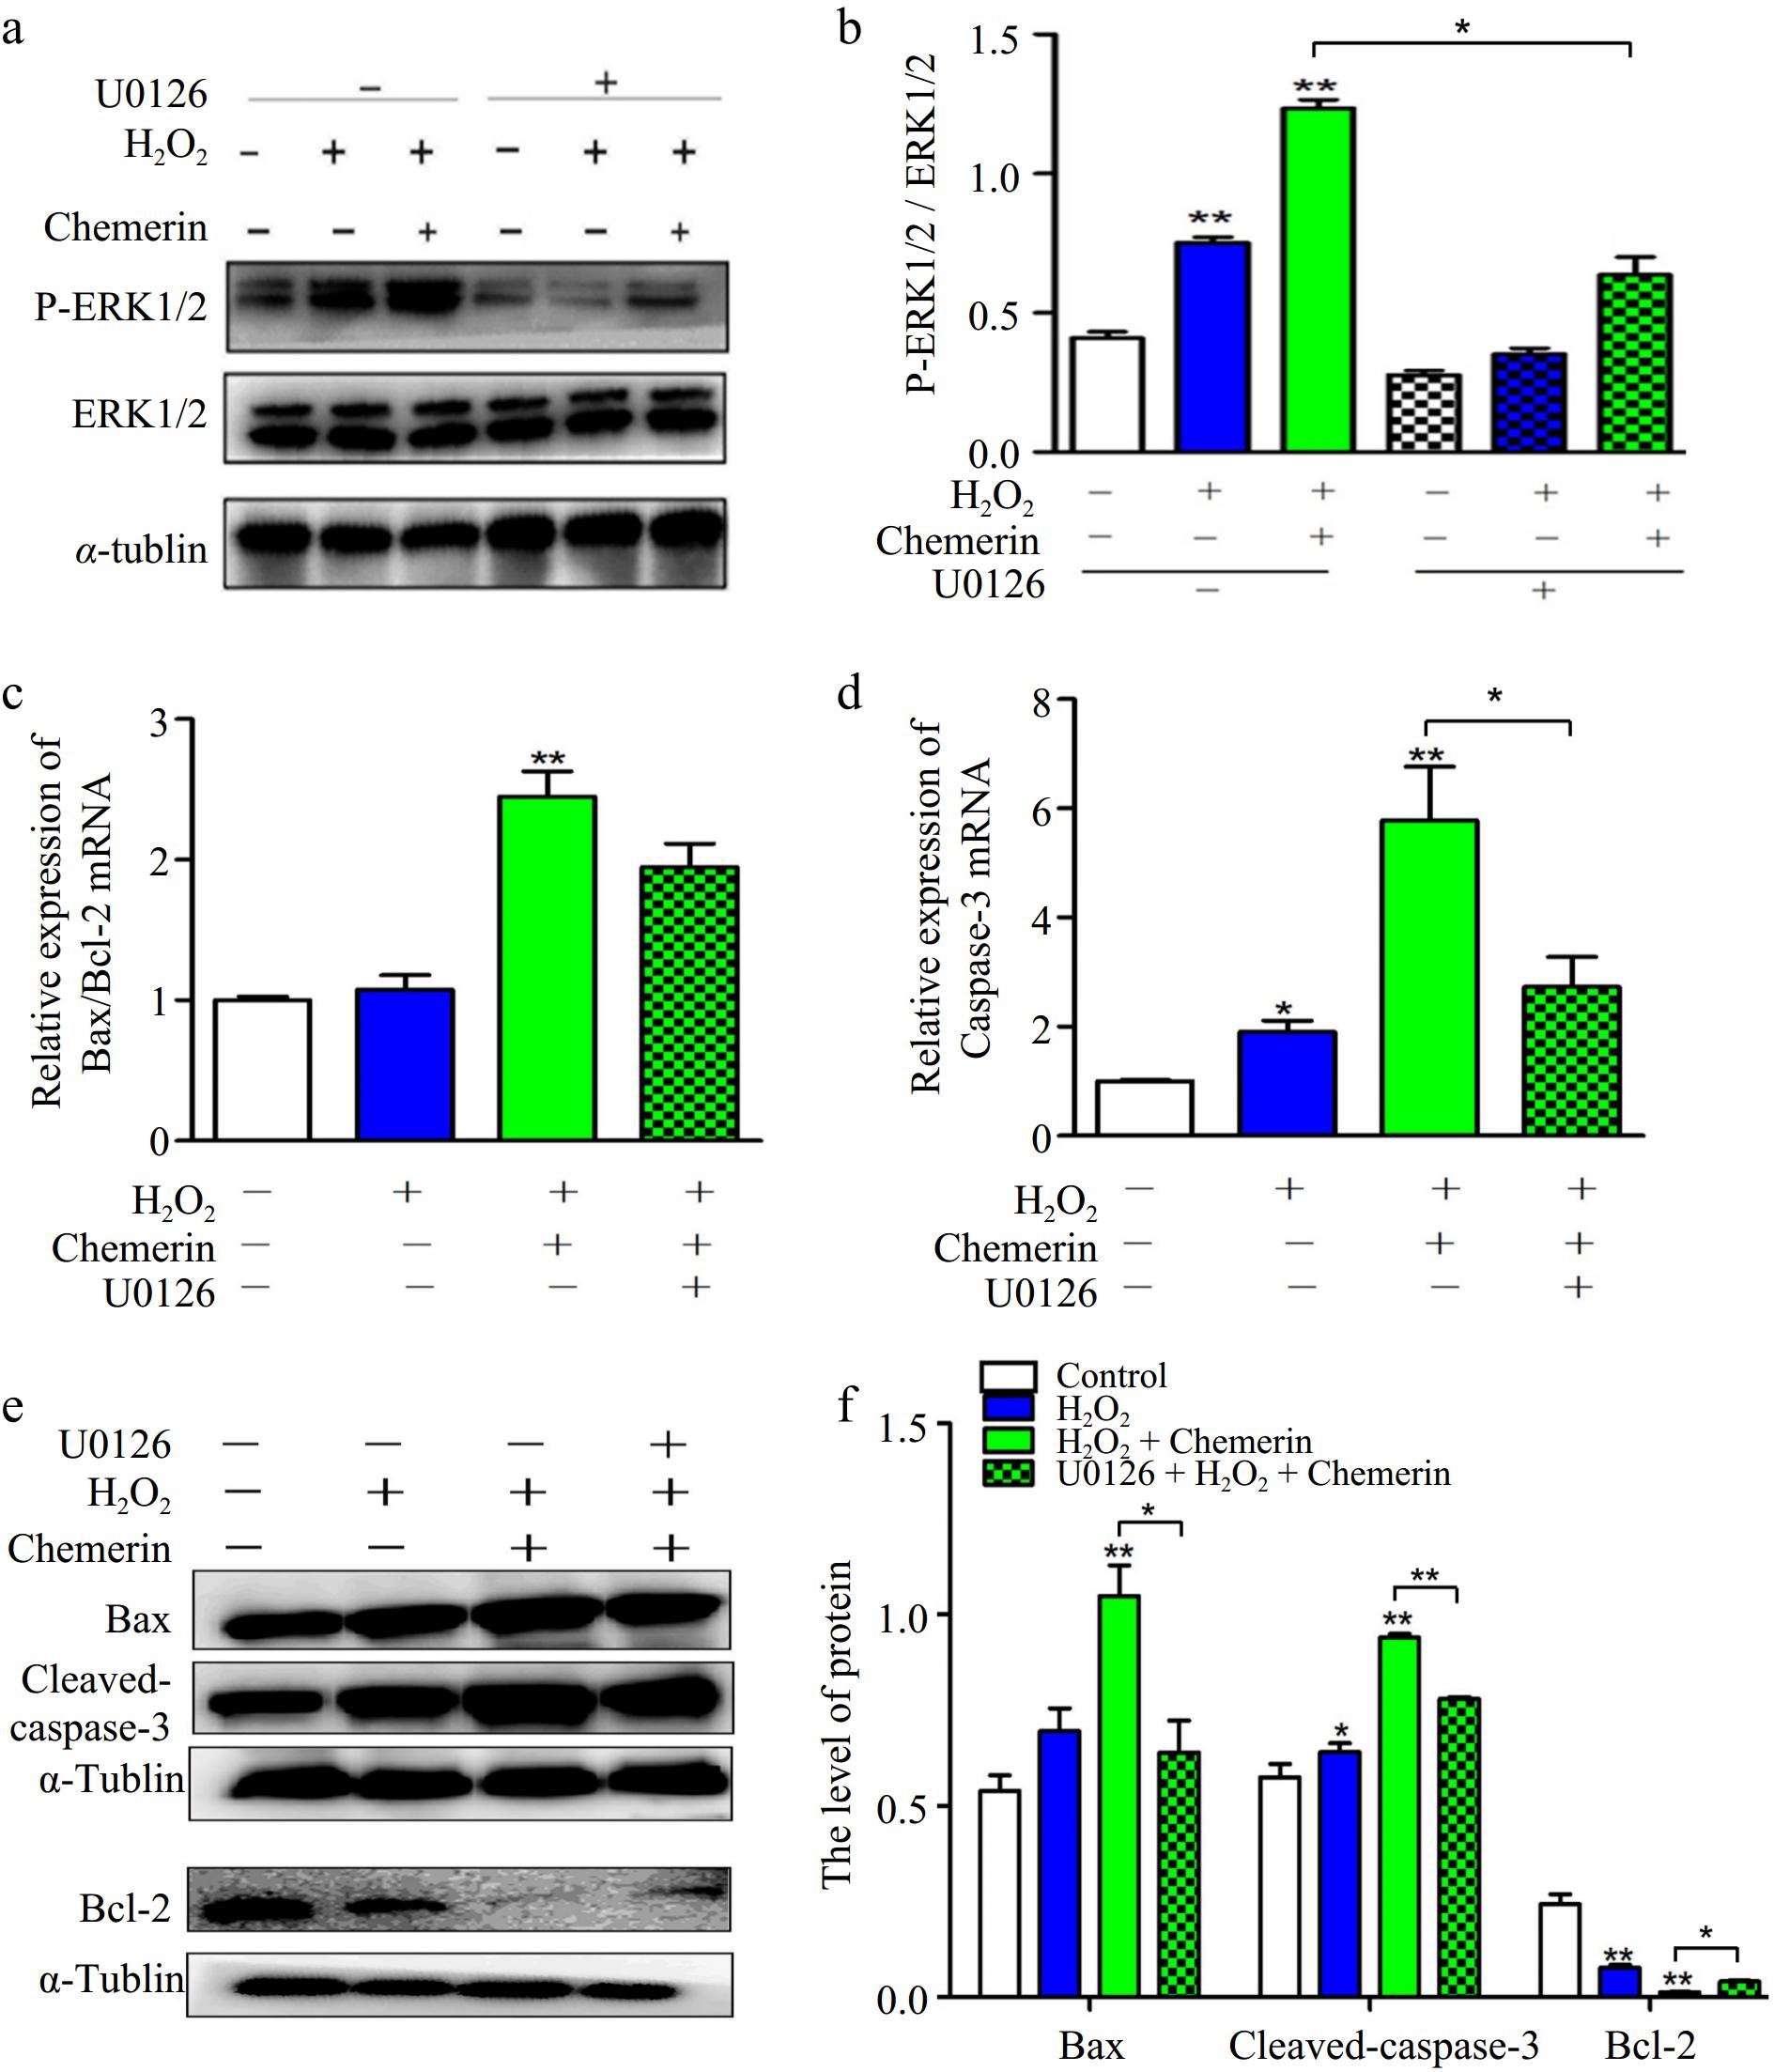
Figure 5.
Chemerin promoted oxidative stress-induced apoptosis via ERK1/2 pathway in BGCs. (a), (b) BGCs were treated with H2O2, U0126 plus H2O2, and H2O2 in combination with chemerin and U0126. Protein expressions of p-ERK1/2 and ERK1/2 were measured by Western blotting. (c), (d) The mRNA expressions of Bax/Bcl-2 and Caspase-3 were tested in BGCs by RT-qPCR. (e), (f) Western blotting analysis the protein expressions of Bax, Bcl-2, and Cleaved-caspase-3 and relative quantification in BGCs. Data are expressed as mean ± SEM, n = 3. *p < 0.05, and **p < 0.001.
-
Gene Forward (5′-3′) Reverse (5′-3′) si-NC UUCUCCGAACGUGUCACGUTT ACGUGACACGUUCGGACAATT si-Chemeirn-1 GGGAAGAUAUCCUGCUUUATT UAAAGCAGGAUAUCUUCCCTT si-Chemerin-2 GCCACAGGAGCUUUACCAATT UUGGUAAAGCUCCUGUGGCTT si-Chemerin-3 UCGUCAUGAUCACGUGCAATT UUGCACGUGAUCAUGACGATT Table 1.
Sequences of chemerin and negative control (NC) siRNAs.
-
Gene Forward (5′-3′) Reverse (5′-3′) Chemerin GGAGGAGTTCCACAAGCATC CTTGAACTCCAGCCTCACAA CMKLR-1 GGCGGTCTACAGCGTCATCT CGCCAGGTTGAGGAACCAGA Bax CCAGCAAACTGGTGCTCAAGG AGCCGCTCTCGAAGGAAGTC Bcl-2 AGCATCGCCCTGTGGATGAC CAGCCTCCGTTGTCCTGGAT Caspase-3 CTGAGGGTCAGCTCCTAGCG GCTGCAGCTCTGCTGGACT β-actin CATGCCATCCTCCGTCTGGA CTCTCGGCTGTGGTGGTGAA Table 2.
Primer sequences for Quantitative real-time PCR.
Figures
(5)
Tables
(2)