-
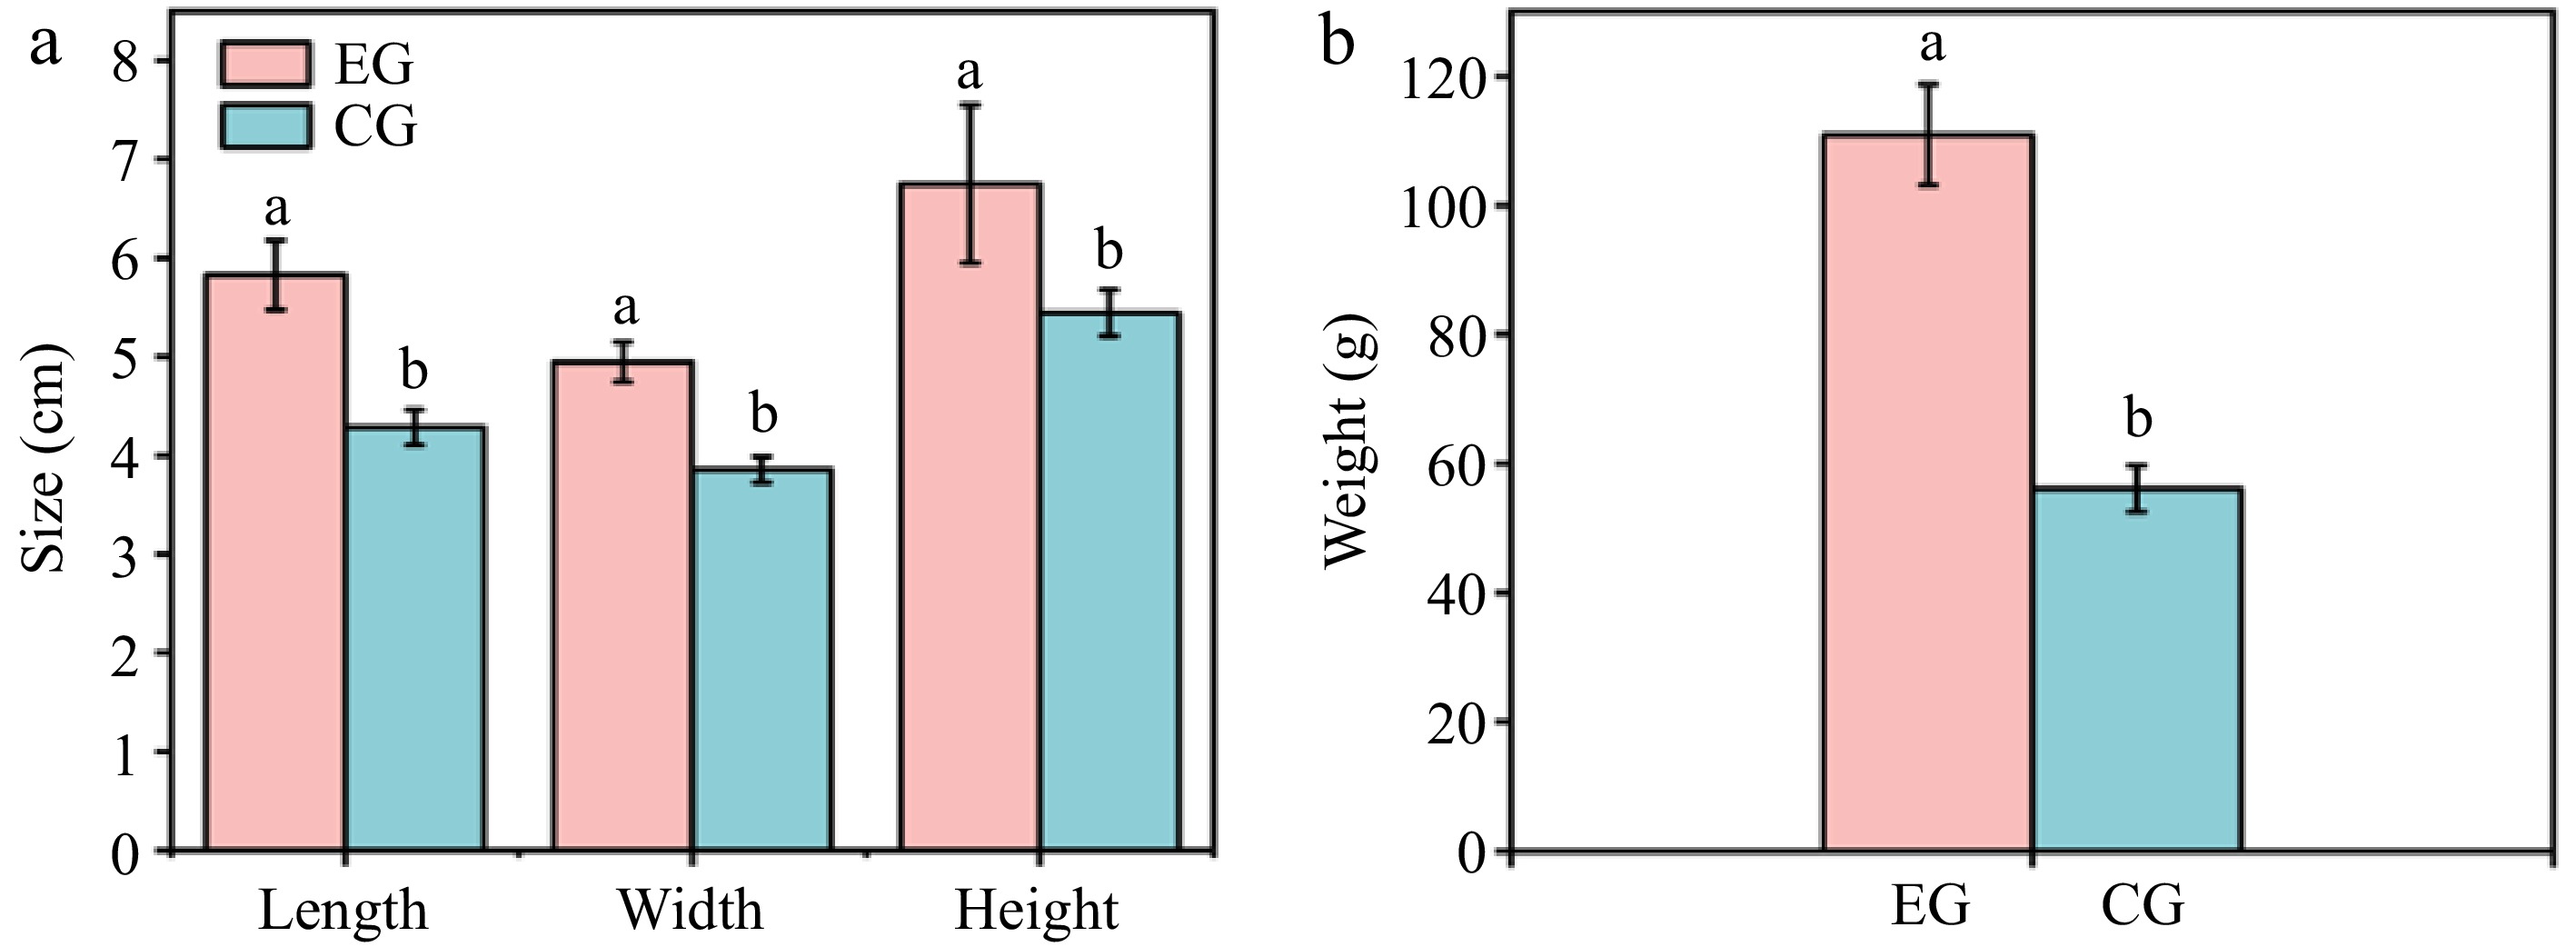
Figure 1.
Effect of CPPU treatment on (a) size and (b) weight of kiwifruit. EG, kiwifruit with CPPU treatment; CG, kiwifruit without CPPU treatment.
-
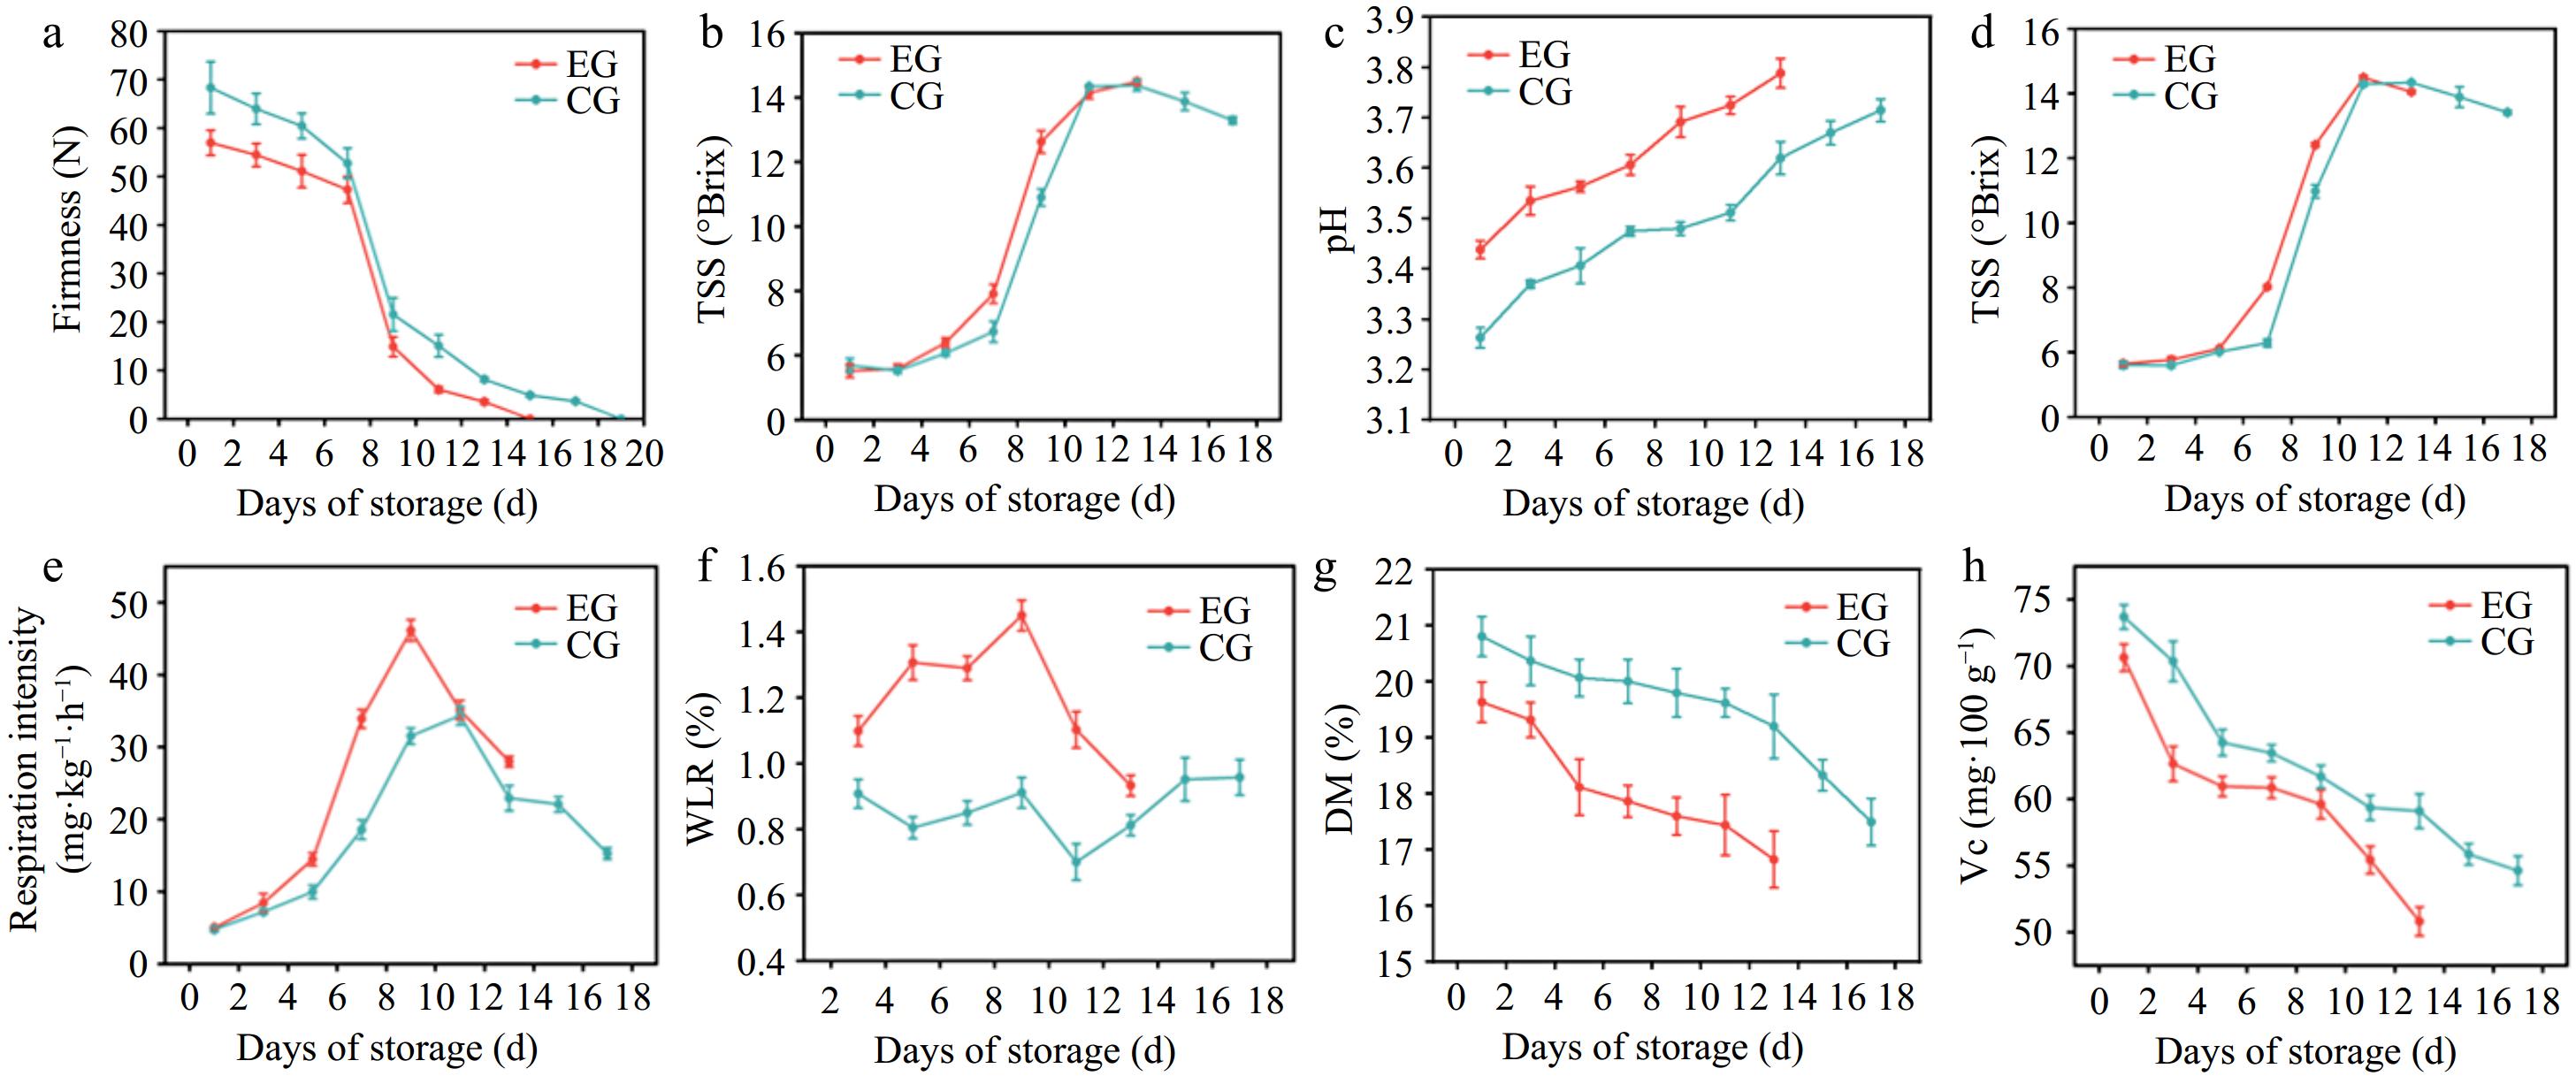
Figure 2.
Effect of CPPU treatment on (a) firmness, (b) TSS, (c) pH, (d) SSC, (e) RI, (f) WLR, (g) DM, and (h) Vitamin C in kiwifruit. EG, kiwifruit with CPPU; CG, kiwifruit without CPPU; TSS, total soluble sugar; SSC, soluble solids content; RI, respiration intensity; WLR, weight loss rate; DM, dry matter; Vc, Vitamin C.
-
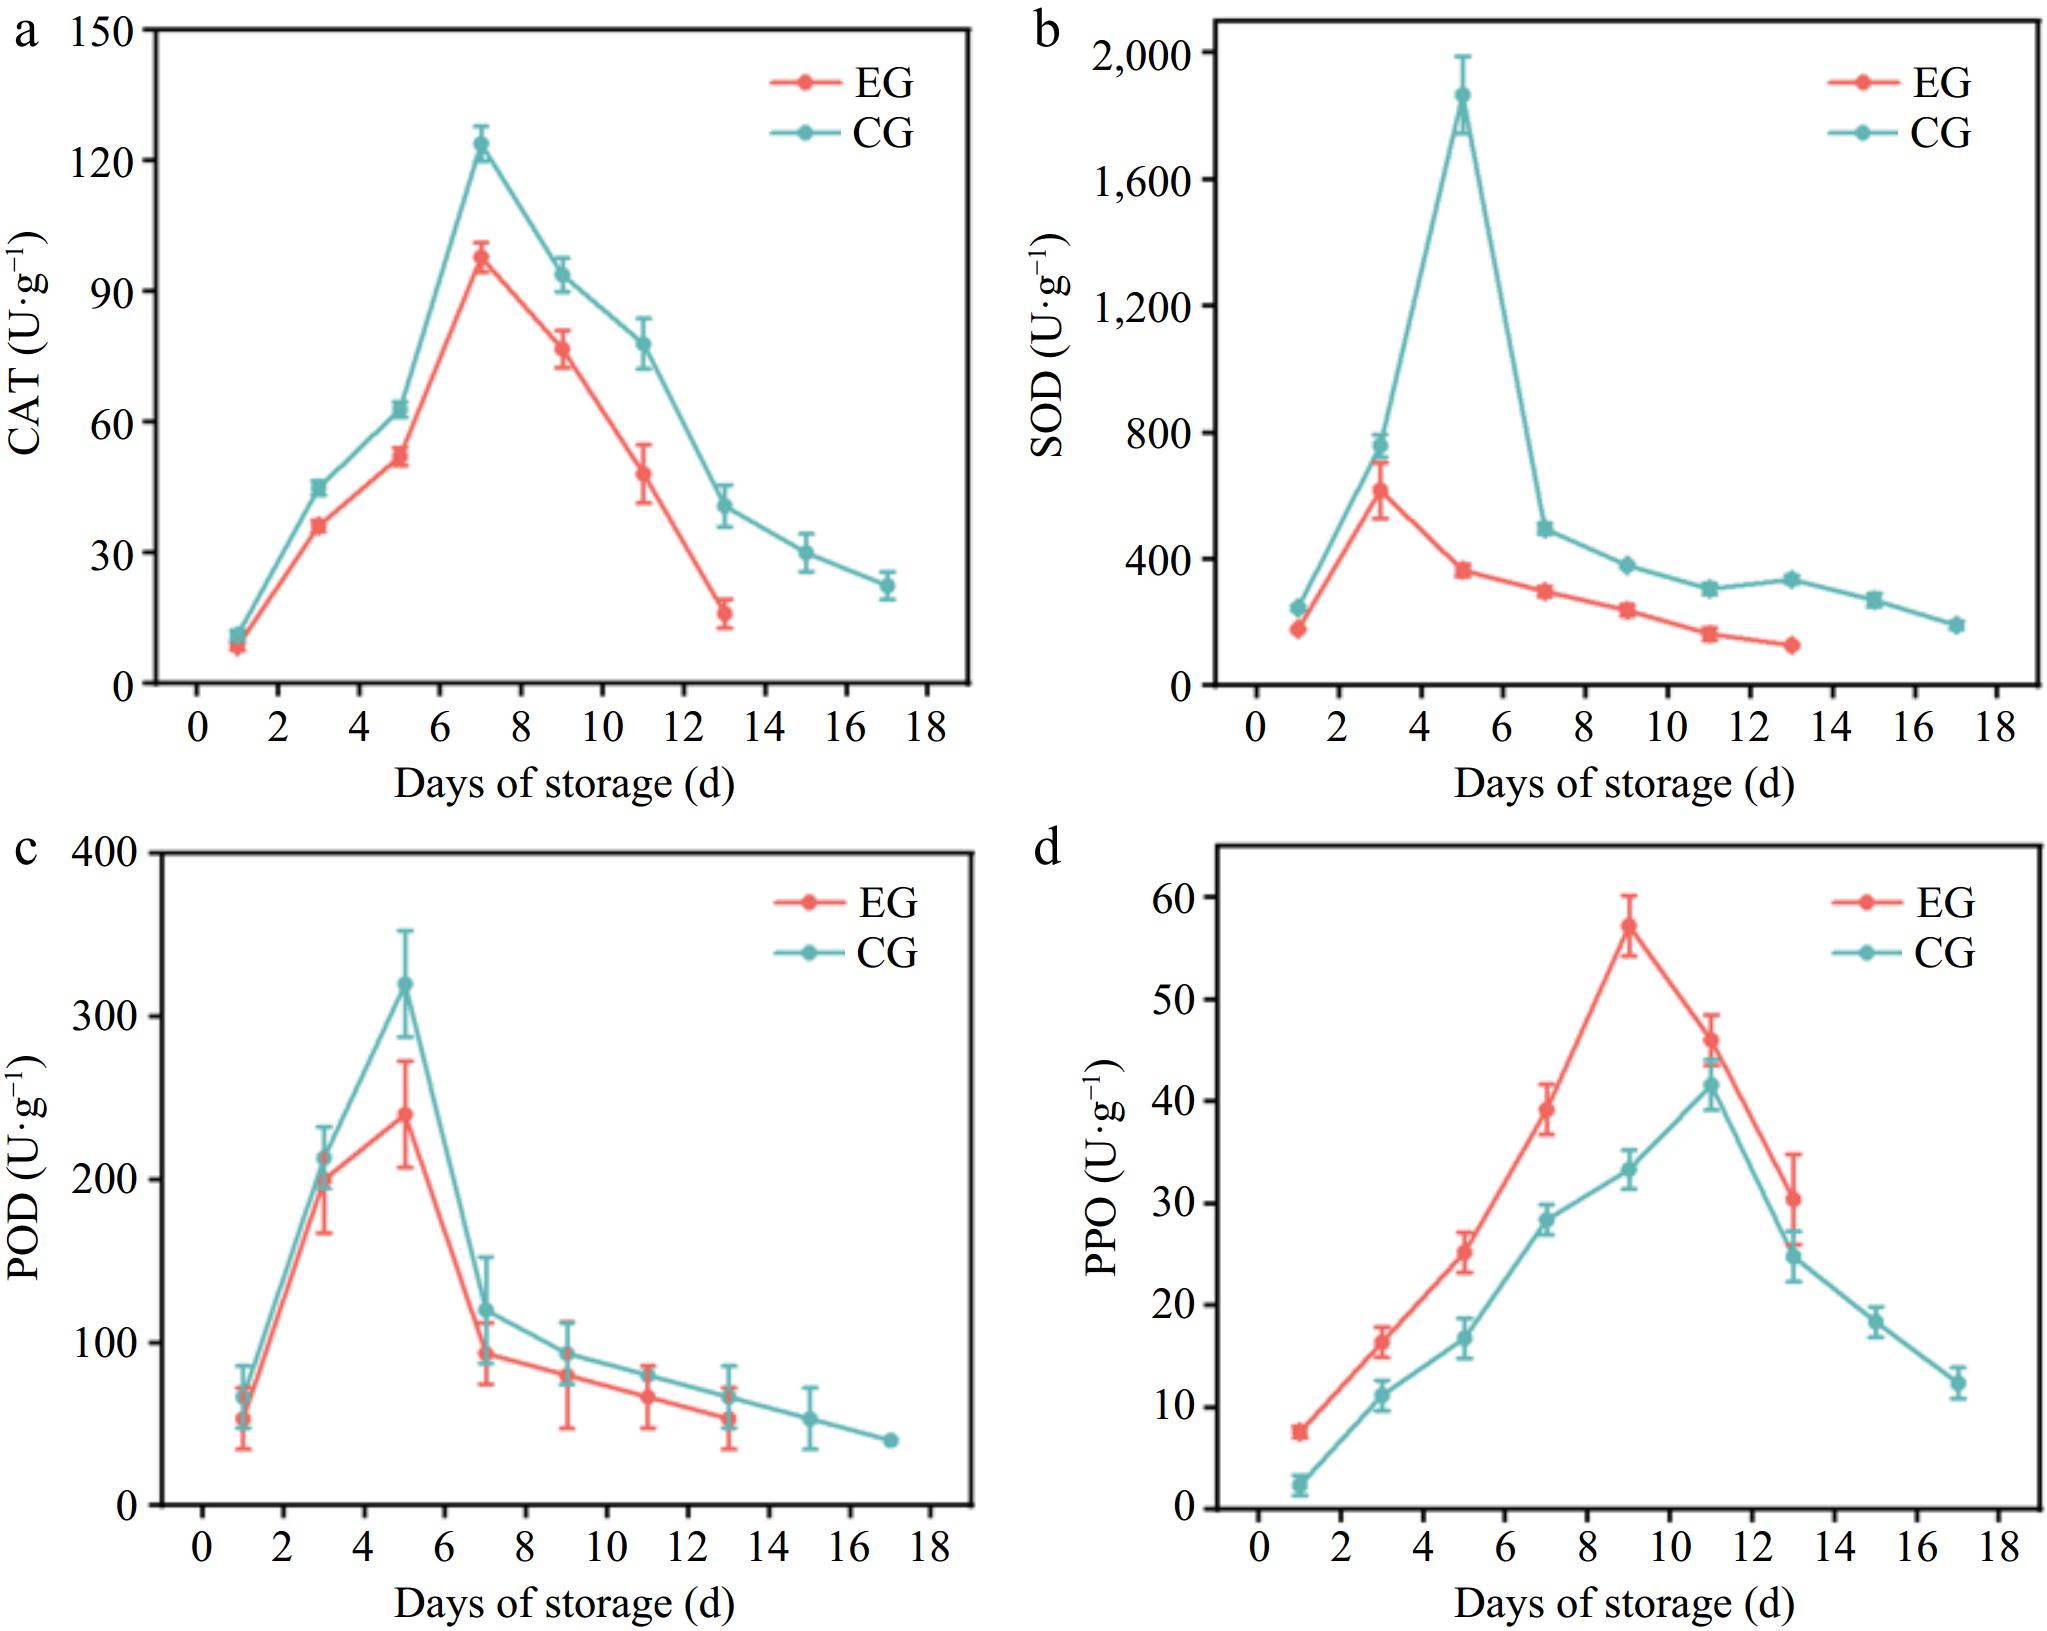
Figure 3.
Effect of CPPU treatment on (a) CAT, (b) SOD, (c) POD, and (d) PPO activity of kiwifruit. EG, kiwifruit with CPPU; CG, kiwifruit without CPPU; CAT, catalase; SOD, superoxide dismutase; POD, peroxidase; PPO, polyphenol oxidase.
-
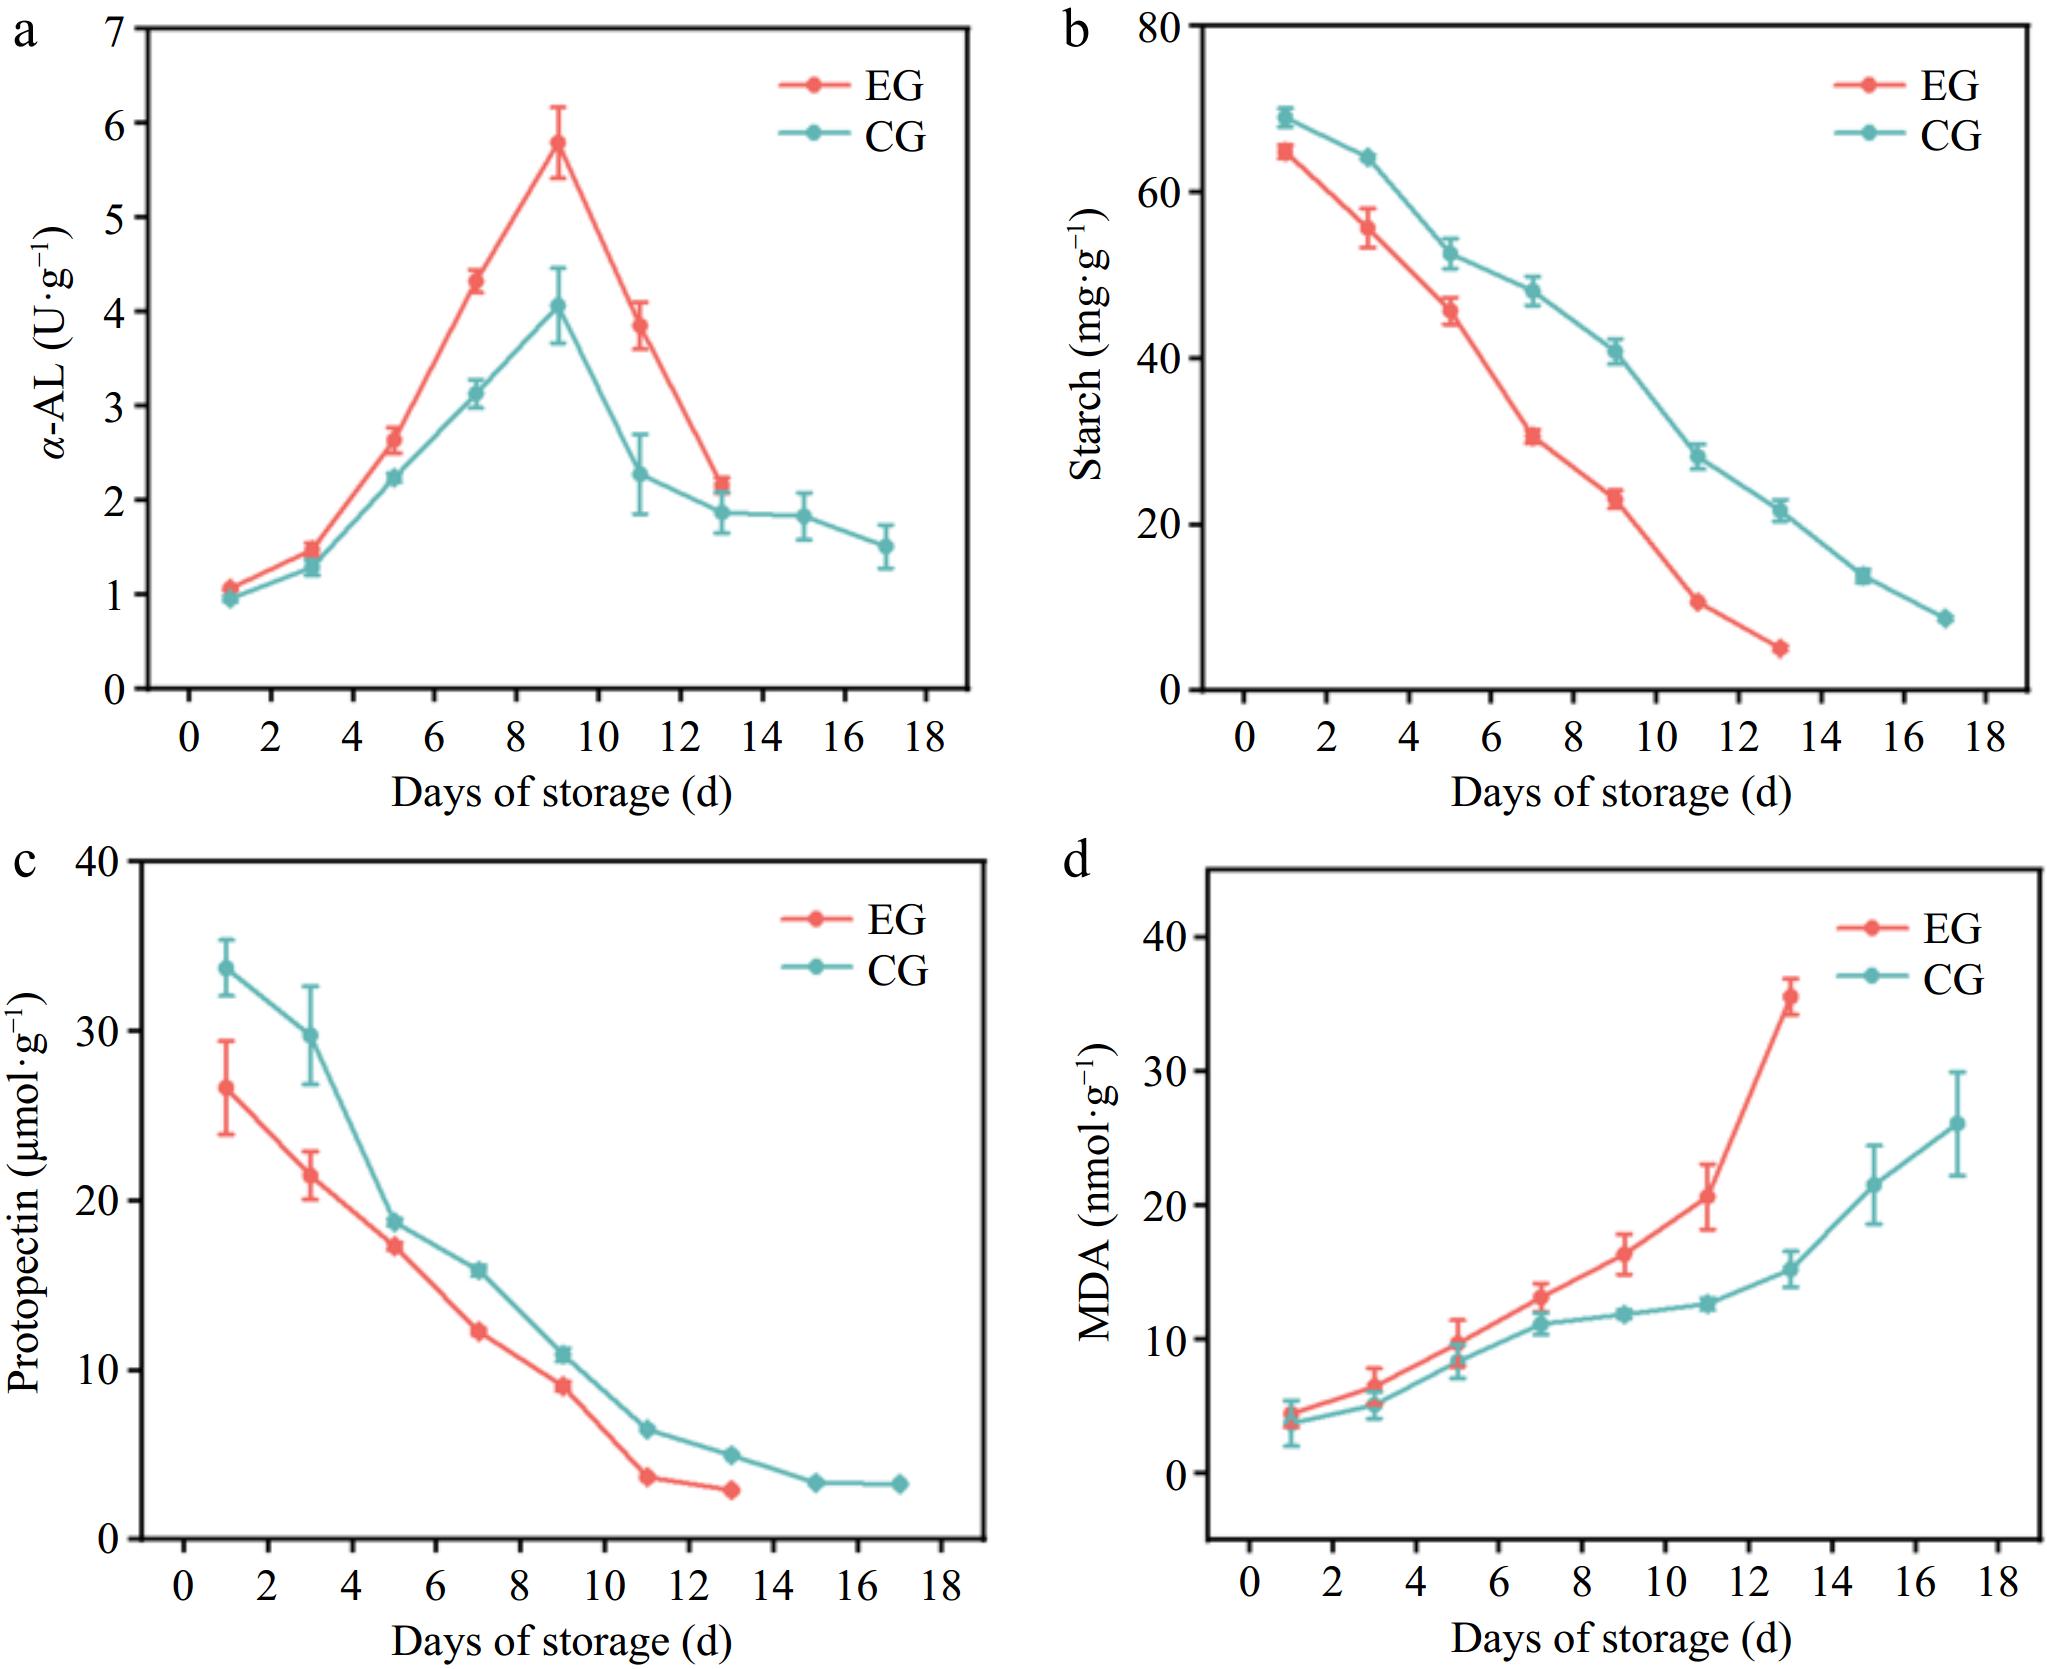
Figure 4.
Effect of CPPU treatment on (a) α-AL activity, (b) starch, (c) protopectin, and (d) MDA content activity of kiwifruit. EG, kiwifruit with CPPU; CG, kiwifruit without CPPU; ɑ-AL, α-amylase; MDA, malondialdehyde.
-
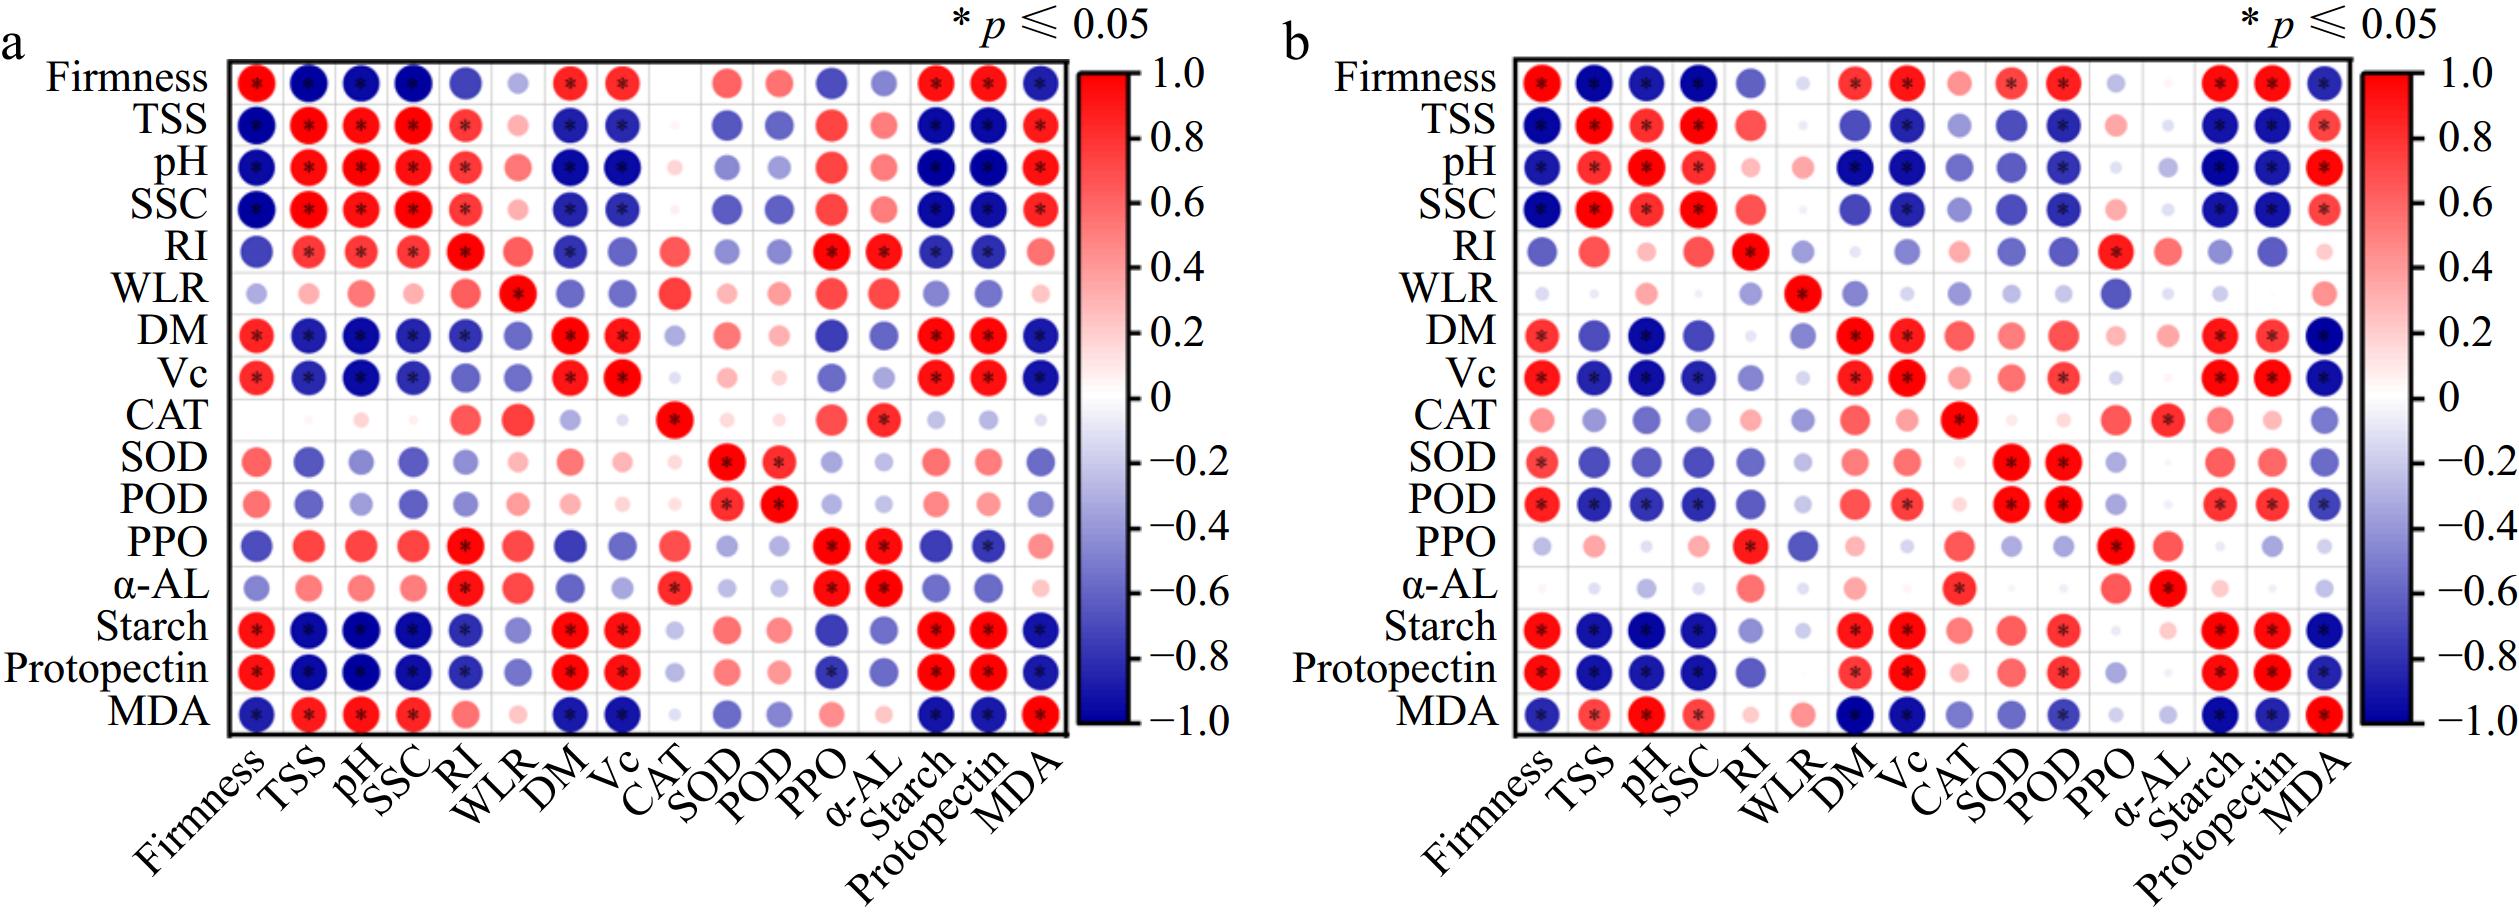
Figure 5.
Correlation analysis of (a) kiwifruit with CPPU treatment and (b) kiwifruit without CPPU treatment.
-
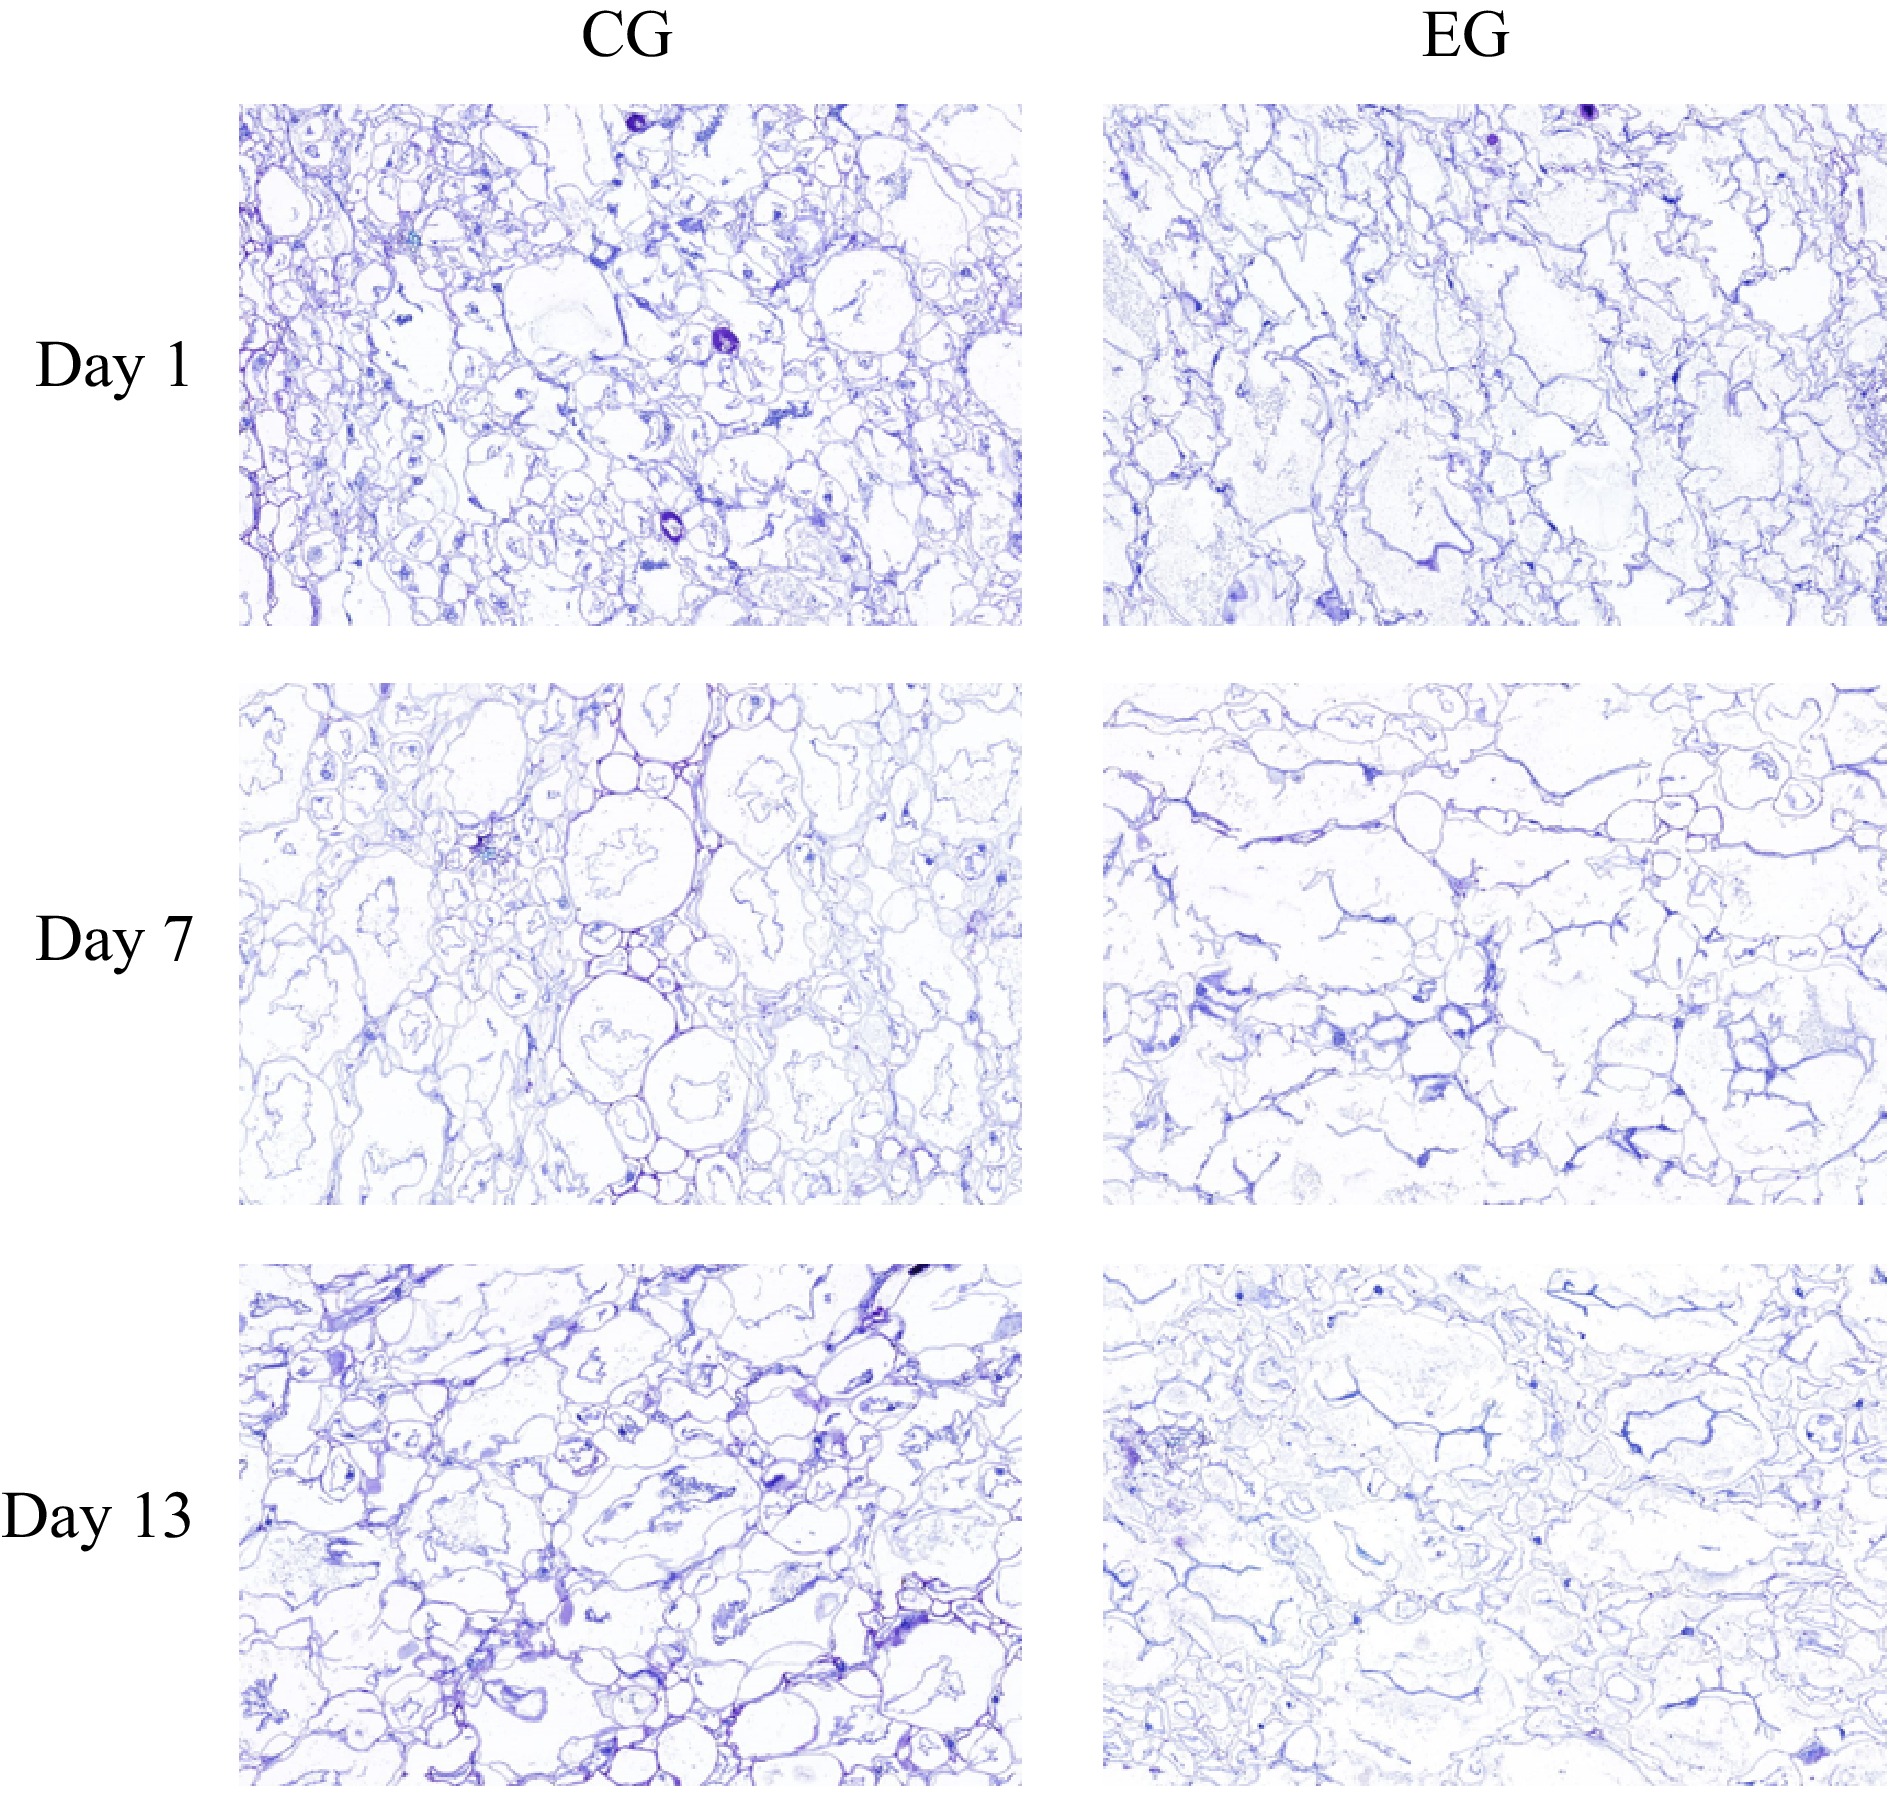
Figure 6.
Effect of CPPU treatment on the cellular structure of kiwifruit. EG, kiwifruit with CPPU; CG, kiwifruit without CPPU.
-
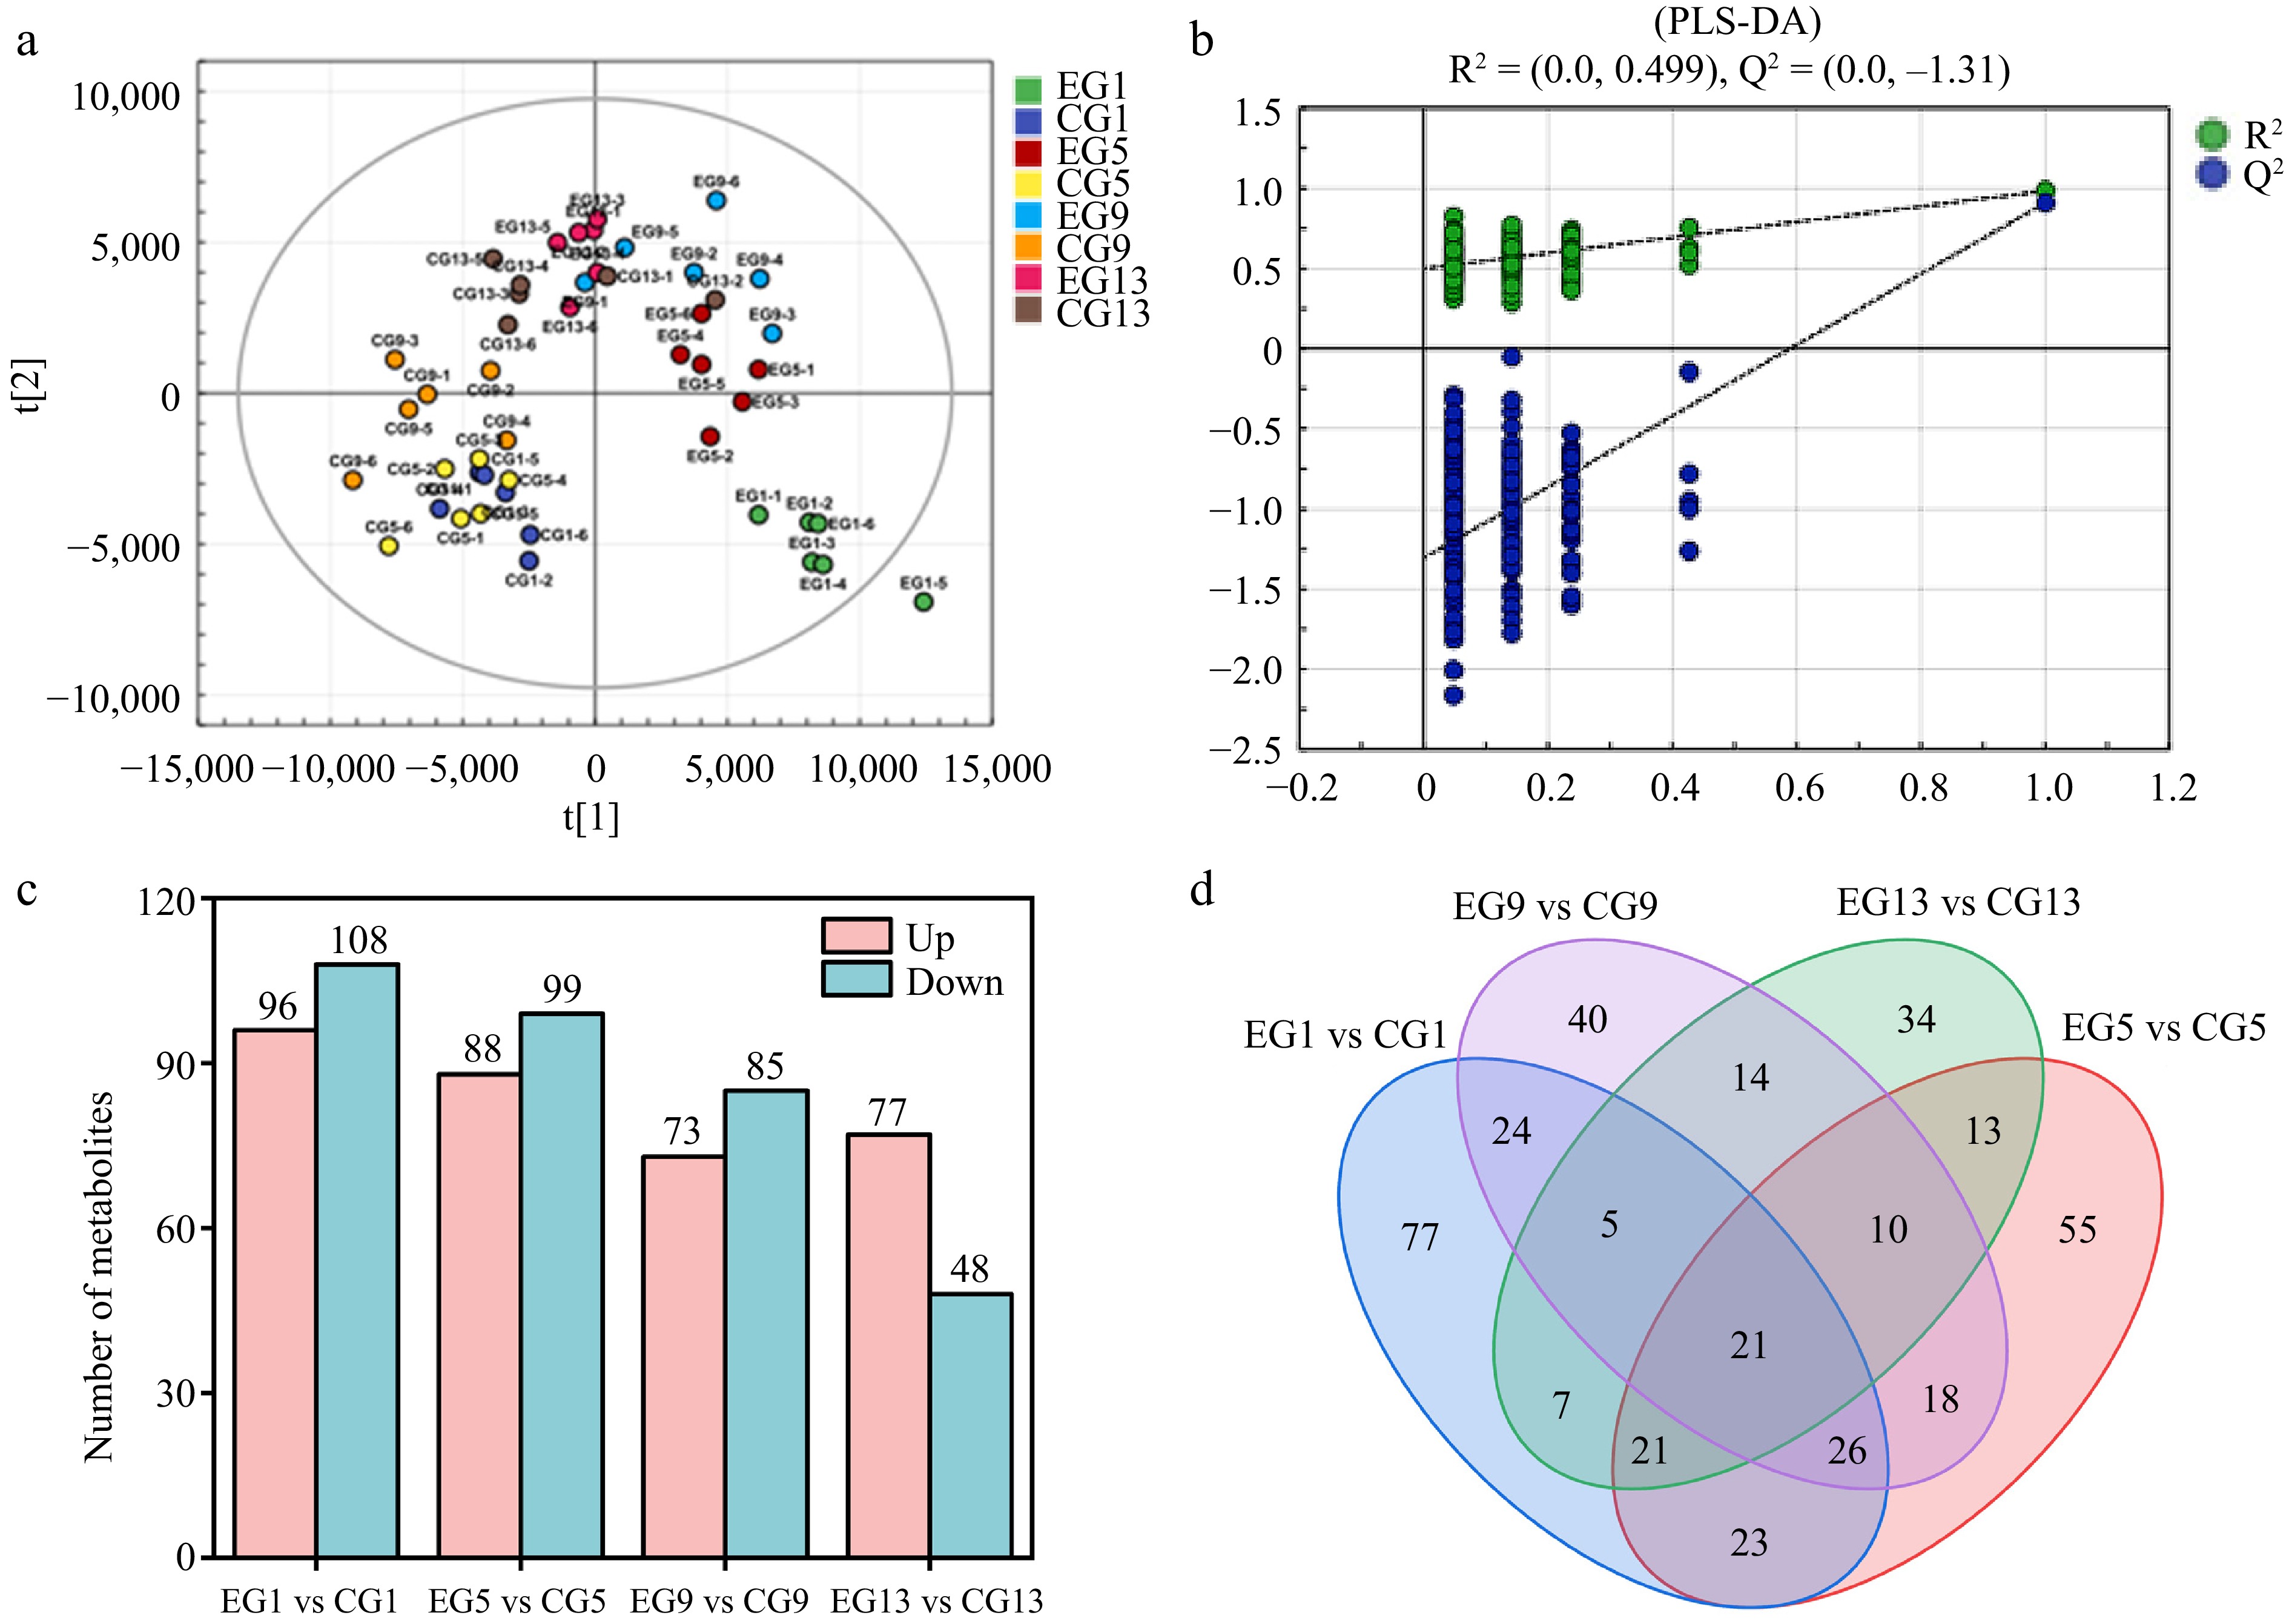
Figure 7.
(a) PLS-DA analysis chart, (b) replacement test chart, and (c) statistics of differential metabolites. (d) Venn chart of different metabolites: EG1, EG5, EG9, and EG13, Kiwifruit with CPPU on Days 1, 5, 9, and 13, respectively; CG1, CG5, CG9, and CG13, kiwifruit without CPPU on Days 1, 5, 9, and 13, respectively.
-
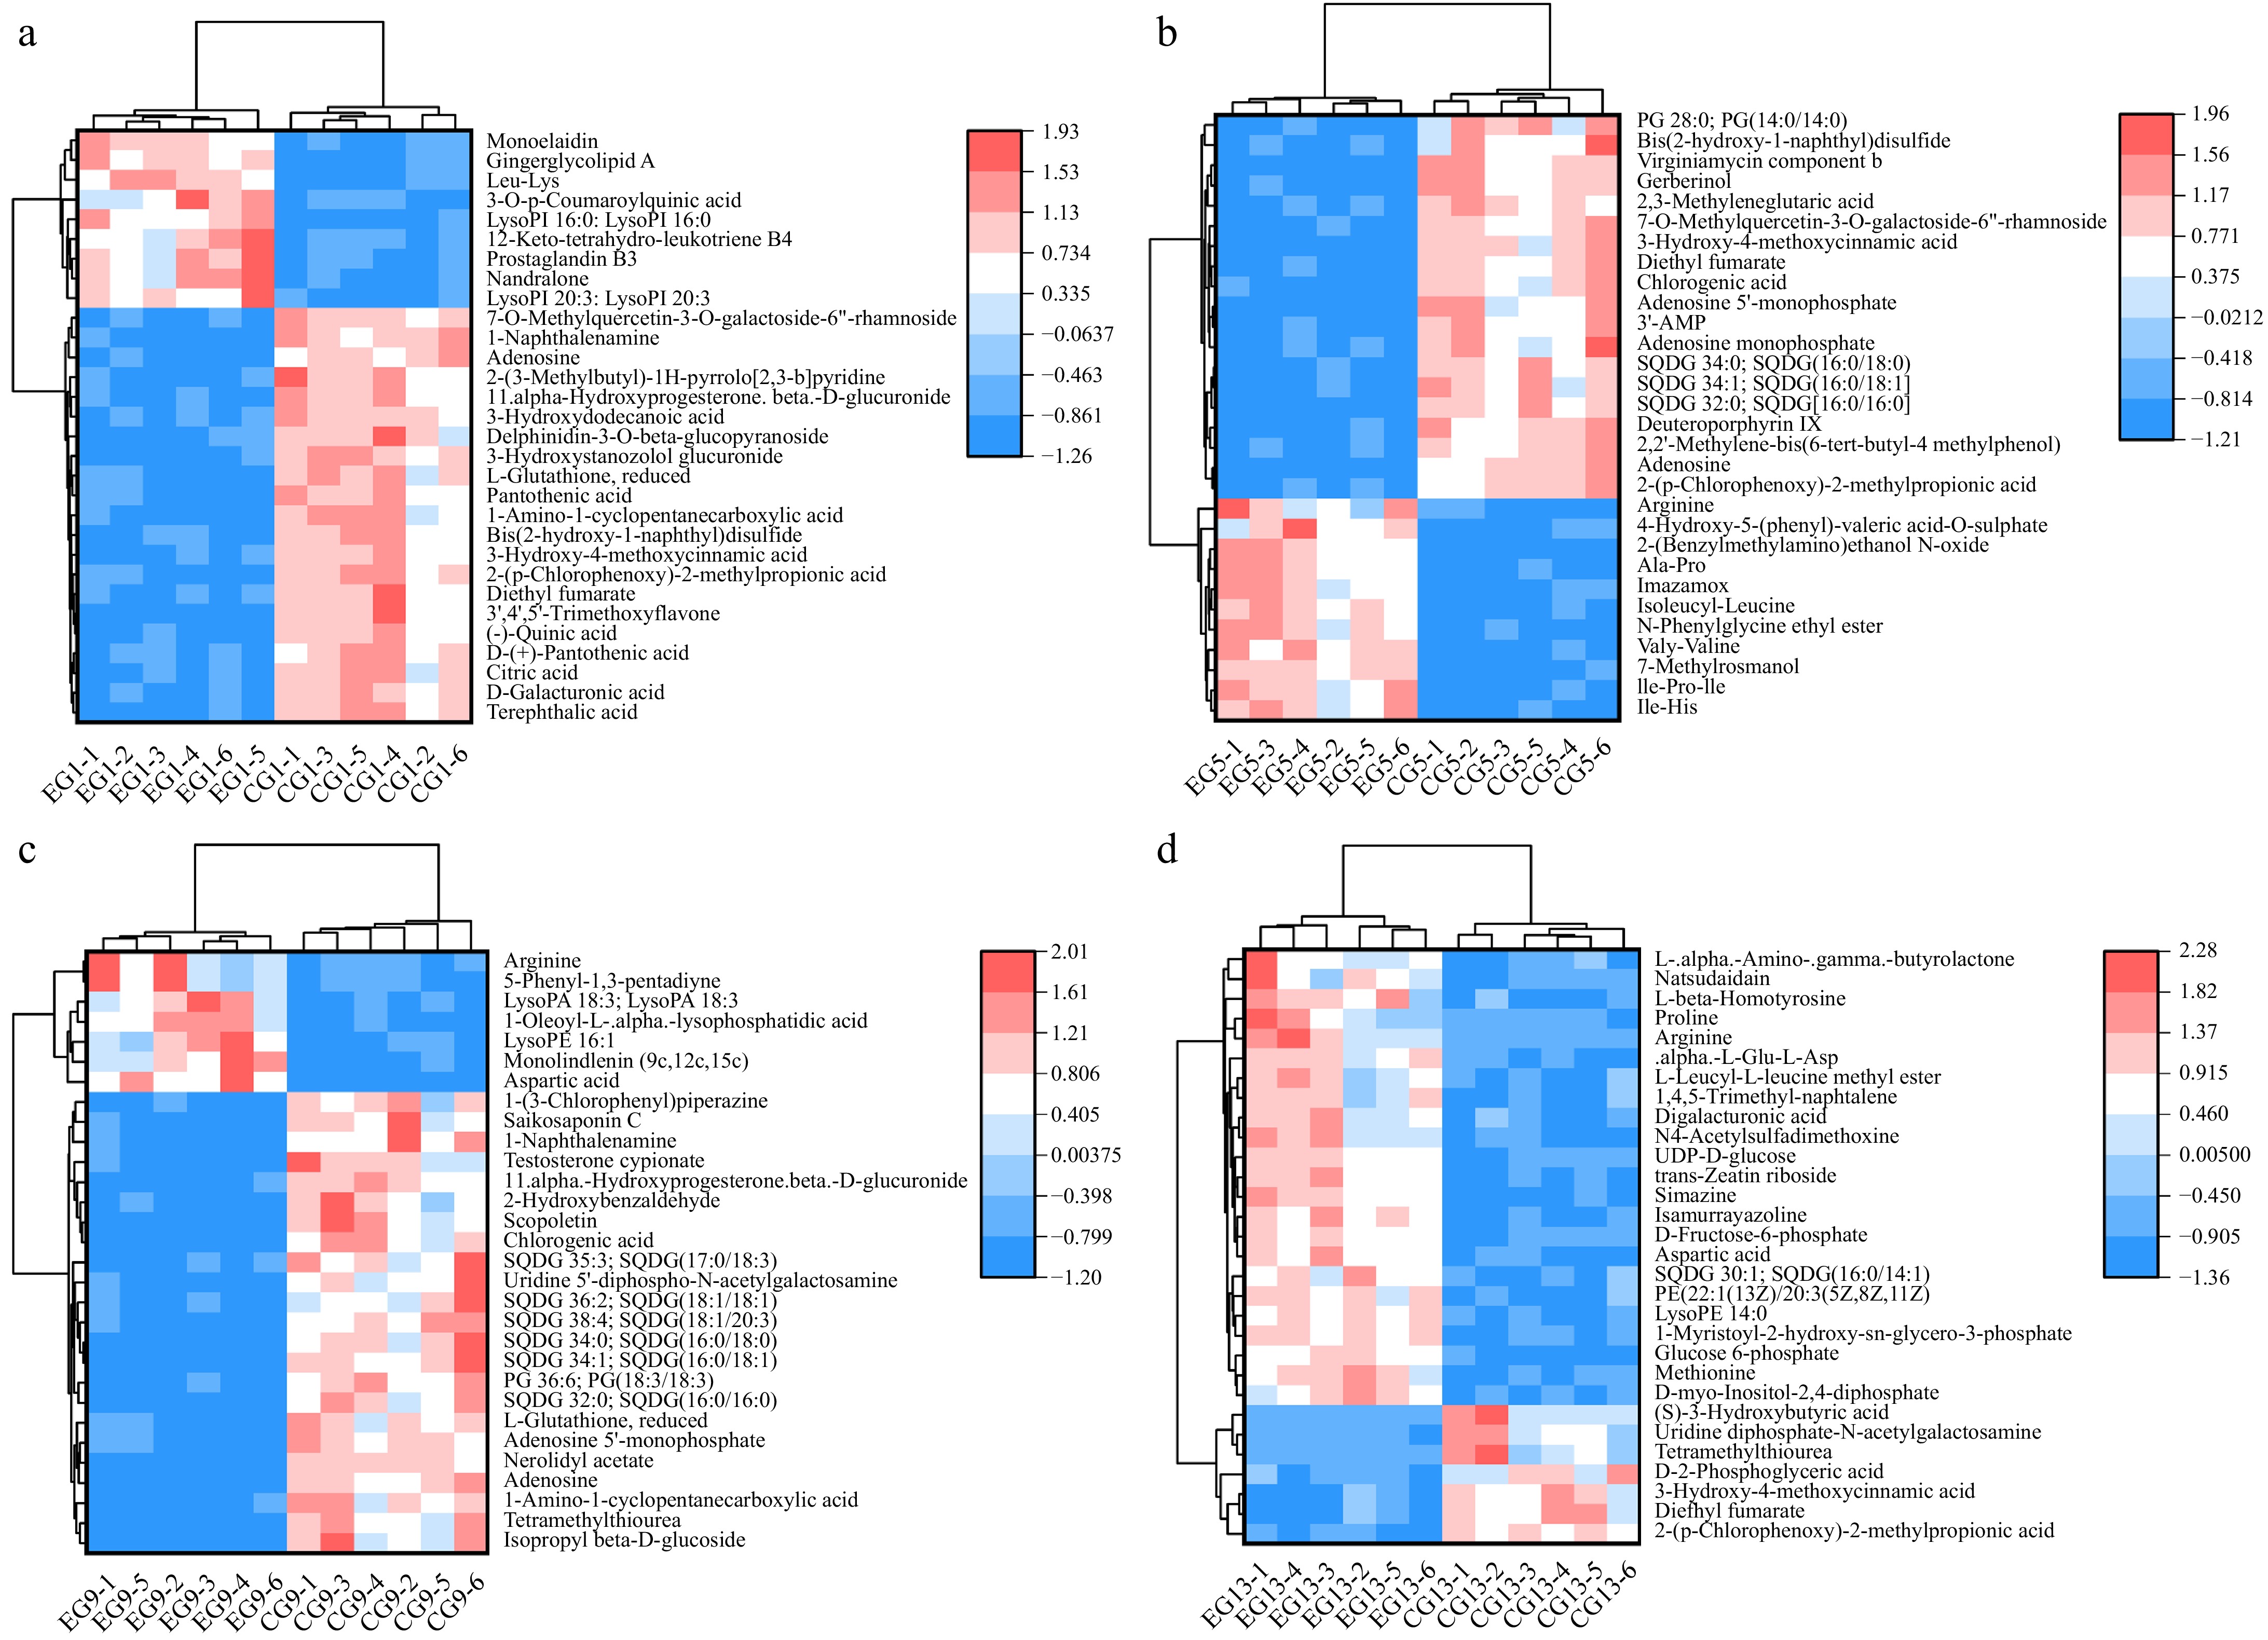
Figure 8.
Heatmap of different metabolites. (a) Heatmap of different metabolites on Day 1; (b) heatmap of different metabolites on Day 5; (c) heatmap of different metabolites on Day 9; (d) heatmap of different metabolites on Day 13.
-
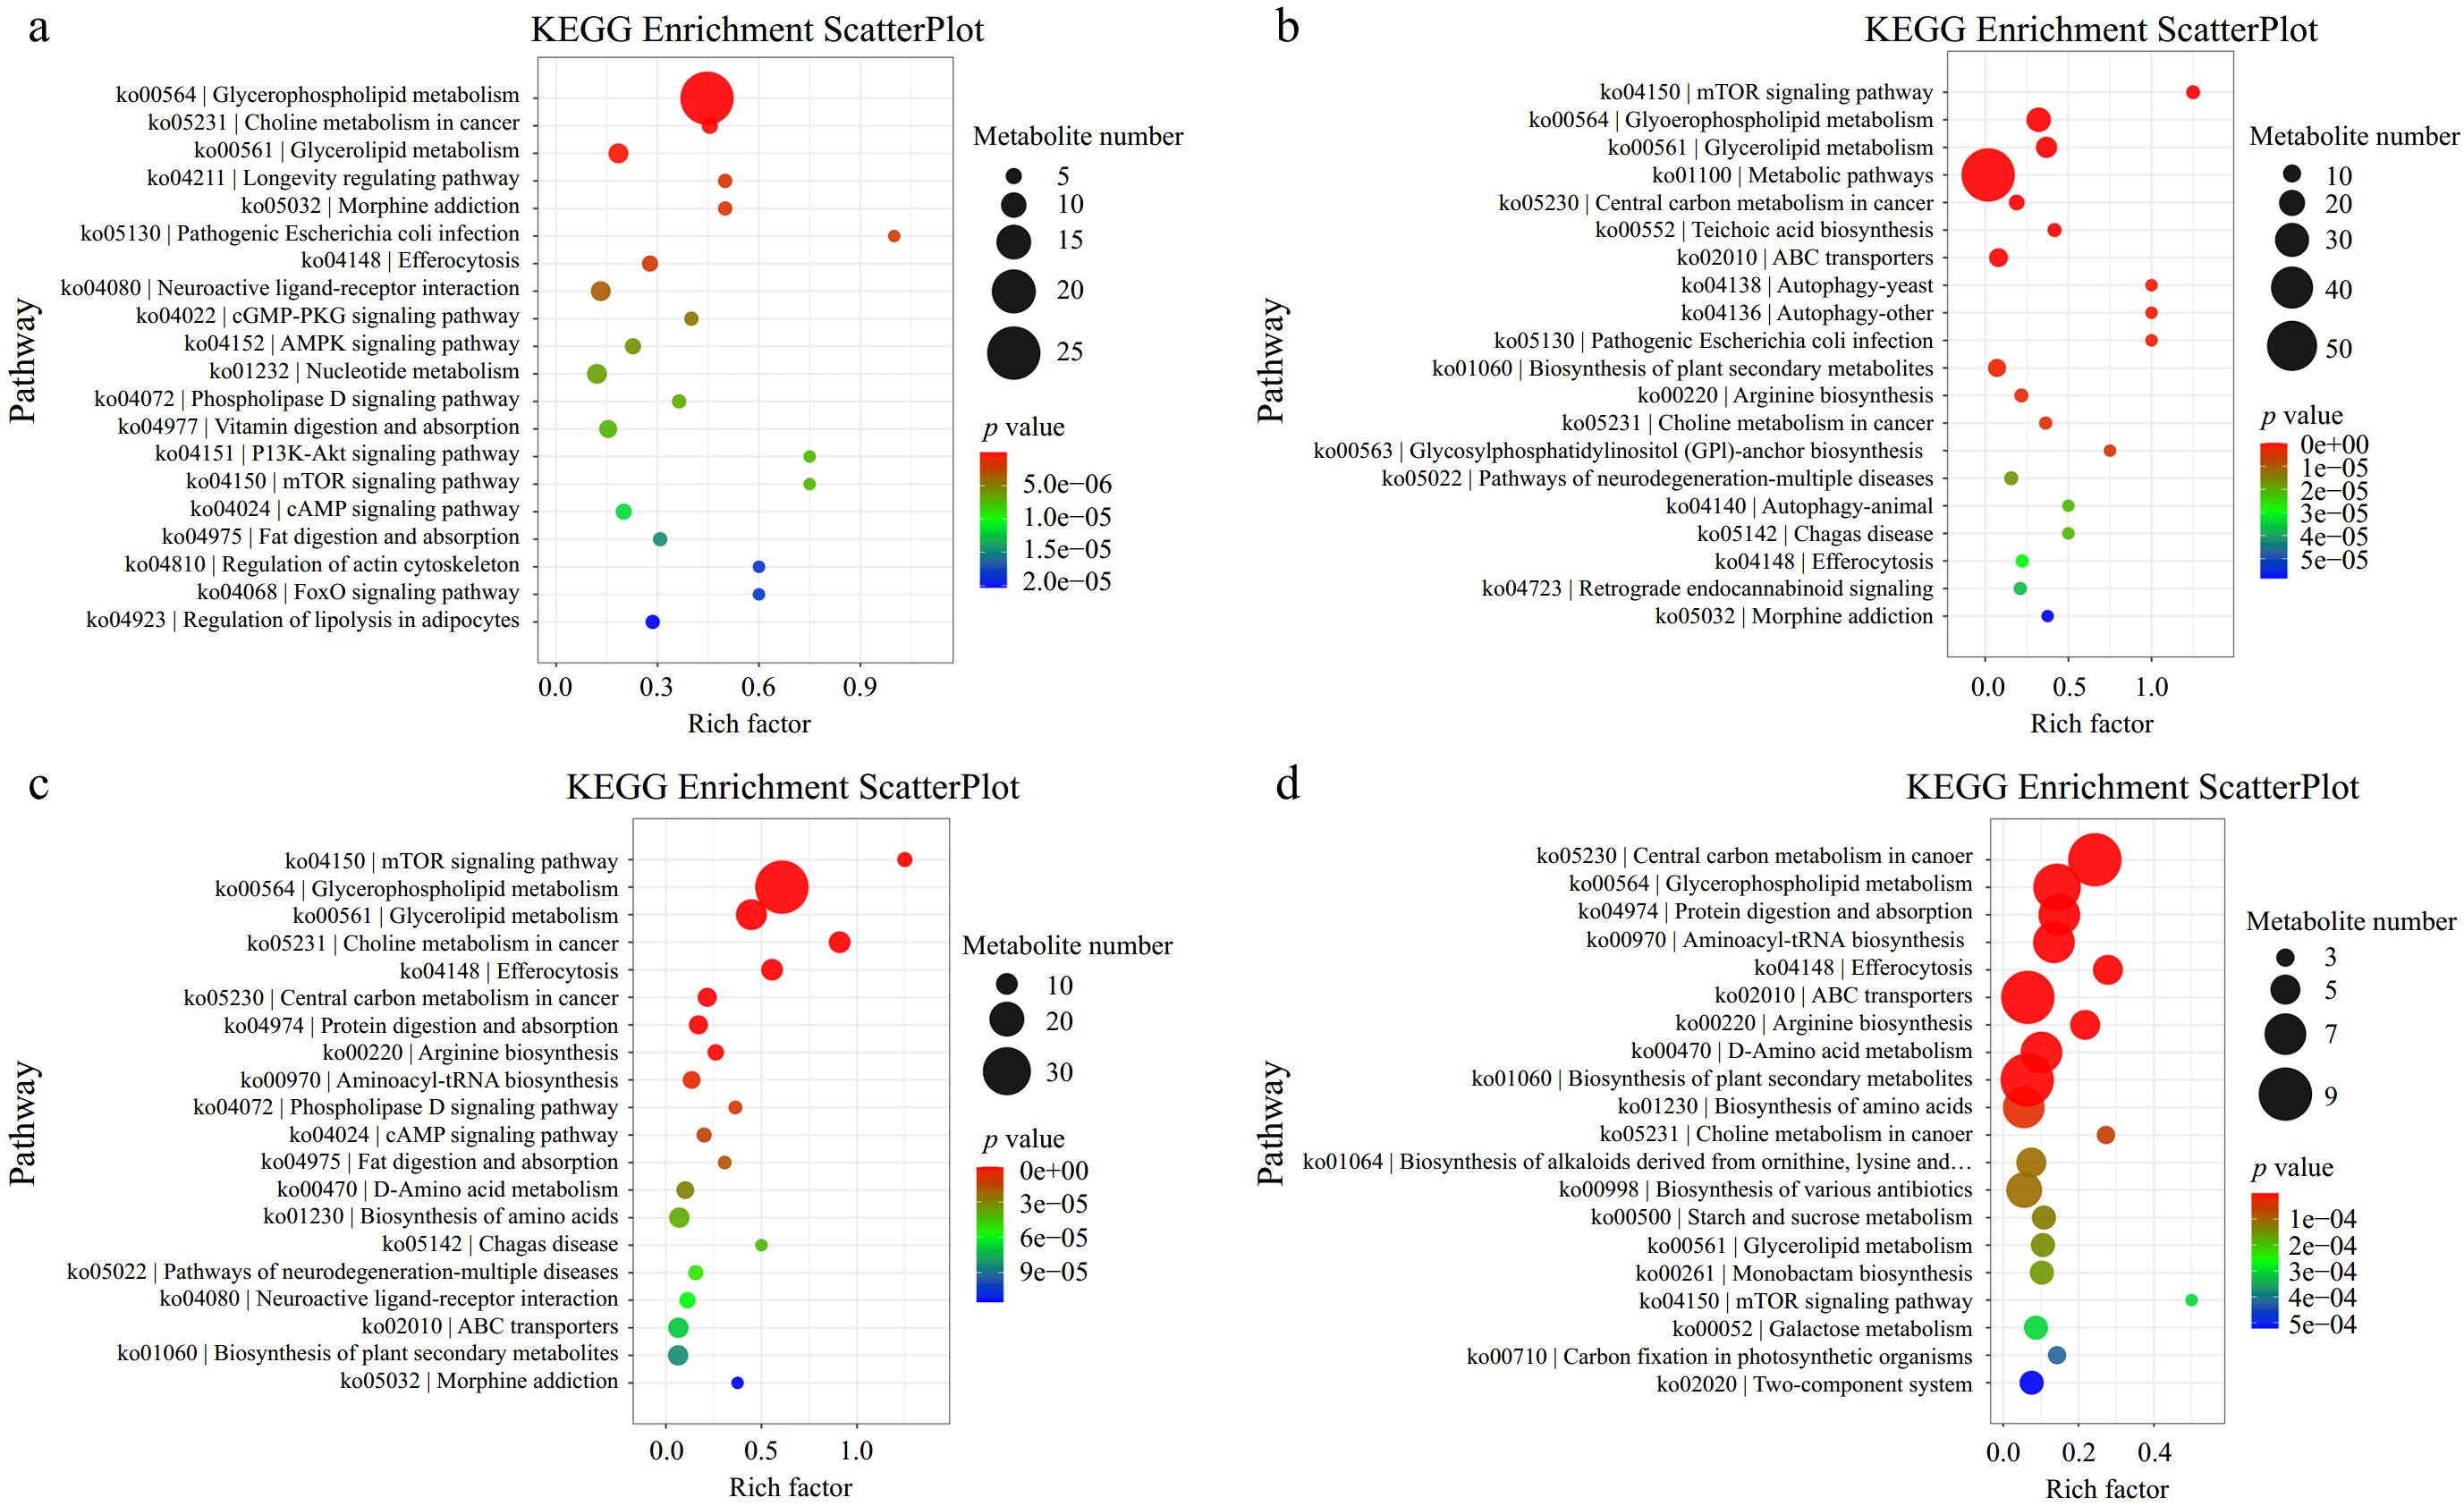
Figure 9.
KEGG enrichment graph of different metabolites. (a) KEGG enrichment plots of different metabolites on Day 1; (b) KEGG enrichment plots of different metabolites on Day 5; (c) KEGG enrichment plots of different metabolites on Day 9; (d) KEGG enrichment plots of different metabolites on Day 13.
Figures
(9)
Tables
(0)