-
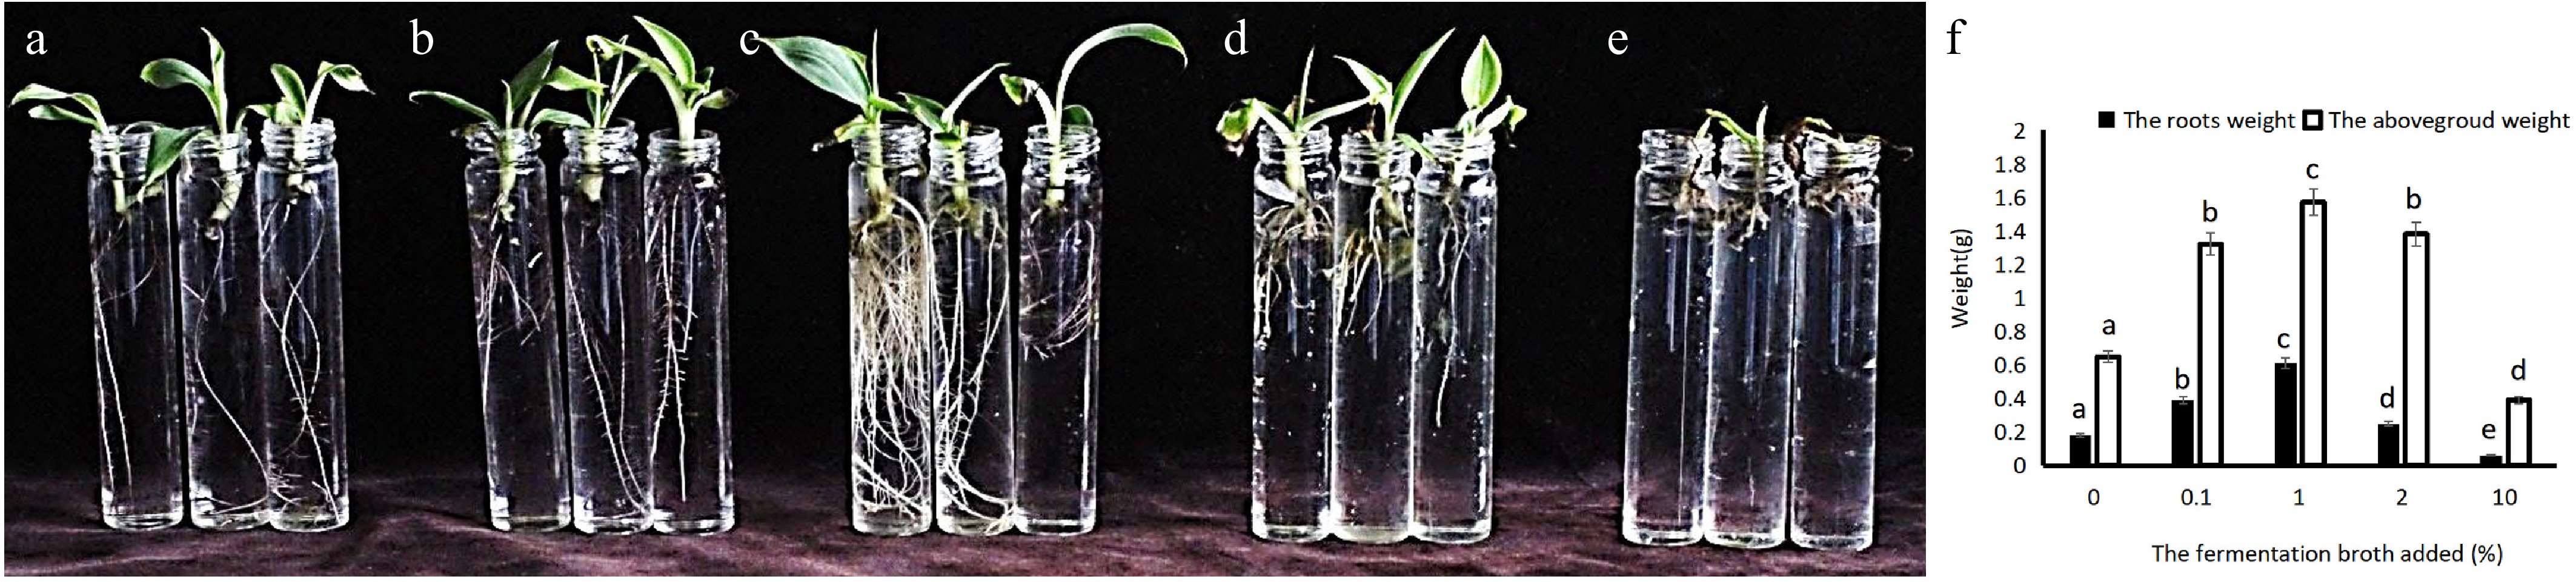
Figure 1.
Growth effect of S. alfalfae 5406 fermentation broth on banana seedlings. (a) Soil extracts. (b) 0.1% concentration of the fermentation broth. (c) 1% of the fermentation broth. (d) 2% of the fermentation broth. (e) 10% of the fermentation broth. (f) Root and shoot weight of the banana seedlings. Different letters above the bars indicate significant differences between samples at the level of p < 0.05.
-
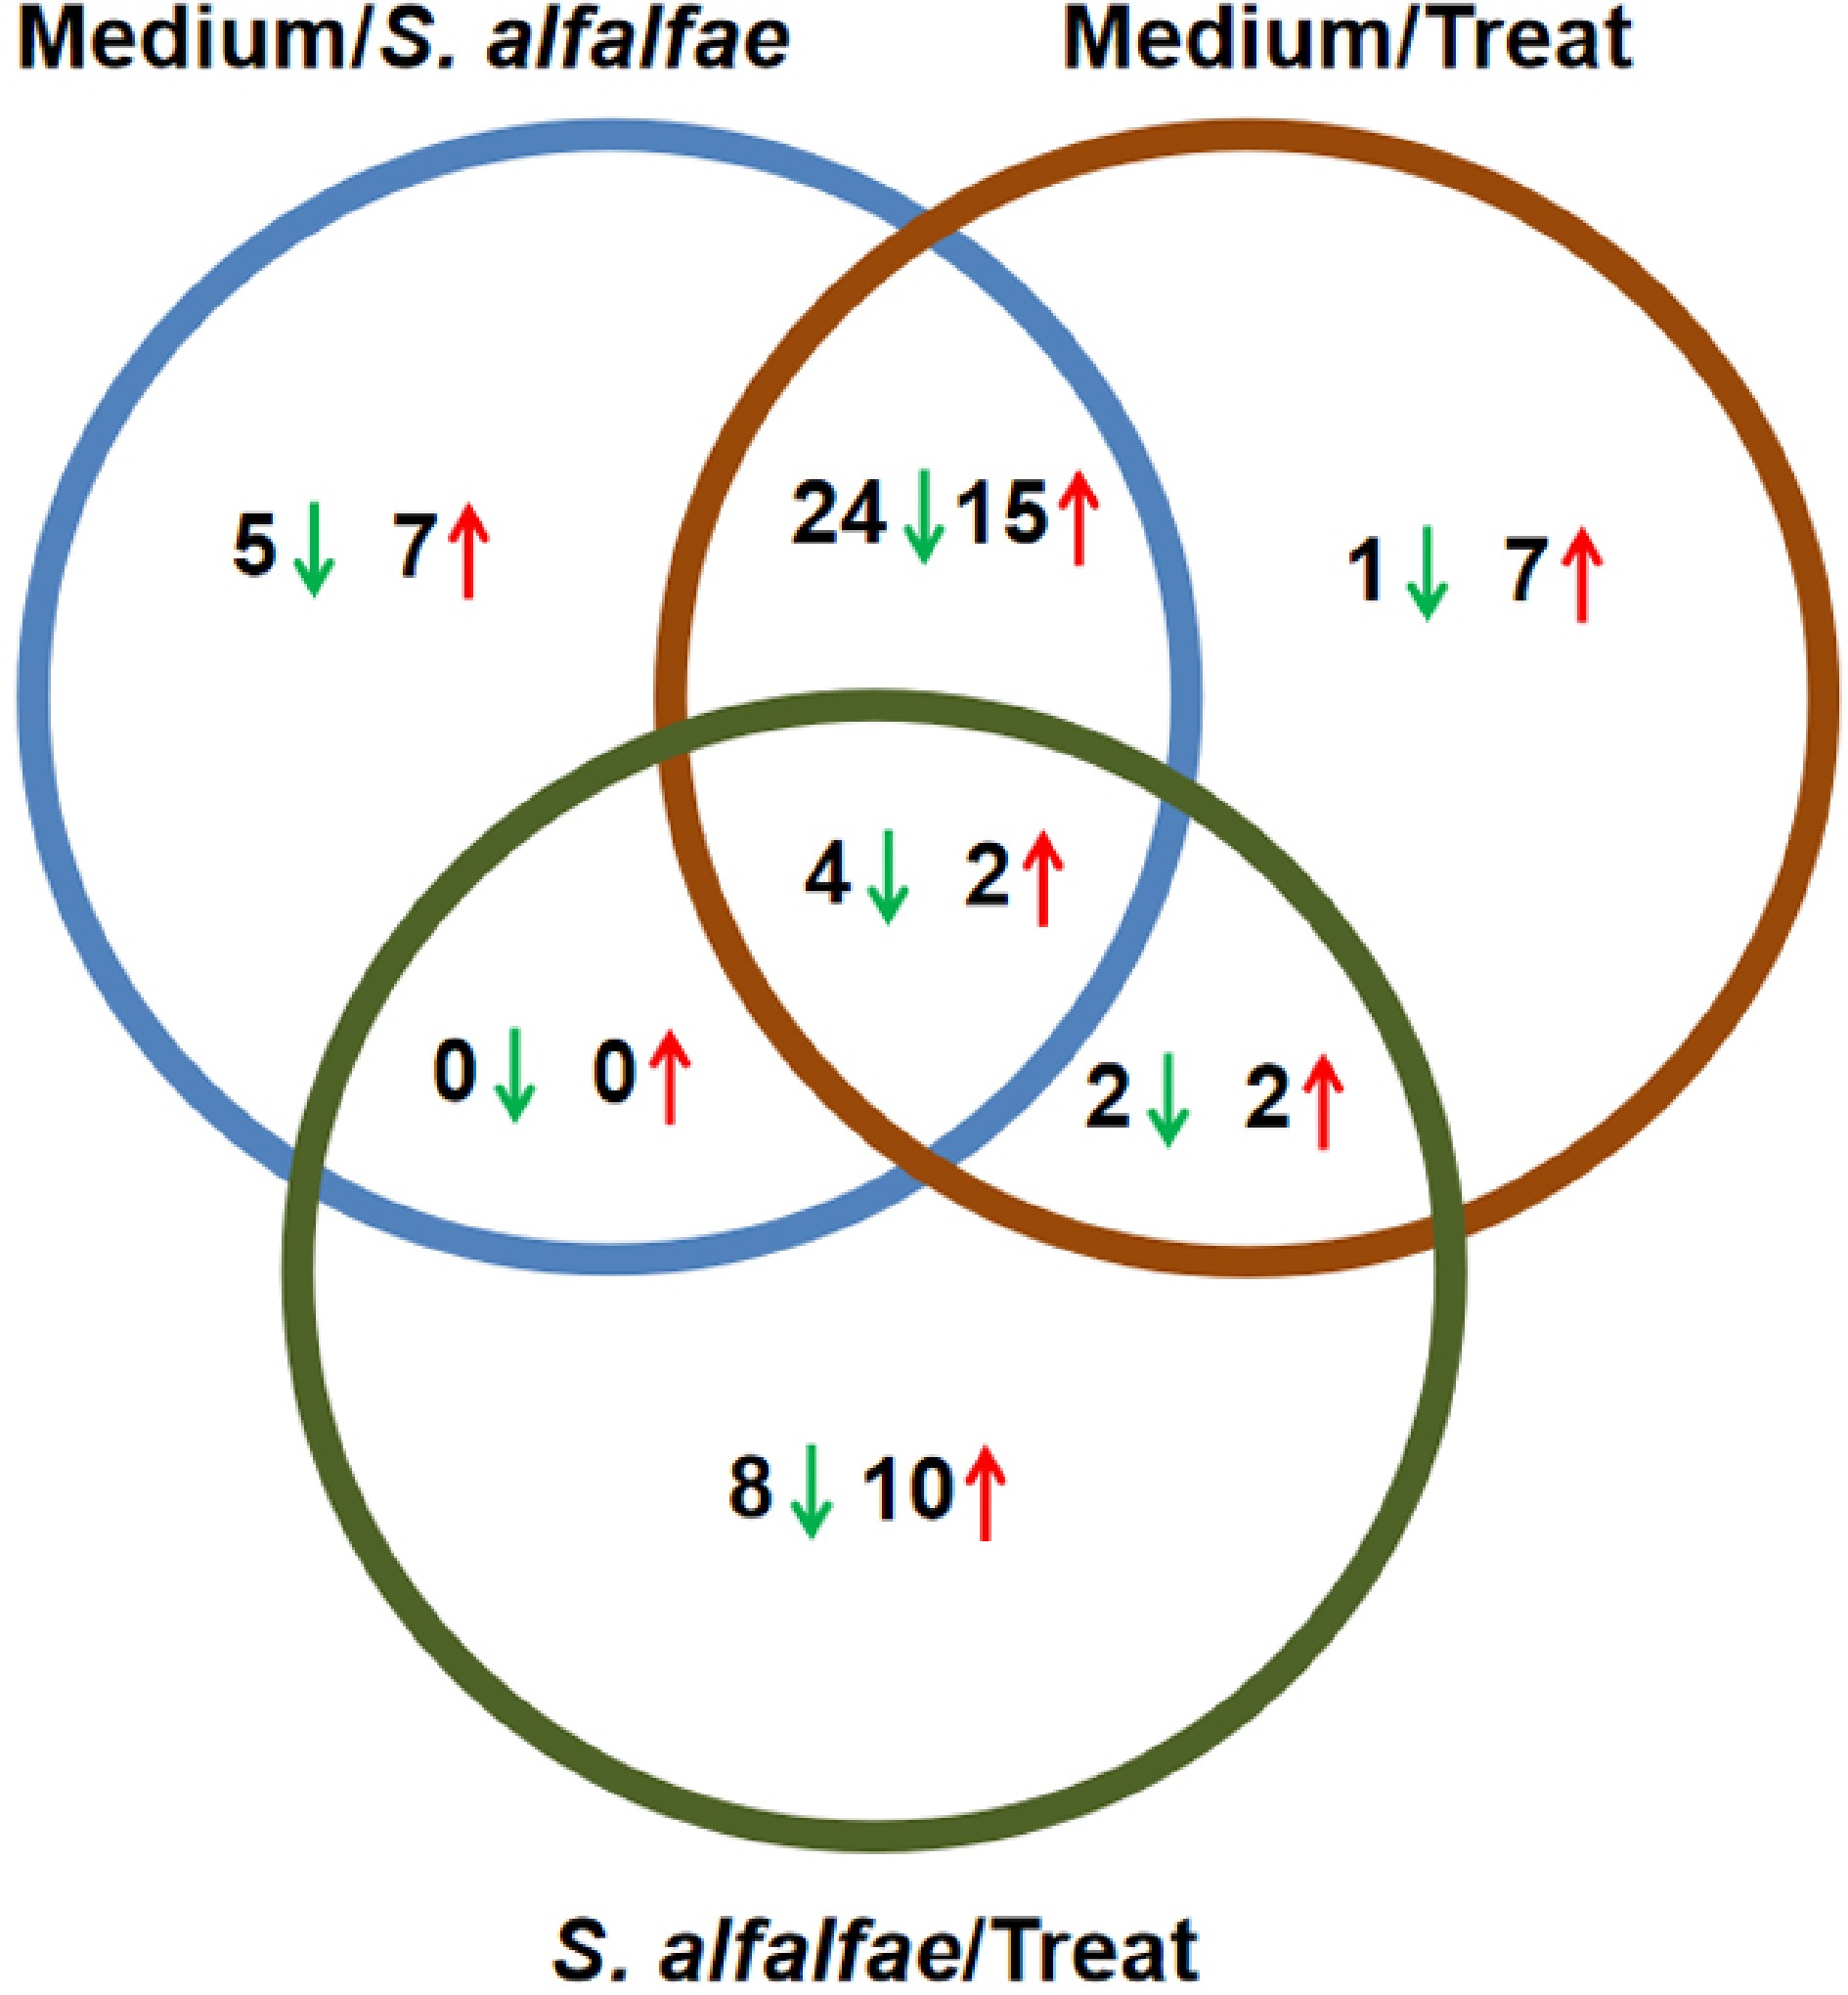
Figure 2.
Venn diagram for differentially expressed hormone-like substances. The numbers represent differentially expressed substances identified from comparisons among the medium, S. alfalfae 5406, and the treatment group. Green arrows denote down-regulated substances, while red arrows indicate up-regulated ones.
-
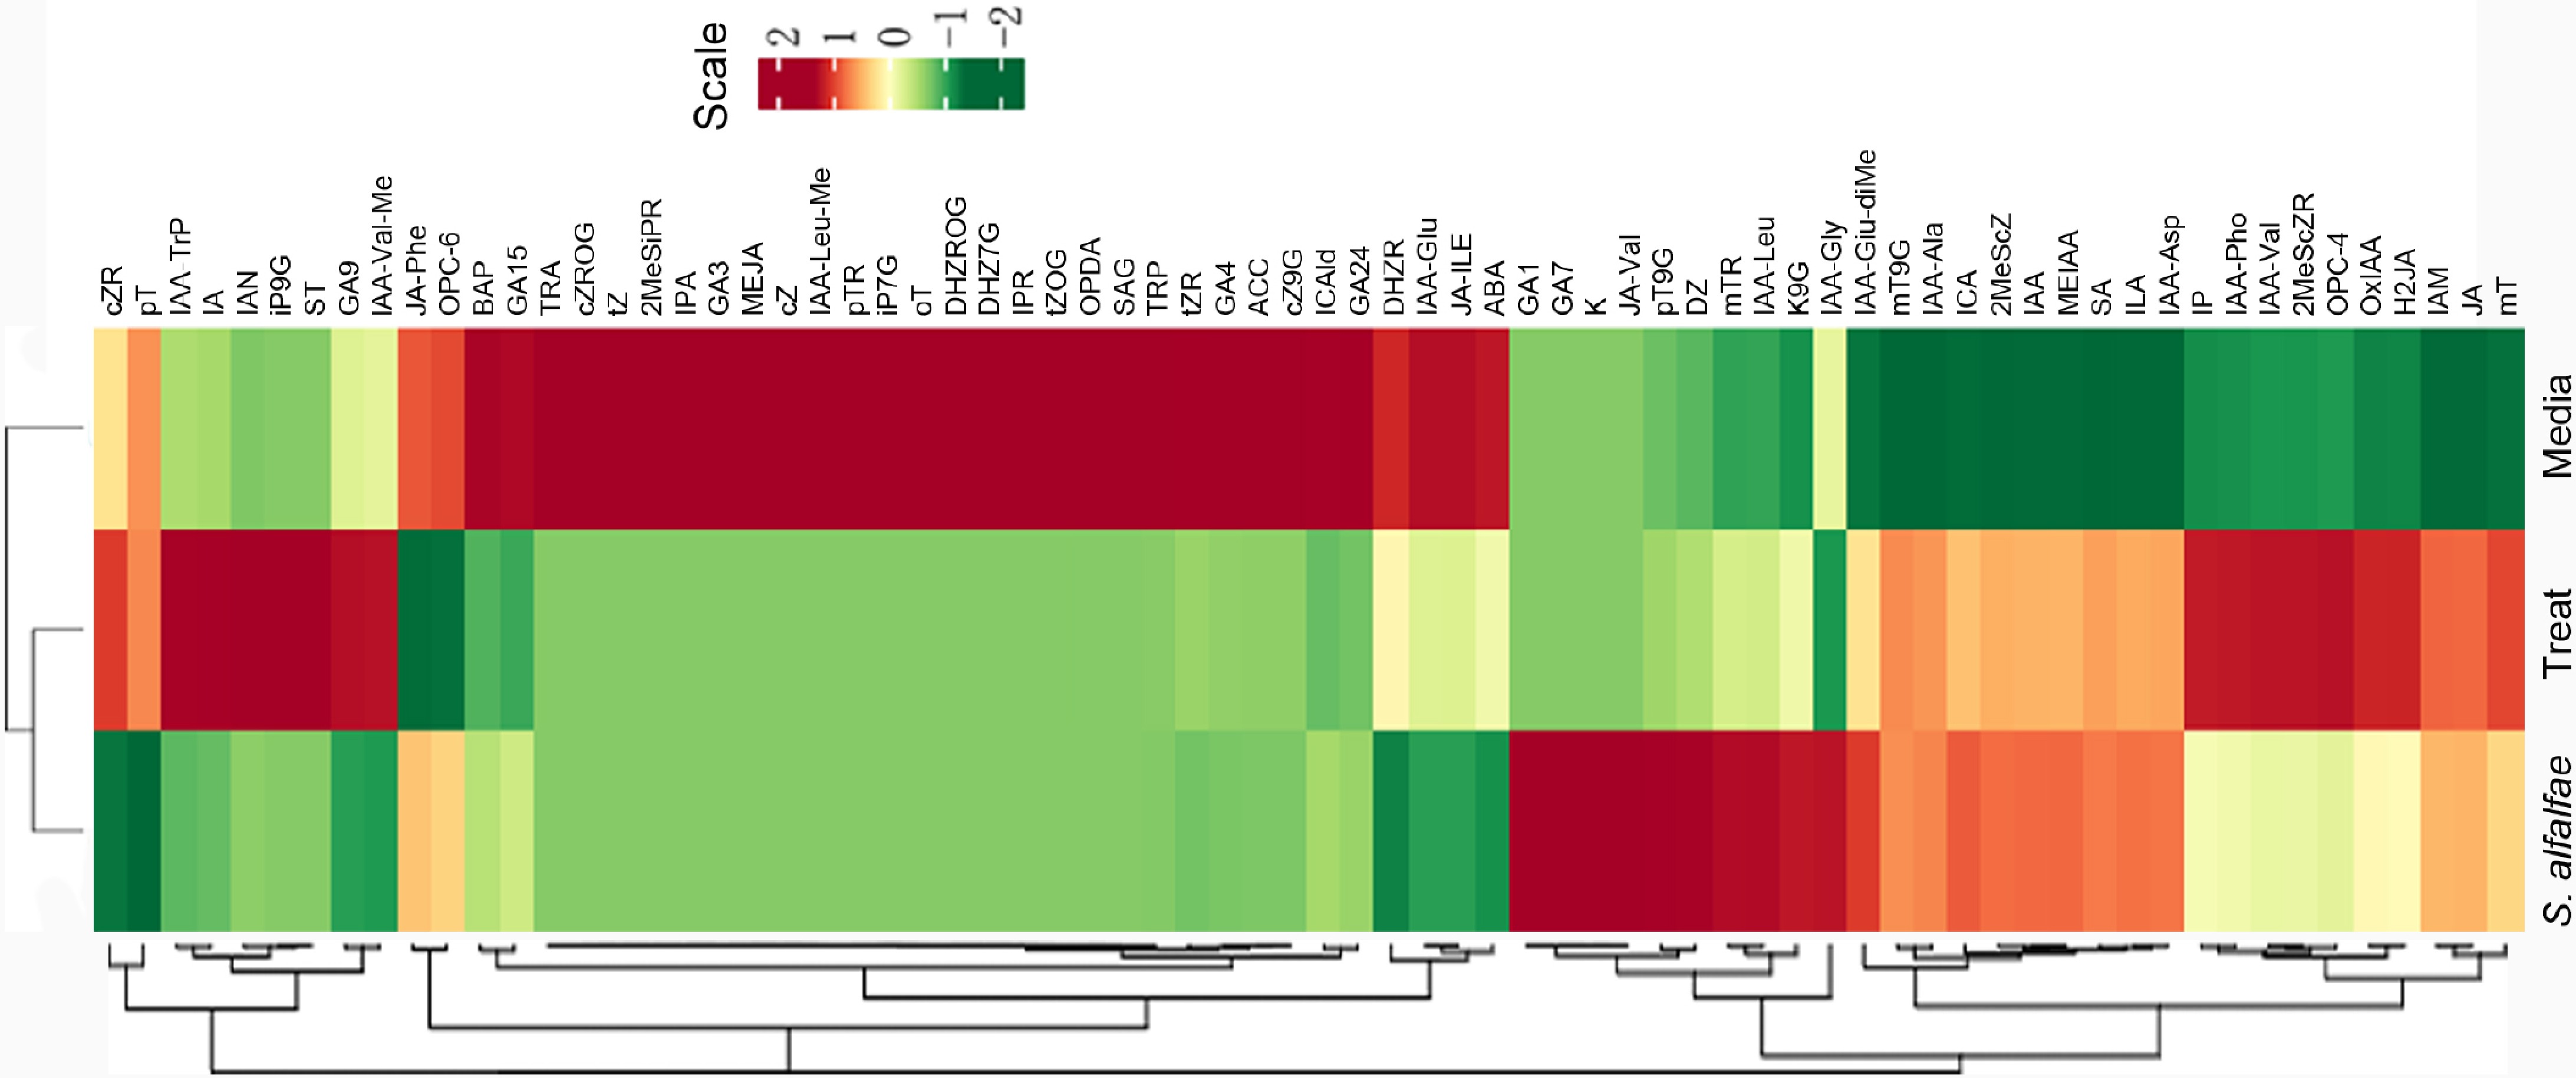
Figure 3.
Cluster analysis of metabolites and samples. The horizontal axis represents the sample name, while the vertical axis shows metabolite information. Colors indicate standardized relative abundance values, with red representing high content and green representing low content. The dendrogram on the left displays metabolite clustering, and the dendrogram at the top shows sample clustering.
-
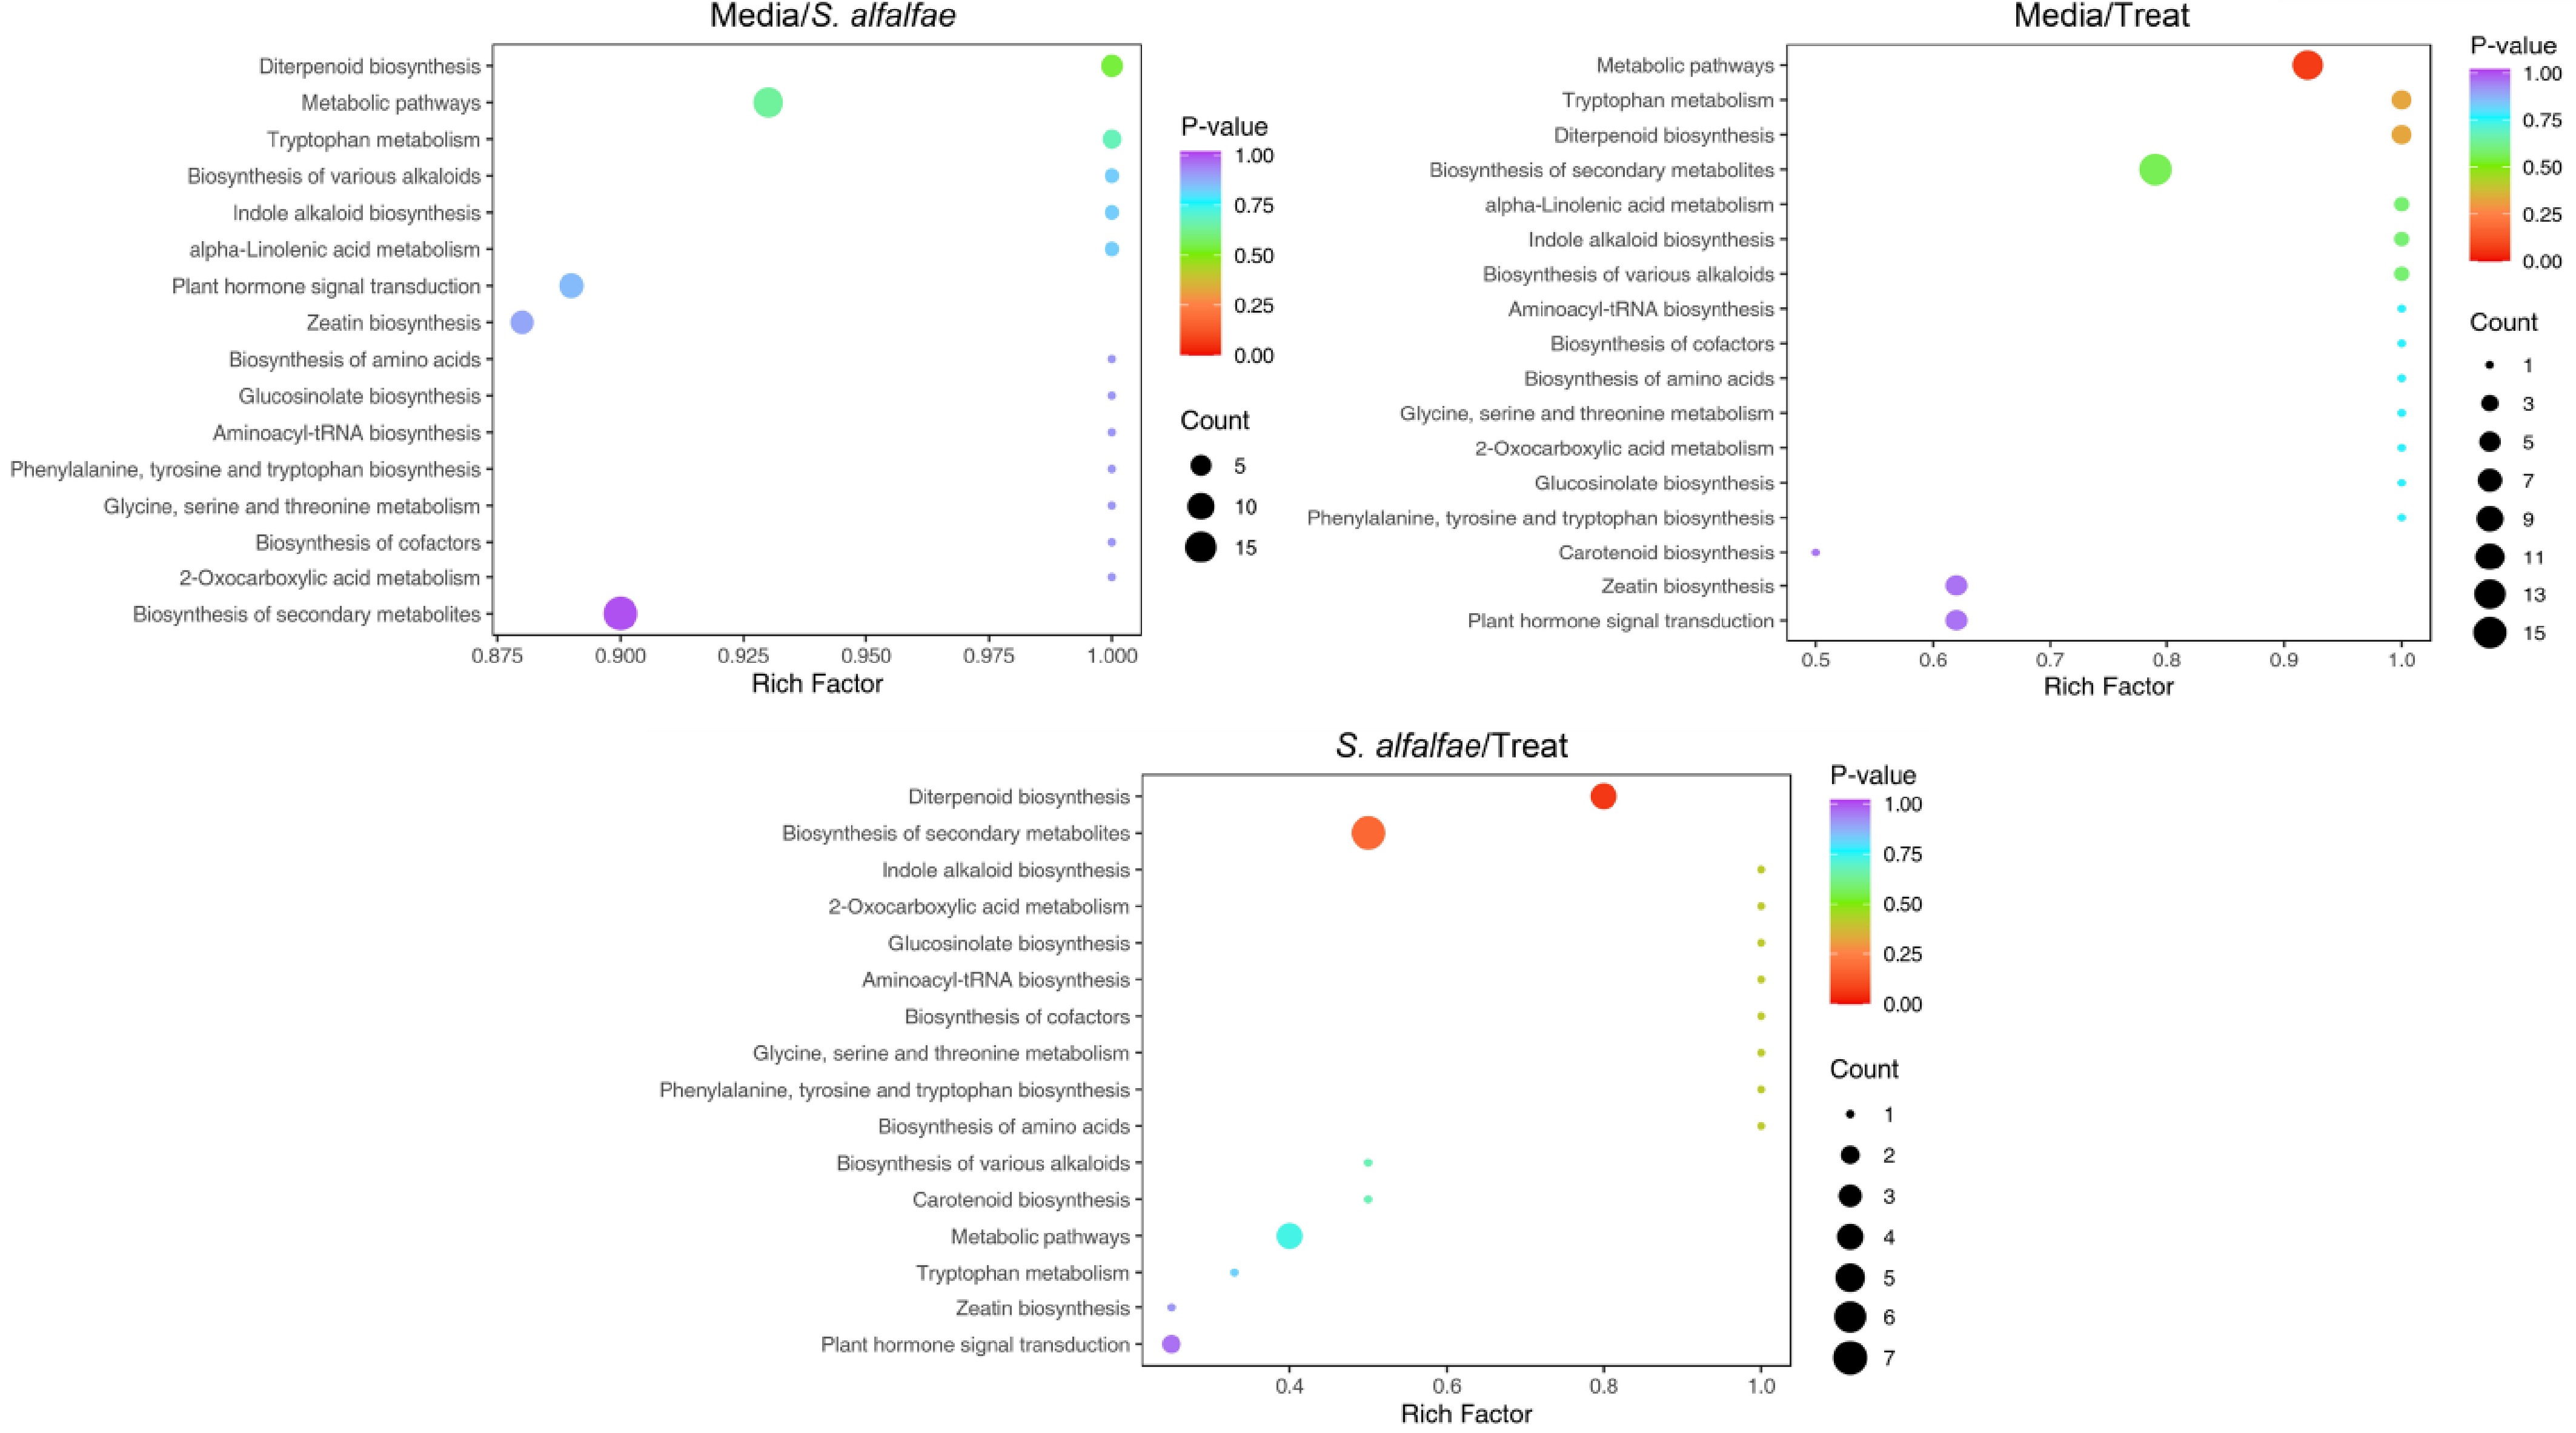
Figure 4.
KEGG enrichment analysis of differential metabolites between samples. The x-axis represents the enrichment factor to each pathway, and the y-axis lists the pathway names. The color of each dot indicates the p-value, with redder colors representing more significant enrichment. Dot size reflects the number of enriched differential metabolites.
-
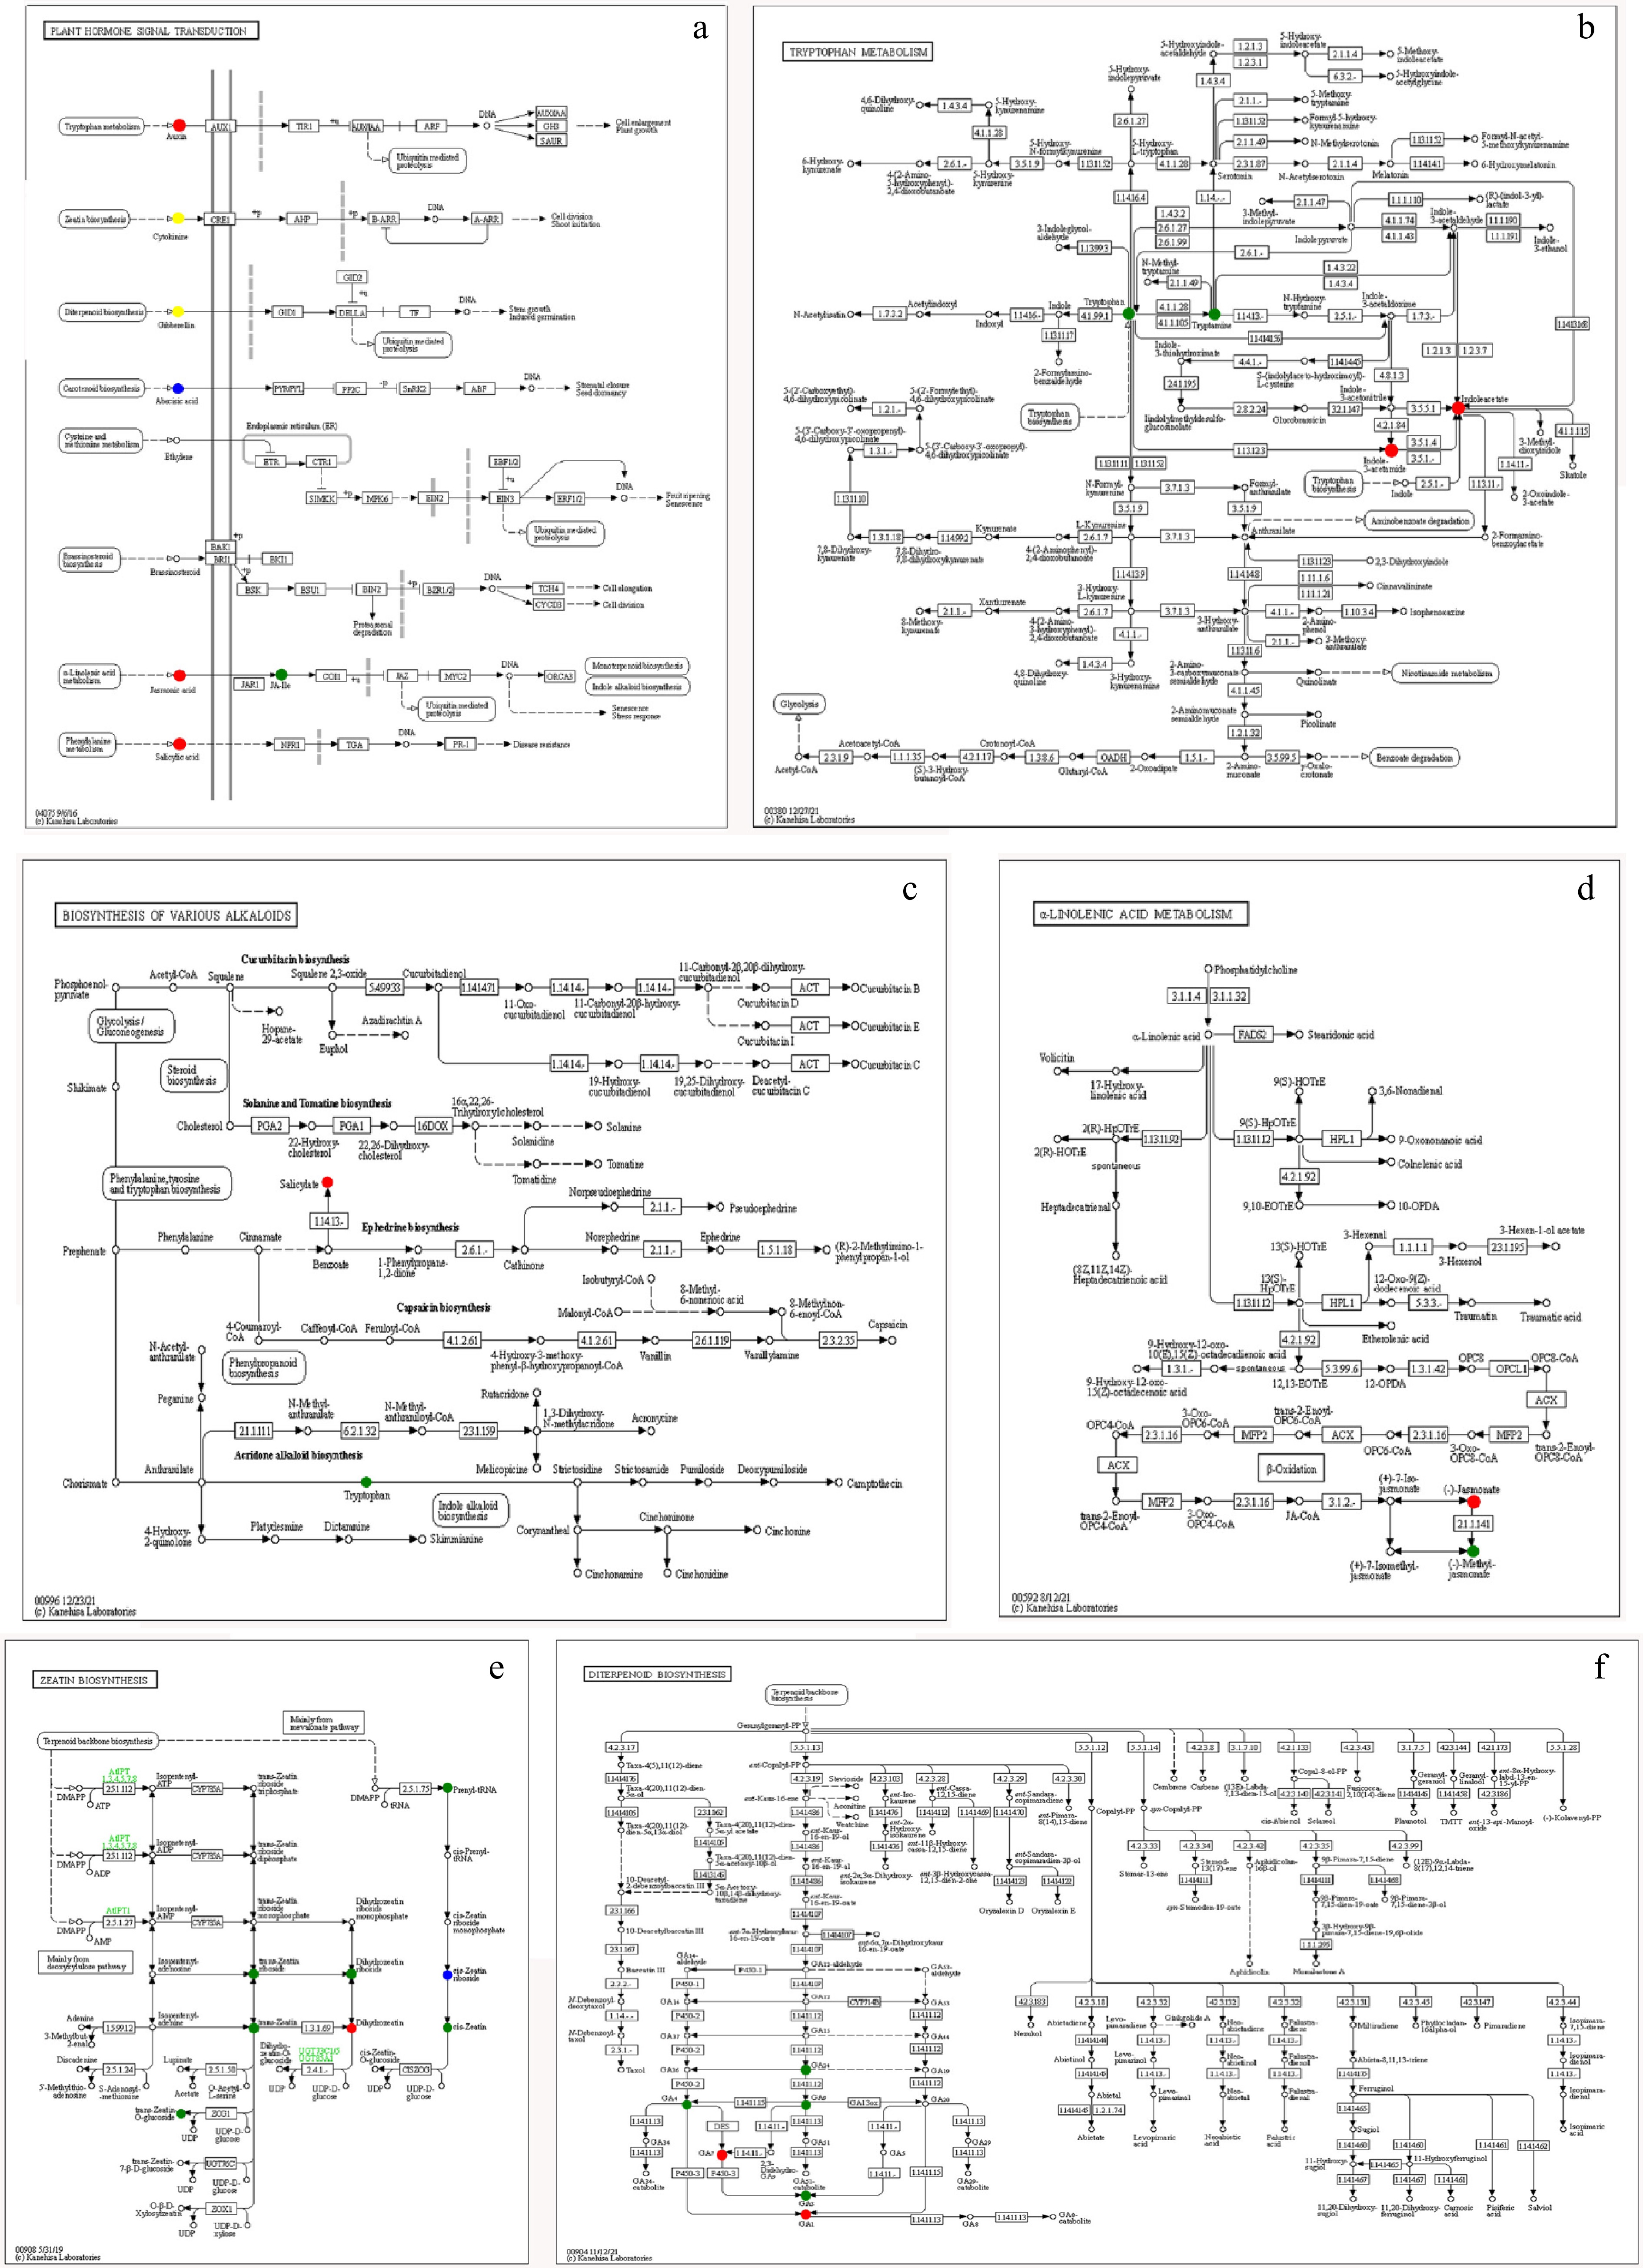
Figure 5.
Metabolite KEGG pathway map of metabolites differentially detected in medium vs S. alfalfae 5406 treatments. Significantly affected pathways include biosynthesis of (a) secondary metabolites, (b) tryptophan metabolism, (c) biosynthesis of various alkaloids, (d) α-linolenic acid metabolism, (e) zeatin biosynthesis, and (f) diterpenoid biosynthesis. Red indicates metabolites that were significantly up-regulated in the S. alfalfae 5406 sample; blue indicates metabolites that were detected but not significantly changed; and green indicates significantly down-regulated metabolites in the S. alfalfae sample.
-
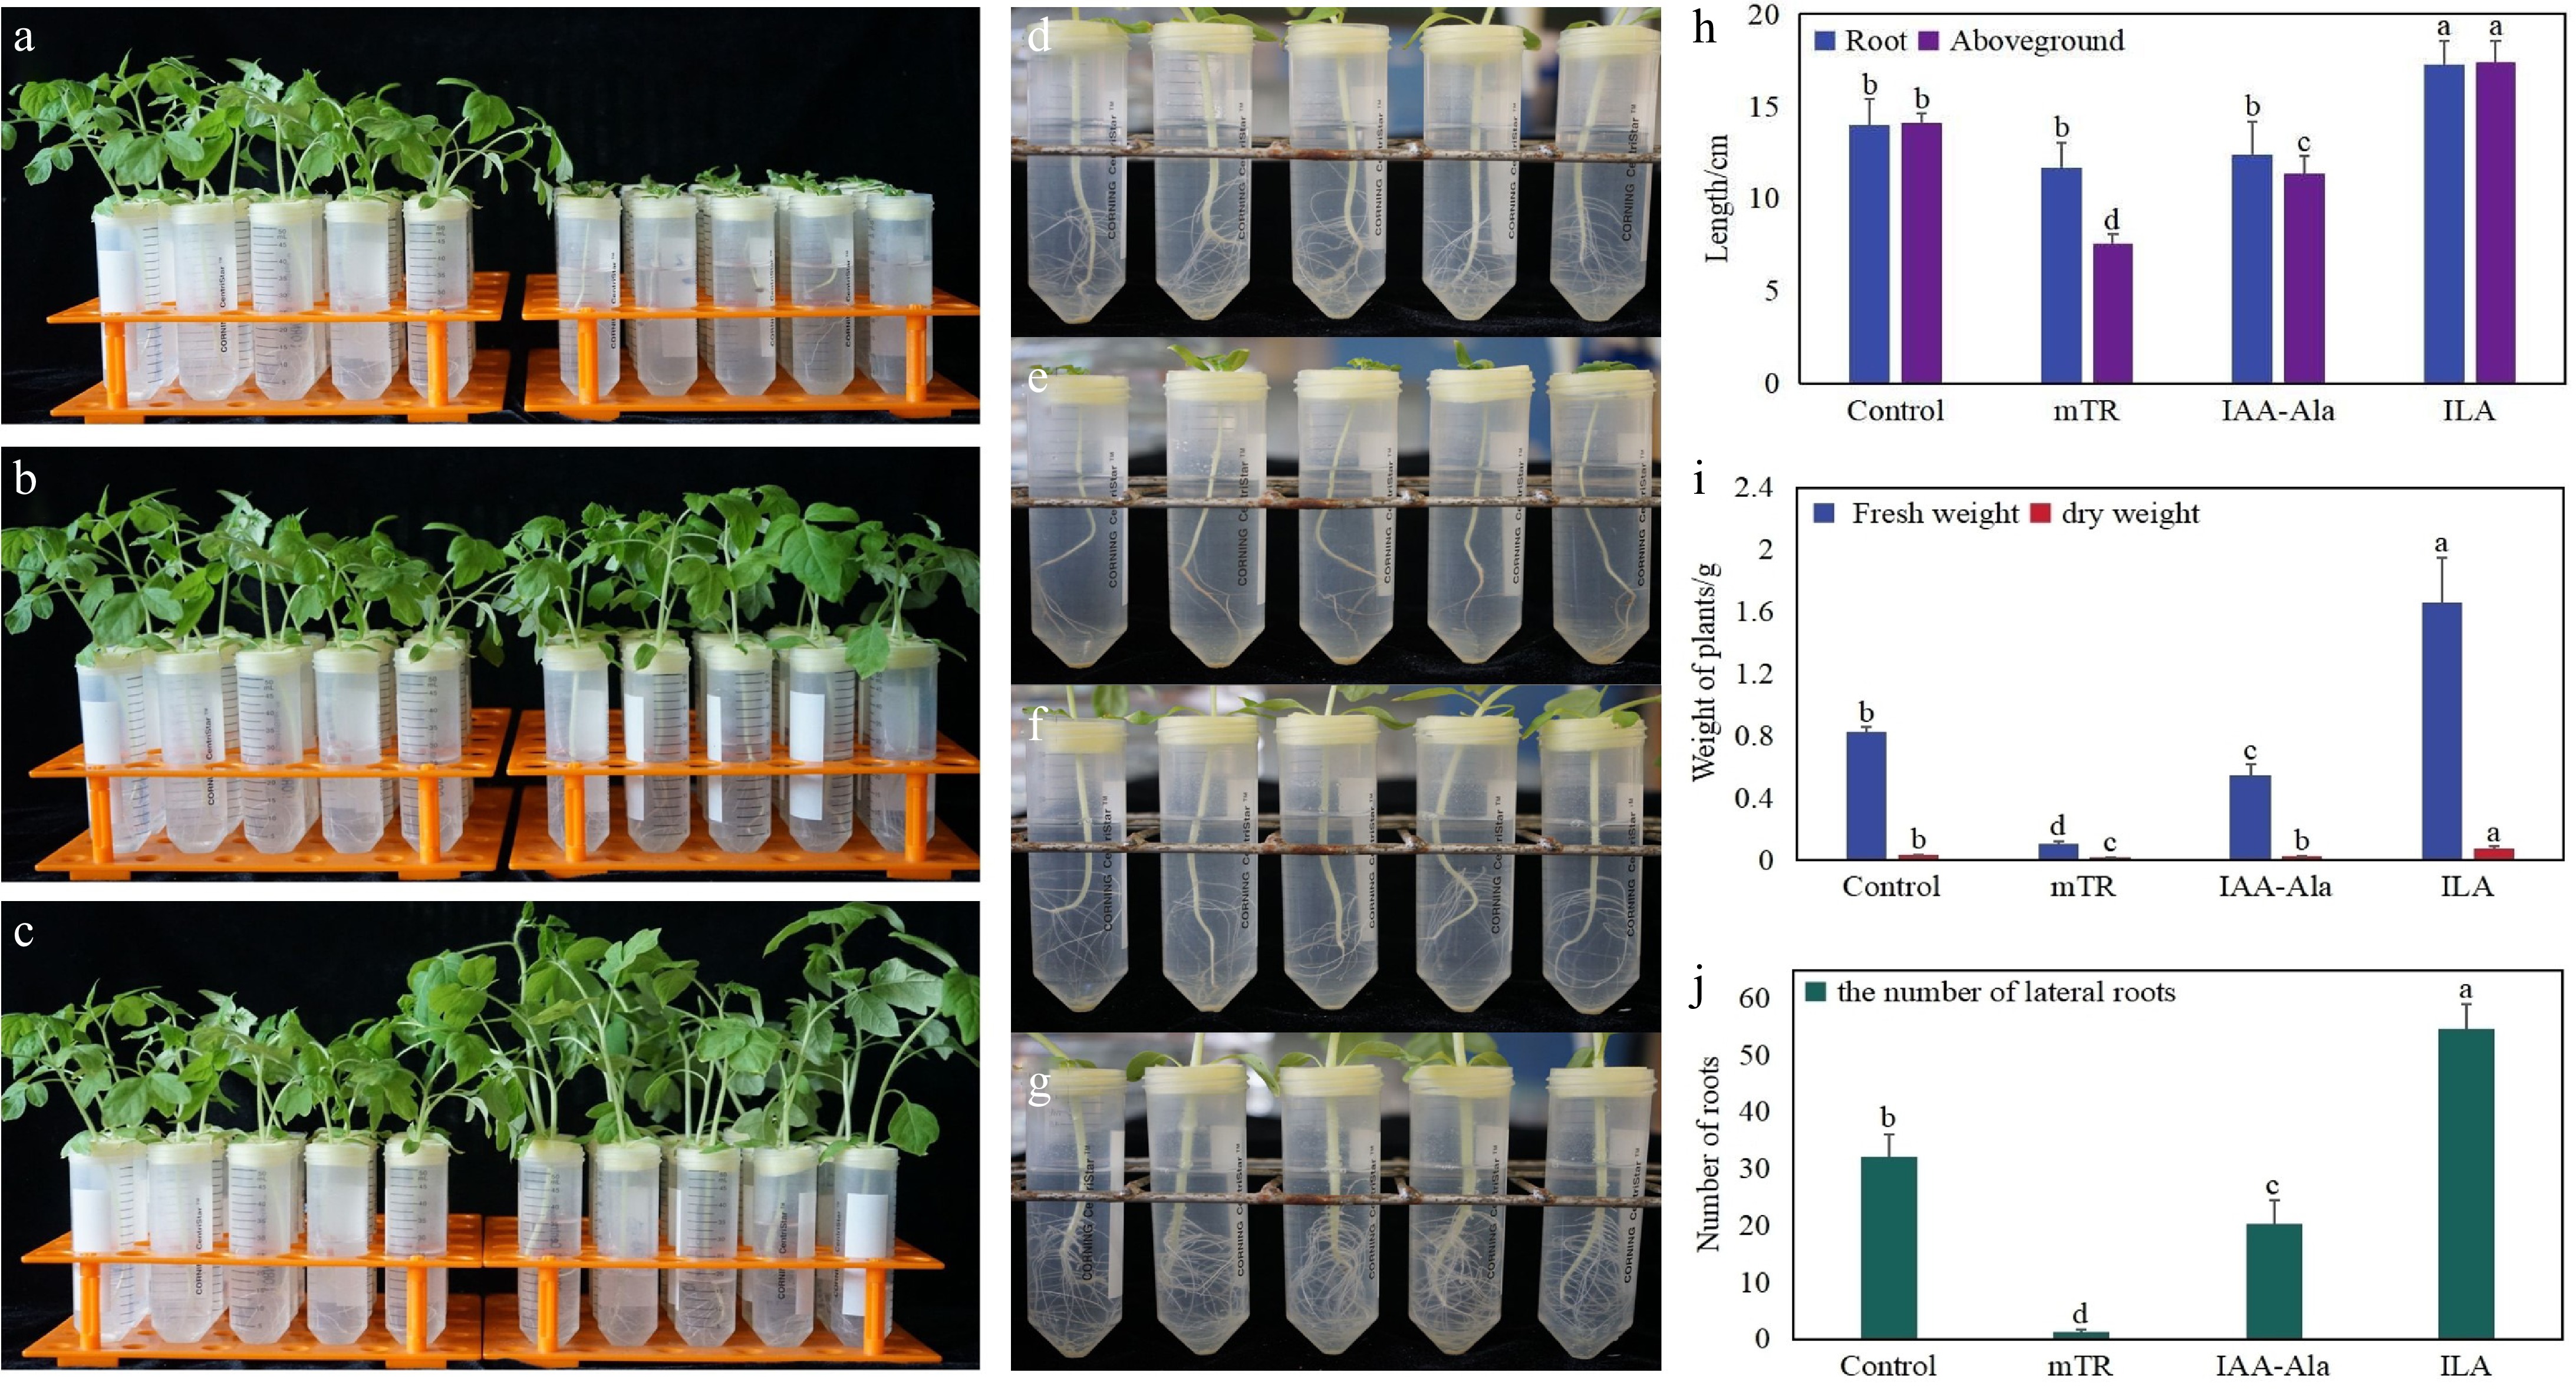
Figure 6.
Effect of three candidate metabolites on the growth of tomato seedlings. (a) Growth of seedlings treated with culture medium (left) and mTR (right). (b) Growth of seedlings treated with culture medium (left) and IAA-Ala (right). (c) Growth of seedlings treated with culture medium (left) and ILA (right). (d) Growth of roots in culture medium. (e) Growth of roots treated with mTR. (f) Growth of roots treated with IAA-Ala. (g) Growth of roots treated with ILA. (h) Statistical analysis of root length and shoot weight. (i) Statistical analysis of fresh weight and dry weight. (j) Statistical analysis of lateral root number. Different letters in the figure indicate significant differences between treatments at p < 0.05.
-
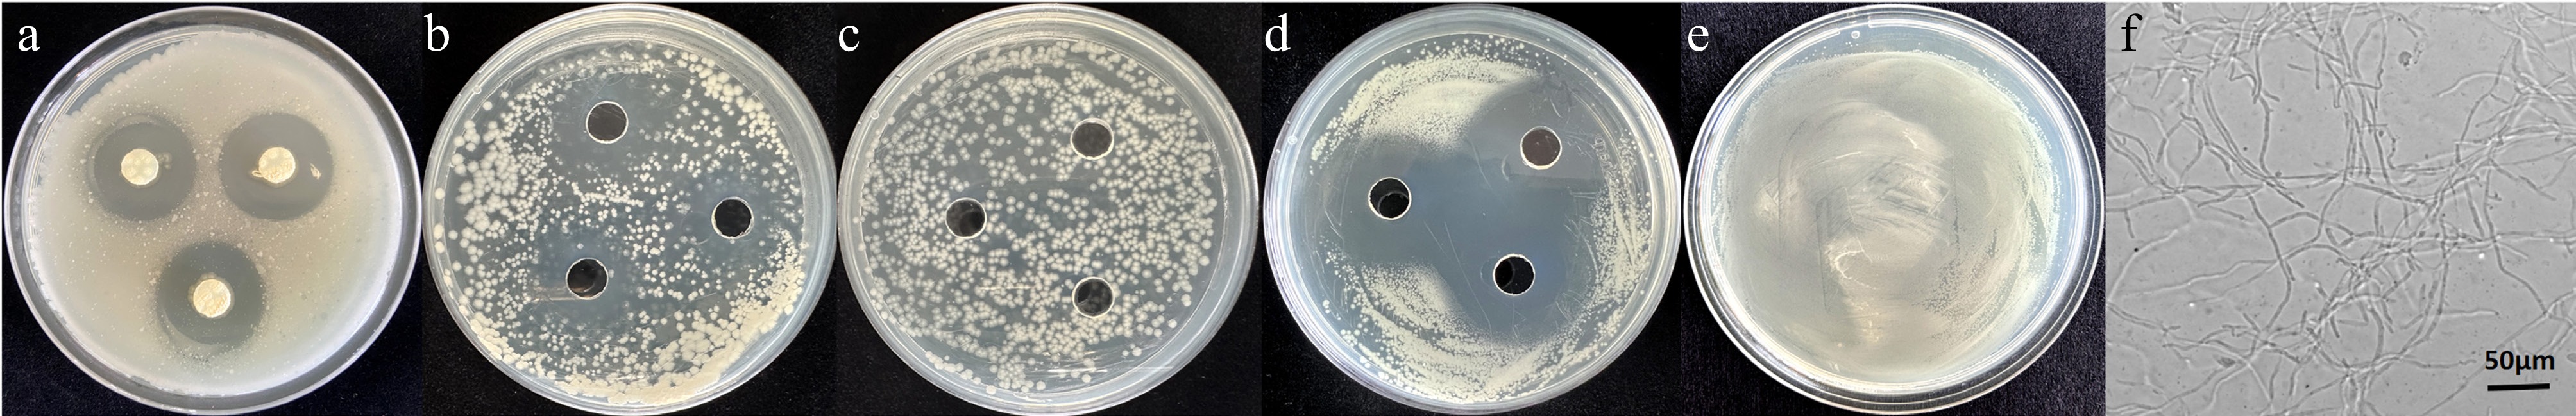
Figure 7.
Antibacterial effects of S. alfalfae 5406 and salicylic acid against R. solanacearum. (a) S. alfalfae 5406 mycelial discs placed on LB agar inoculated with R. solanacearum. (b) Sterile supernatant of S. alfalfae 5406 added to wells in LB agar inoculated with R. solanacearum. (c) Control of R. solanacearum with PBS broth added to the wells. (d) SA added to wells in LB agar with R. solanacearum. (e) Control of R. solanacearum only, without additives. (f) Microscopic morphology of S. alfalfae 5406.
-
Compounds Index Medium (ng·mL−1) S. alfalfae (ng·mL−1) Treat (ng·mL−1) Auxin L-tryptophan TRP 11,509.8 60.0 169.4 Tryptamine TRA 1.94 N/A N/A N-(3-Indolylacetyl)-L-alanine IAA-Ala N/A 0.94 0.91 Indole-3-acetyl-L-glutamic acid dimethyl ester IAA-Glu-
diMeN/A 0.73 0.48 2-oxindole-3-acetic acid OxIAA 53.06 95.49 132.37 Methyl indole-3-acetate MEIAA 0.06 0.74 0.64 Indole-3-acetic acid IAA 20.55 153.83 134.50 3-Indole acetamide IAM 0.20 2.60 3.07 Indole-3-carboxaldehyde ICAld 6.90 1.53 0.77 Indole-3-lactic acid ILA 7.33 81.41 73.07 Indole-3-carboxylic acid ICA 6.04 84.60 68.53 Cytokinin Kinetin-9-glucoside K9G N/A 1.79 0.77 N6-Isopentenyl-adenine-9-glucoside iP9G N/A N/A 0.69 cis-Zeatin-O-glucoside riboside cZROG 0.26 N/A N/A N6-isopentenyladenosine IPR 0.40 N/A N/A N6-Isopentenyl-adenine-7-glucoside iP7G 3.47 N/A N/A trans-Zeatin-O-glucoside tZOG 1.84 N/A N/A 2-Methylthio-cis-zeatin riboside 2MeScZR 0.07 3.84 9.28 Dihydrozeatin-7-glucoside DHZ7G 0.12 N/A N/A 4-[(9-beta-D-glucopyranosyl-9H-purin-6-yl)amino]methyl]phenol pT9G 0.07 0.15 0.08 cis-Zeatin riboside cZR 0.28 0.21 0.32 6-Benzyladenine BAP 0.30 0.08 0.03 meta-Topolin riboside mTR 0.01 0.16 0.06 trans-Zeatin riboside tZR 0.12 0.02 0.03 2-Methylthio-cis-zeatin 2MeScZ N/A 0.29 0.25 SA Salicylic acid SA 65.90 317.23 298.24 Salicylic acid 2-O-β-glucoside SAG 229.79 0.65 0.33 JA Dihydrojasmonic acid H2JA 0.68 0.76 0.84 Jasmonic acid JA 0.75 1.69 1.86 Methyl jasmonate MEJA 1.26 N/A N/A Jasmonoyl-L-isoleucine JA-ILE 0.30 0.12 0.18 cis(+)-12-Oxophytodienoic acid OPDA 15.90 0.07 0.03 3-oxo-2-(2-(Z)-Pentenyl) cyclopentane-1-butyric acid OPC-4 N/A 5.45 14.41 3-oxo-2-(2-(Z)-Pentenyl)cyclopentane-1-hexanoic acid OPC-6 14.78 11.73 3.81 GA Gibberellin A3 GA3 0.48 N/A N/A Gibberellin A4 GA4 3.52 N/A 0.16 Gibberellin A1 GA1 N/A 1.82 N/A Gibberellin A15 GA15 0.26 0.07 N/A Gibberellin A24 GA24 0.49 0.21 0.19 SL Strigol ST N/A N/A 0.58 ETH 1-Aminocyclopropanecarboxylic acid ACC 273.16 8.12 17.59 The numbers in bold represent the changes that are 5-fold or higher. 'N/A' indicates that the substance is not detected in this sample. Table 1.
Summary of selected differential hormone substances.
-
Strain/standard substance Diameter of inhibition zone (cm) S. alfalfae cakes 2.65 ± 0.30 S. alfalfae sterile supernatant 2.08 ± 0.13 SA 2.77 ± 0.22 PBS medium 0 The diameter of the inhibition zone are mean ± standard deviation. Table 2.
Antibacterial effects of S. alfalfae 5406 and SA treatments against R. solanacearum.
Figures
(7)
Tables
(2)