-
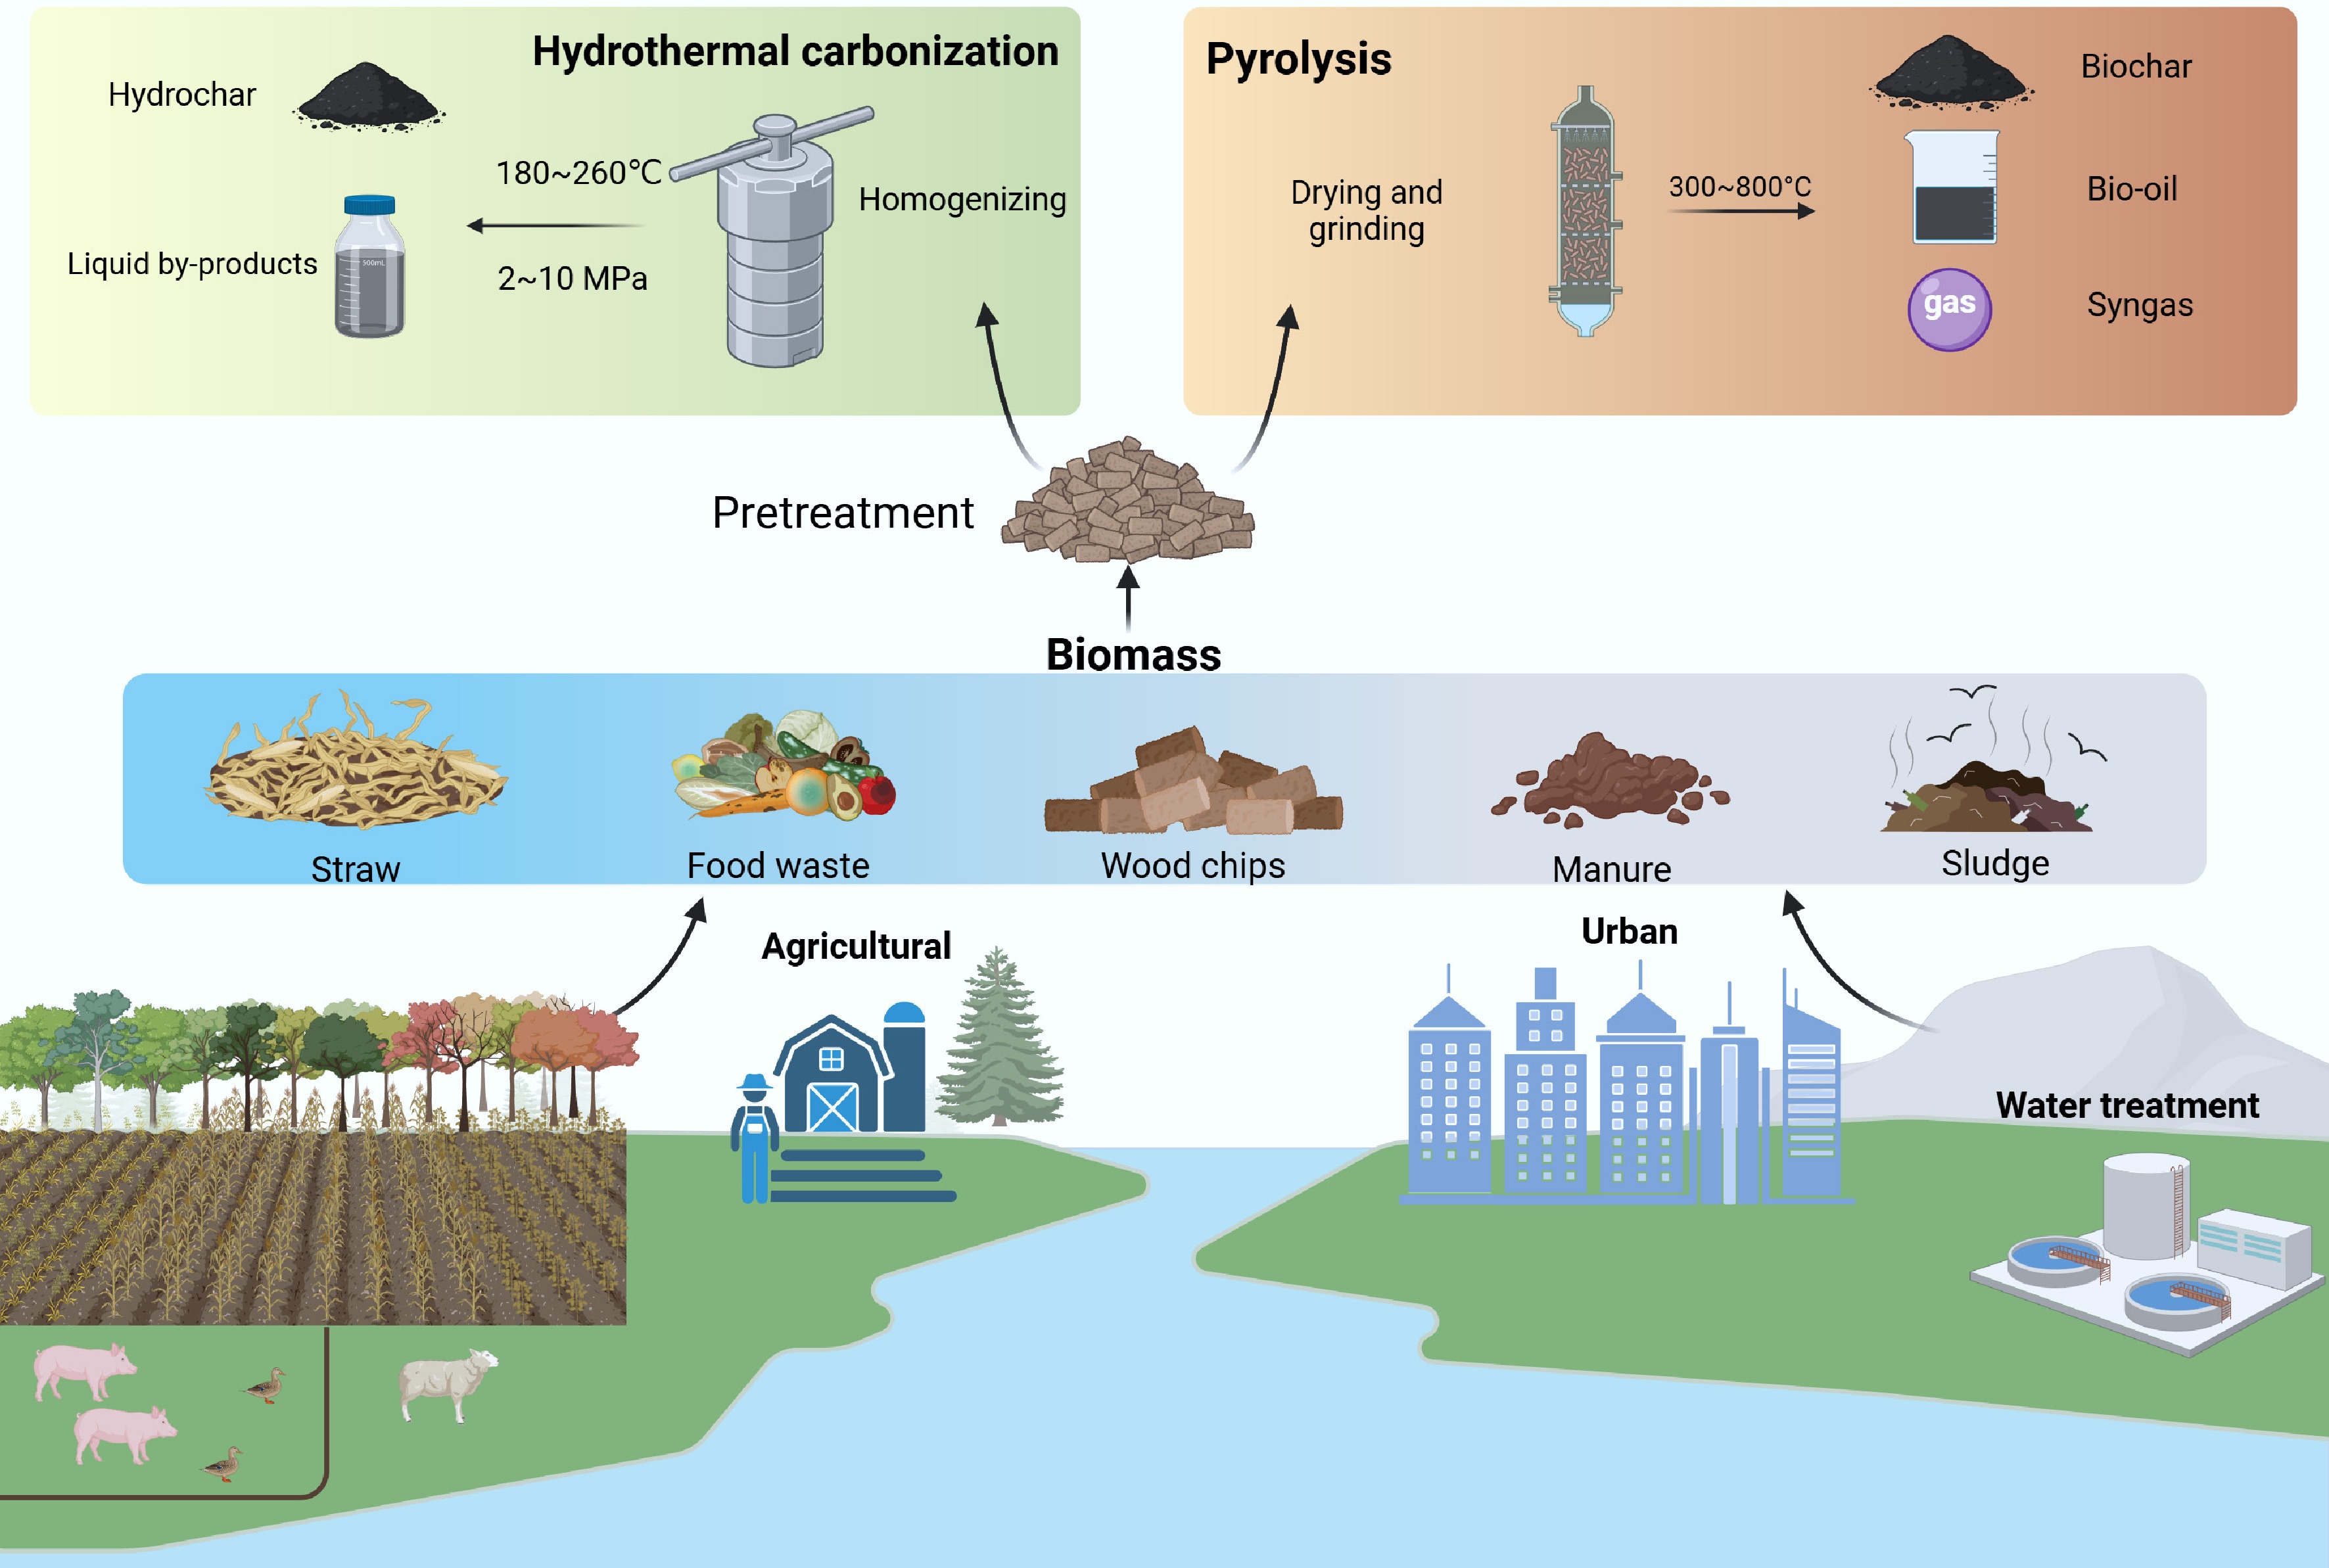
Figure 1.
Comparison of two preparation processes of biochar.
-
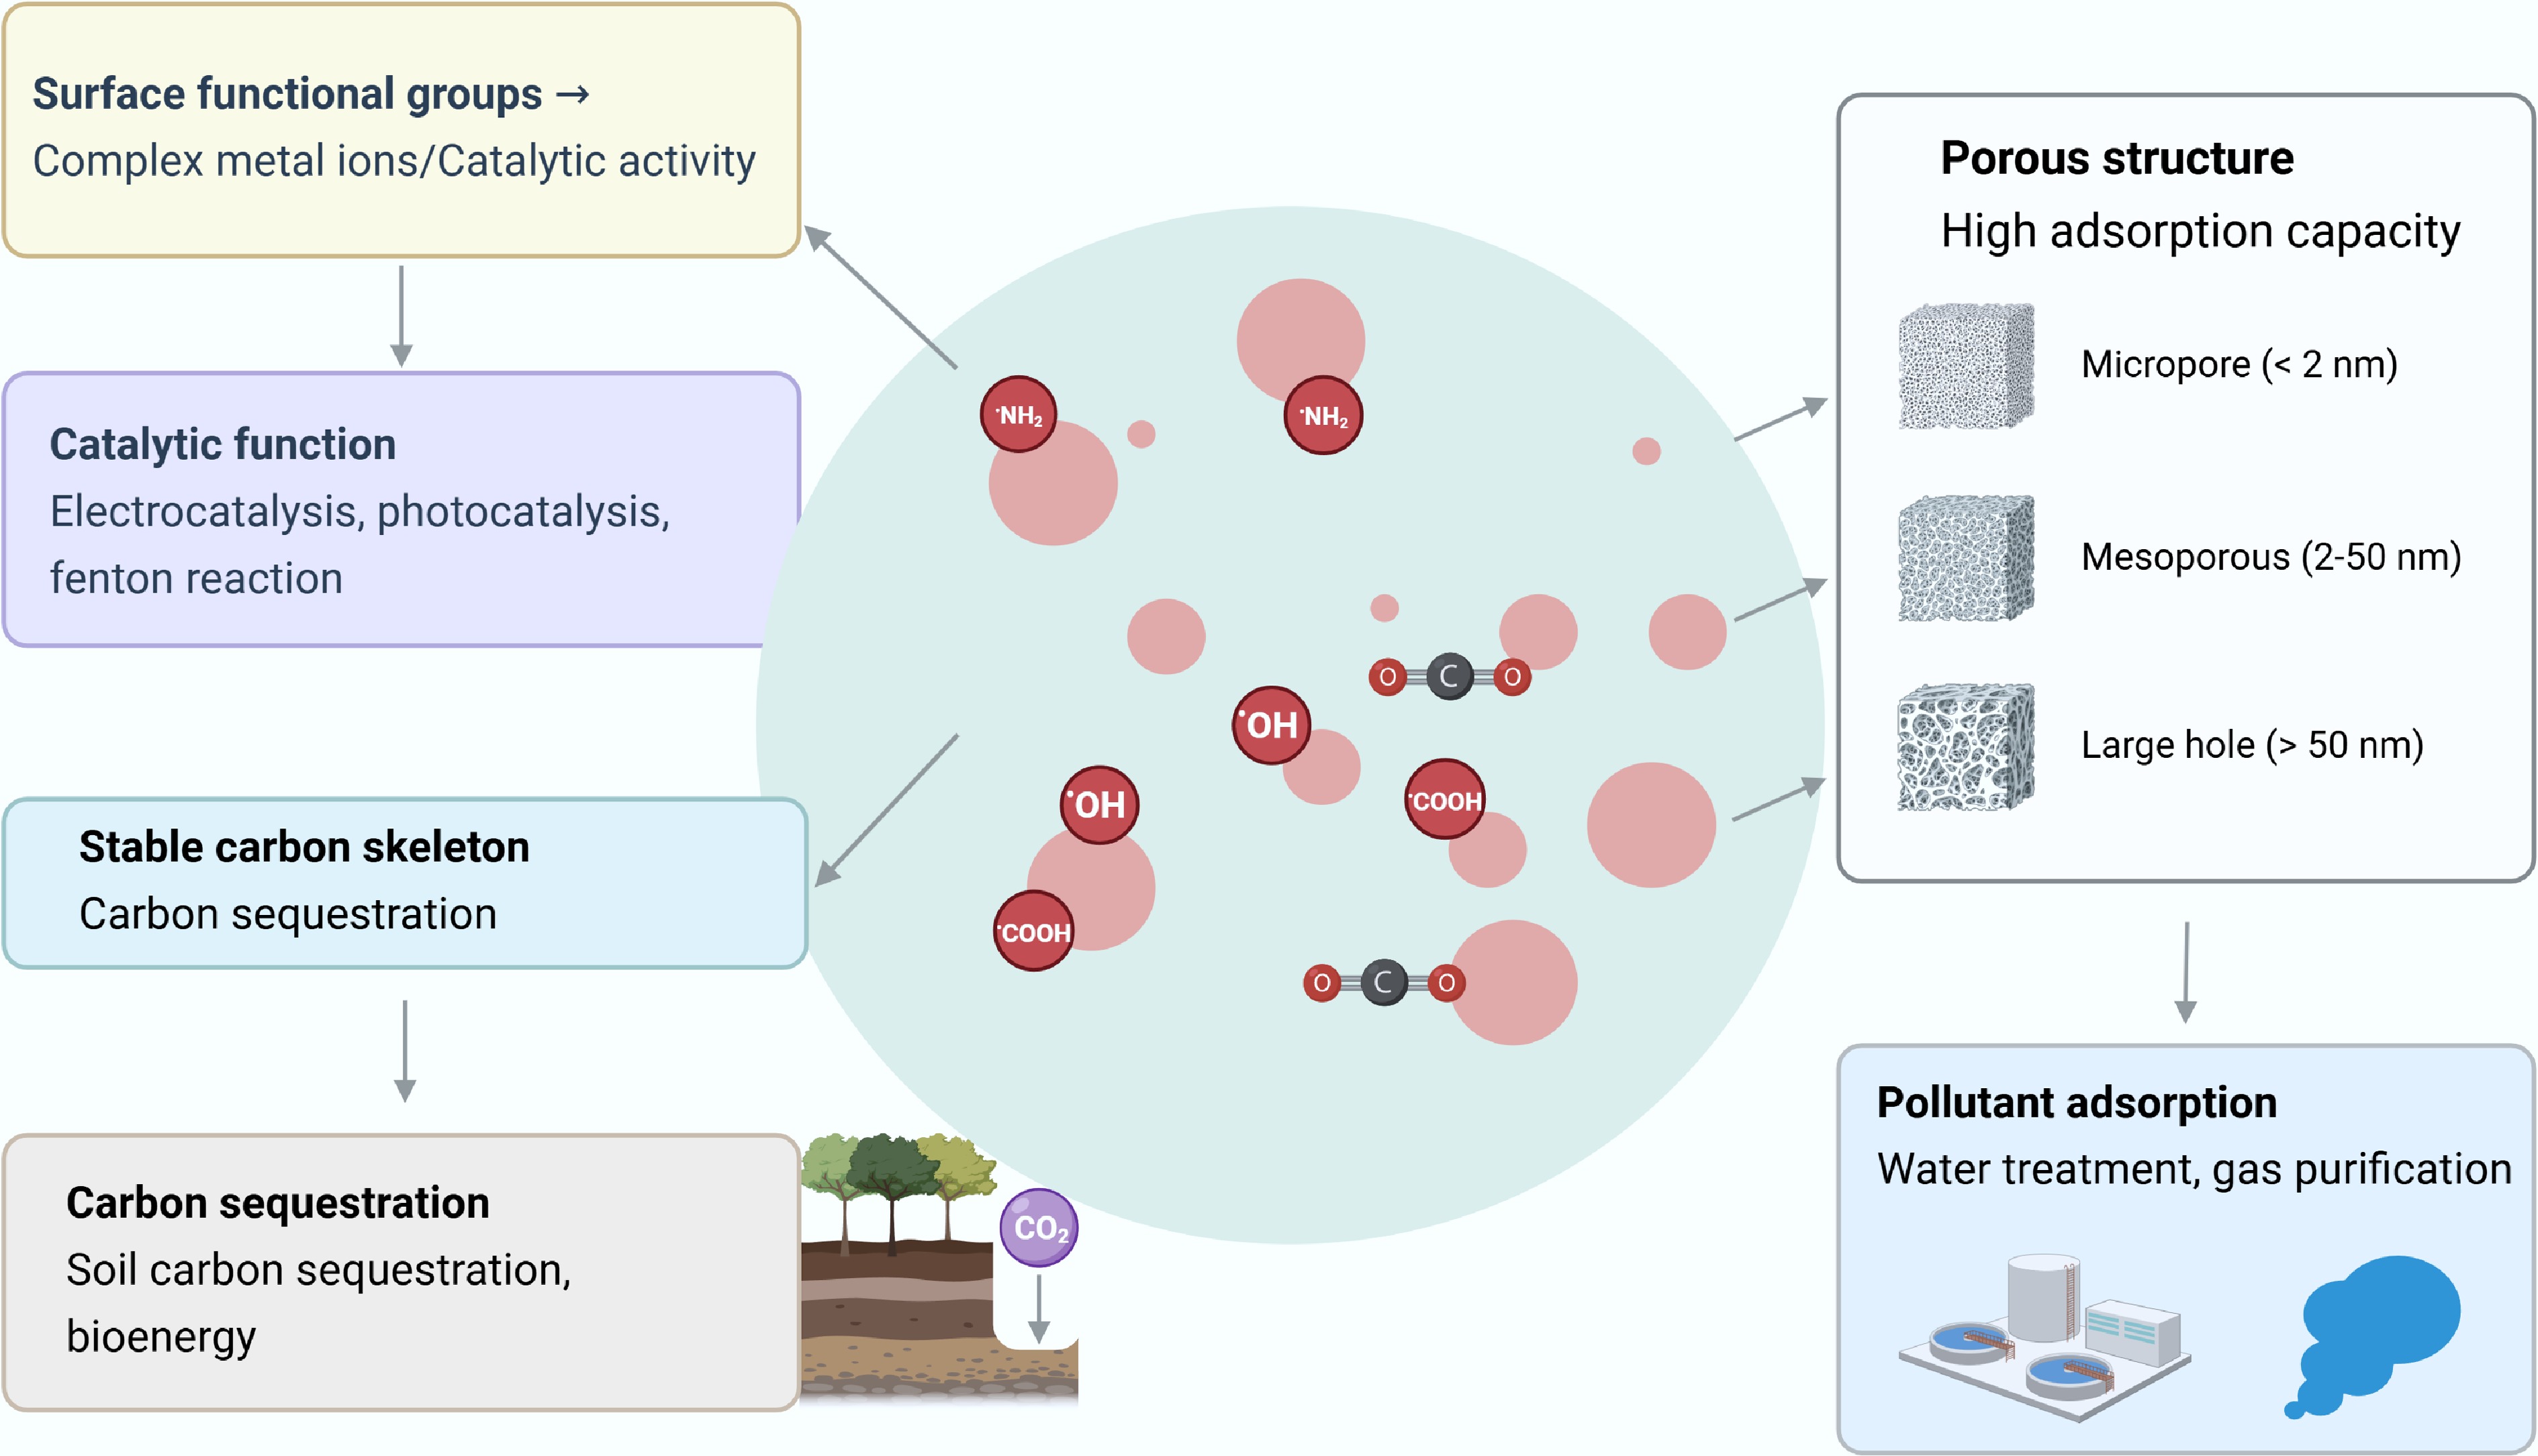
Figure 2.
Microstructure and function of biochar.
-
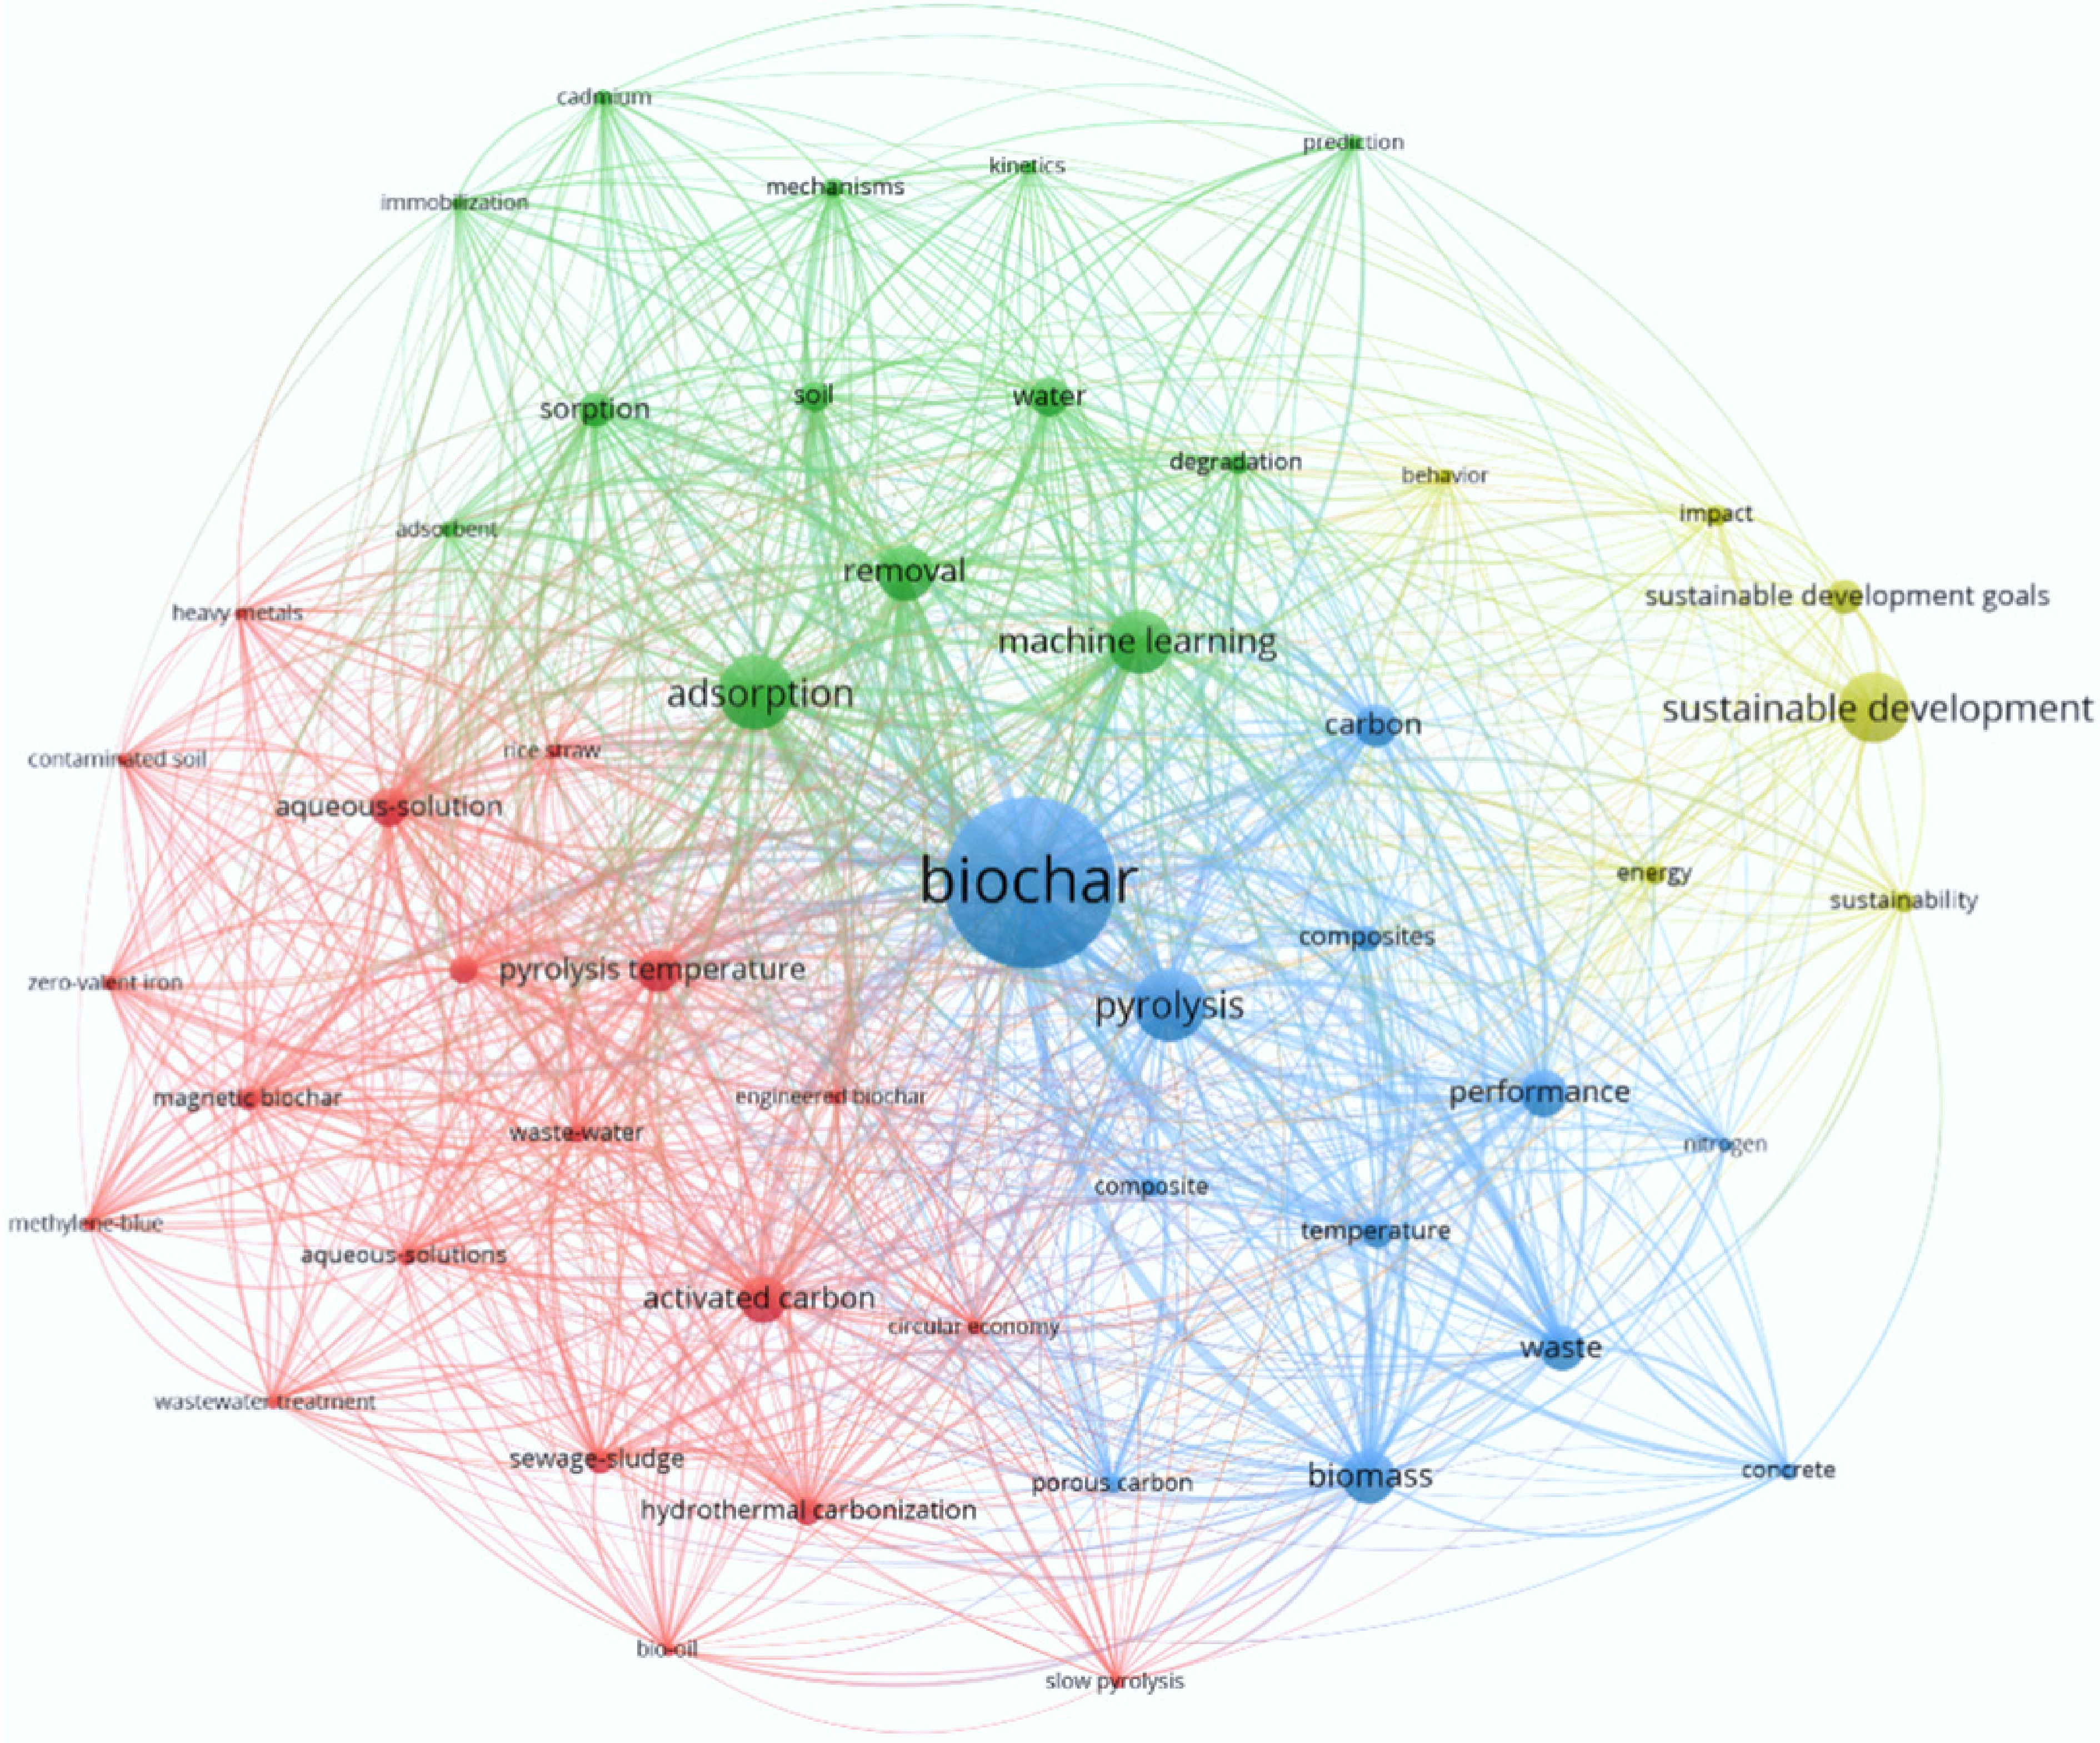
Figure 3.
Keyword co-occurrence network (2020–2025) visualized using VOSviewer. Node size represents keyword frequency; line thickness indicates co-occurrence strength. Colors denote thematic clusters: red (remediation & engineered biochar), green (adsorption & modeling), blue (material synthesis), yellow (sustainability & policy).
-

Figure 4.
Application of biochar in water pollution control.
-
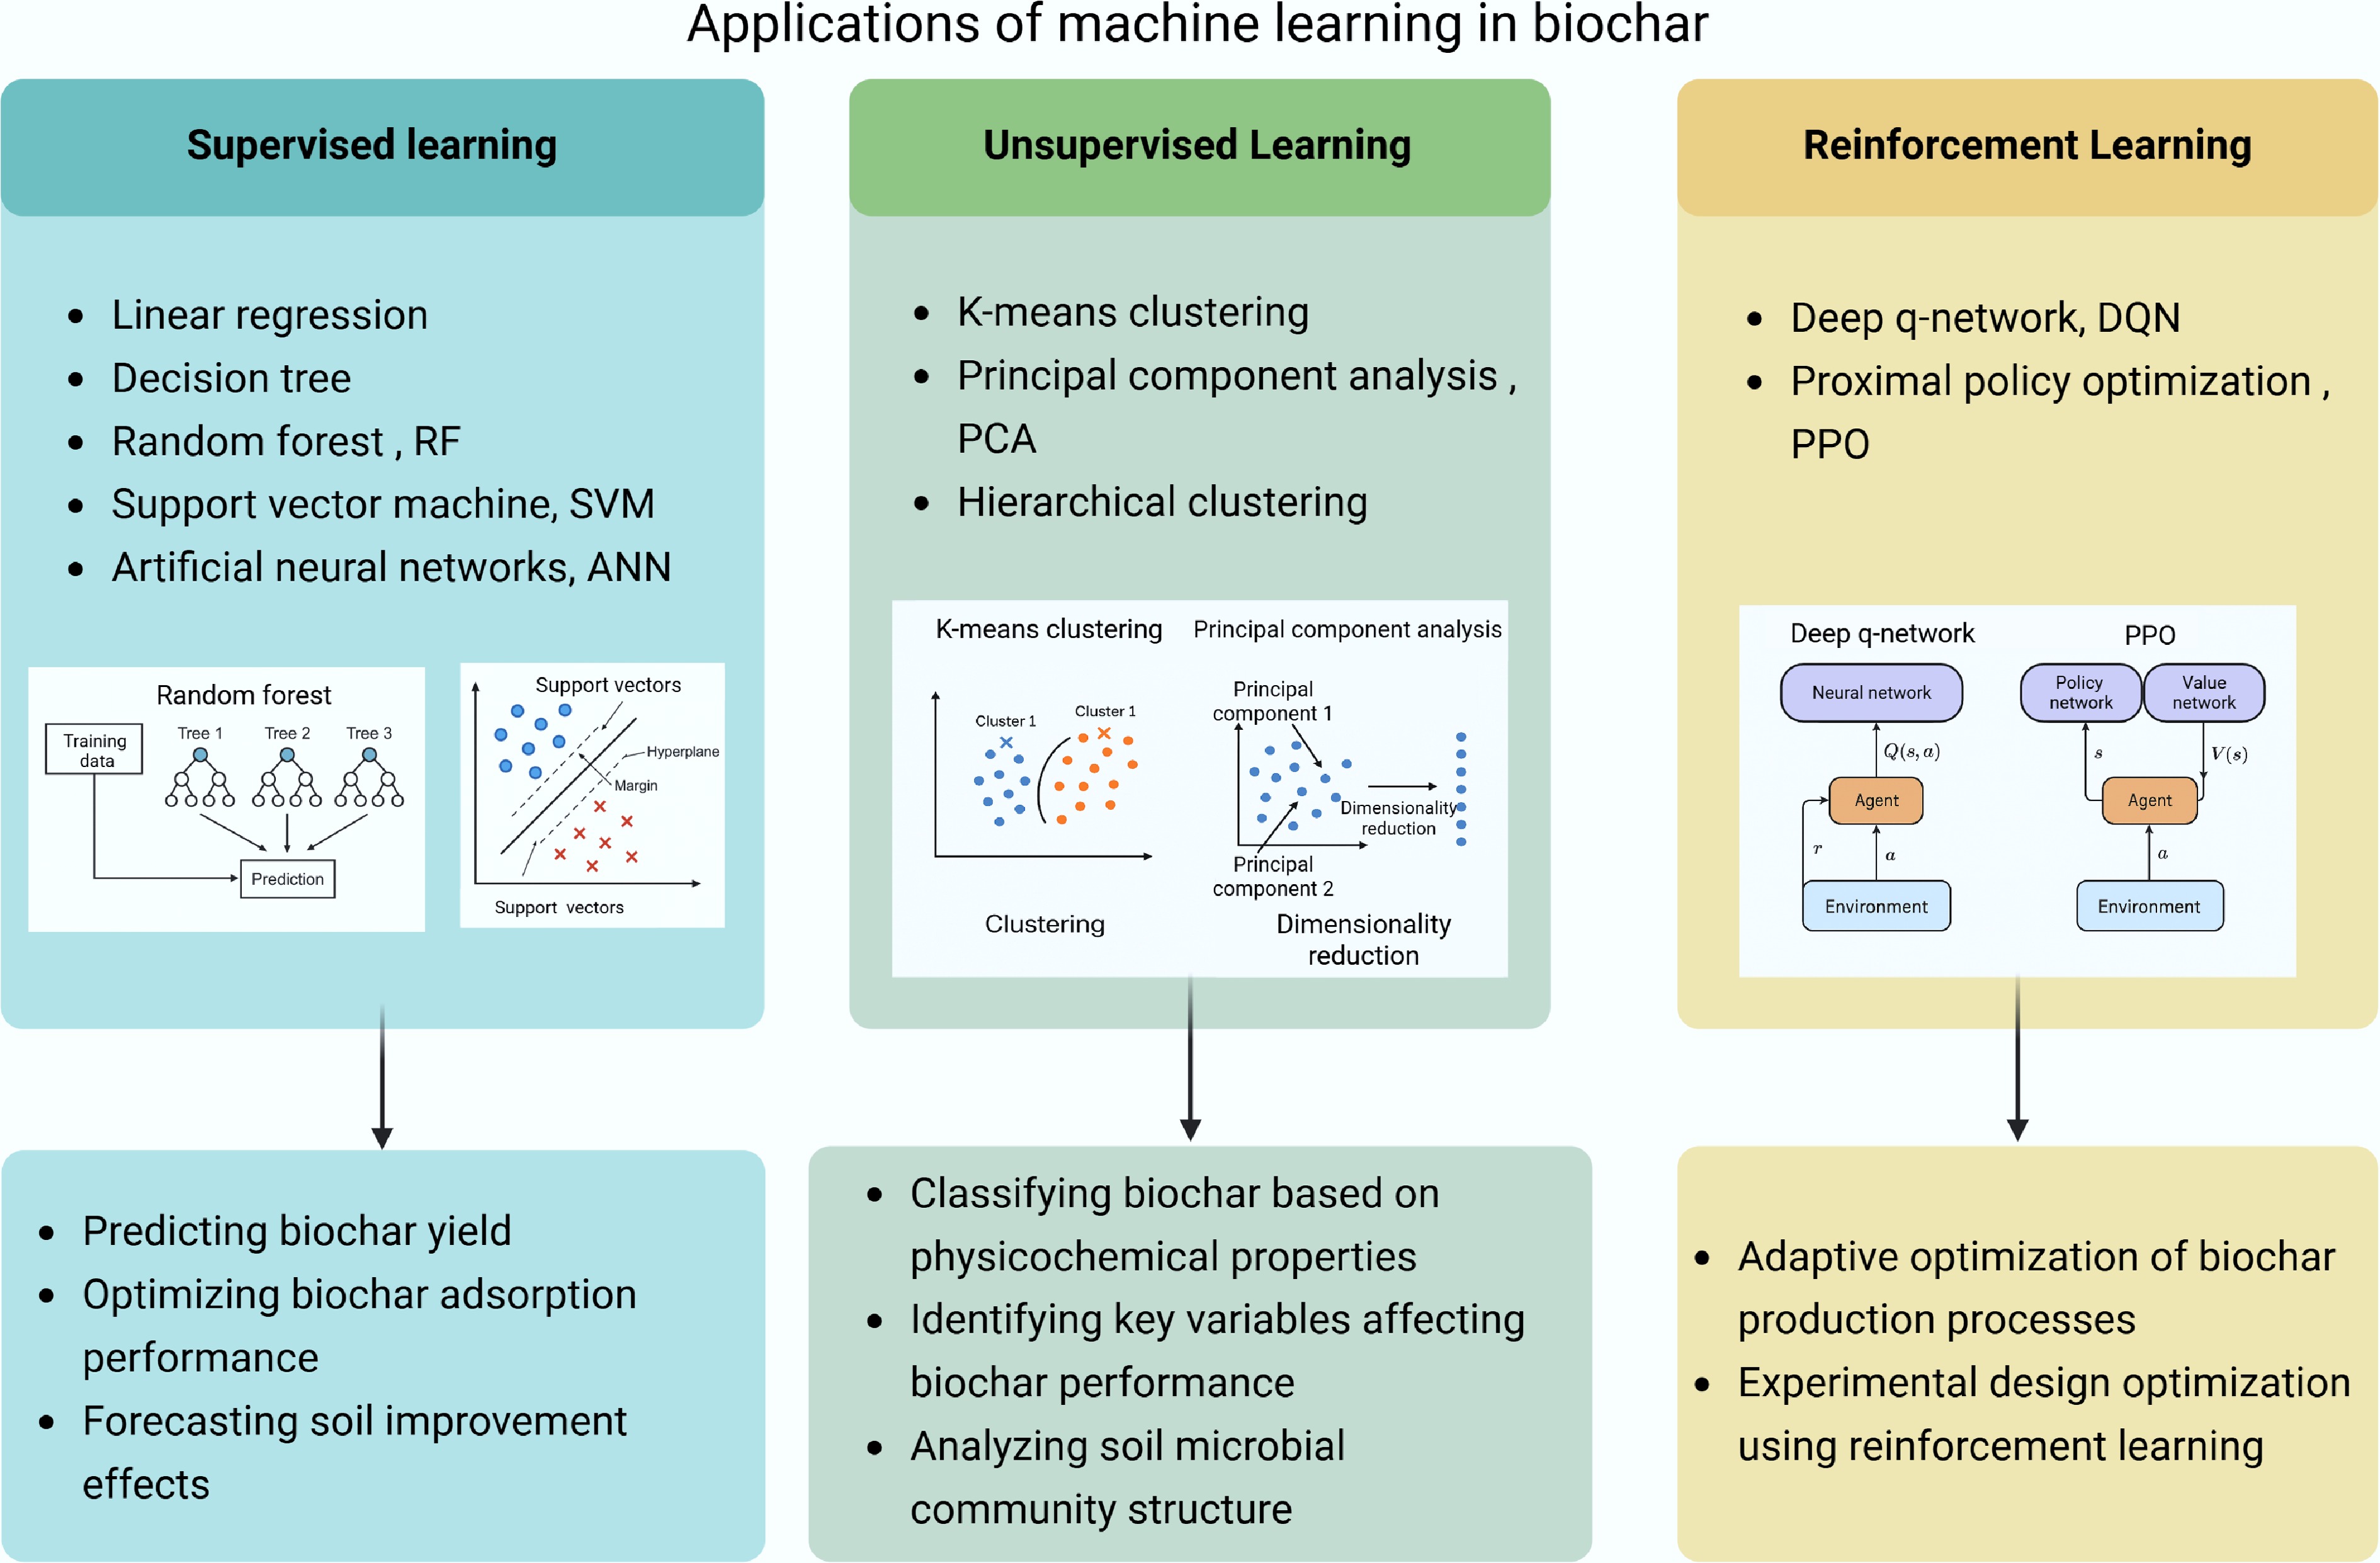
Figure 5.
Machine learning classification and its application to biochar.
-
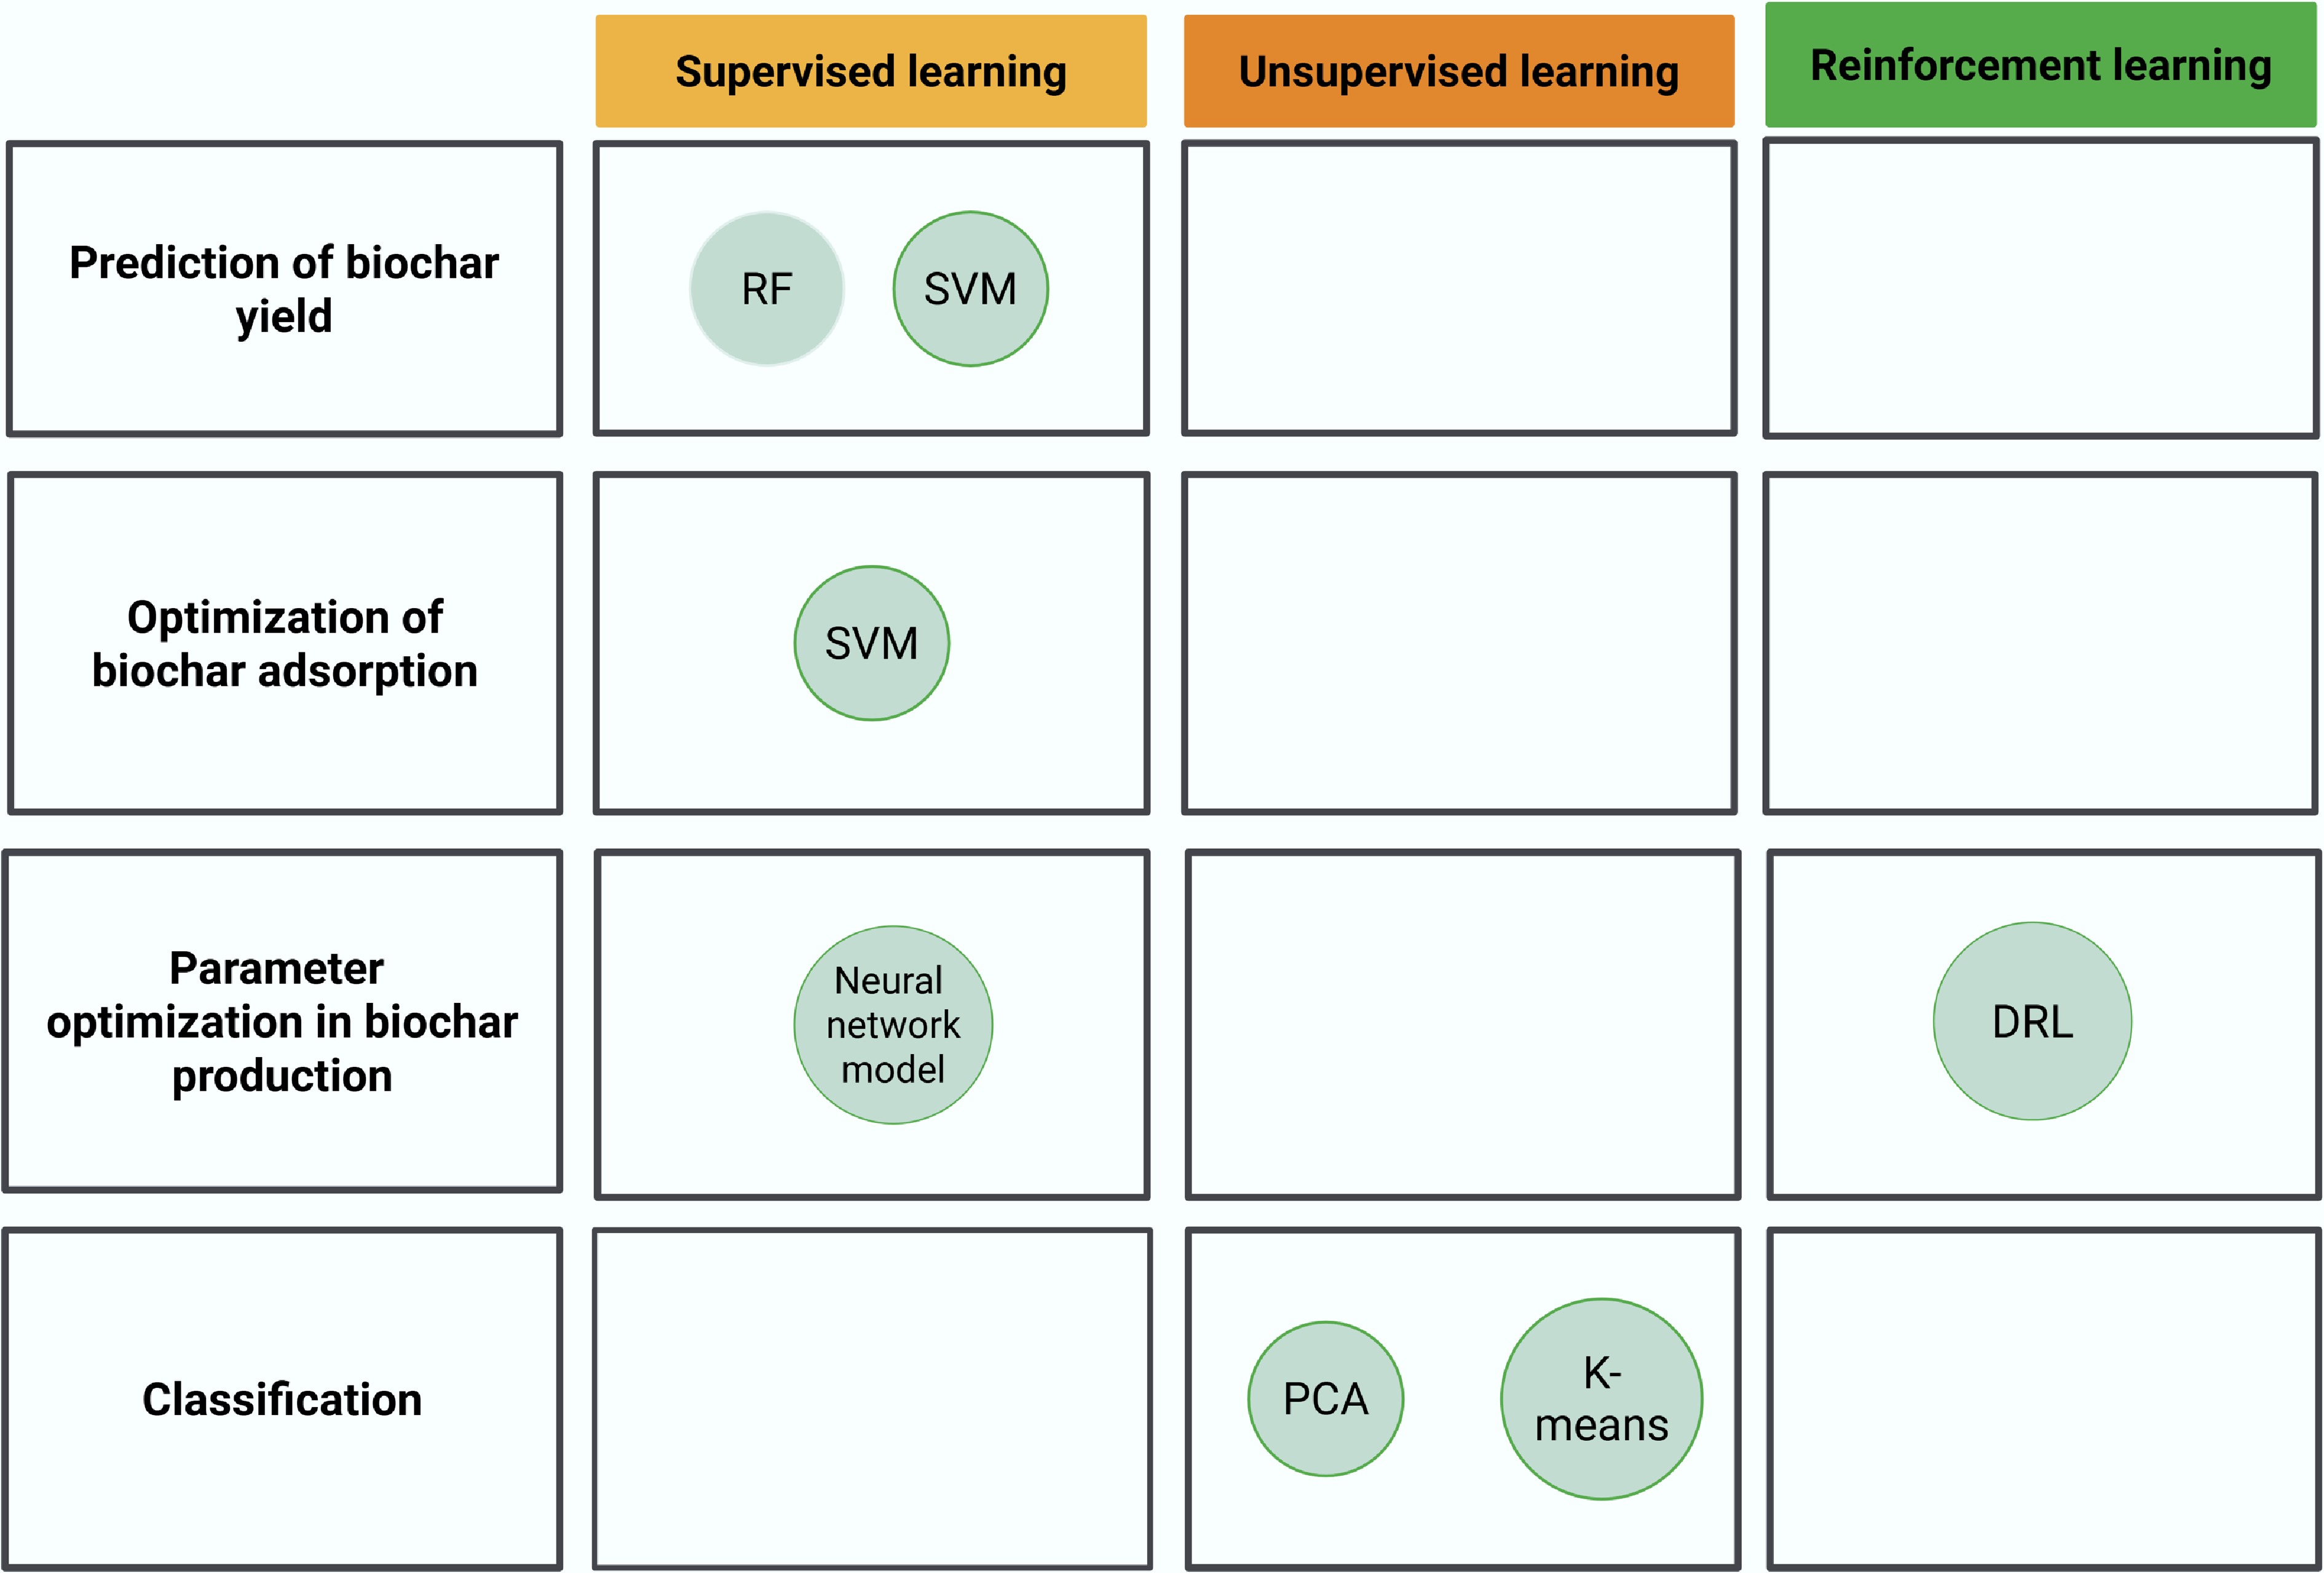
Figure 6.
Applications of machine learning algorithms in biochar research.
-
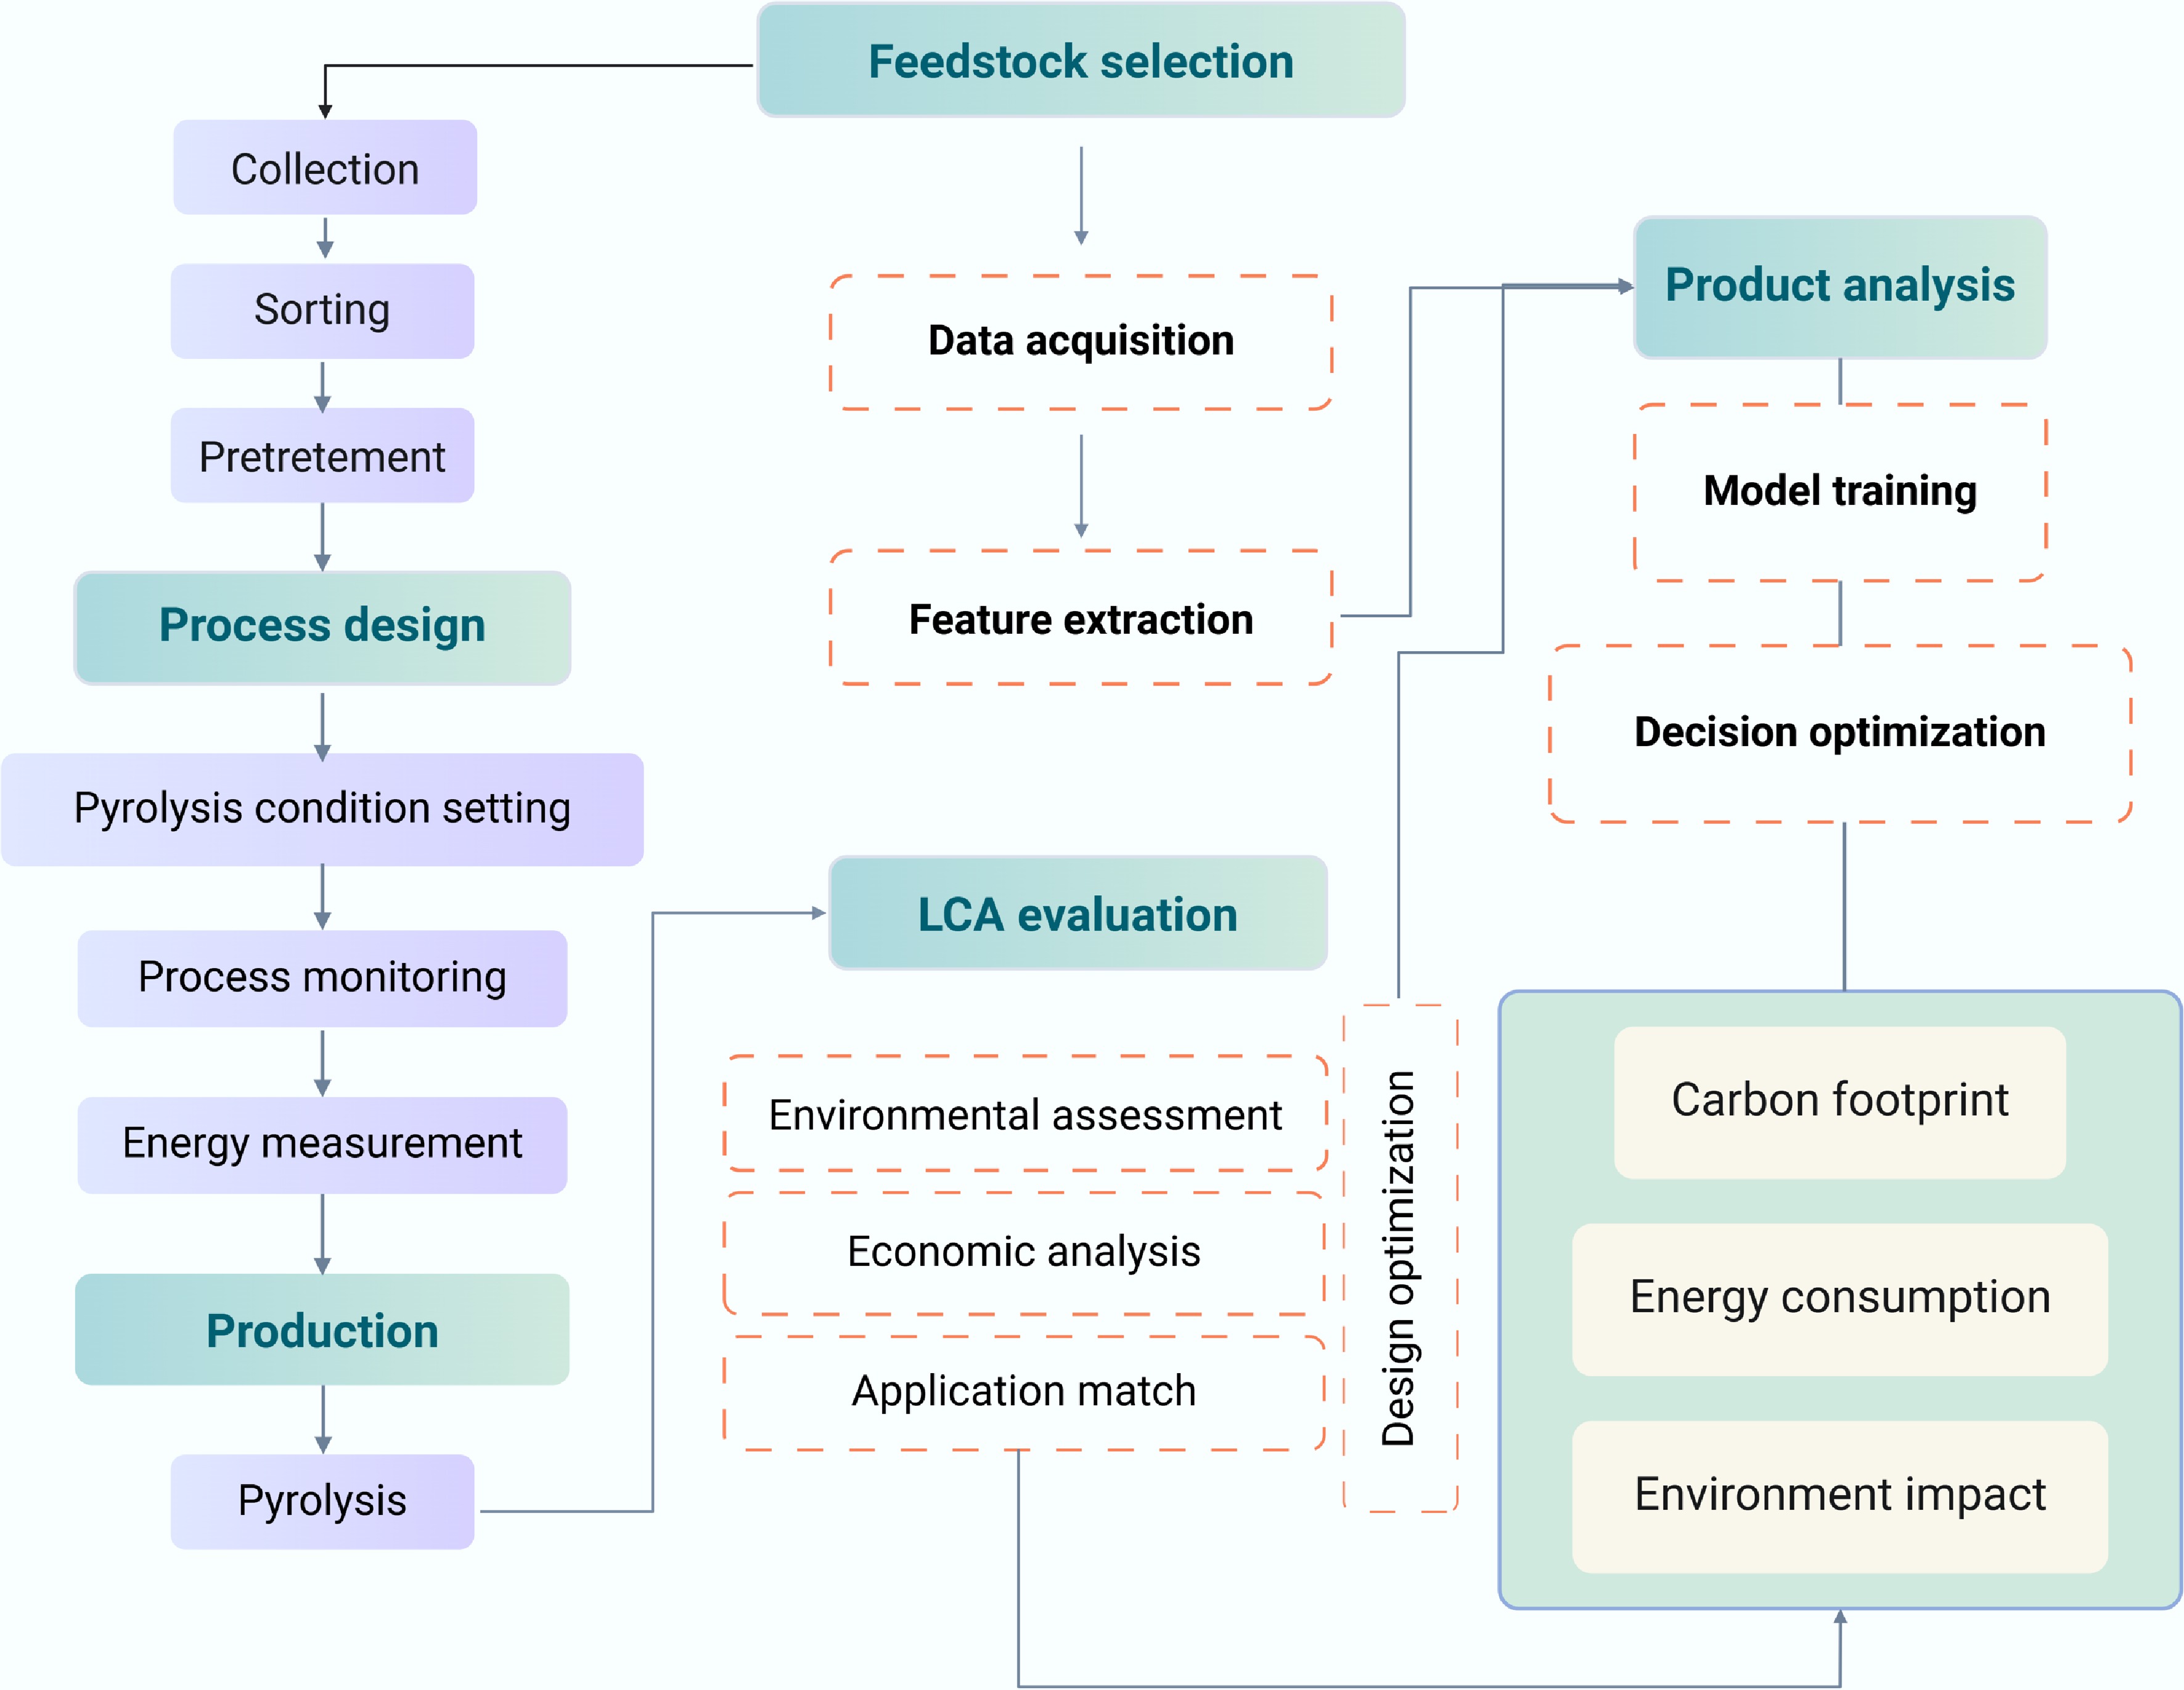
Figure 7.
Machine learning-based biochar life cycle analysis (LCA) phased flow diagram.
-
Feedstock type Carbon content Ash content Surface area
(m2/g)Pore size
(nm)pH Porosity CEC
(cmol/kg)Bulk density
(g/cm3)Ref. Wood 75%−85% 2%−5% 300−600 2−10 7−9 65%−75% 15−40 0.25−0.40 [37−41] Crop residues 60%−75% 5%−15% 100−400 5−20 6−8 55%−65% 20−30 0.30−0.50 [38−44] Sludge 30%−50% 20%−40% 50−200 10−50 5−7 40%−55% 4−35 0.45−1.50 [38,45−48] Food waste 40%−60% 10%−30% 50−150 15−40 4−6 50%−65% 15−25 0.35−0.60 [49−55] Animal manure 35%−55% 25%−45% 80−250 5−30 7−10 45%−60% 15−140 0.30−0.50 [48,56−59] Table 1.
Effects of different raw materials on biochar properties
-
Parameter Pyrolysis Hydrothermal carbonization Ref. Temperature range 300–800 °C 180–250 °C [74−76] Reaction environment Oxygen-limited or anaerobic High-temperature, high-pressure water [60,76] Main products Biochar, syngas, bio-oil Hydrochar, liquid by-products [60,76] By-products Gases (CO2, H2, CH4), tar Soluble organic compounds, acidic substances [34,77] Biochar properties High carbon content, stable structure, highly porous High carbon content, stable structure, highly porous [78] Suitable feedstock Woody biomass, agricultural waste, sludge High-moisture biomass (food waste, sewage sludge, animal wastes) [66,79] Advantages High carbon sequestration efficiency, stable biochar Suitable for wet biomass, no drying needed, rich in functional groups [63,66,67,80] Disadvantages Requires high temperatures, energy-intensive Lower carbon sequestration, less stable biochar [63,80] Table 2.
Two methods of biochar preparation
-
Modification method Change in surface area Functional group changes Application field Ref. CO2 activation 50%–100% Increased carboxyl, phenol groups Water pollution treatment [99,100] Fe3+ doping 20%–60% Increased catalytic active sites Catalytic degradation of pollutants [92] Sulfonation 10%–40% Increased SO3H groups Acidic catalysis [101−103] KOH activation 80%–150% Enhanced hydroxyl, carbonyl groups CO2 capture, energy storage [104,105] N-doping 20%–80% Introduced amine, pyridinic-N Electrochemical catalysis [106−110] Table 3.
Effects of different biochar modification methods on its properties
-
Composite type Specific surface area (m2/g) Functional properties Application scenarios Performance improvement Ref. Graphene-biochar 800–1,200 High conductivity, catalytic activity Supercapacitors, electrocatalysis 200%–300% [120] Fe3O4-loaded biochar 300–500 Magnetic recovery, redox capacity Heavy metal adsorption, Fenton reaction 150%–200% [121,122] N-doped porous biochar 600–900 High nitrogen content, alkaline sites CO2 capture, Soil pH regulation 80%–120% [107,123] Chitosan-biochar membrane 50–150 Antibacterial property, biodegradability Water treatment 90%–130% [124] Fe/Cu bimetallic-loaded biochar 200–400 Bimetallic synergistic adsorption,
magnetic recoveryHigh-efficiency Pb2+/Cd2+ adsorption 400%–500% [125] Table 4.
Performance and applications of novel biochar composite materials
-
Feedstock type Pyrolysis
temperature (°C)Carbon
sequestration rateTotal GHG emission reduction rate Key mechanisms Ref. Crop residues 400–600 60%–75% 40%–60% Inhibition of denitrification enzyme activity; NH4+ adsorption [159,160] Municipal sludge 300–500 40%–50% 30%–50% Heavy metal immobilization; NO3− adsorption; pH regulation [161,162] Wood waste 500–700 85%–90% 20%–40% Landfill diversion; Physical barrier formation to delay decomposition [163] Food waste 250–400 30%–45% 25%–45% Promotion of methanotroph proliferation; C/N ratio adjustment [164,165] Algal biomass 500–700 75%–85% 40%–60% High-temperature stabilized carbon structure, promotes soil carbon-fixing microbial communities [166,167] Poultry manure 300–500 50%–60% 35%–50% Reduces N2O emissions, adsorbs NH3 [168,169] Table 5.
Correlation between biochar feedstock types and carbon sequestration-emission reduction efficiency
-
Method type Application direction Representative applications Technical advantages Ref. CNN Image structure recognition Predicting specific surface area and pore size Extracts microstructural image features [212] RNN Dynamic data modeling Analyzing performance variations during pyrolysis Adapts to time-series data [206] Multi-objective optimization Comprehensive performance optimization Simultaneously optimizing yield, adsorption rate,
and energy consumptionCollaborative optimization with high efficiency [213] GA/PSO Rapid process optimization Identifying optimal pyrolysis temperature and modifier dosage Broad search range & rapid convergence [214] MTDL (Multi-task
deep learning)Multi-objective collaborative optimization Simultaneously optimizing biochar's adsorption
of cadmium (Cd) and methane (CH4) emission reduction efficiencyCross-task parameter sharing, maximization of synergistic effects [215] Table 6.
Typical applications of deep learning and multi-objective optimization in biochar research
Figures
(7)
Tables
(6)