-
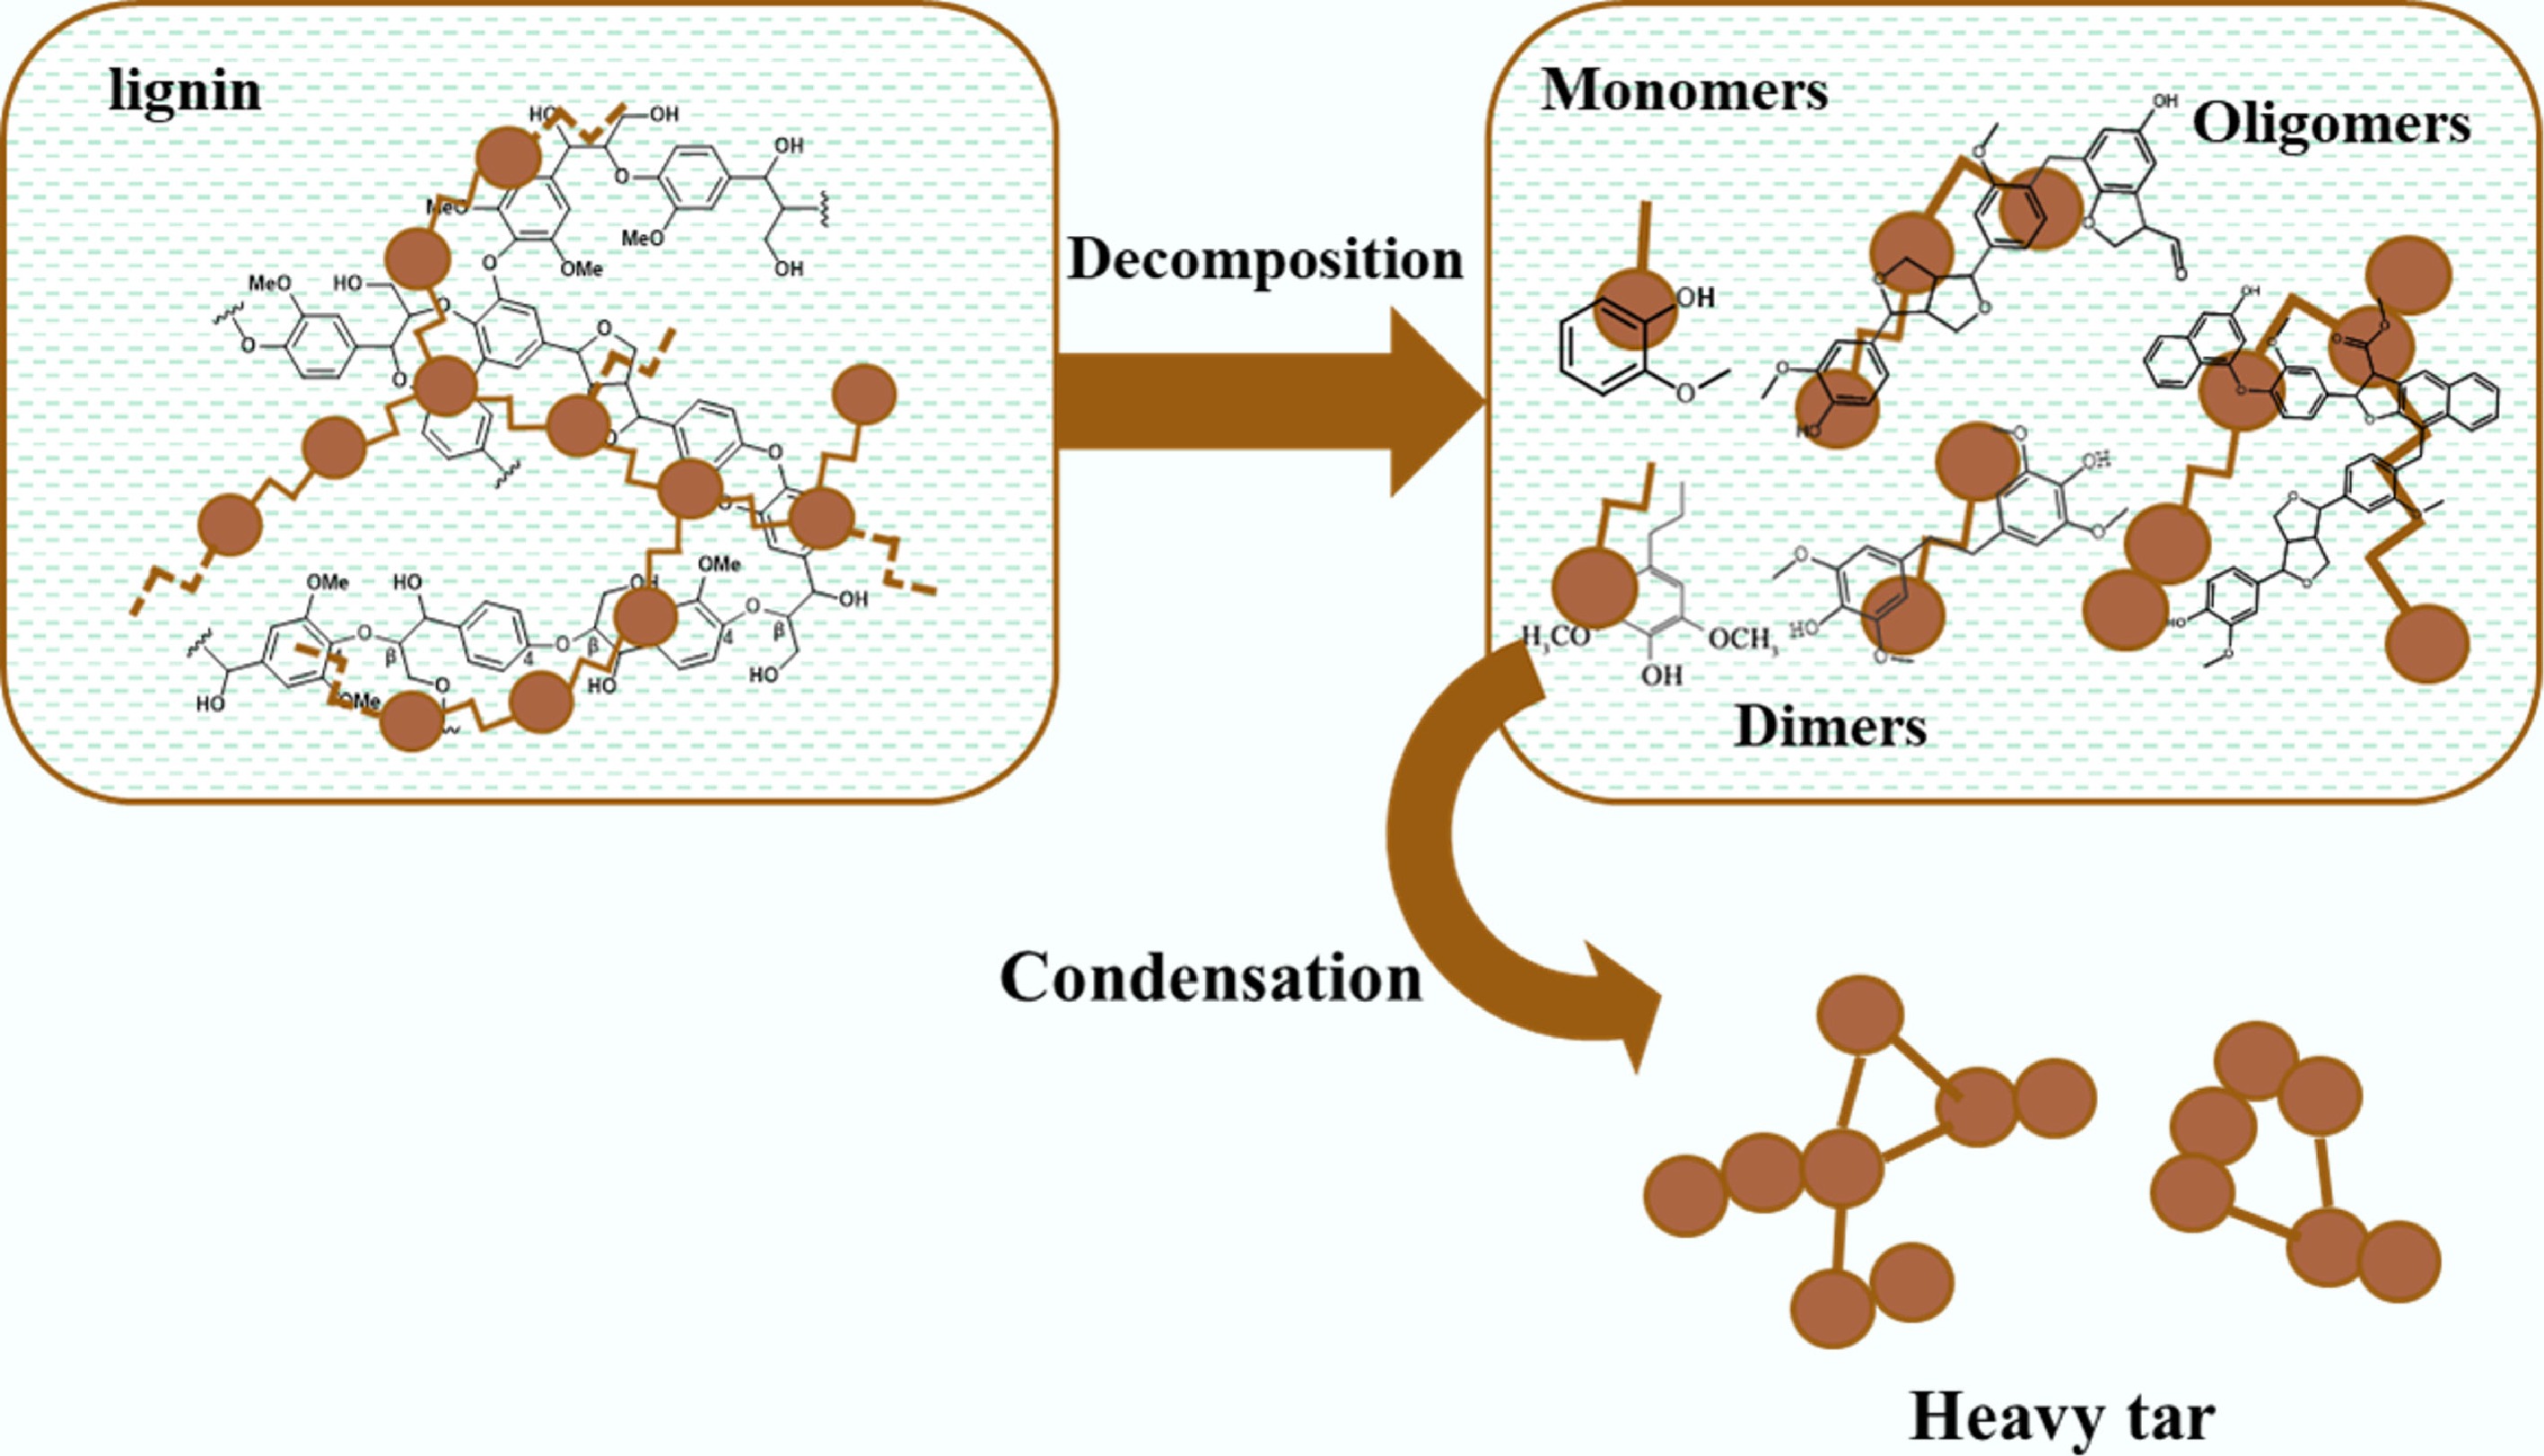
Figure 1.
Structure and properties of lignin and its depolymerization products.
-
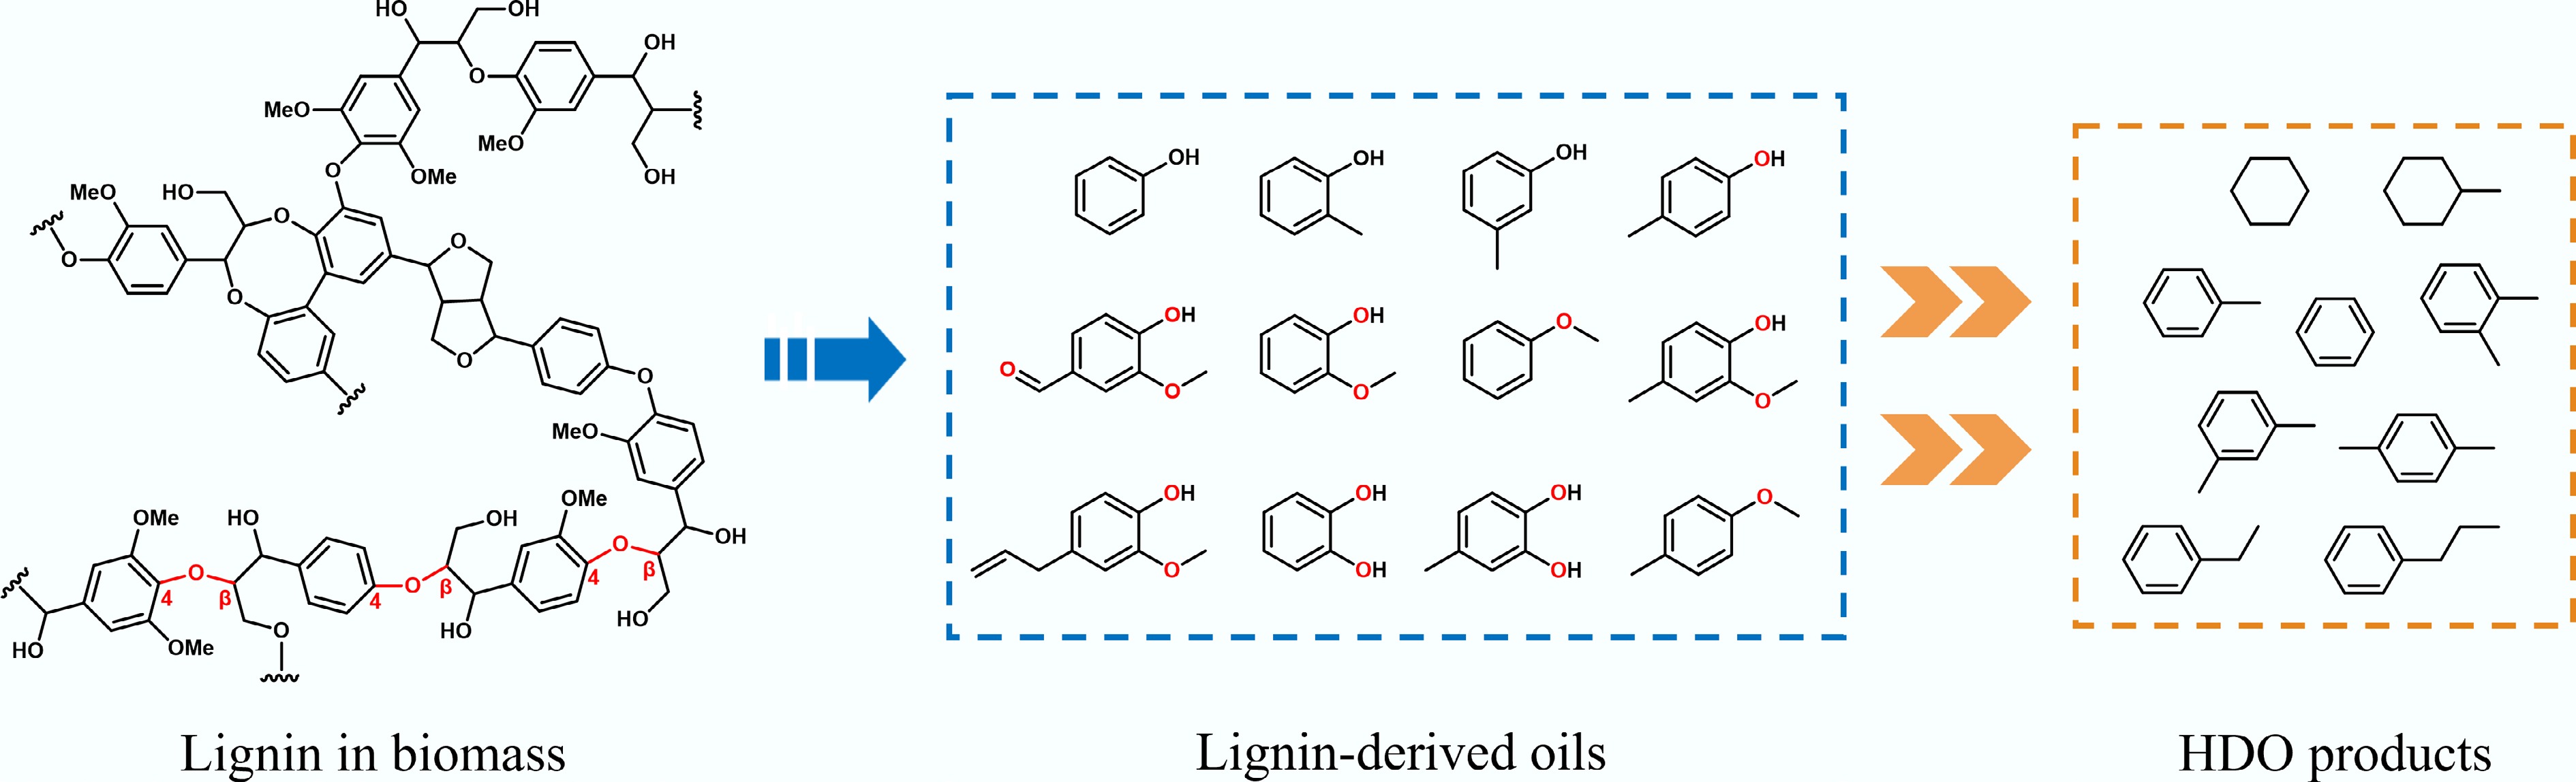
Figure 2.
Common structural features of lignin, lignin-derived oils, and HDO products.
-
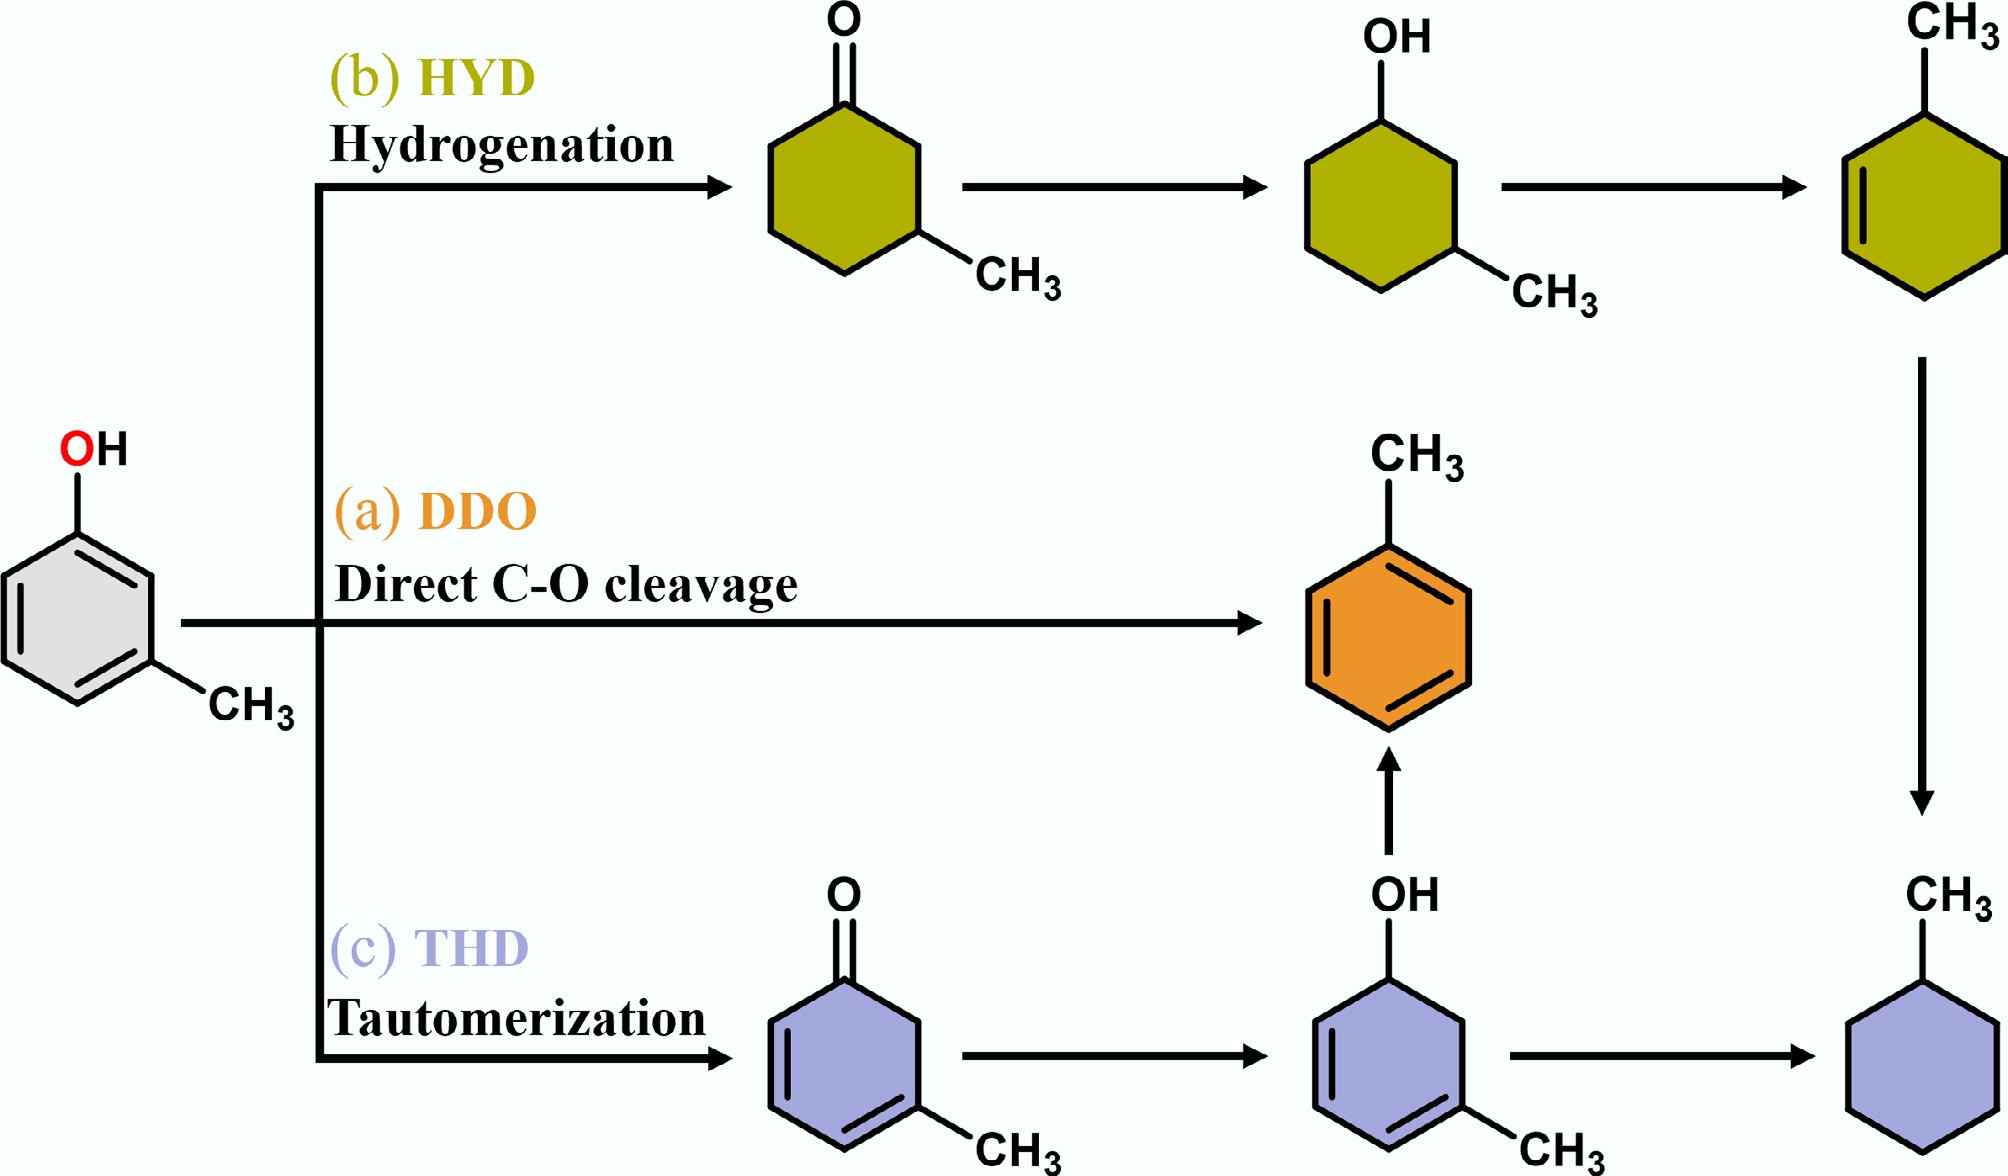
Figure 3.
Proposed conversion pathways of m-cresol HDO to toluene and methylcyclohexane.
-
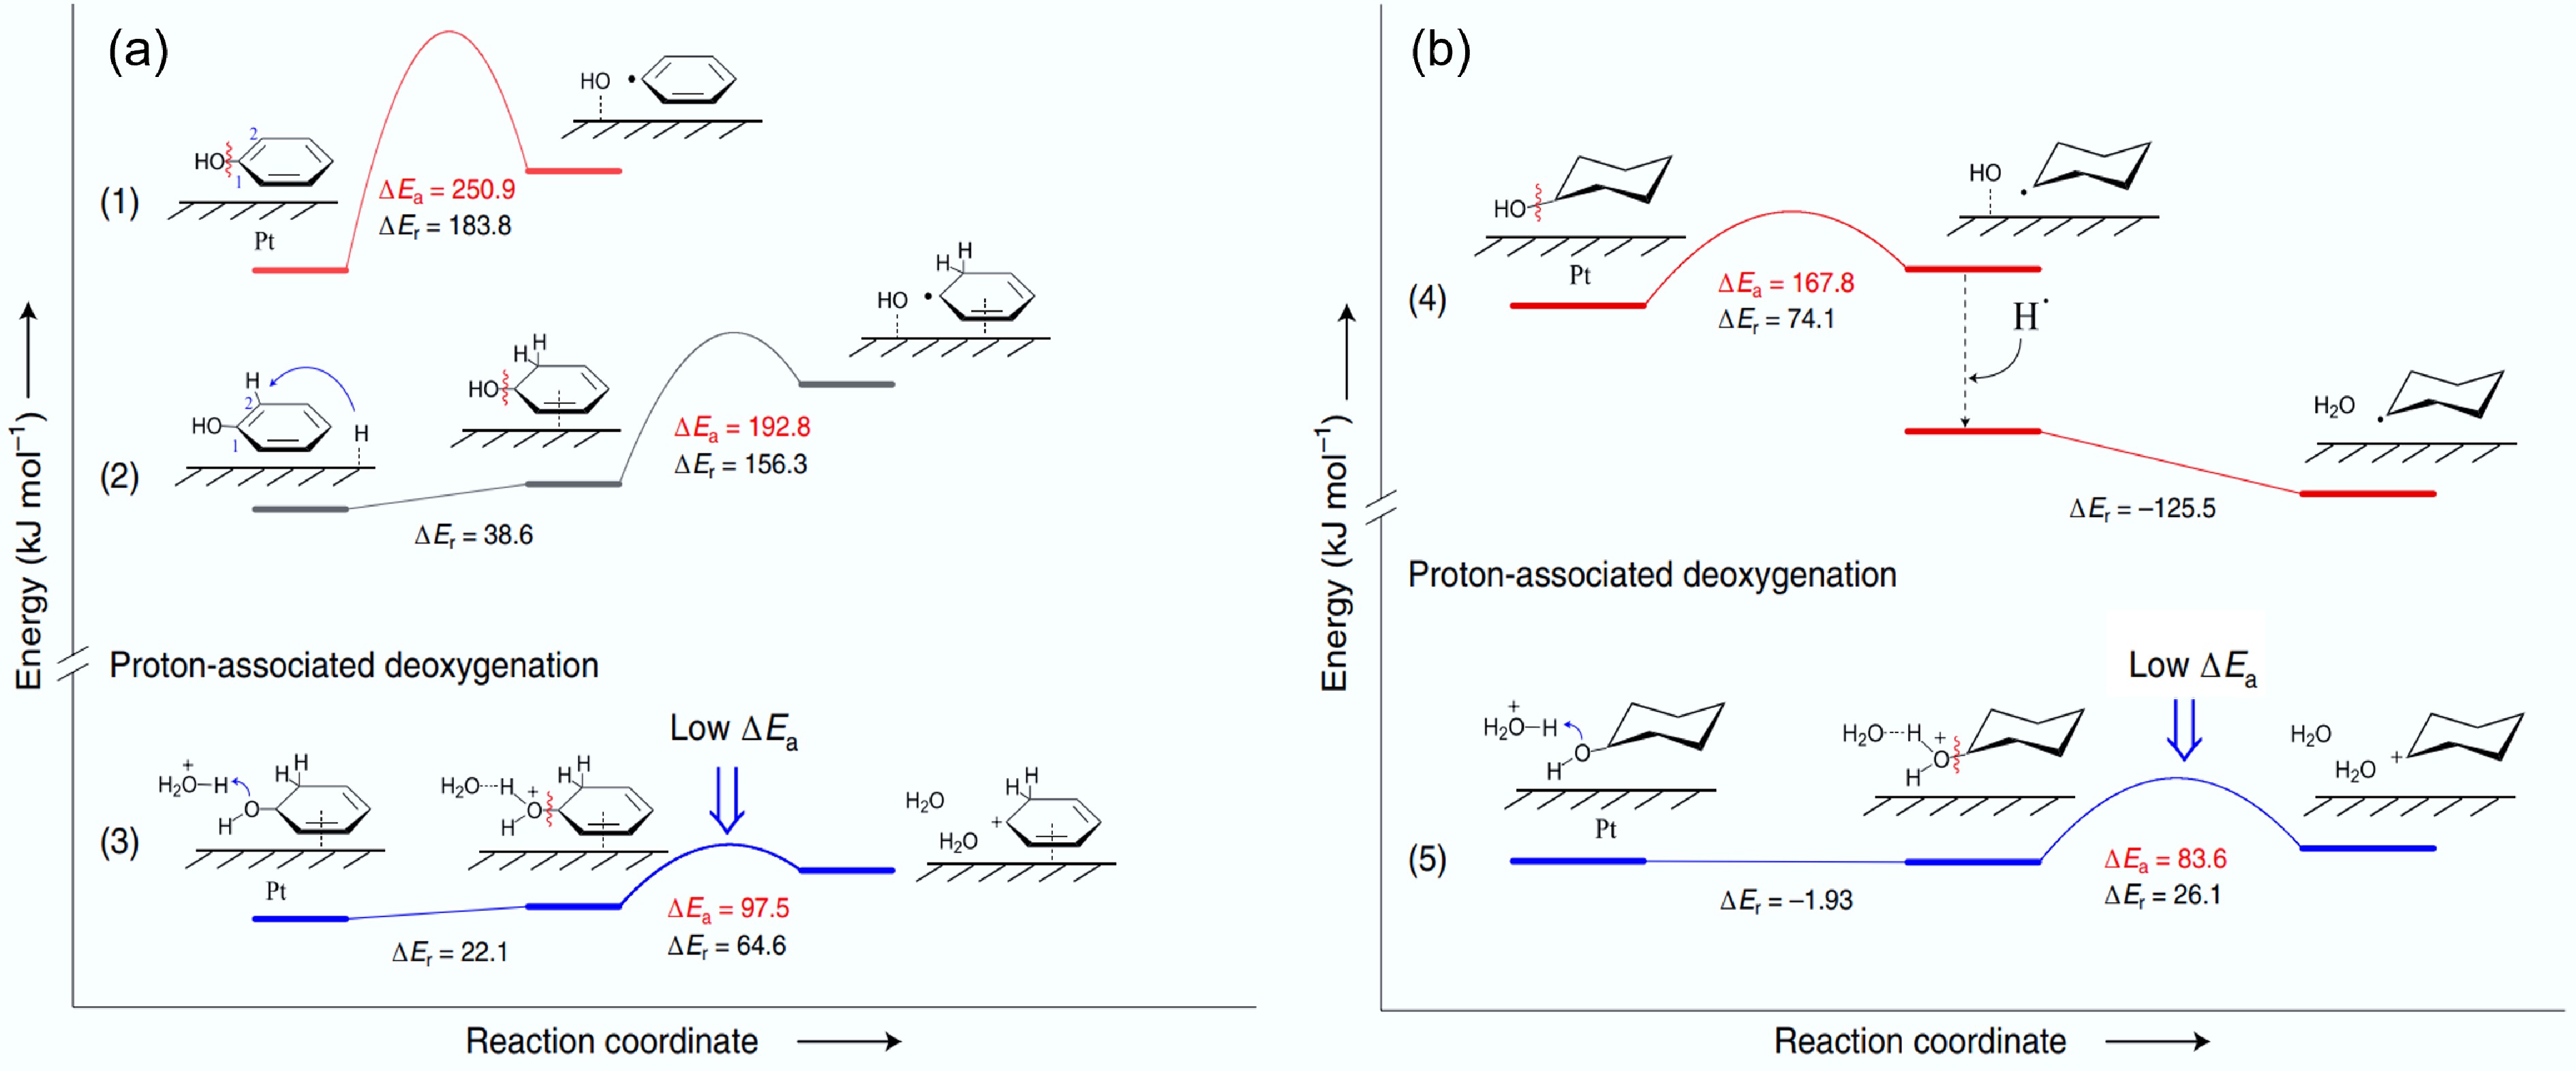
Figure 4.
Energy profiles of possible C–O bond breaking pathways for (a) phenol, and (b) cyclohexanol in HDO on the Pt (111) surface. ΔEr: reaction energy, ΔEa: activation energy. Reproduced with permission[38]. Copyright 2020, Springer Nature.
-
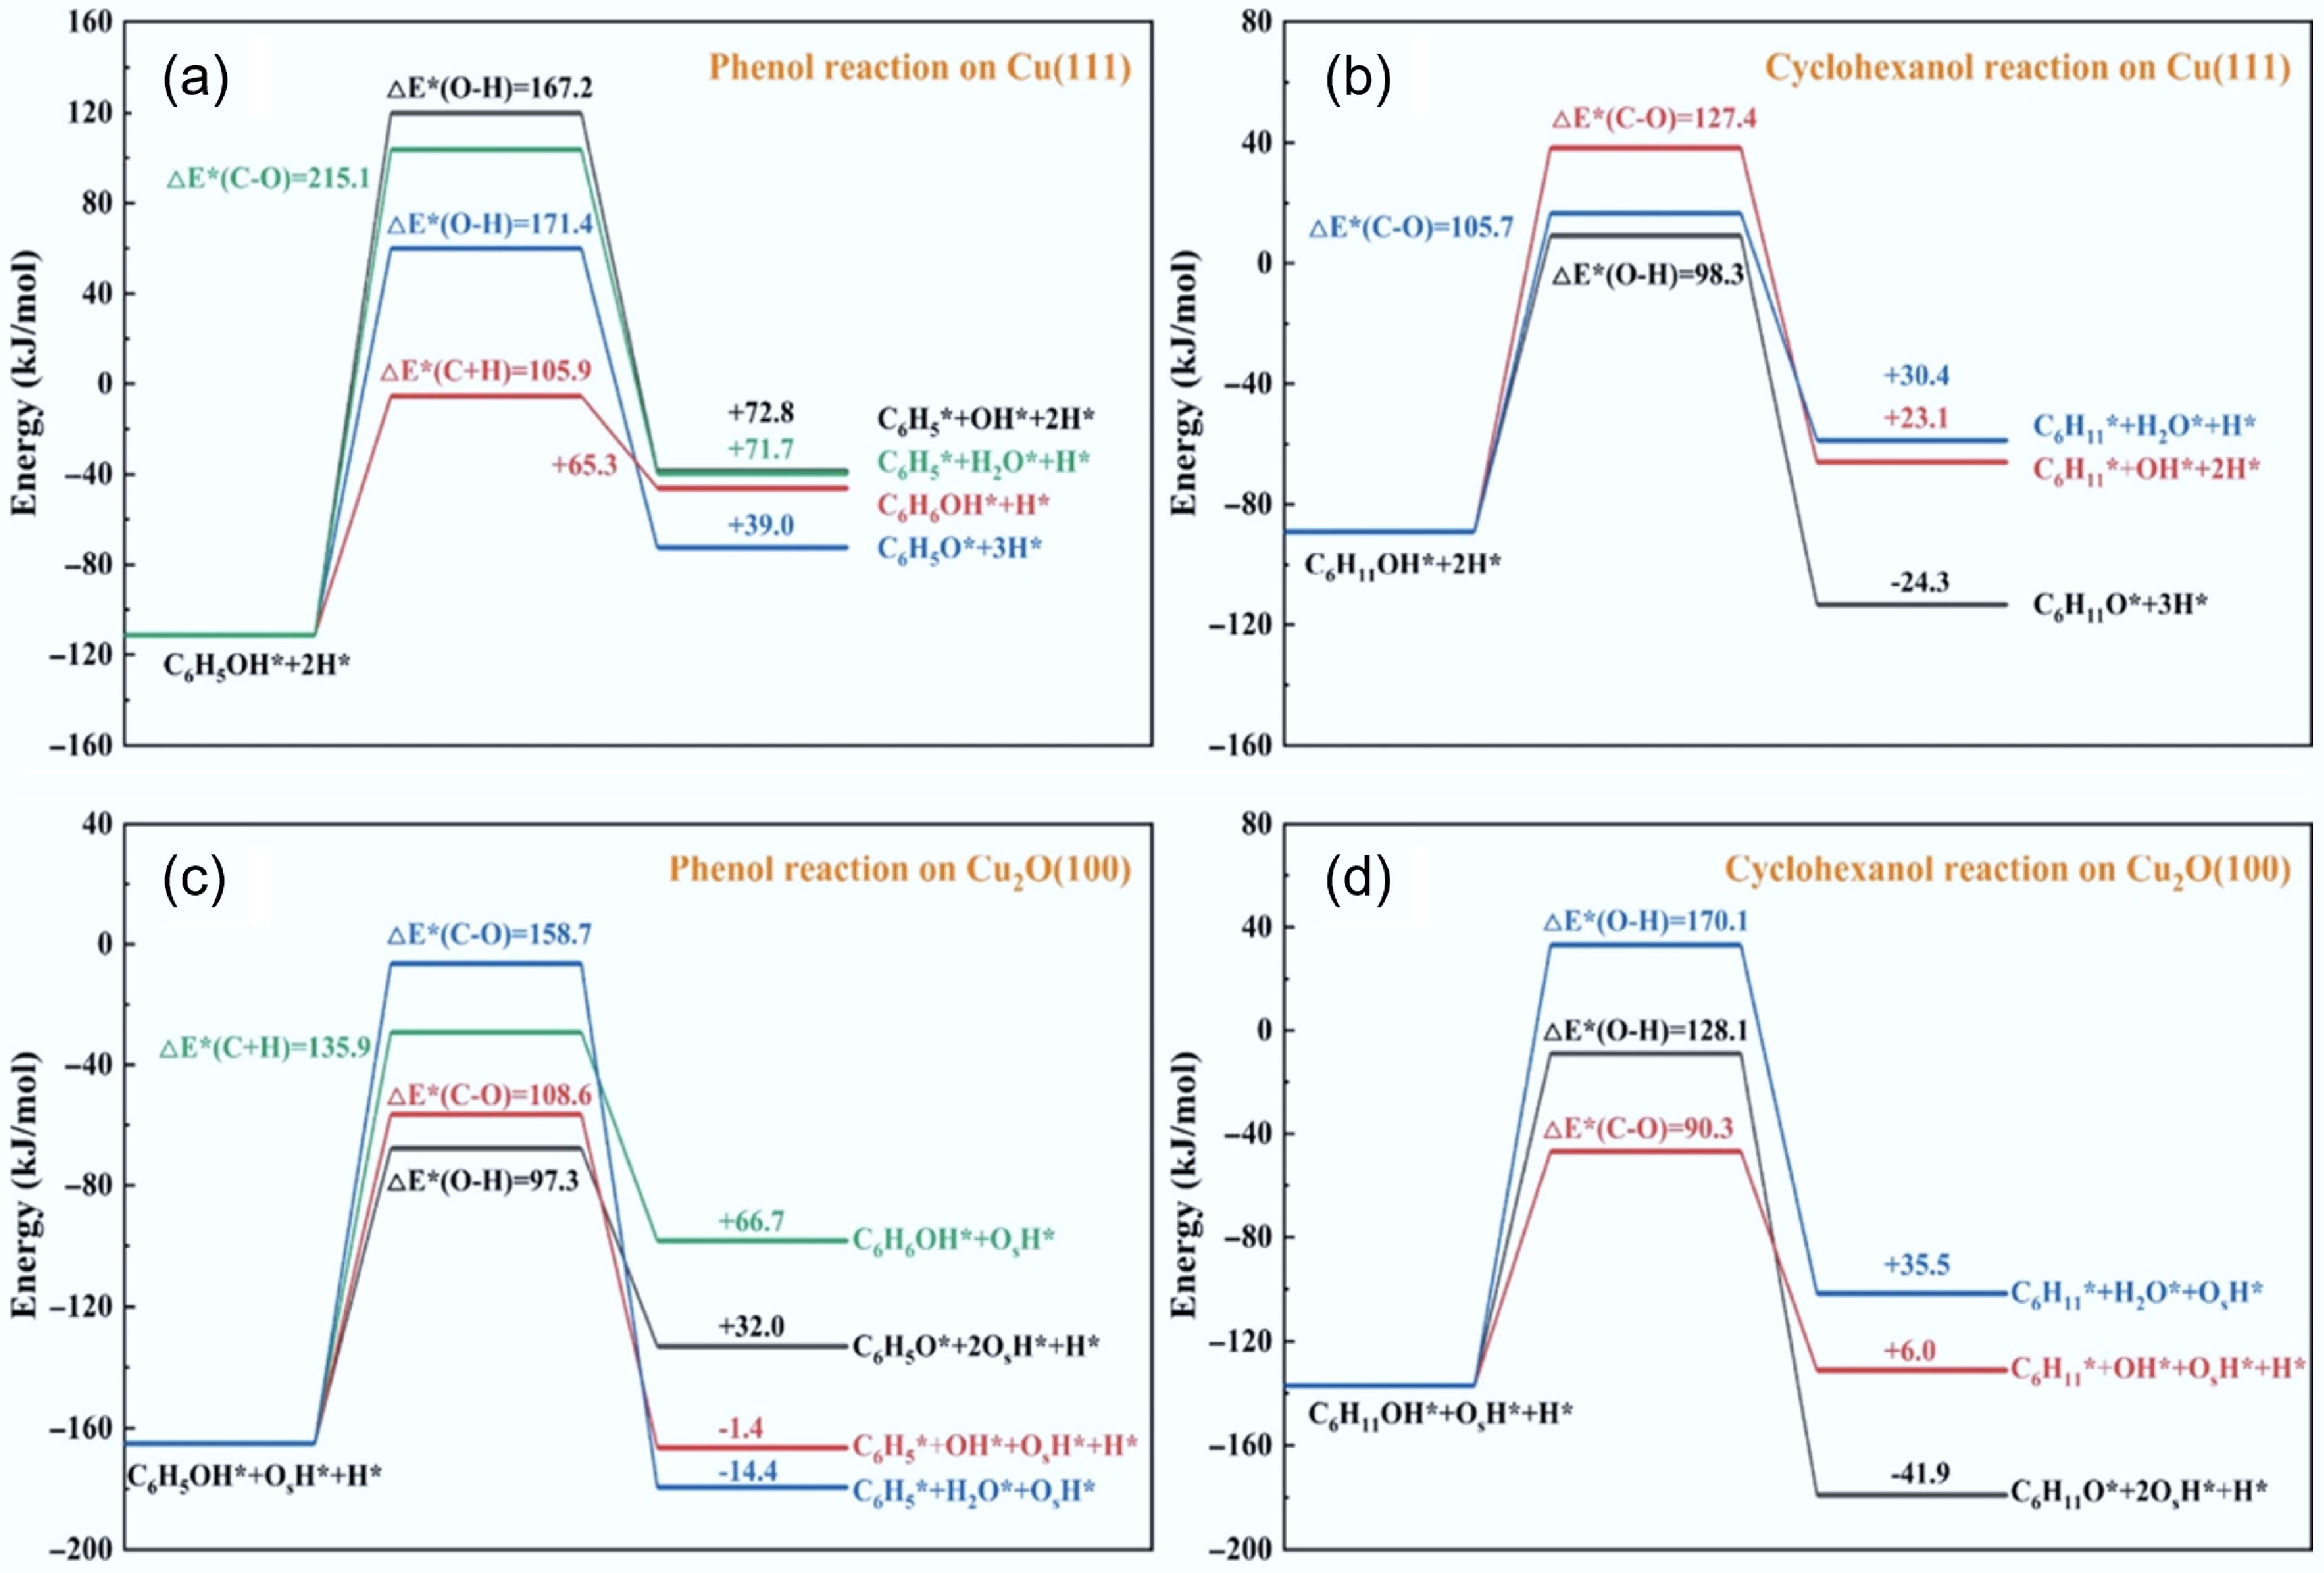
Figure 5.
(a) Phenol and (b) cyclohexanol reaction over Cu (111), and (c) Phenol and (d) cyclohexanol reaction over Cu (111) Cu2O (100) surfaces. Reproduced with permission[39]. Copyright 2022, American Chemical Society.
-
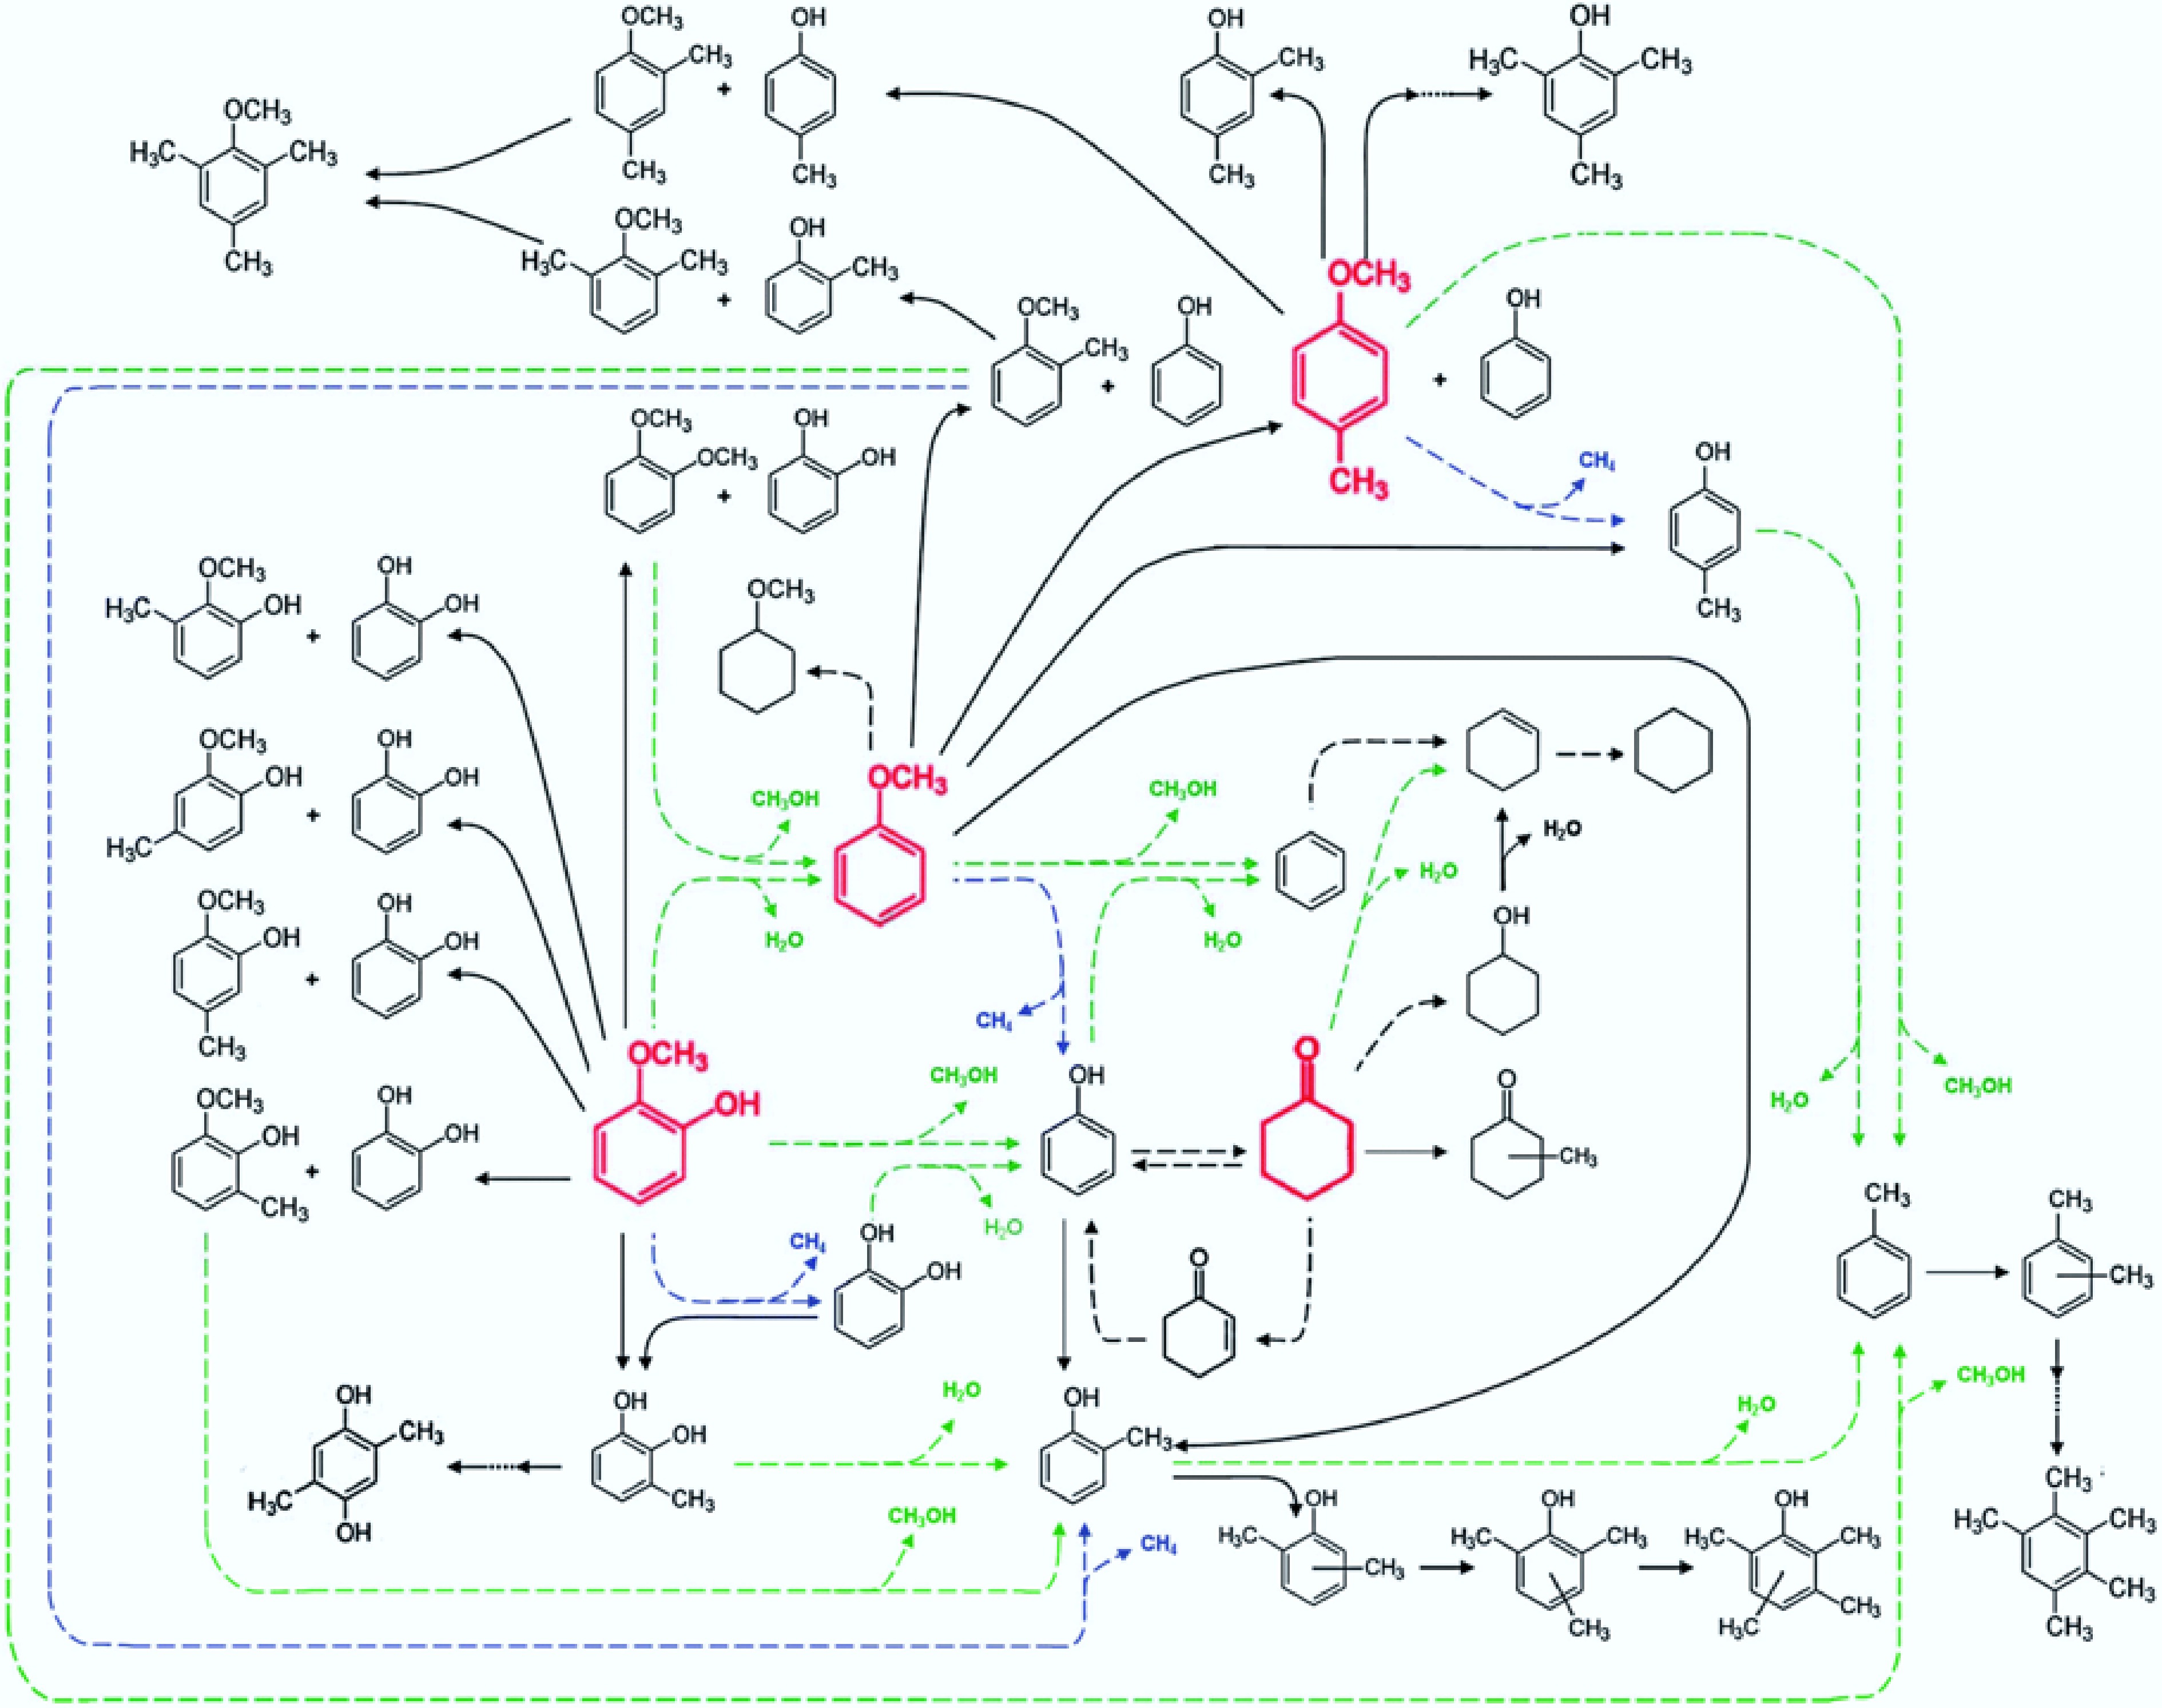
Figure 6.
Reaction pathway for the conversion of lignin-derived compounds under Pt/γ-Al2O3. Reproduced with permission[43]. Copyright 2012, Royal Society of Chemistry.
-
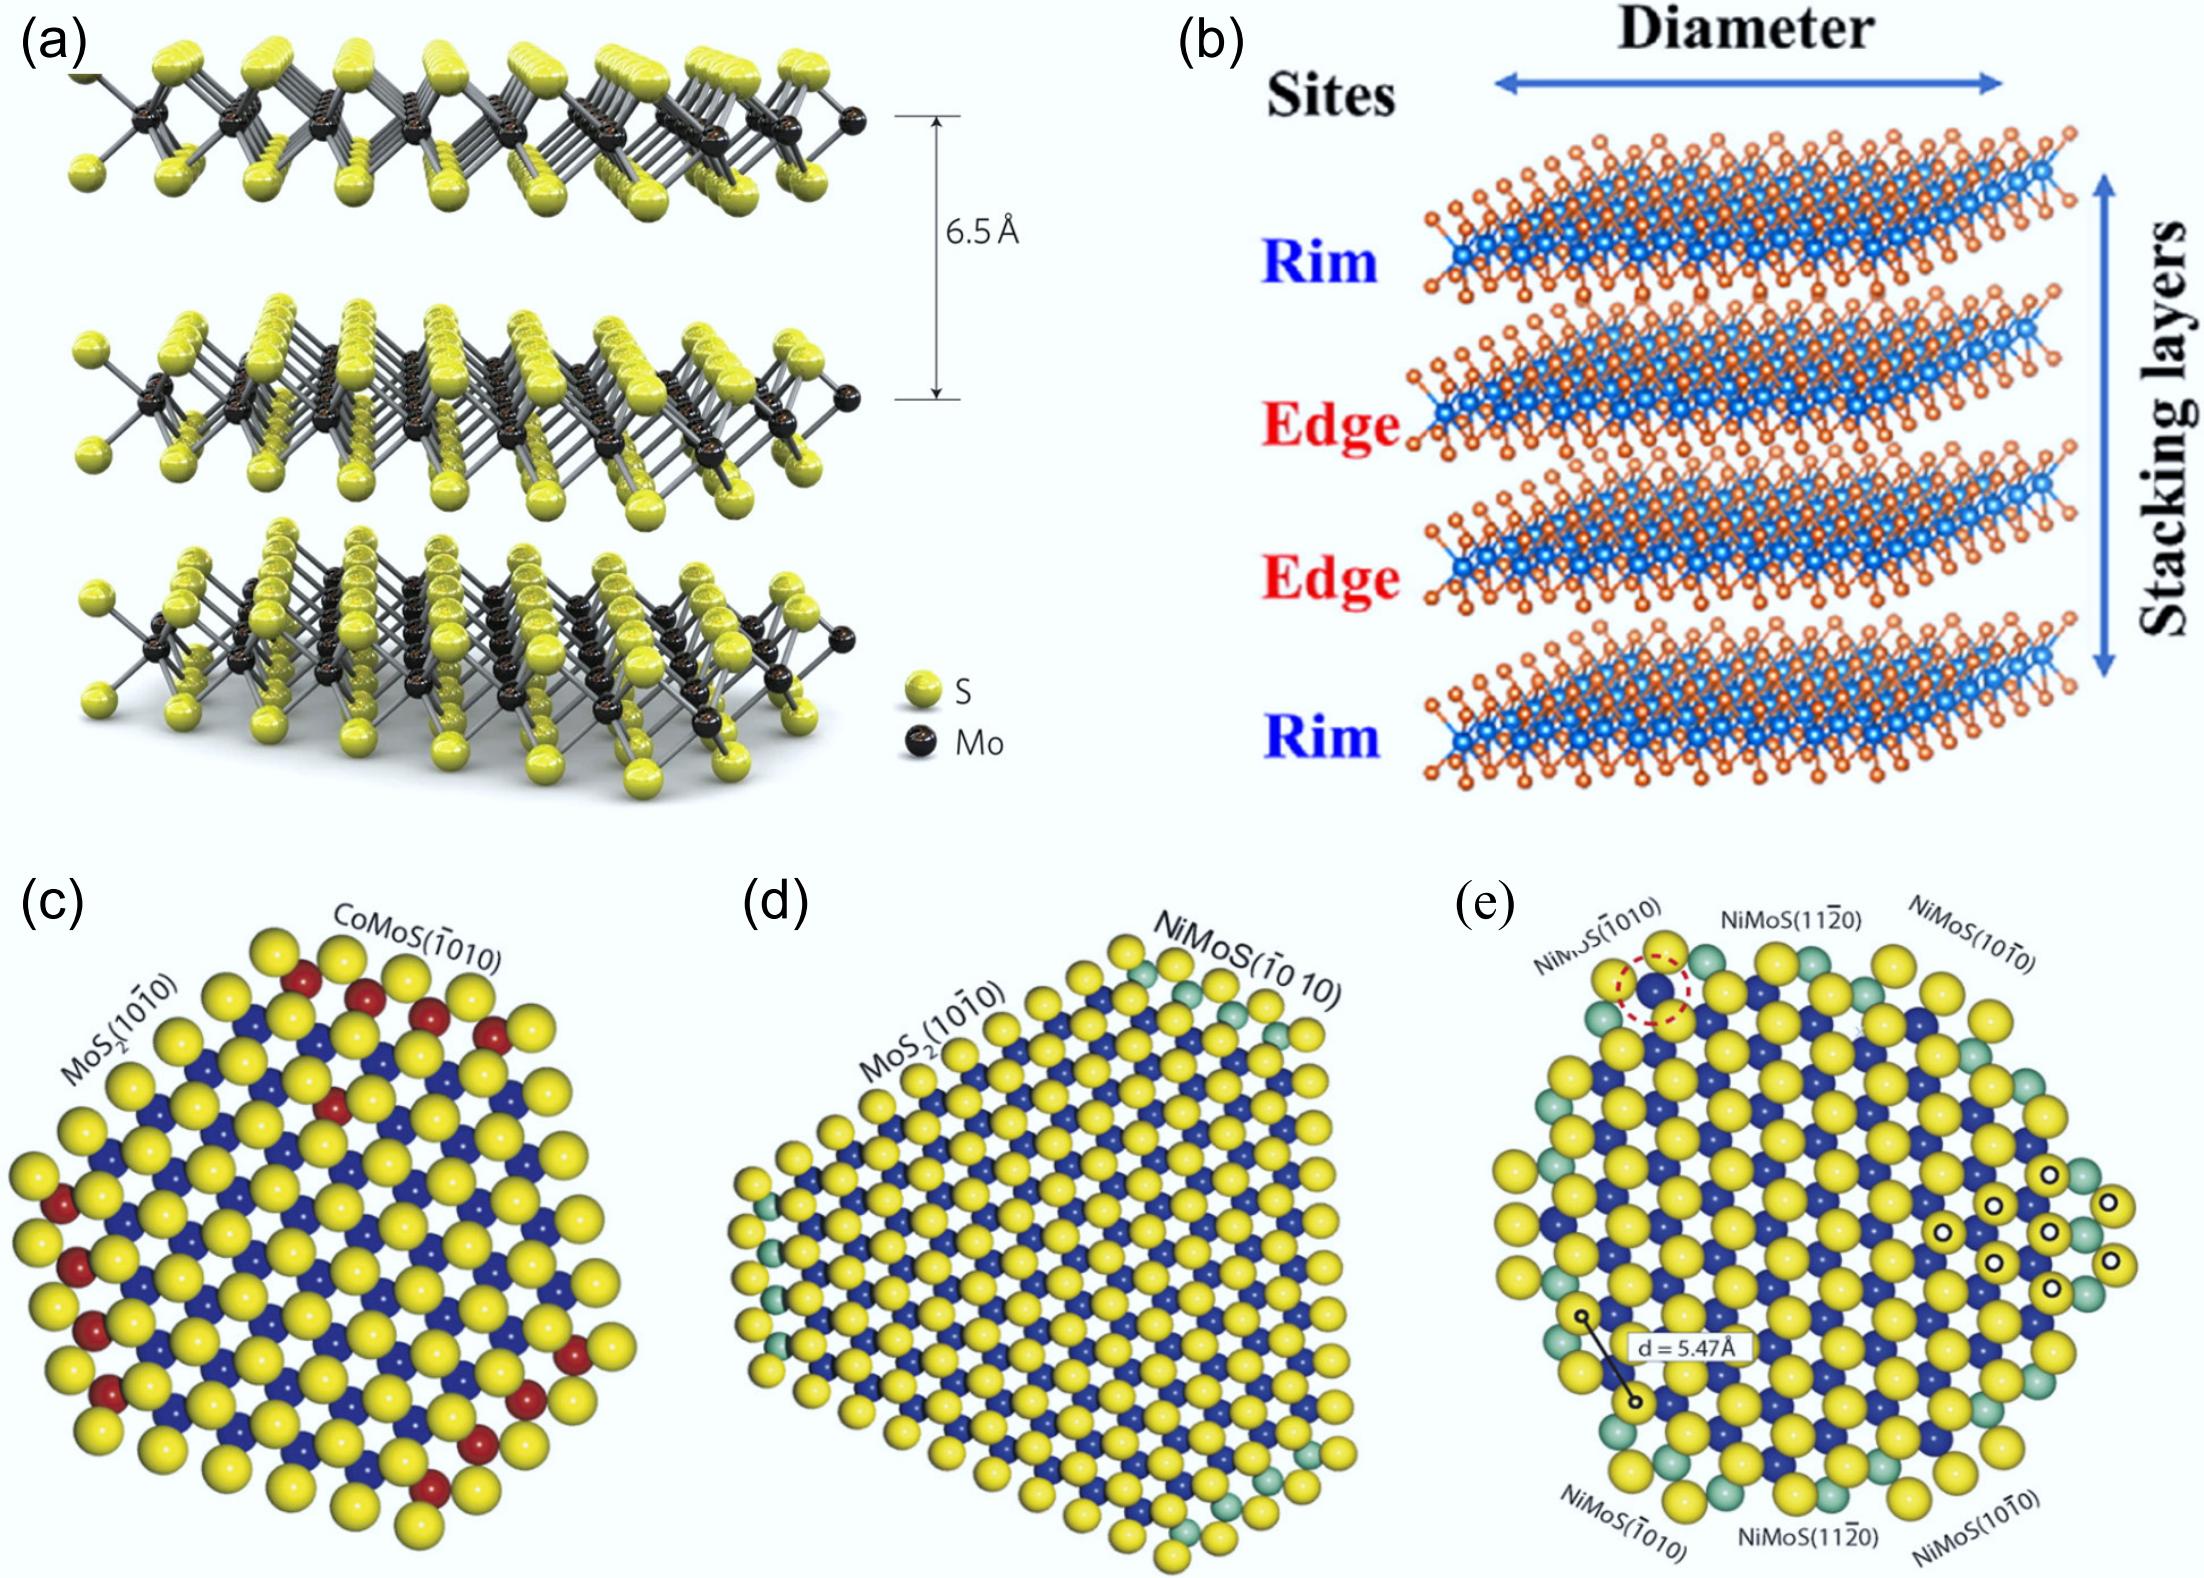
Figure 7.
(a) Three-dimensional model of the MoS2 structure. Reproduced with permission[70]. Copyright 2011, Springer Nature. (b) Rim-edge model of an MoS2 catalytic particle. Reproduced with permission[76]. Copyright 2023, Elsevier. Ball model of (c) Co–Mo–S, (d) type A Ni–Mo–S, (e) type B Ni–Mo–S. S: yellow, Mo: blue, Co: red, Ni: cyan. Reproduced with permission[77]. Copyright 2007, Elsevier.
-
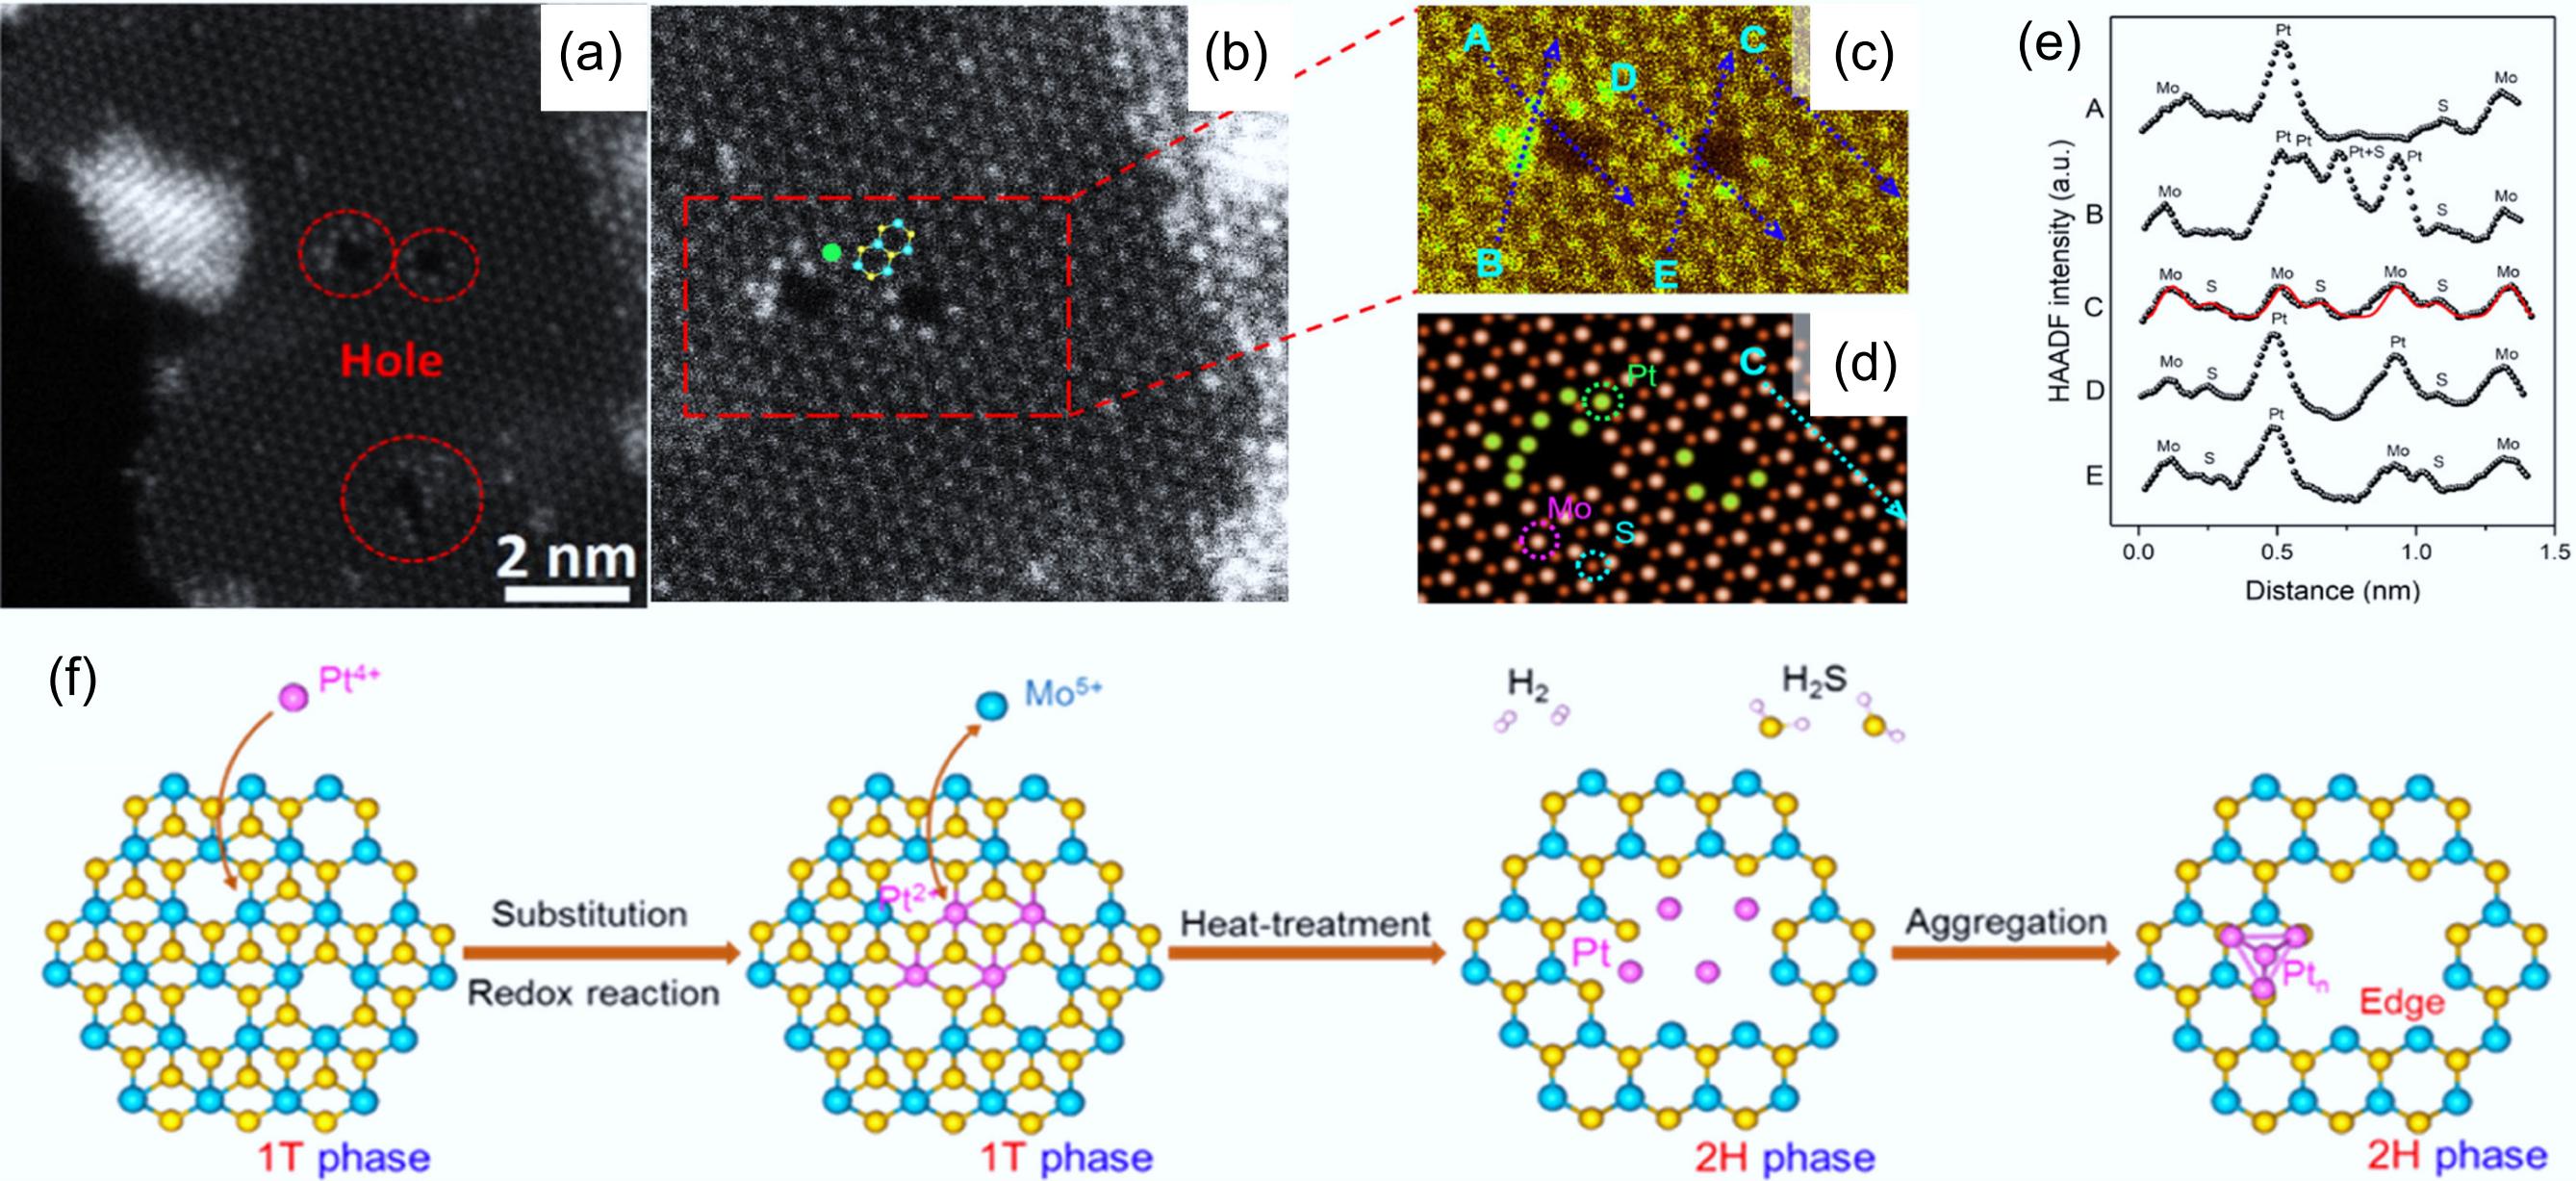
Figure 8.
(a) Pt-Mo-200, and (b), (c) enlarged HAADF-STEM images. (d) Simulated high-resolution HAADF-STEM results for Pt-Mo-200. (e) Measurement of the intensity profiles of the four lines labeled in (c) and (d). (f) Schematic of the synthesis of Pt-MoS2-x catalyst. Reproduced with permission[51]. Copyright 2021, American Chemical Society.
-
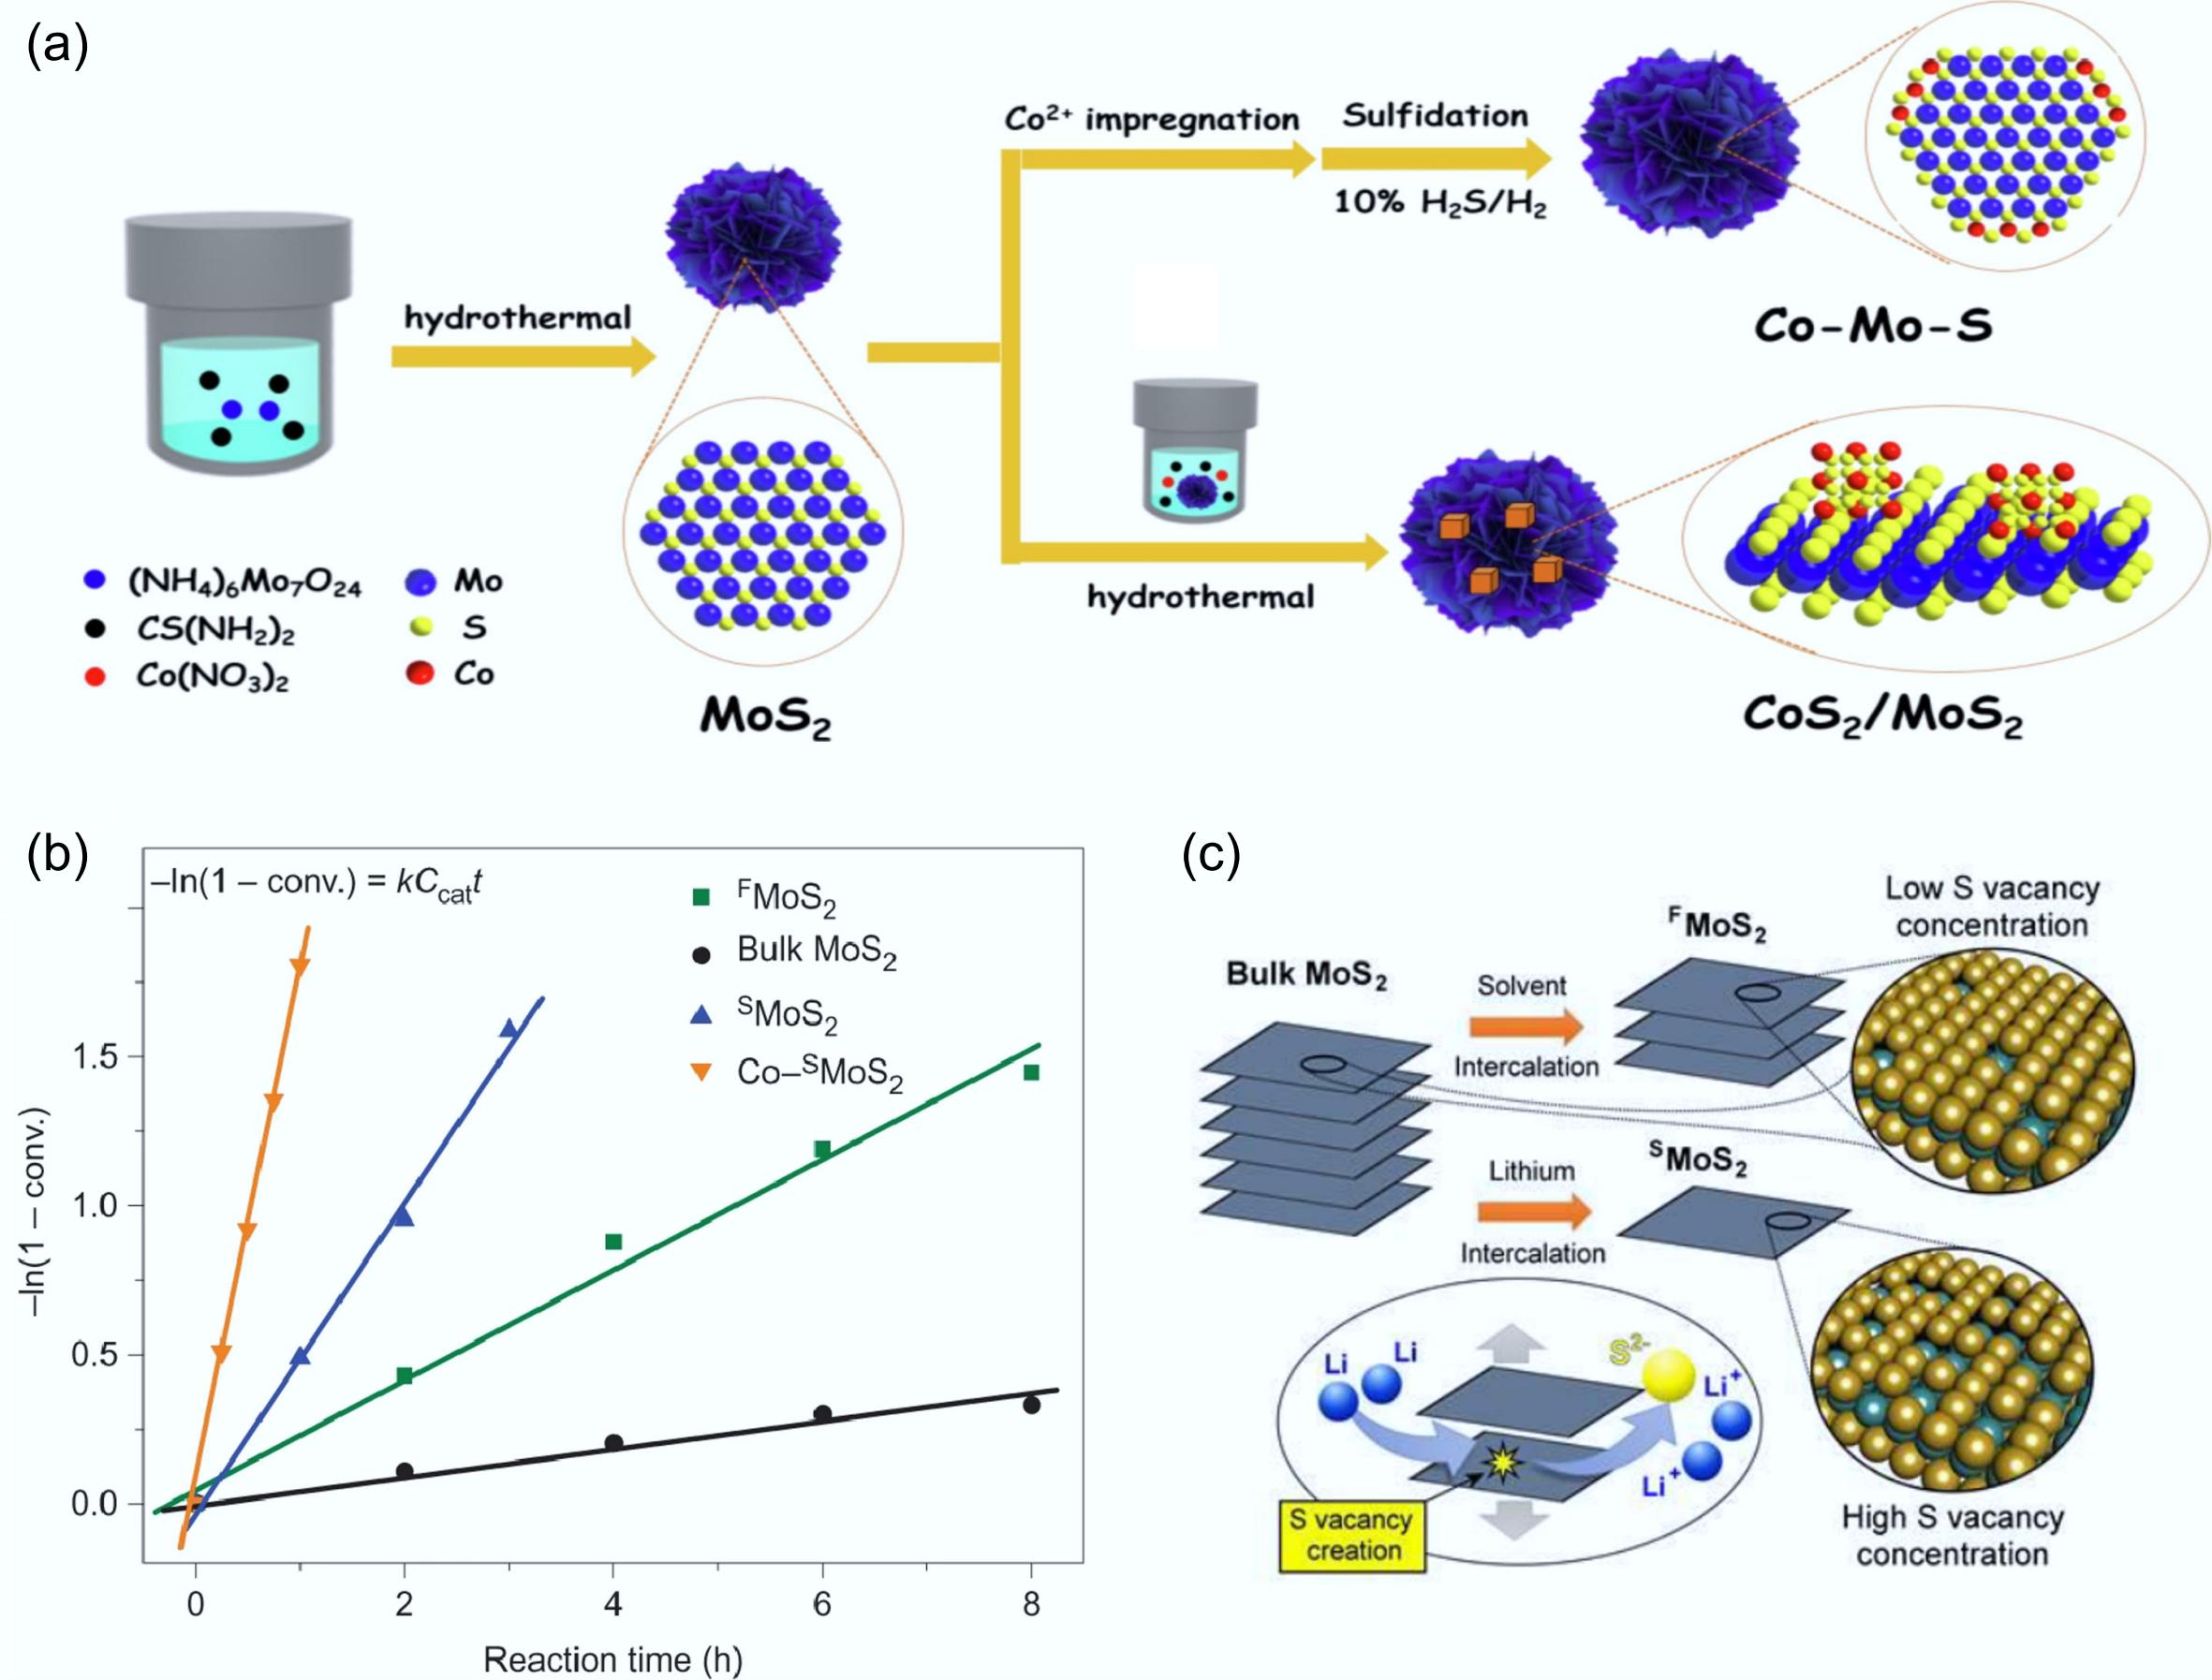
Figure 9.
(a) Schematic illustration of the preparation routes for Co-Mo-S and CoS2/MoS2 catalytic materials. Reproduced with permission[49]. Copyright 2023, Elsevier. (b) Kinetic study of p-cresol to toluene at 3 MPa and 300 °C, the order of activity: Co-SMoS2 > SMoS2 > FMoS2 > bulk MoS2. (c) Physical (solvent intercalation) and chemical (Lithium intercalation) exfoliation methods of bulk MoS2, S: yellow, Mo: green. Reproduced with permission[48]. Copyright 2017, Springer Nature.
-
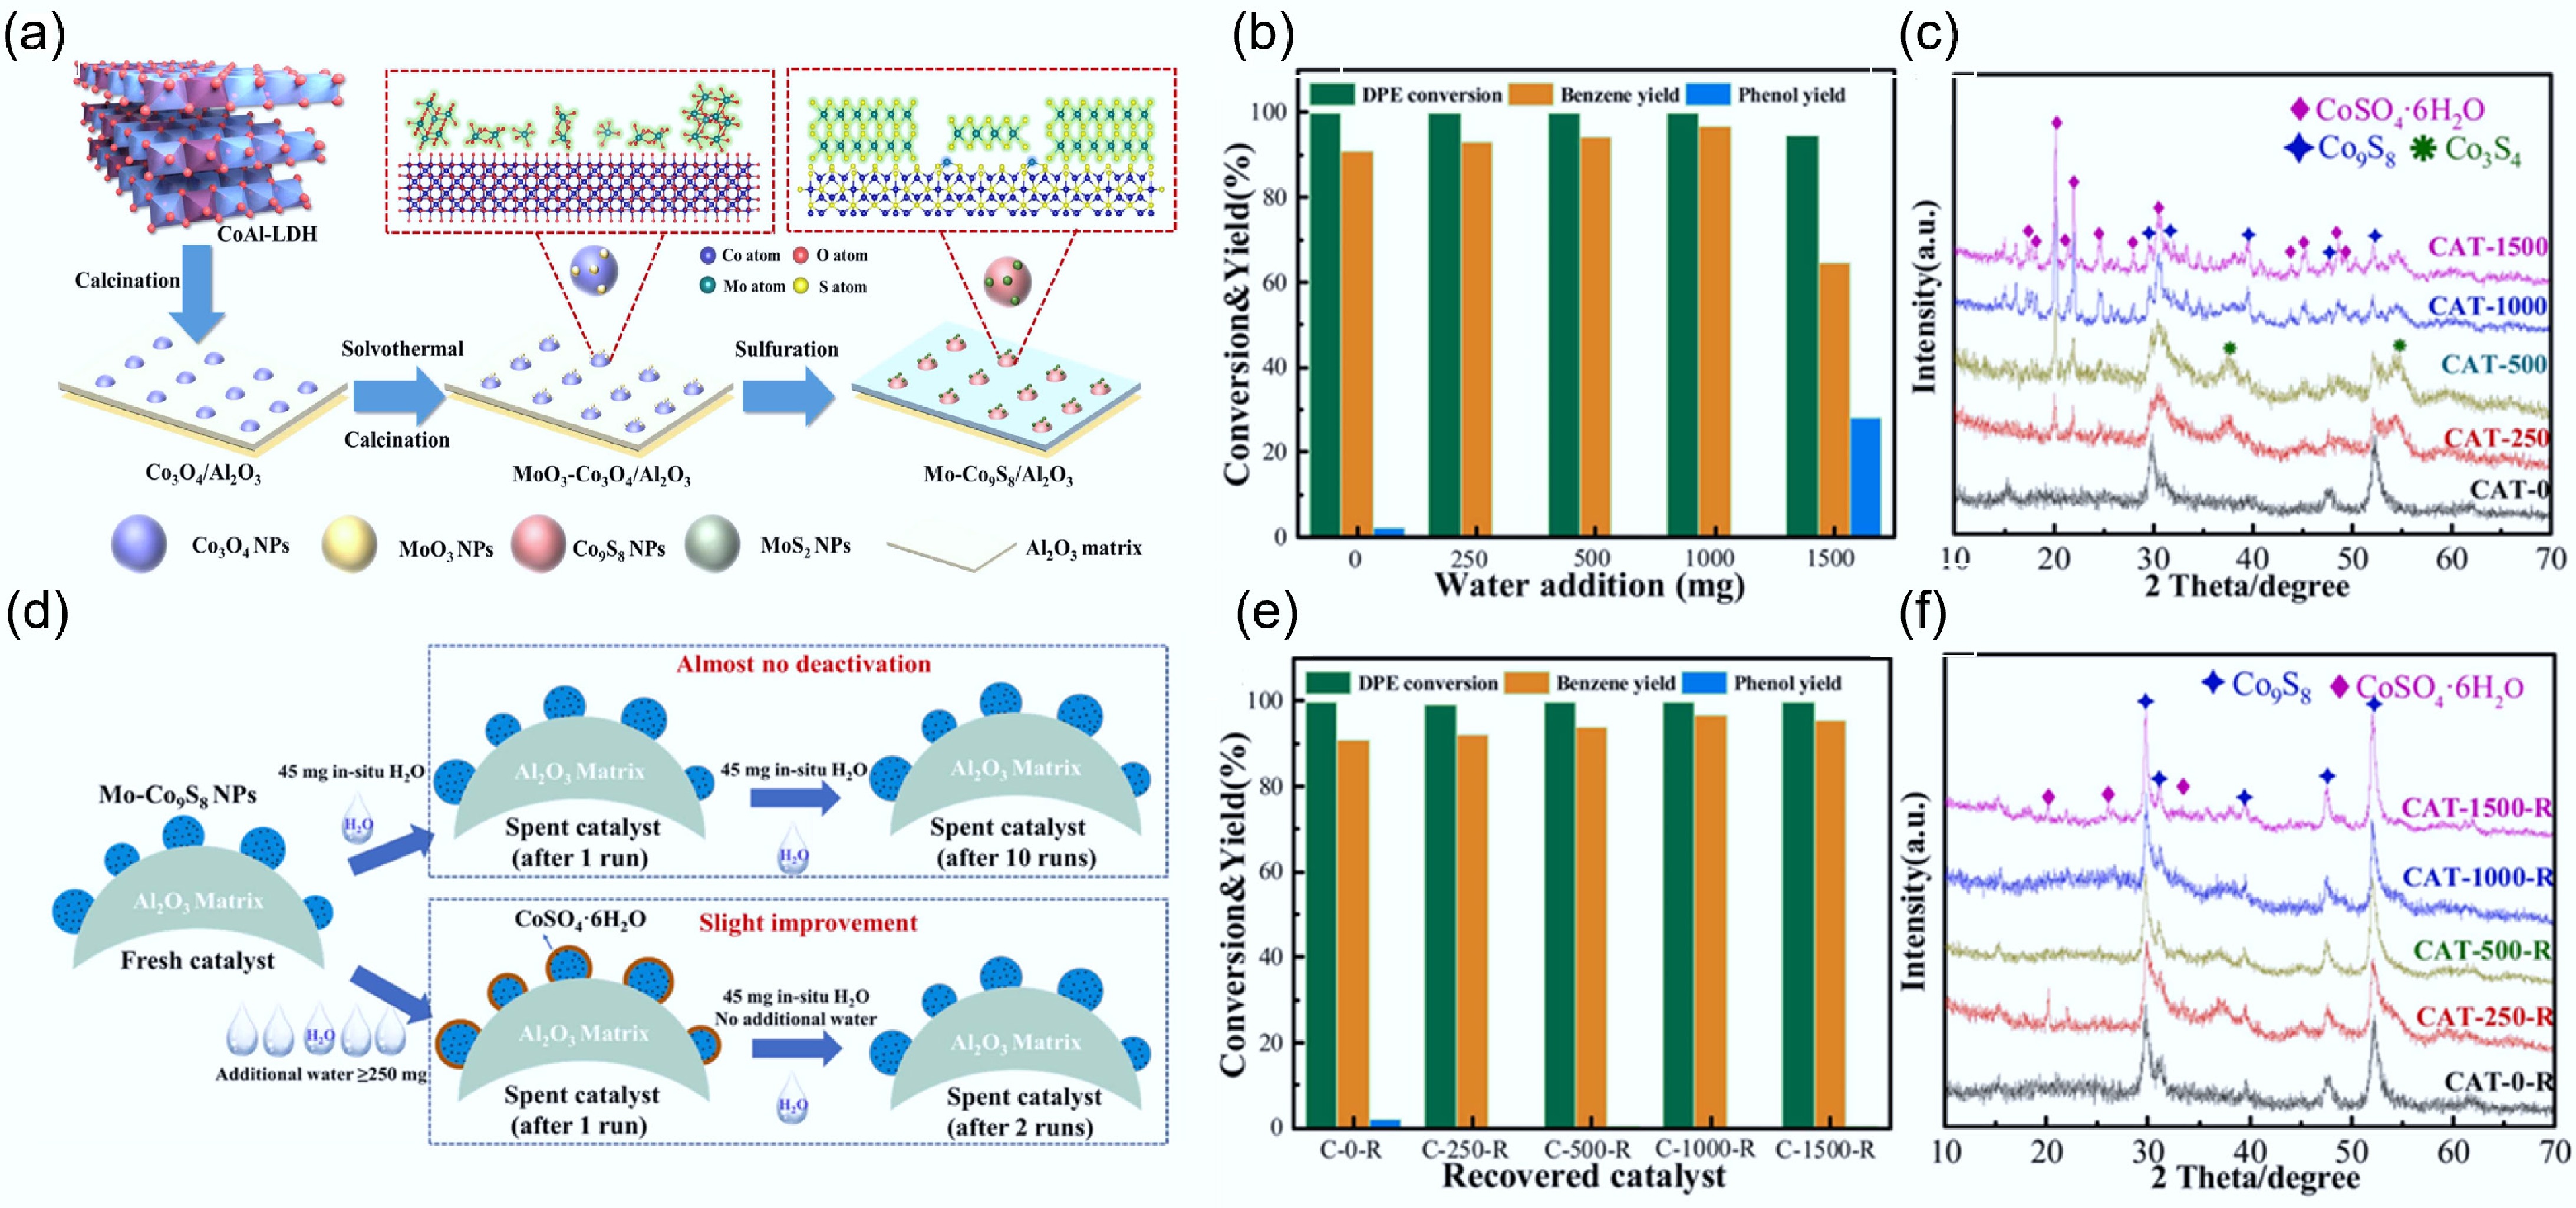
Figure 10.
(a) Schematic synthesis of Mo-Co9S8/Al2O3 catalyst. (b) Effect of water addition on the DPE HDO process over Mo0.06-Co9S8/Al2O3 catalyst. (c) XRD spectrum of Mo0.06-Co9S8/Al2O3 recovered from the (b) reaction. (d) Simplified scheme for catalyst property changes. (e) HDO results of Mo0.06-Co9S8/Al2O3 catalysts recovered from the (b) reaction over DPE. (f) XRD spectrum of Mo0.06-Co9S8/Al2O3 recovered from the (e) reaction. Reaction conditions: 106 mg catalyst, 3 MPa, 265 °C, 10 h. Reproduced with permission[50]. Copyright 2022, Elsevier.
-
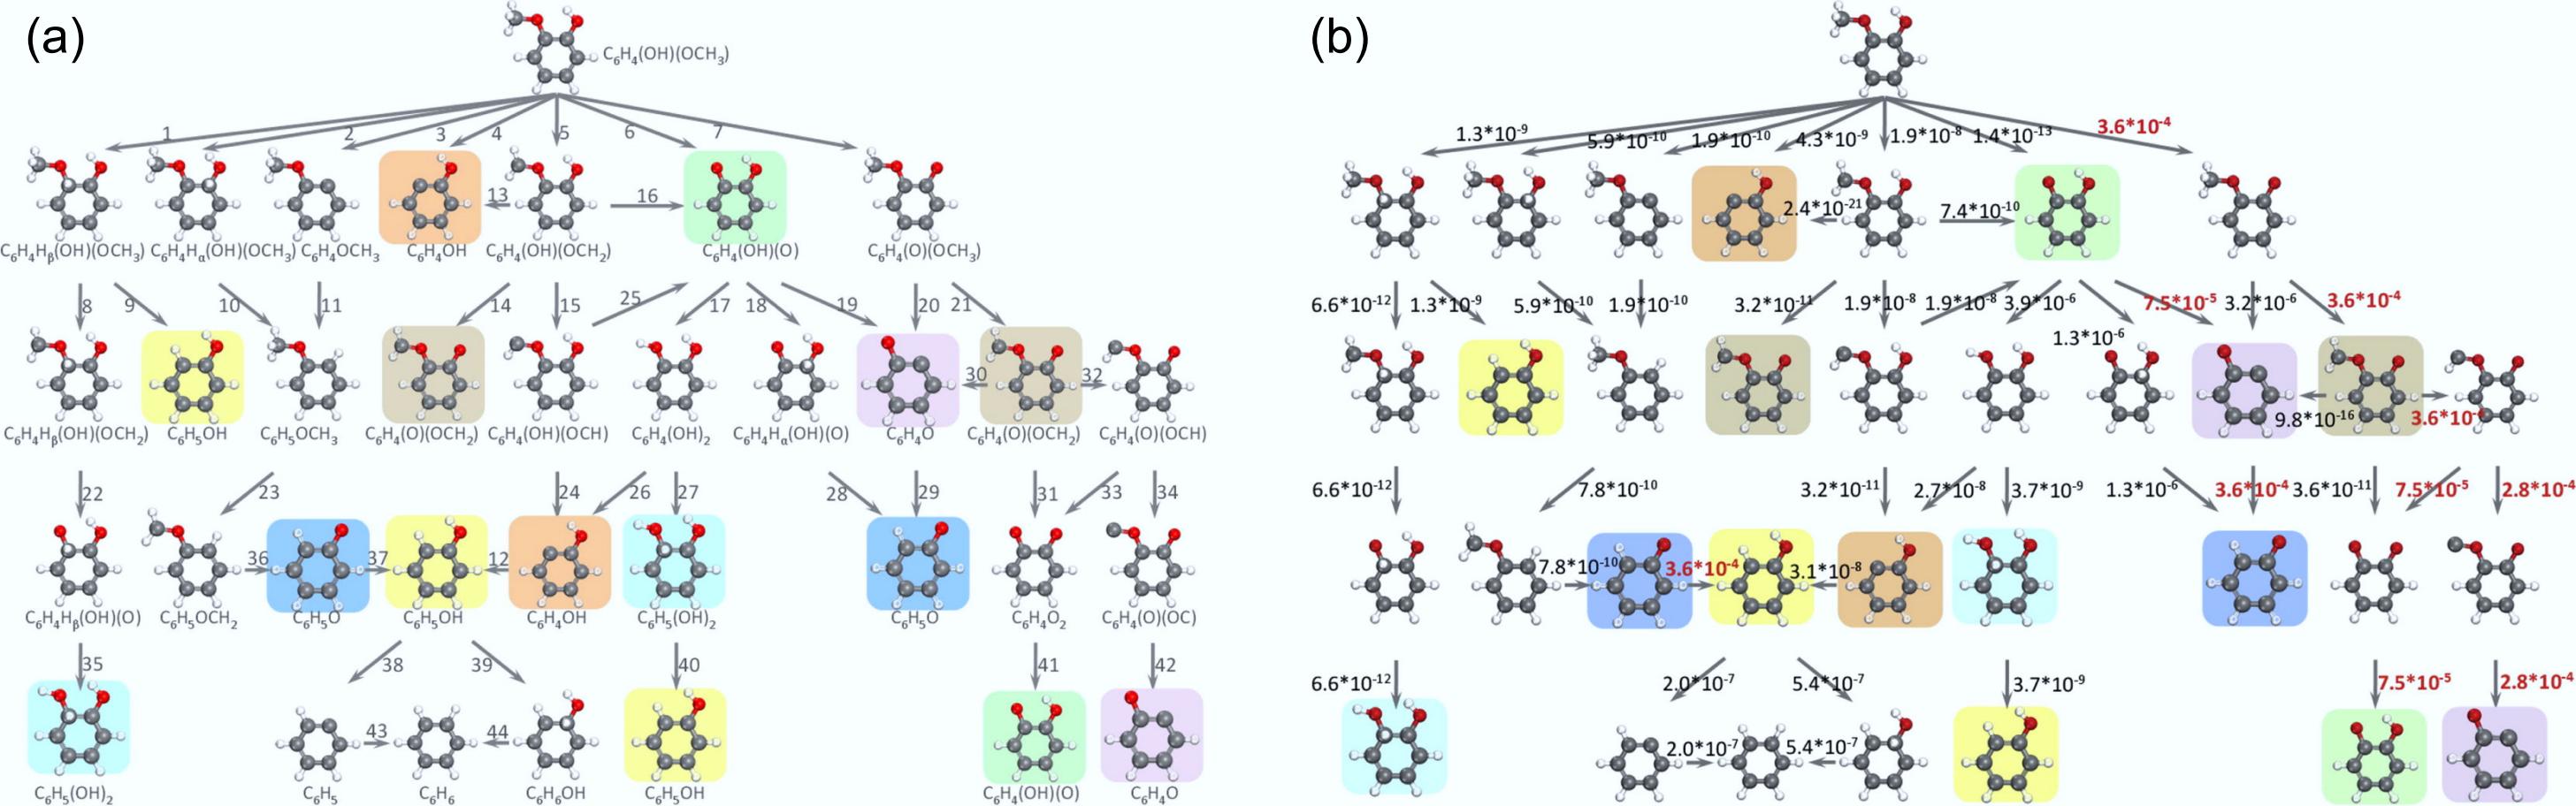
Figure 11.
(a) Reaction network depicting the hydrogenation of guaiacol on the Pt (111) surface to yield aromatic products. (b) Turnover frequencies (s−1) of elementary steps at the pressure of 1 bar for guaiacol and hydrogen reactants and the temperature of 573 K. Reproduced with permission[90]. Copyright 2015, American Chemical Society.
-
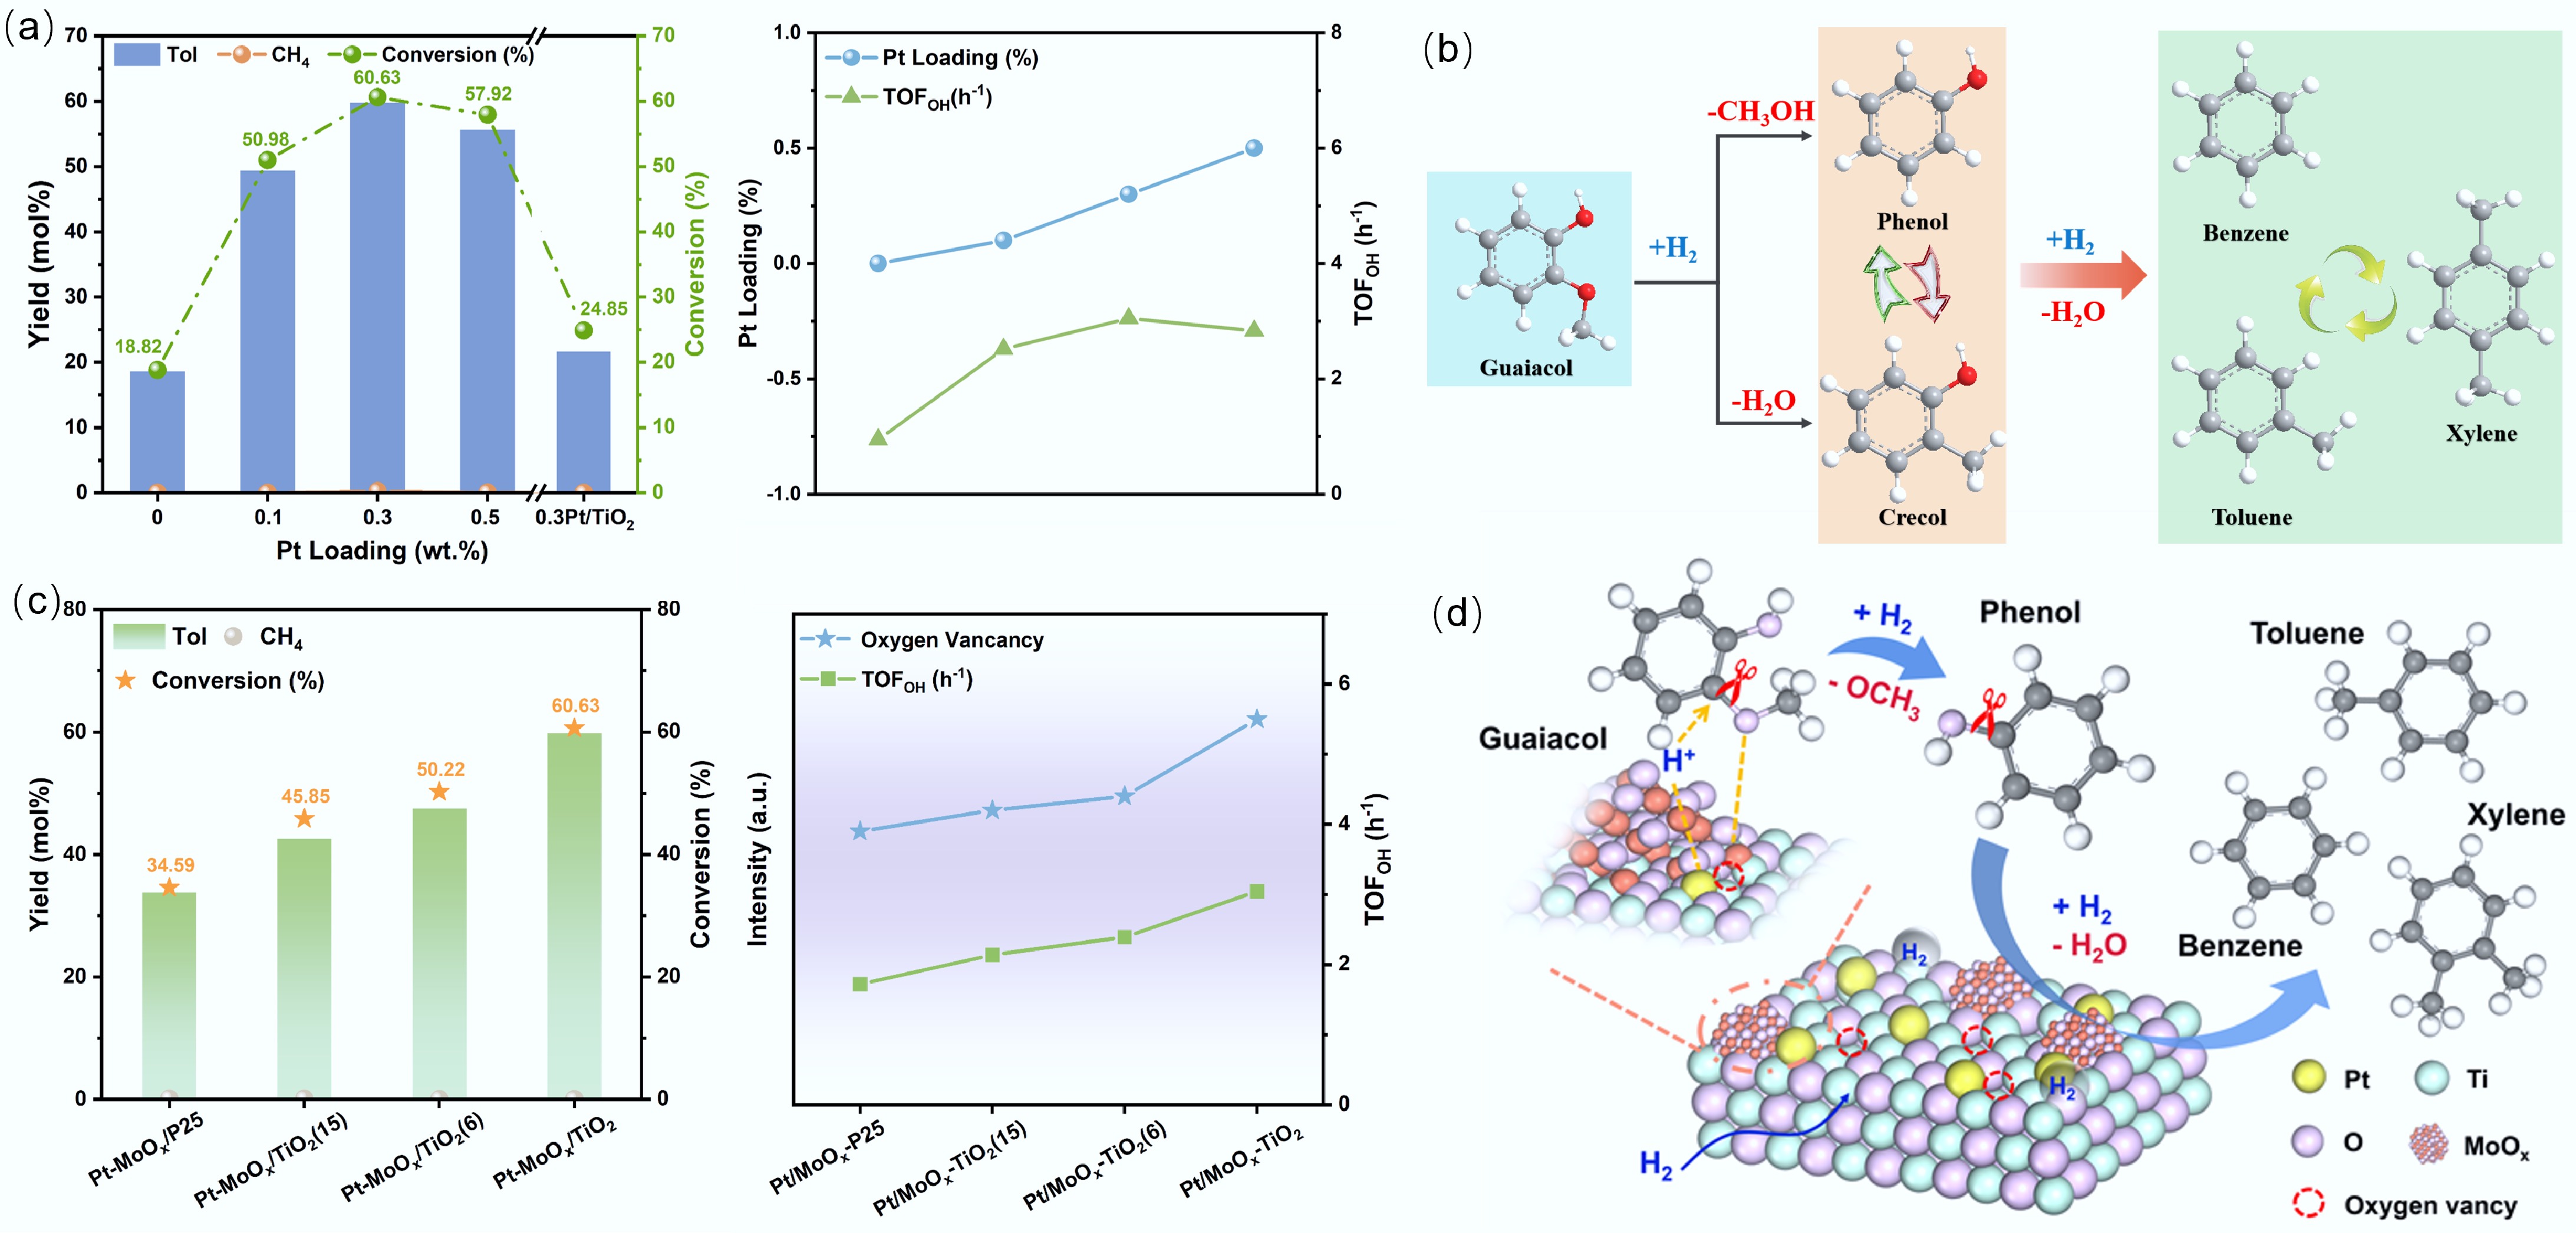
Figure 12.
(a) The hydrogenation dehydrogenation of guaiacol by Pt-Mo bimetallic system. (b) Direct deo-xygenation and alkylation transfer of guaiacol on Pt-Mo surface. (c) The influence of carrier oxygen vacancies on the hydrogenation dehydrogenation rate of Pt-Mo catalysts. (d) The synergistic mechanism of bimetallic and carrier oxygen vacancies. Reproduced with permission[100]. Copyright 2025, Wiley-VCH GmbH.
-
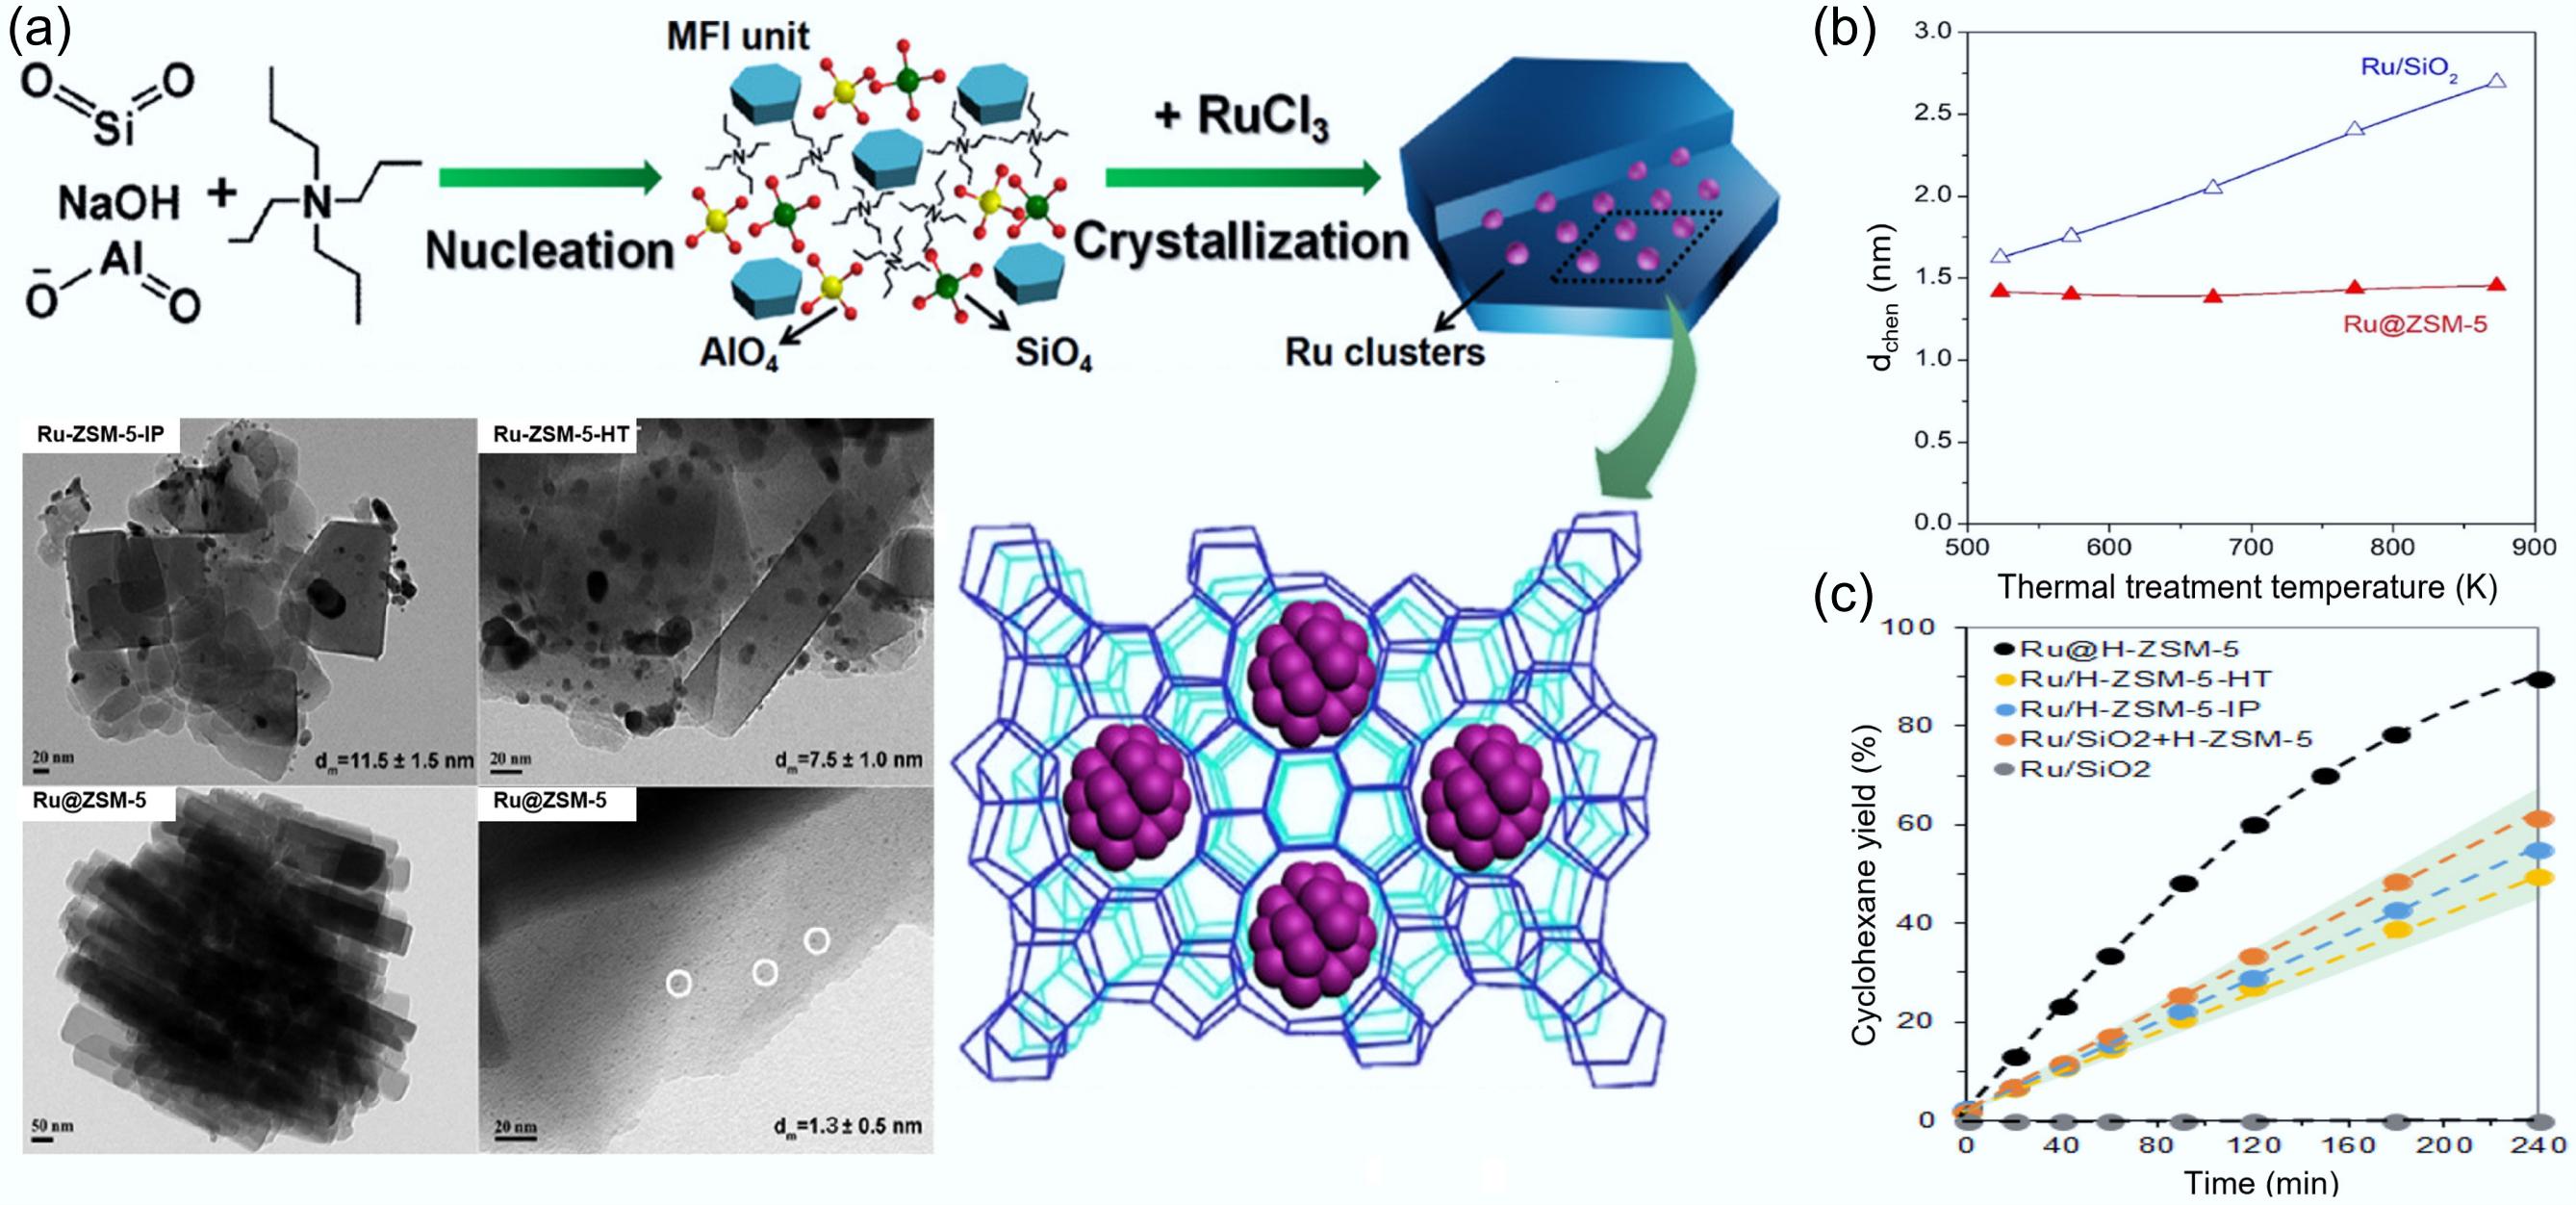
Figure 13.
(a) Schematic preparation and TEM characterization of catalysts for in situ two-stage hydrothermal synthesis of metal clusters encapsulated into high-alumina ZSM-5. (b) Average diameters of Ru particles in Ru/SiO2 and Ru@ZSM-5 by H2 chemisorption across a temperature range spanning from 573 to 873 K. (c) Time-dependent cyclohexane yield profiles for various catalysts. Reproduced with permission[56]. Copyright 2022, American Chemical Society.
-
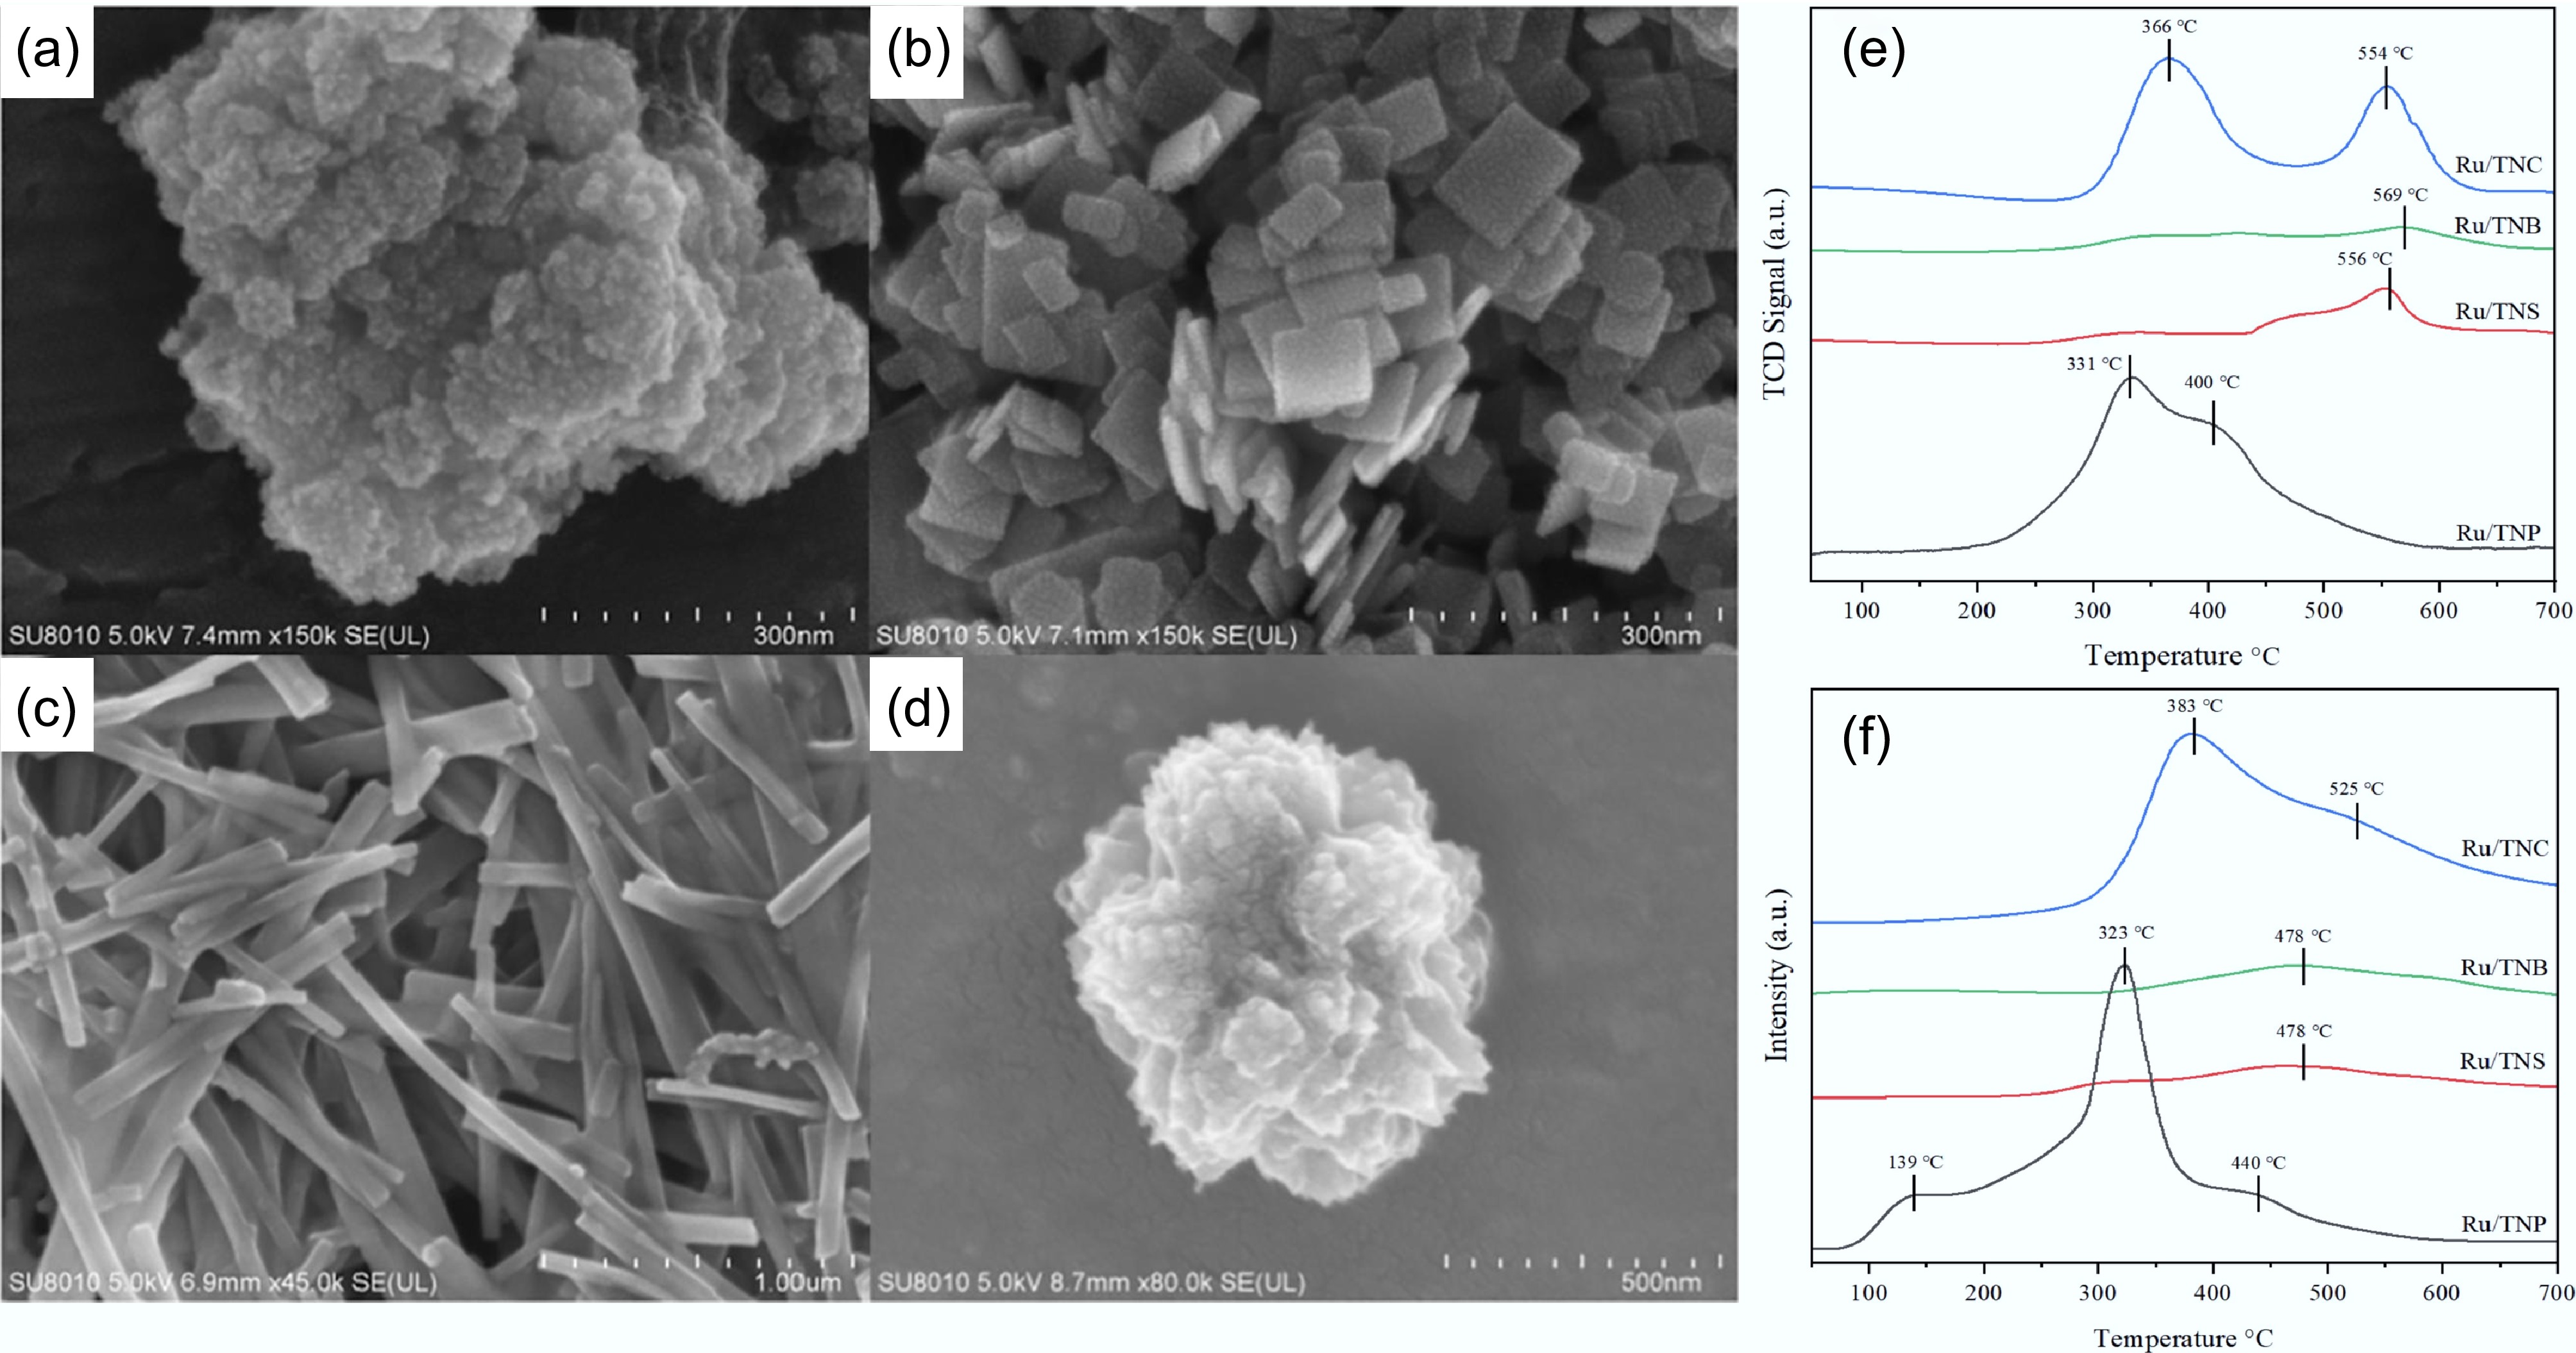
Figure 14.
SEM micrographs of: (a) Ru/TNP, (b) Ru/TNS, (c) Ru/TNB, (d) Ru/TNC. (e) H2-TPD, and (f) NH3-TPD patterns for different Ru-based catalysts. Reproduced with permission[54]. Copyright 2023, Elsevier.
-
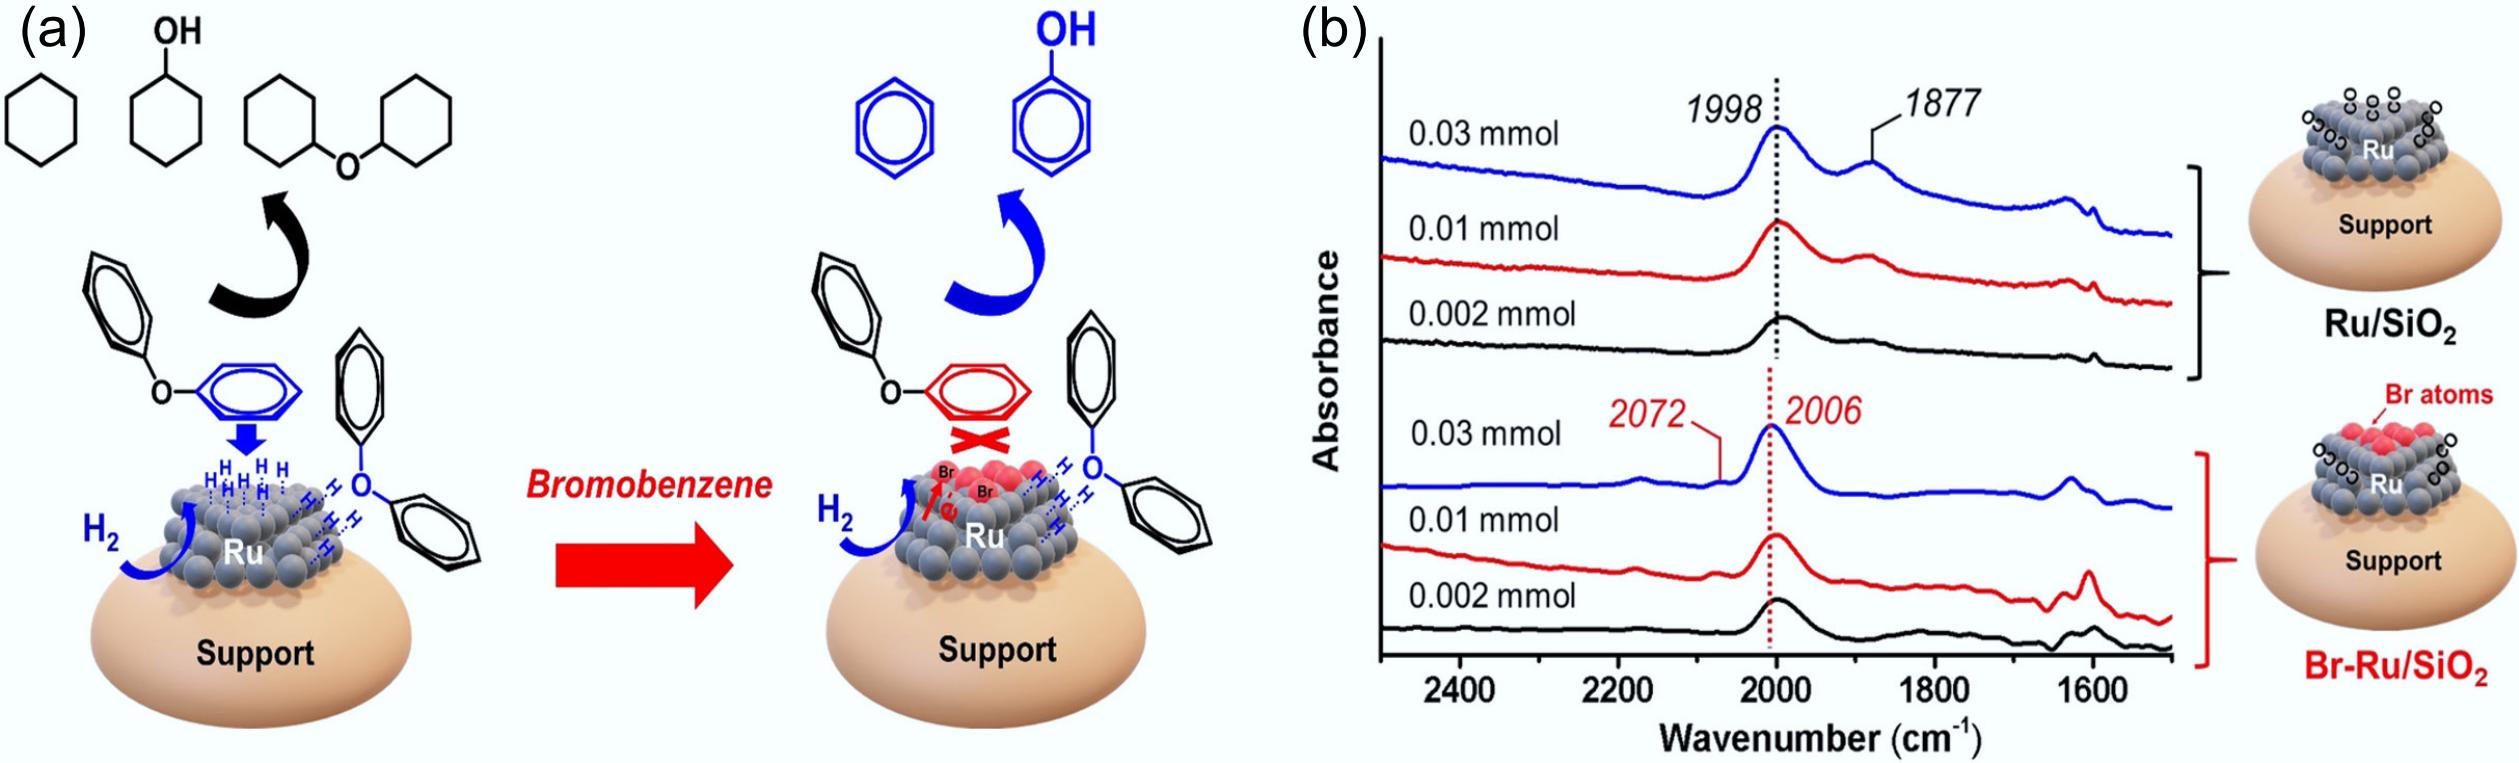
Figure 15.
(a) Schematic illustration of the adsorption and conversion of DPE on Ru and Ru-Br catalysts. (b) CO-FTIR patterns of Ru/SiO2 and Br-Ru/SiO2 catalysts. Reproduced with permission[60]. Copyright 2021, Wiley-VCH GmbH.
-
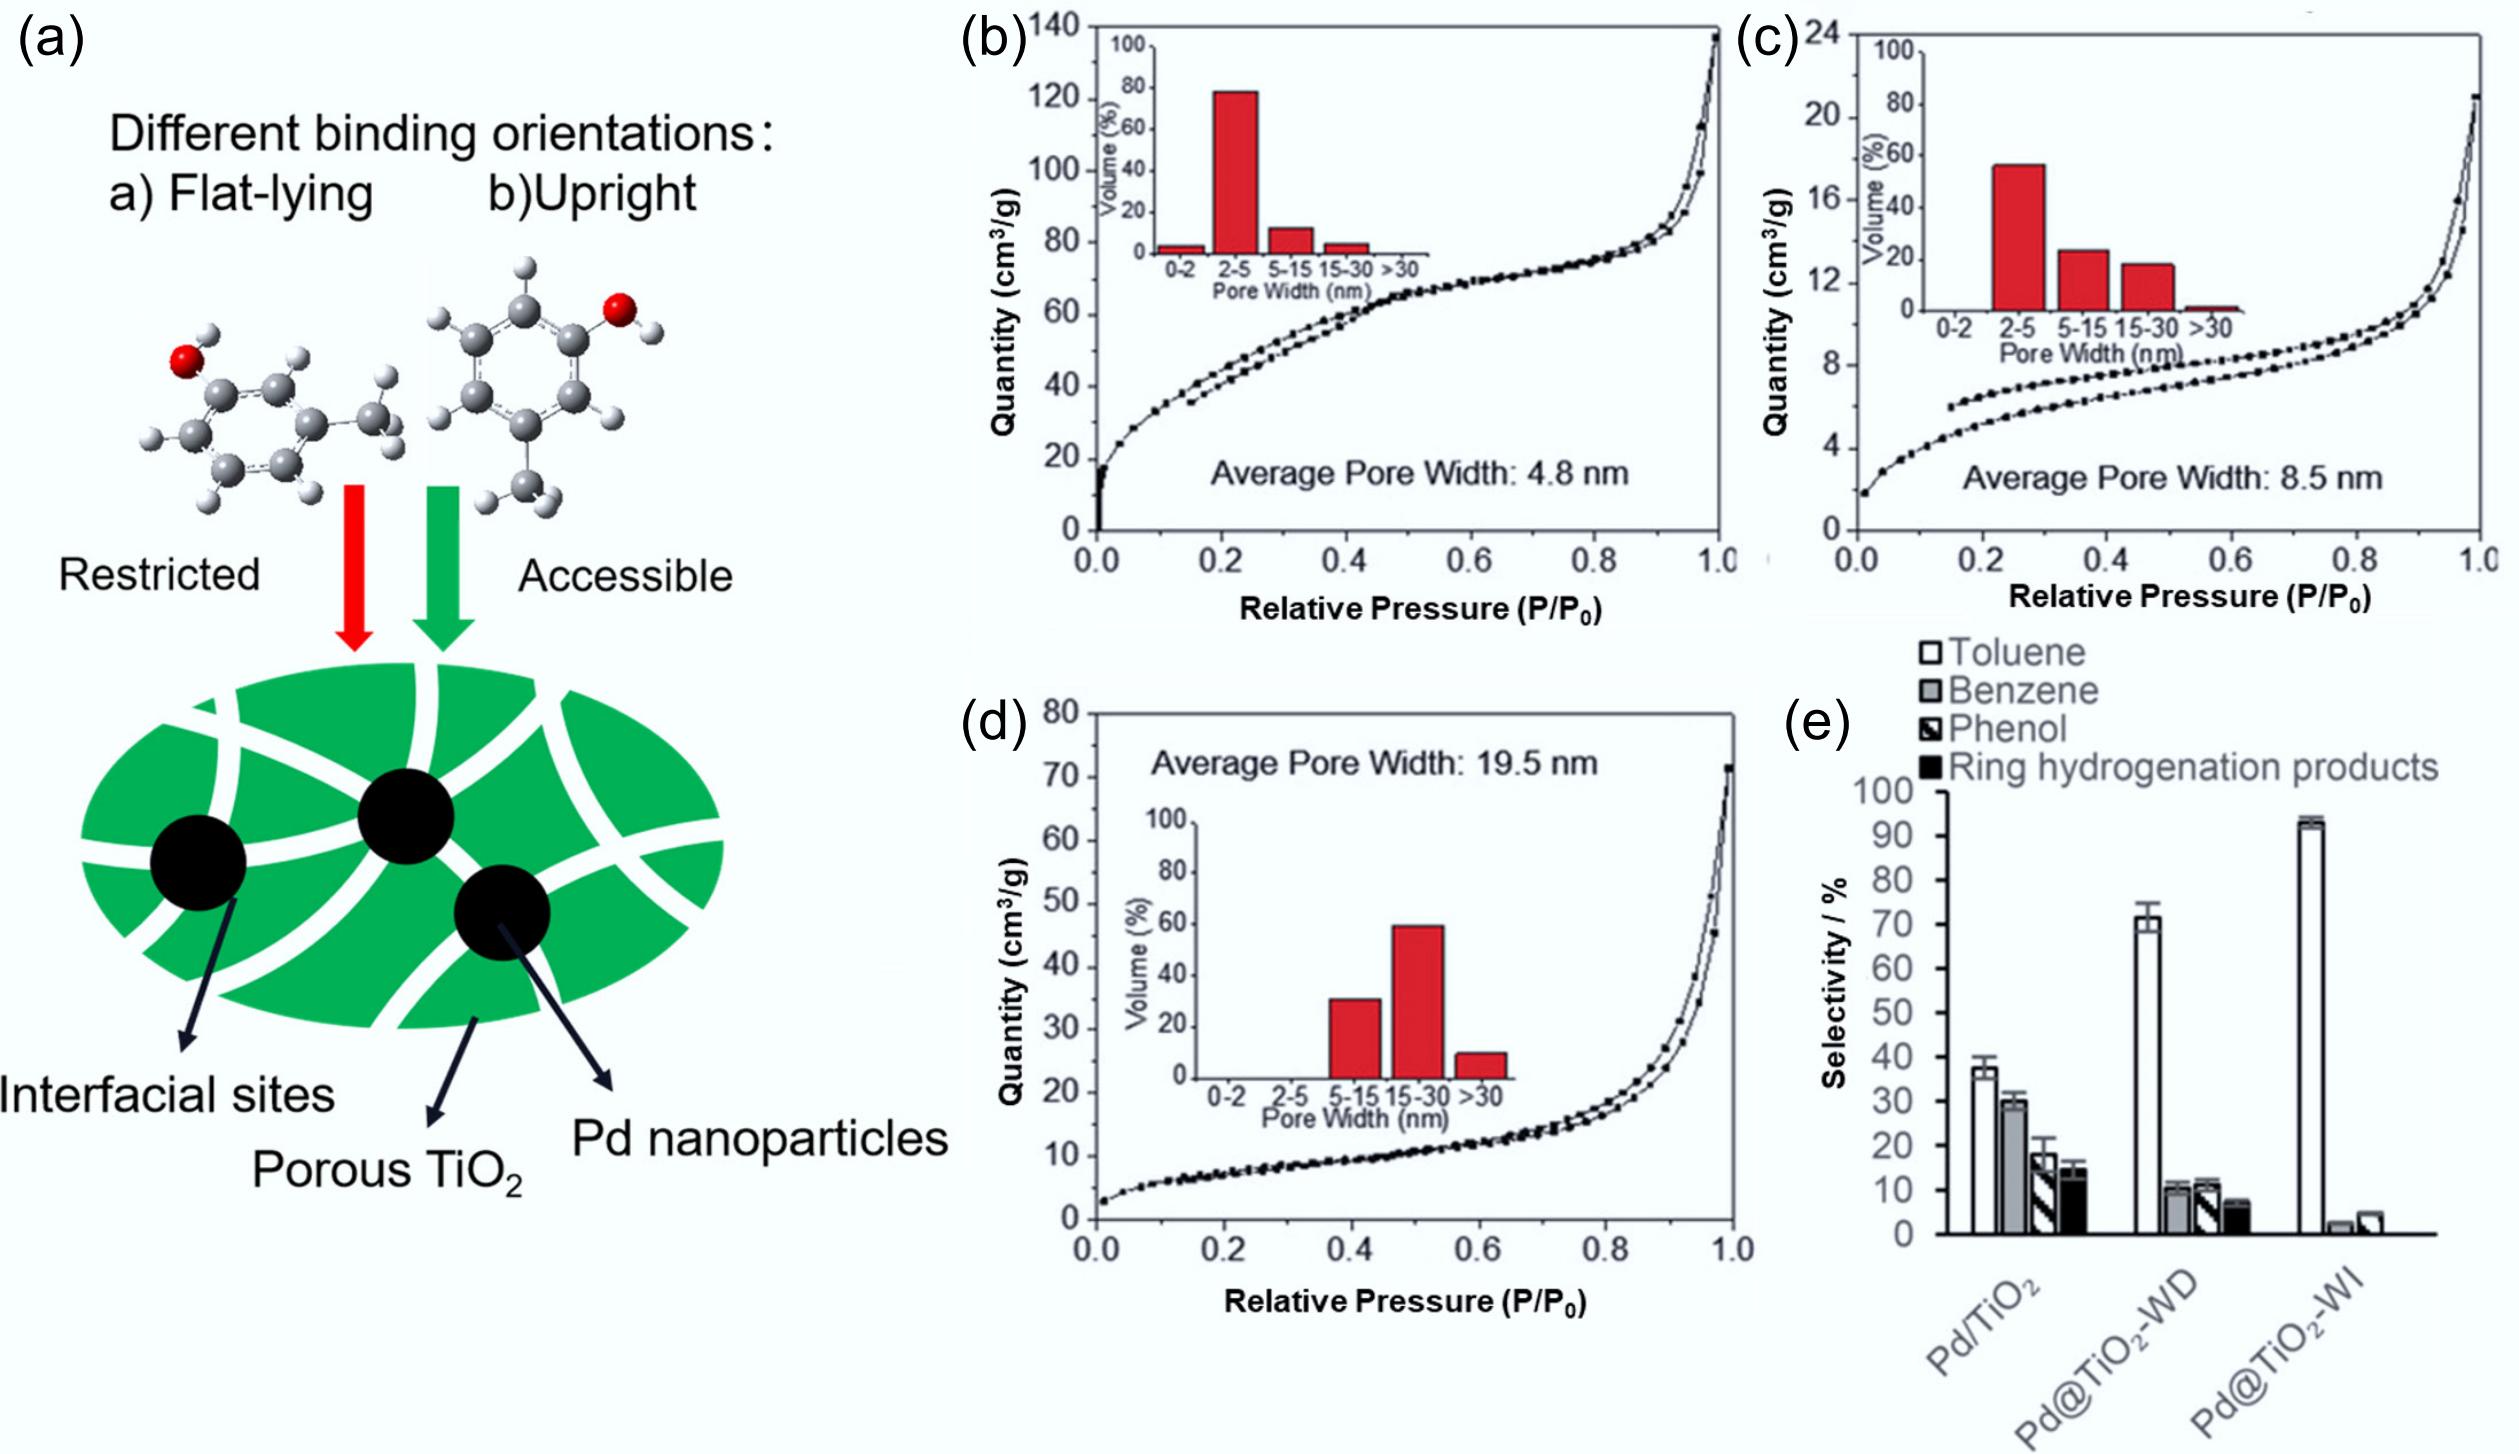
Figure 16.
(a) The nanoporous TiO2 film precisely modulates binding characteristics and creates engineered interfacial active sites. N2 physisorption isotherm plots and pore size distributions of TiO2 in (b) Pd@TiO2-WI, (c) Pd@TiO2-WD, (d) Pd@TiO2-AI. (e) Catalytic conversion selectivity of HDO on m-cresol. Reproduced with permission[117]. Copyright 2017, Wiley-VCH Verlag GmbH & Co. KGaA, Weinheim.
-
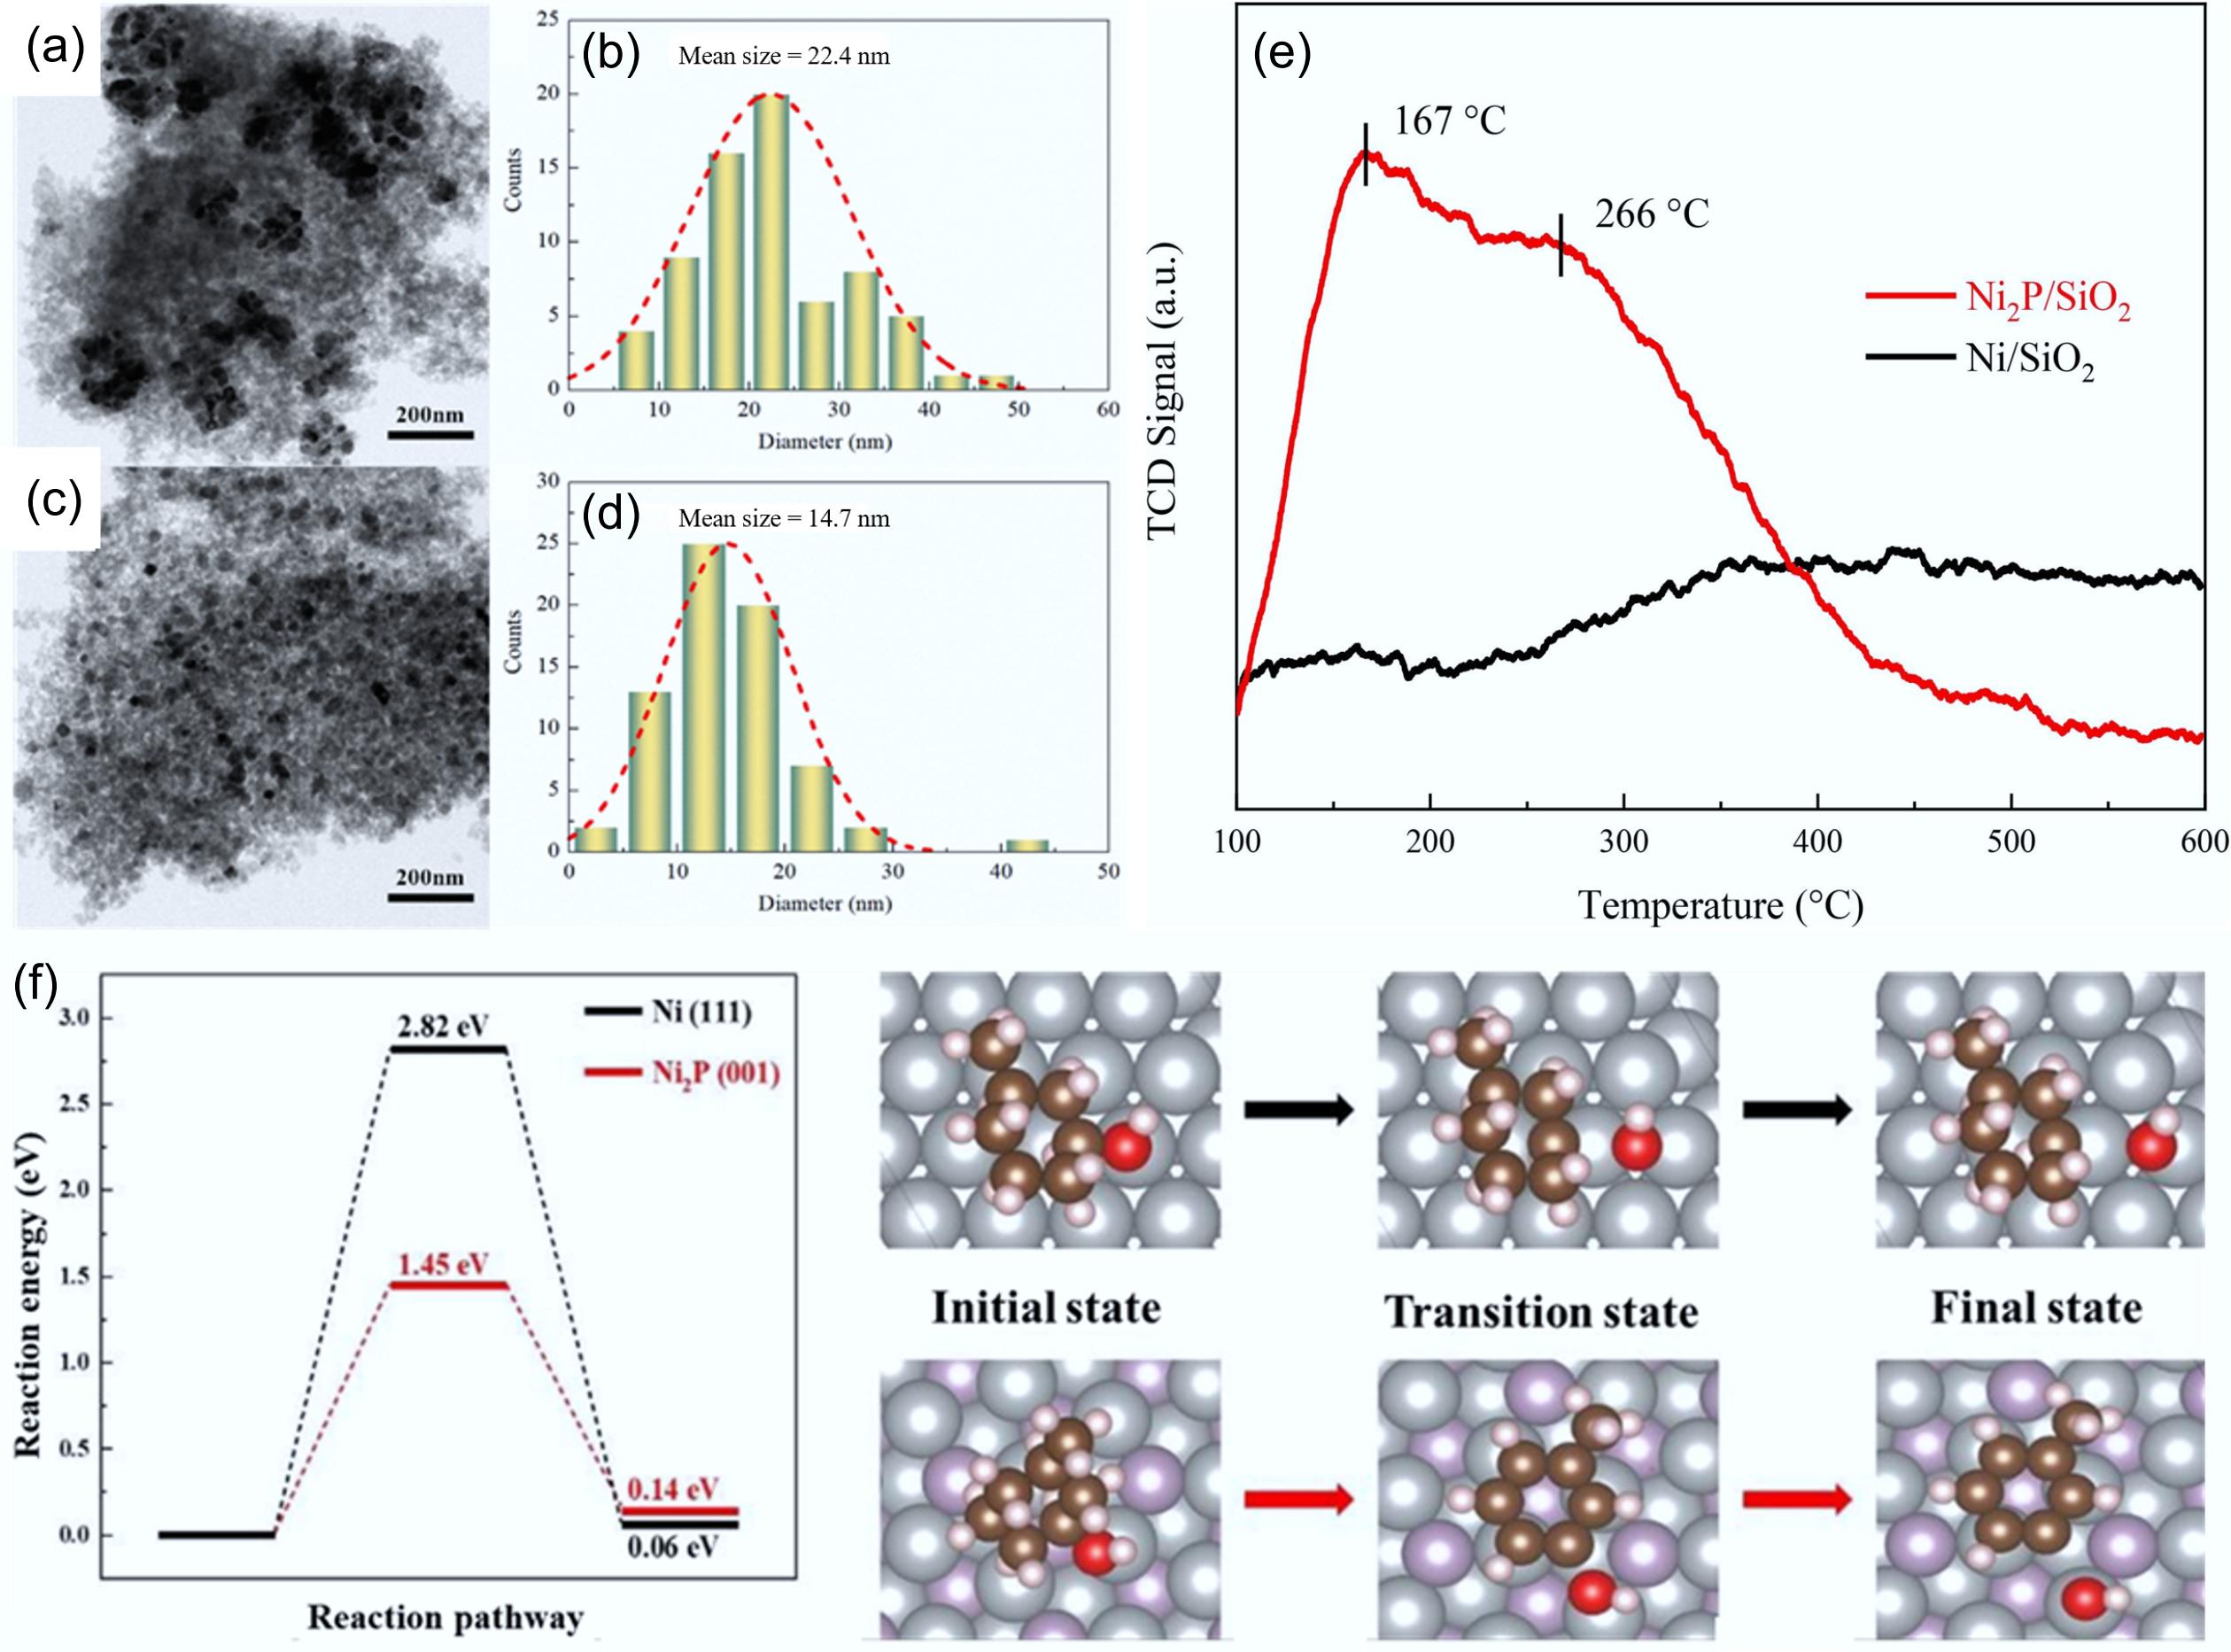
Figure 17.
(a) TEM images of Ni/SiO2, and (c) Ni2P/SiO2 and respective (b), (d) particle size distributions. (e) NH3-TPD profiles of Ni/SiO2 and Ni2P/SiO2 catalysts. (f) C–OH bond cleavage energy barriers for MCHnol on the Ni (111) and Ni2P (001) surfaces. Ni: gray, P: purple, C: brown, H: pink, O: red. Reproduced with permission[64]. Copyright 2023, Elsevier.
-
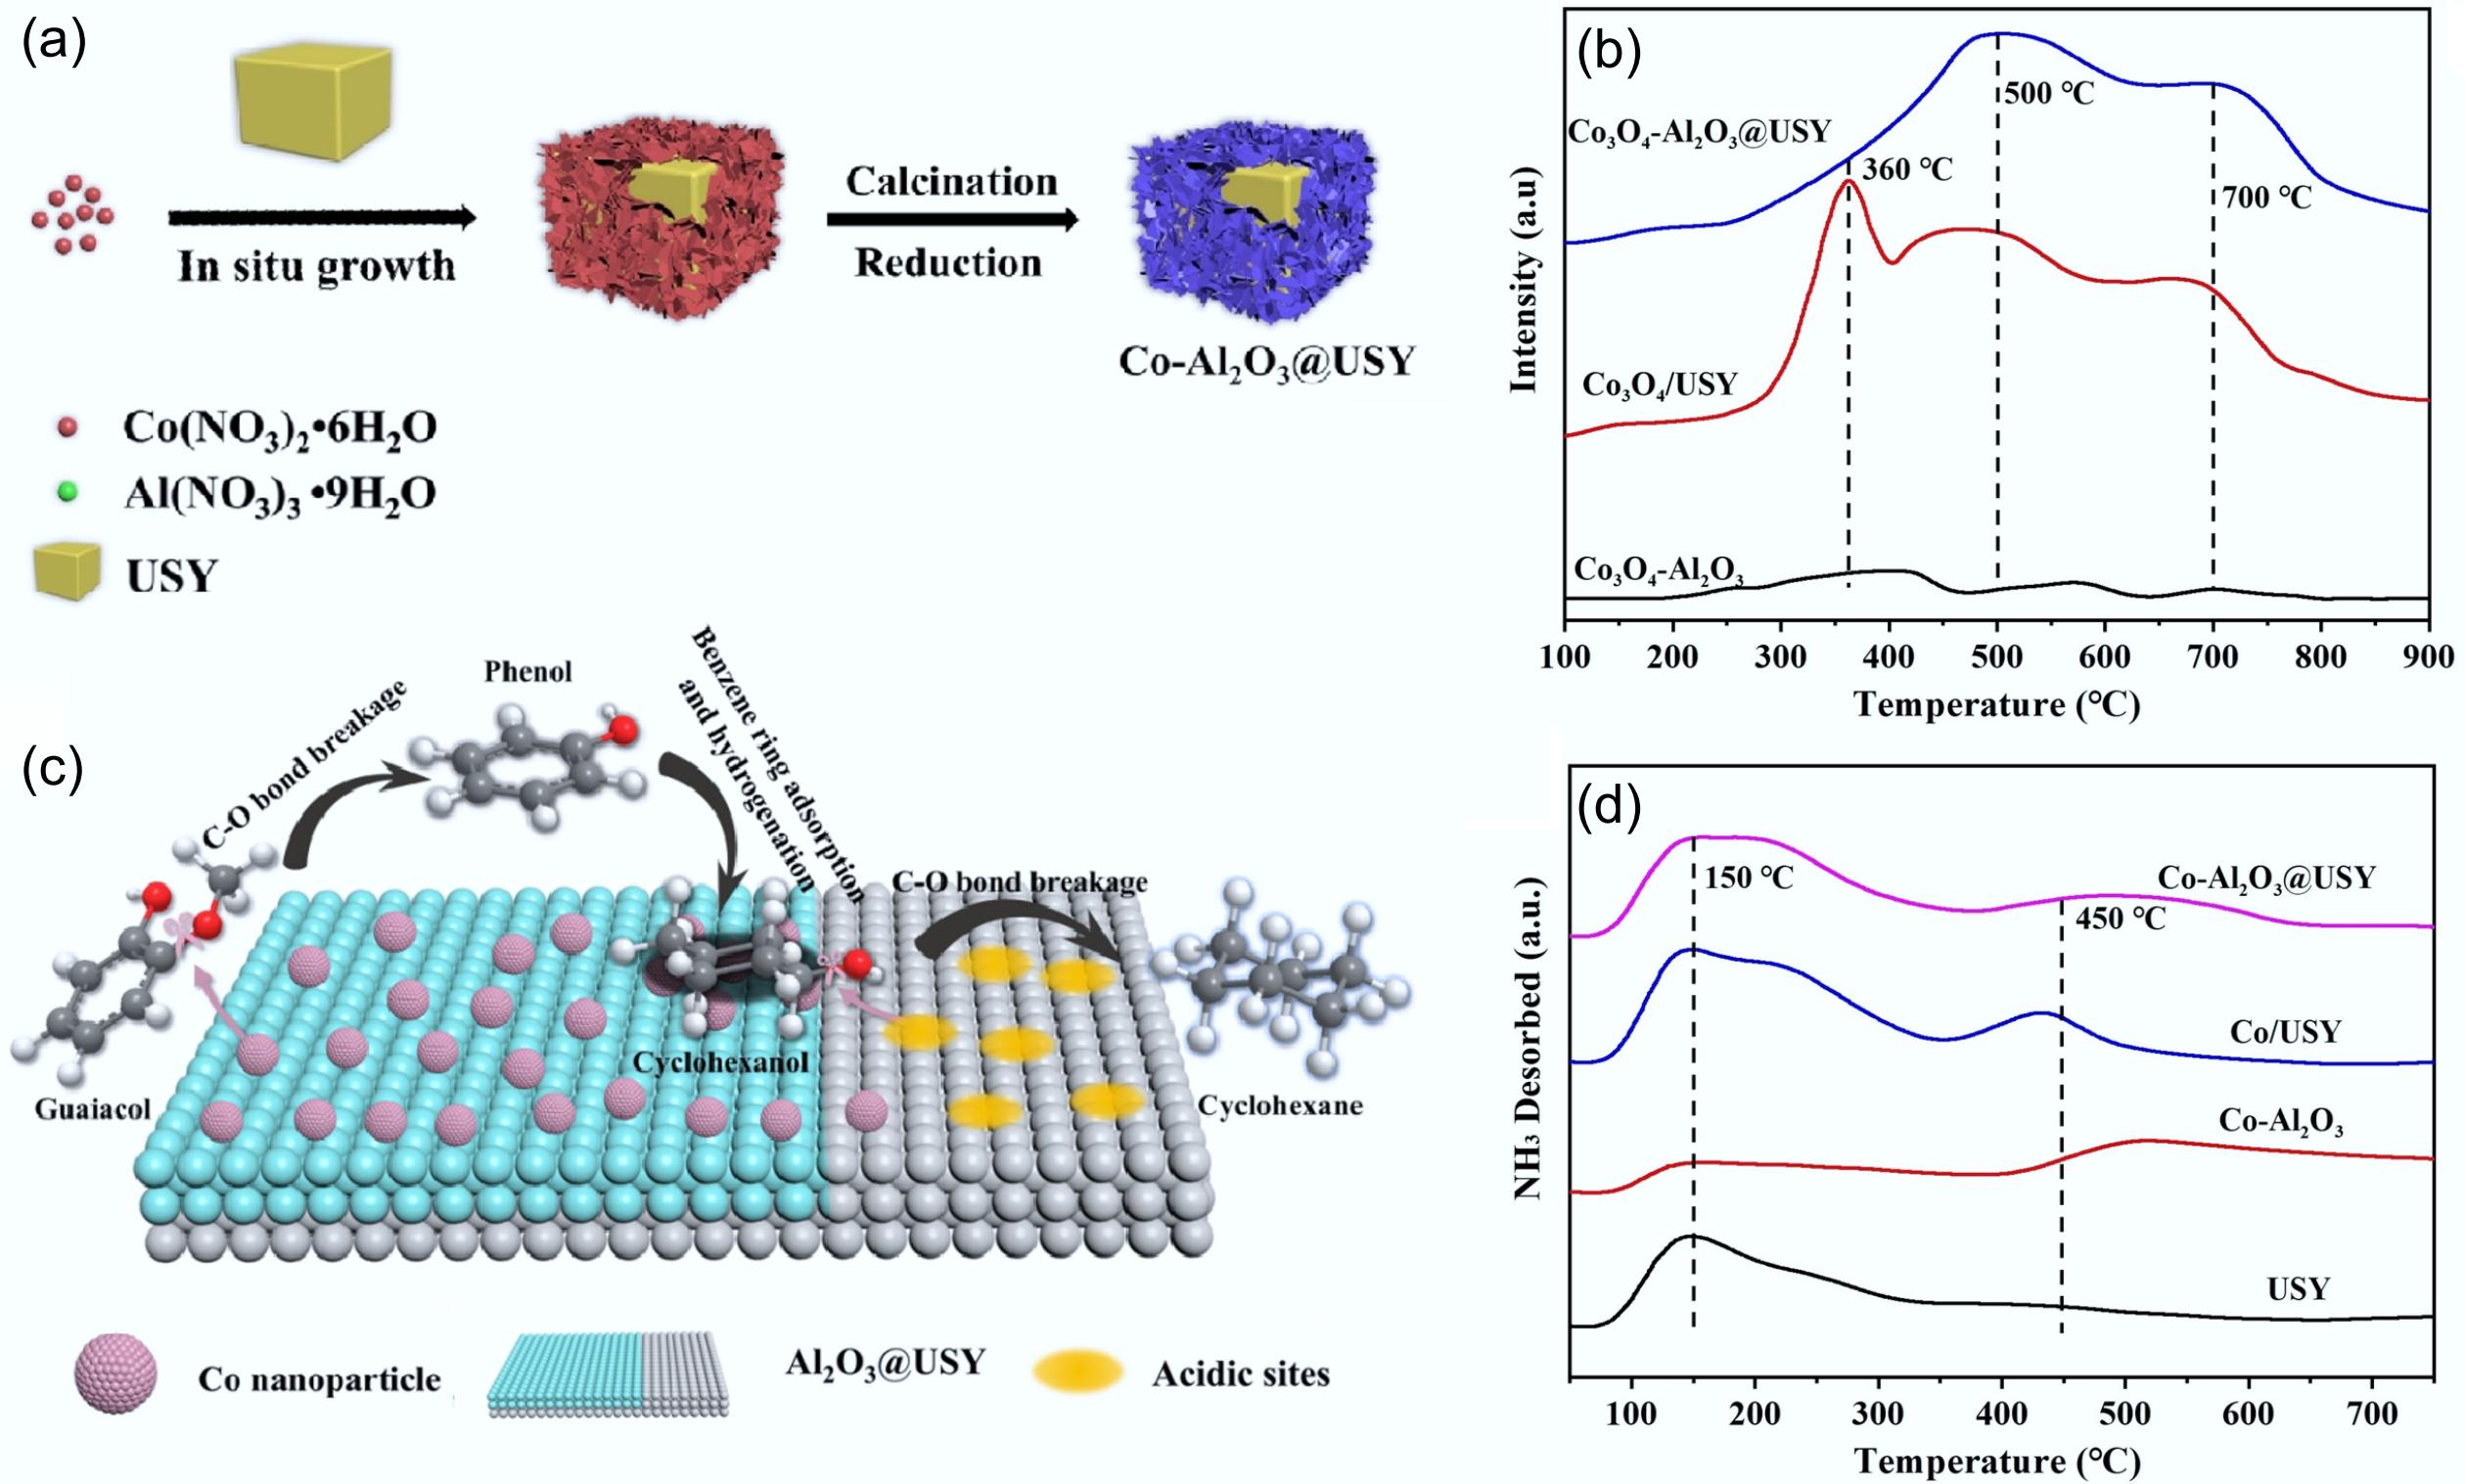
Figure 18.
(a) Schematic synthesis of Co-Al2O3@USY catalyst. (b) H2-TPR profiles of Co3O4-Al2O3, Co3O4/USY, and Co3O4-Al2O3@USY. (c) Postulated reaction pathways for guaiacol hydrodeoxygenation catalyzed by the Co-Al2O3@USY catalyst. (d) NH3-TPD profiles of USY, Co-Al2O3, Co/USY, and Co-Al2O3@USY. Reproduced with permission[127]. Copyright 2022, Wiley-VCH GmbH.
-
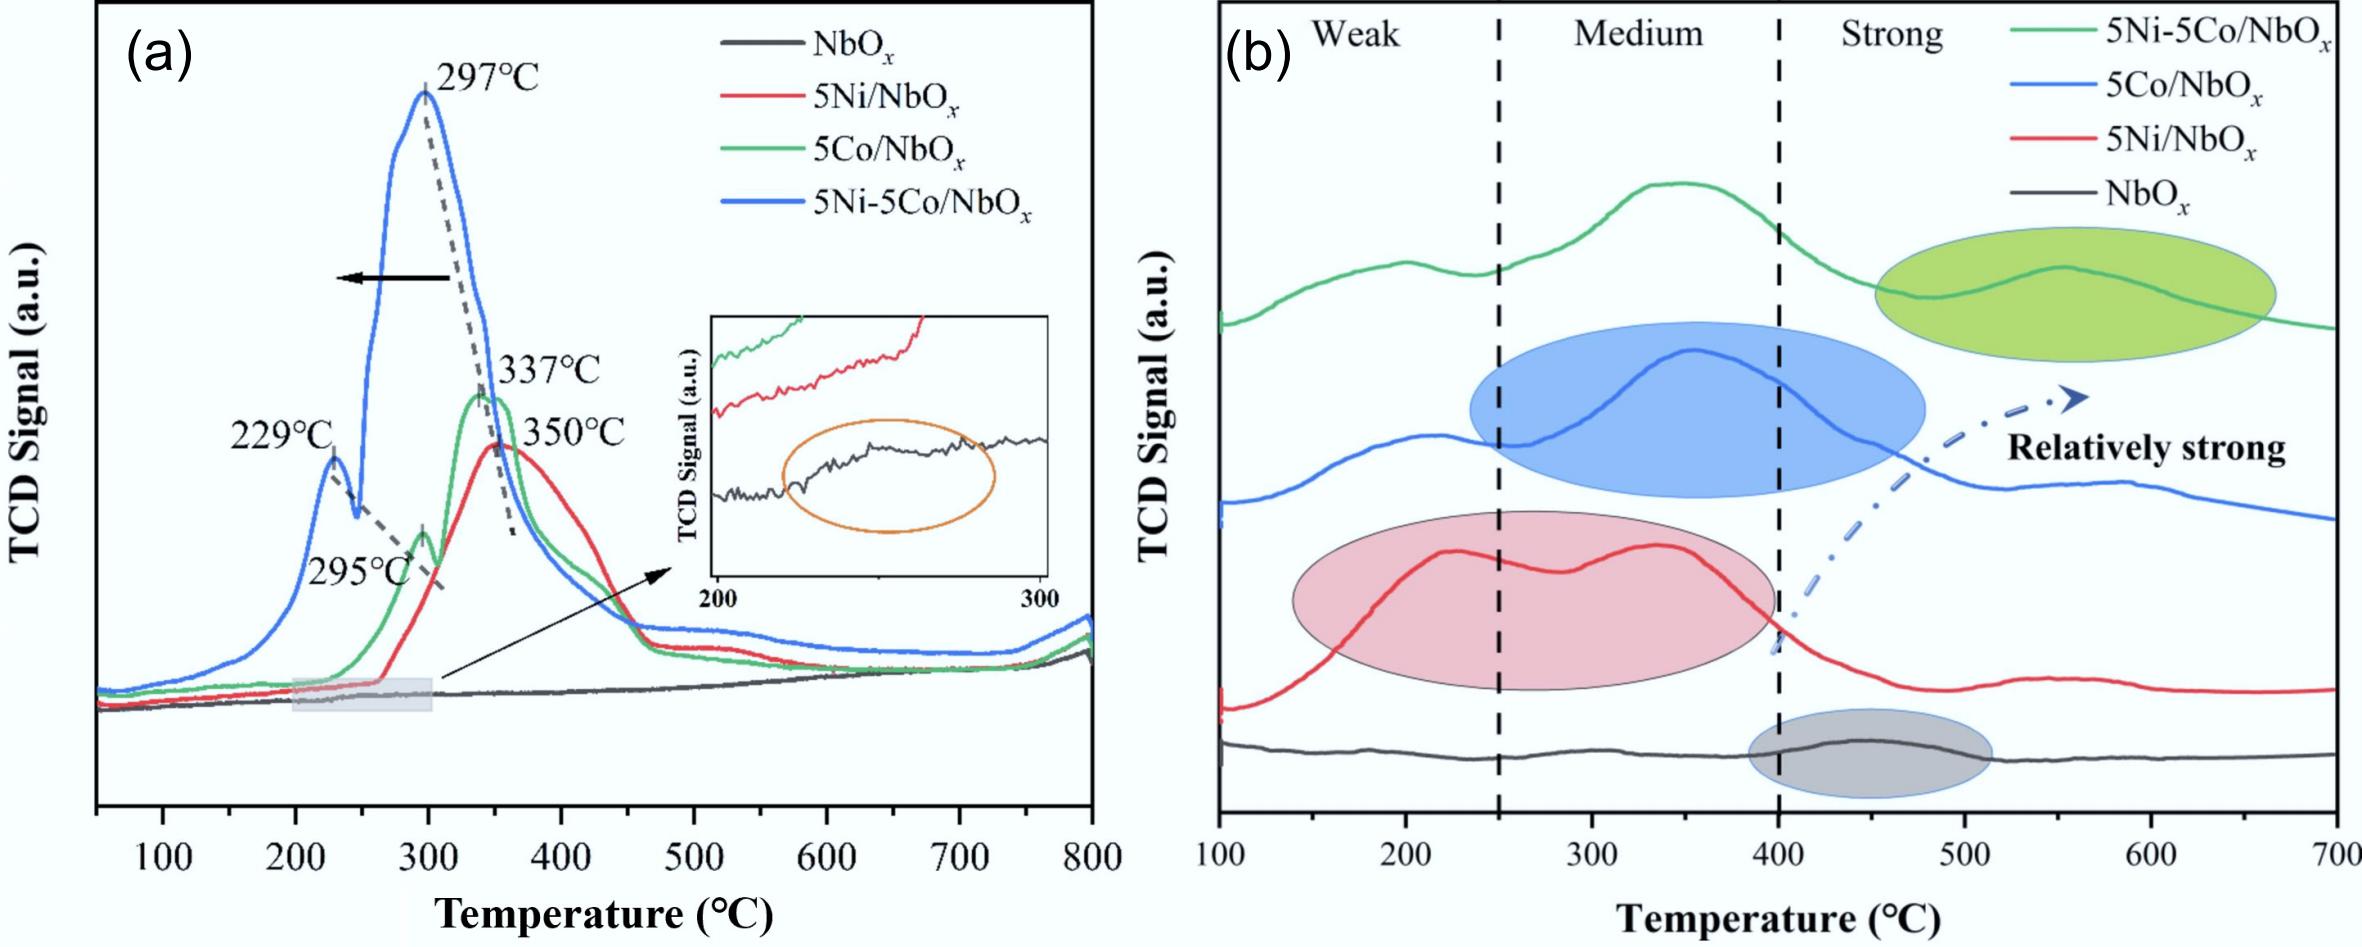
Figure 19.
(a) H2-TPR, and (b) NH3-TPD profiles of NbOx, 5Ni/NbOx, 5Co/NbOx, and 5Ni-5Co/NbOx catalysts. Reproduced with permission[61]. Copyright 2022, Elsevier.
-
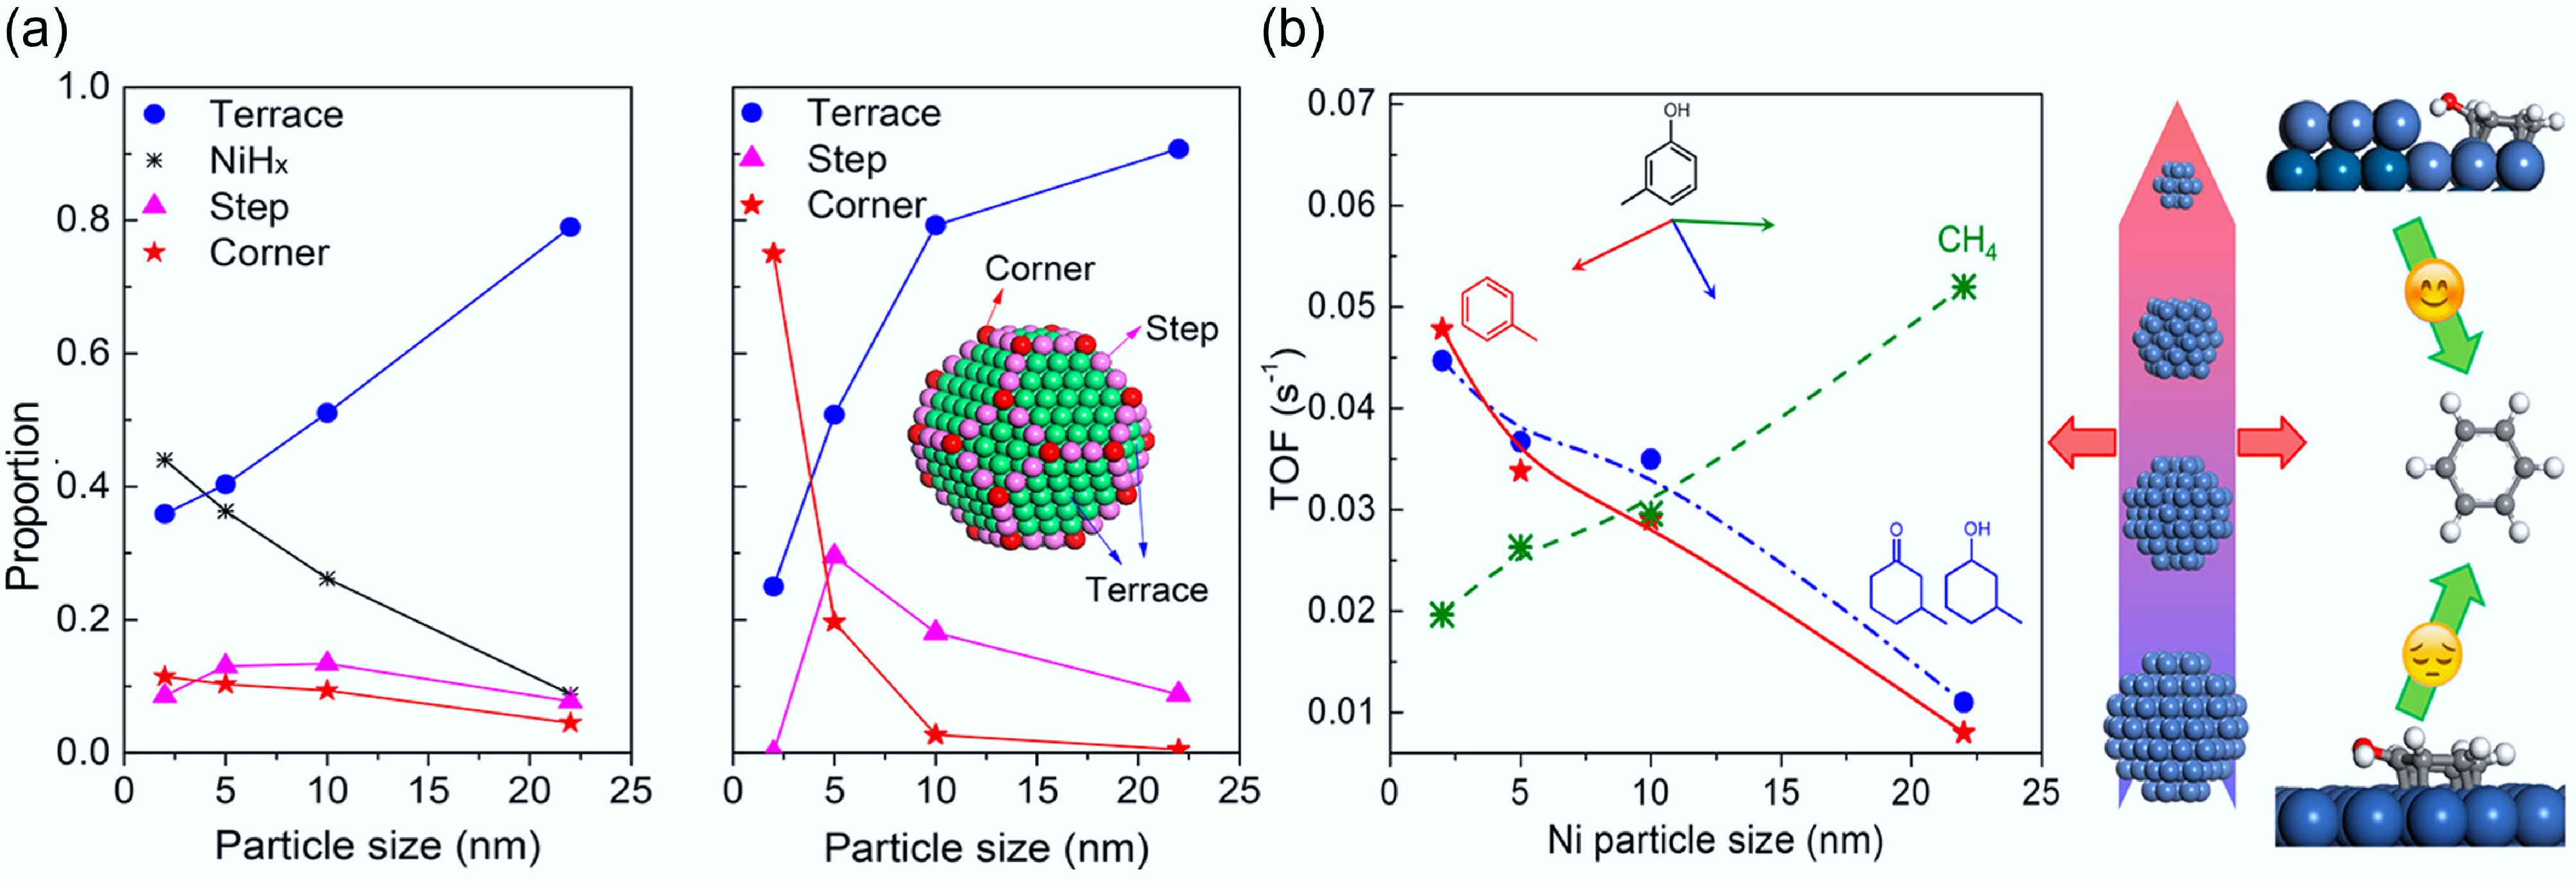
Figure 20.
(a) Turnover frequency (s−1) for conversion of m-cresol to different products. Reaction conditions: 573 K, 0.1 MPa H2, 30 min, W/F was adjusted to achieve conversion < 10%. (b) Percentage of different surface sites based on H2-TPD patterns and theoretical percentage of the cube-octahedron model based on the size of Ni. Reproduced with permission[66]. Copyright 2018, American Chemical Society.
-
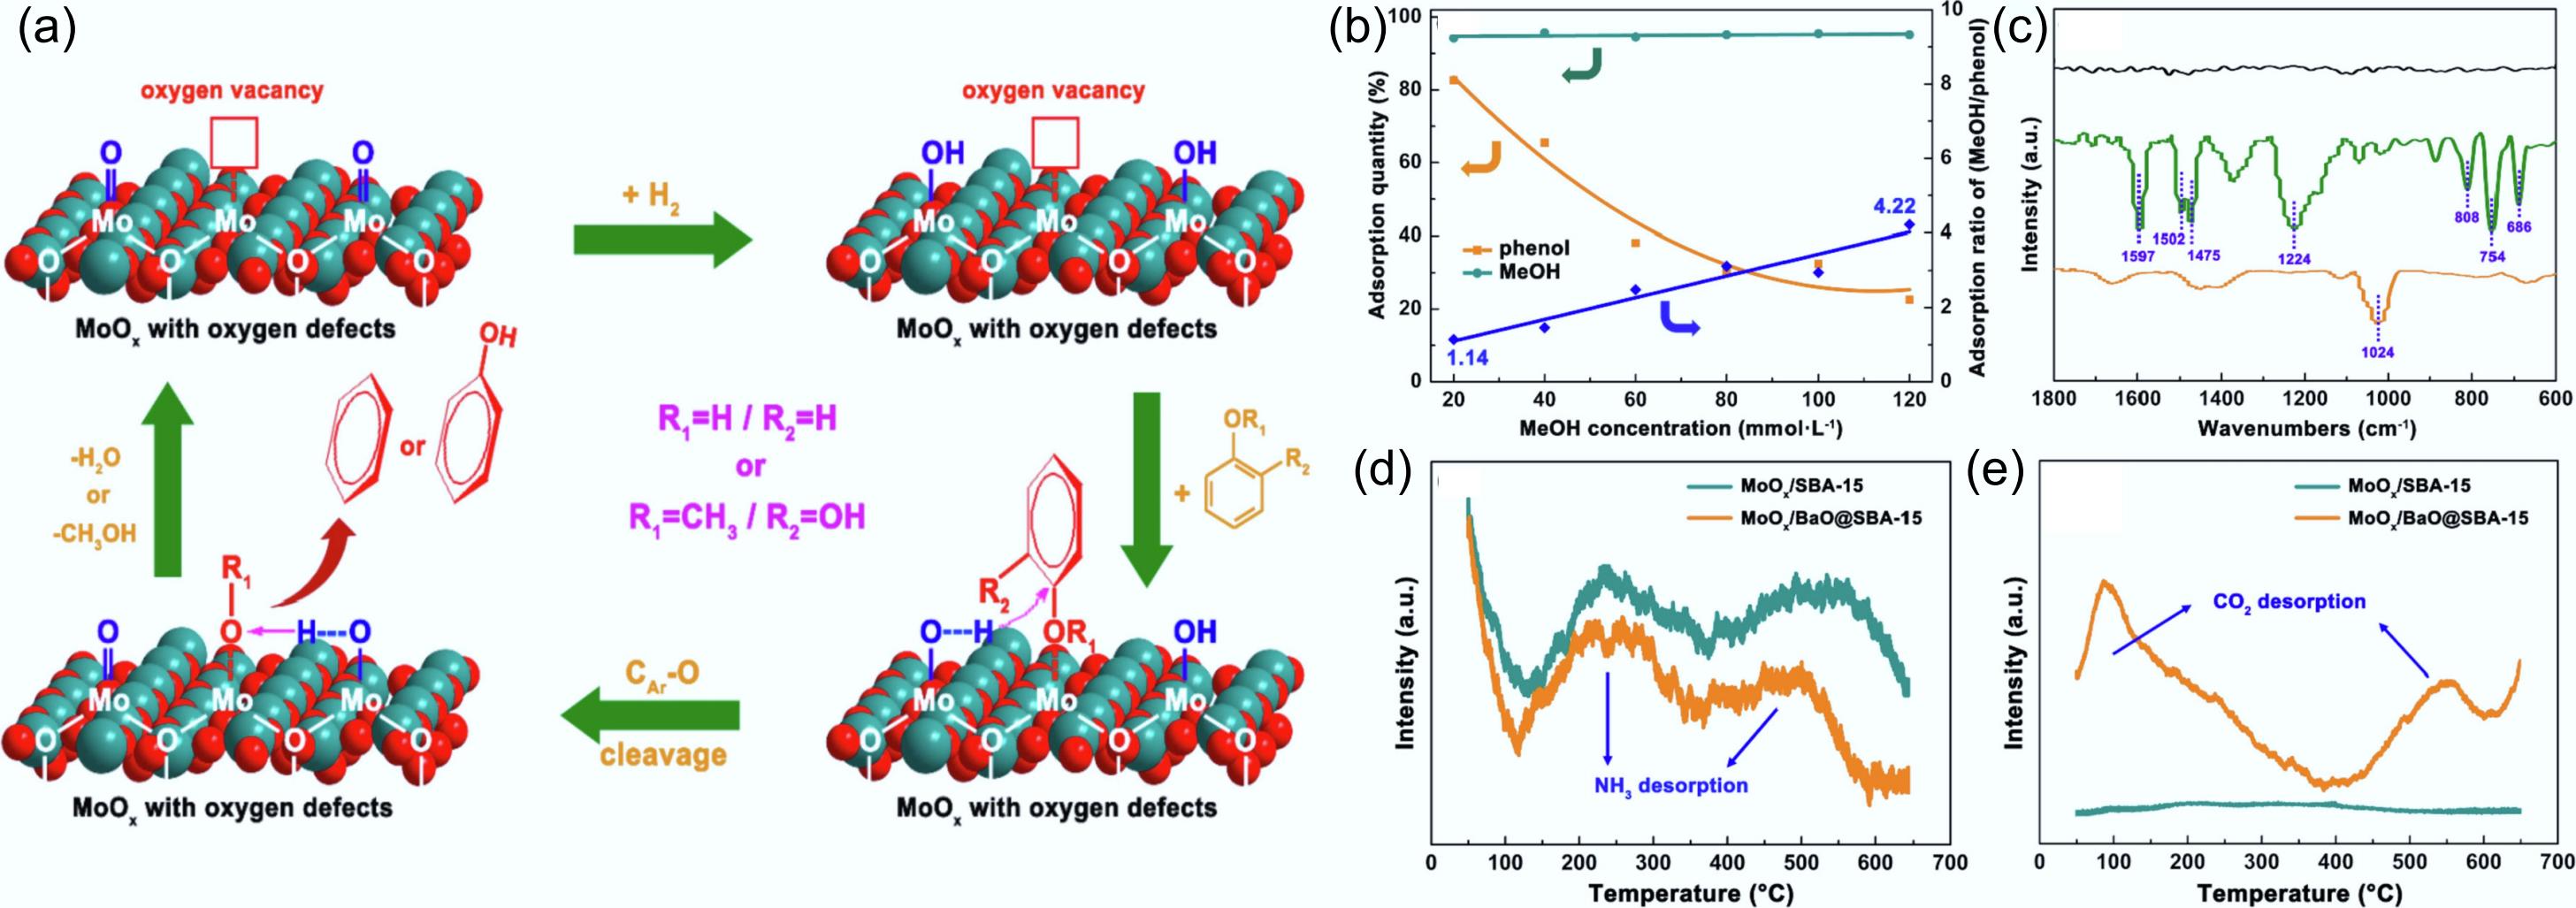
Figure 21.
(a) Postulated reaction mechanisms for phenolic compound hydrodeoxygenation catalyzed by activated MoOx/SBA-15 and MoOx/BaO@SBA-15. (b) Adsorption of phenol and methanol on activated MoOx/SBA-15 under varying methanol concentrations. (c) FT-IR spectra of activated MoO3 (black), activated MoO3 treated with phenol dissolved in 1,2,4-trimethylbenzene (green), and activated MoO3 treated with phenol dissolved in methanol (yellow). (d) NH3-TPD, and (e) CO2-TPD of MoOx/SBA-15 and MoOx/BaO@SBA-15. Reproduced with permission[140]. Copyright 2022, Elsevier.
-
Catalysts Reaction conditions Substrate Conv. (%) Products Sel. (%) Ref. T (°C) P (bar) Solvent FMoS2 300 30 decalin p-cresol 69.6 toluene 87.2 [48] SMoS2 300 30 decalin p-cresol 98.7 toluene 83.1 [48] Co-FMoS2 180 30 decalin p-cresol 21.0 toluene 98 [48] Co-SMoS2 180 30 decalin p-cresol 97.6 toluene 98.4 [48] CoS2/MoS2 220 30 dodecane p-cresol 58.9 toluene 95.2 [49] Co-Mo-S 220 30 dodecane p-cresol 88.5 toluene 97.4 [49] Mo0.06−Co9S8/Al2O3 265 40 − DPE 99.8 benzene 91 [50] Pt-Mo-200 120 50 − p-cresol 100 MCH 96.3 [51] Pd/m-MoO3−P2O5/SiO2 110 10 decalin phenol 100 cyclohexane 97.5 [52] Pt-WO3-x 230 30 n-hexane phenol 99 cyclohexane 94.3 [53] Ru/TNP 250 10 octane guaiacol 99.9 cyclohexane 100 [54] Ru/C-HPW 200 10 octane guaiacol 100 cyclohexane 92.1 [55] Ru@H-ZSM-5 150 50 water phenol 60 cyclohexane 51 [56] Pd-ZrO2 300 1 − m-cresol 14.7 toluene 87.9 [57] Pd-ZrO2 300 1 − phenol 77 benzene 66 [58] Pt-WOx/C 300 36 dodecane m-cresol 61 toluene 98 [59] Br-Ru/C 120 5 methanol DPE 99.8 benzene 44.7 [60] Ni-Co-NbOx 300 30 dodecane guaiacol 100 cyclohexane 98.9 [61] Fe-ZrO2 300 40 octane guaiacol 17.1 cyclohexane 0.4 [62] FeNi-ZrO2 300 40 octane guaiacol 100 cyclohexane 89.4 [62] Ni/SiO2 340 40 dodecane m-cresol 19.6 MCH 63.6 [63] Ni/ZrO2 340 40 dodecane m-cresol 18.2 MCH 56.8 [63] Ni2P/SiO2 340 40 dodecane m-cresol 20.2 MCH 62.9 [63] Ni2P/ZrO2 340 40 dodecane m-cresol 20.9 MCH 74.3 [63] Ni2P/SiO2 250 30 dodecane m-cresol 94.7 MCH 96.3 [64] Ni15Fe5/ZrO2 300 20 n-hexane p-cresol 98.1 MCH 68.7 [65] Ni15Co5/ZrO2 300 20 n-hexane p-cresol 100 toluene 34.9 [65] 5% Ni/SiO2 300 1 − m-cresol 95.6 toluene 67.6 [66] Ni-Mo/SiO2 350 1 − m-cresol 95 toluene > 80 [67] Table 1.
HDO of lignin-derived model compounds over heterogeneous catalysts
Figures
(21)
Tables
(1)